valuing liabilities in state and local plans
TRANSCRIPT

State and Local Pension Plans Number 11, June 2010
VALUING LIABILITIES IN STATE AND
LOCAL PLANS
By Alicia H. Munnell, Richard W. Kopcke, Jean-Pierre Aubry, and Laura Quinby*
*Alicia H. Munnell is director of the Center for Retirement Research at Boston College (CRR) and the Peter F. Drucker Professor of Management Sciences at Boston College’s Carroll School of Management. Richard W. Kopcke is a consultant for the CRR. Jean-Pierre Aubry and Laura Quinby are research associates at the CRR. The authors wish to thank Ian Lanoff and Michael Travaglini for helpful comments. They also wish to thank Beth Almeida for helpful comments, which she was generous enough to provide even though she disagrees with the premise of this brief.
Introduction
To measure the liability of a pension plan requires discounting a stream of promised future benefits to the present. For public sector plans, what discount rate to use in this calculation is a subject of great debate. State and local plans generally follow an actuarial model and discount their liabilities by the long-term yield on the assets held in the pension fund, roughly 8 percent. Most economists contend that the discount rate should reflect the risk associ-ated with the liabilities, and given that benefits are guaranteed under most state laws, the appropriate discount factor is a riskless rate, roughly 5 percent, as discussed below. Thus, the economists’ model would produce much higher liabilities than those currently
reported on the books of states and localities. The in-tensity of the debate is fueled by the assumption that the magnitude of the liabilities dictates the size of the funding contribution and even how the pension fund assets should be invested.
This brief attempts to separate the question of valuing liabilities from the questions of funding and investment. As background, it explains the current approach to valuing liabilities in the private and public sectors. Second, it discusses why, given their guaranteed status, state and local pension liabilities should be discounted at a riskless rate and shows how much measured liabilities would increase by applying such a rate. Third, it argues that valuing liabilities is only one factor entering the funding calculation, and that using a riskless discount rate does not necessarily mean that contributions should increase immediately.
LEARN MORE
Search for other publications on this topic at:crr.bc.edu
Center for Retirement Research2
In addition, it explains that selecting a discount rate and choosing whether or not to invest in risky bonds and equities are quite separate decisions. The conclu-sion is that whereas using a riskless rate instead of the assumed return on assets produces a very high measure of public pension liabilities, such a change does not have immediate implications for funding or investment. And adopting a riskless rate has clear advantages: it would accurately reflect the guaranteed nature of public sector benefits; it would increase the credibility of public sector accounting with private sector analysts; and it could well forestall unwise ben-efit increases when the stock market soars.
Current Approach to Valuing Liabilities
Valuing pension liabilities raises two questions. What should be included in liabilities? And what discount rate should be used to express those liabilities in today’s dollars? The answers differ for the public and private sectors.
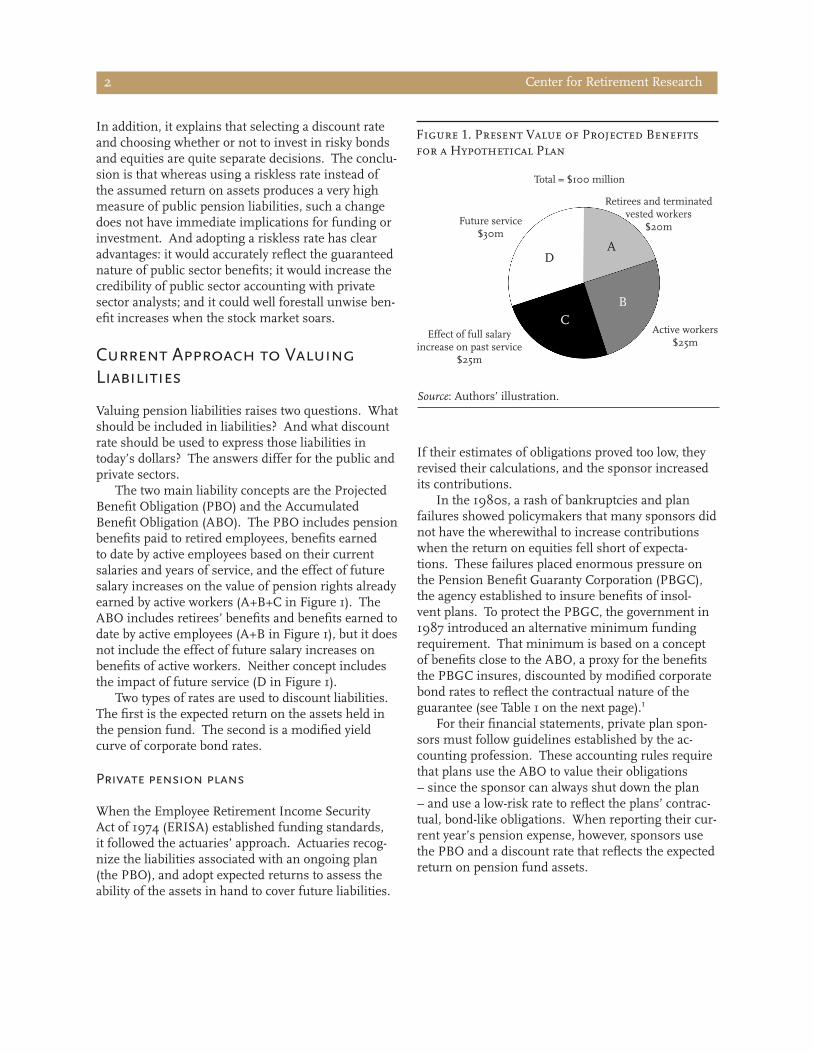
The two main liability concepts are the Projected Benefit Obligation (PBO) and the Accumulated Benefit Obligation (ABO). The PBO includes pension benefits paid to retired employees, benefits earned to date by active employees based on their current salaries and years of service, and the effect of future salary increases on the value of pension rights already earned by active workers (A+B+C in Figure 1). The ABO includes retirees’ benefits and benefits earned to date by active employees (A+B in Figure 1), but it does not include the effect of future salary increases on benefits of active workers. Neither concept includes the impact of future service (D in Figure 1).
Two types of rates are used to discount liabilities. The first is the expected return on the assets held in the pension fund. The second is a modified yield curve of corporate bond rates.
Private pension plans
When the Employee Retirement Income Security Act of 1974 (ERISA) established funding standards, it followed the actuaries’ approach. Actuaries recog-nize the liabilities associated with an ongoing plan (the PBO), and adopt expected returns to assess the ability of the assets in hand to cover future liabilities.
Figure 1. Present Value of Projected Benefits for a Hypothetical Plan
D
CB
AFuture service $30m
Retirees and terminated vested workers
$20m
Effect of full salary increase on past service
$25m
Active workers$25m
Total = $100 million
DA
CB
Source: Authors’ illustration.
If their estimates of obligations proved too low, they revised their calculations, and the sponsor increased its contributions.
In the 1980s, a rash of bankruptcies and plan failures showed policymakers that many sponsors did not have the wherewithal to increase contributions when the return on equities fell short of expecta-tions. These failures placed enormous pressure on the Pension Benefit Guaranty Corporation (PBGC), the agency established to insure benefits of insol-vent plans. To protect the PBGC, the government in 1987 introduced an alternative minimum funding requirement. That minimum is based on a concept of benefits close to the ABO, a proxy for the benefits the PBGC insures, discounted by modified corporate bond rates to reflect the contractual nature of the guarantee (see Table 1 on the next page).1
For their financial statements, private plan spon-sors must follow guidelines established by the ac-counting profession. These accounting rules require that plans use the ABO to value their obligations – since the sponsor can always shut down the plan – and use a low-risk rate to reflect the plans’ contrac-tual, bond-like obligations. When reporting their cur-rent year’s pension expense, however, sponsors use the PBO and a discount rate that reflects the expected return on pension fund assets.

Issue in Brief 3
Table 1. Approaches to Valuing Liabilities, 2009
Plan type/purpose Governing entity Liability concept Discount rate
Private plans
Funded status
Actuarial ERISA/IRC PBO Return on assets (7.4%)
Current liability2 ERISA/IRC ABO Corporate bond rate3 (5.6%)
Financial reporting
Expense SEC/FASB PBO Return on assets (7.4%)
Funded status SEC/FASB ABO Corporate bond rate4 (5.6%)
State and local plans
Funded status GASB PBO Return on assets (8.0%)
Financial reporting GASB PBO Return on assets (8.0%)
Sources: Governing entity and liability concepts for private plans are from American Academy of Actuaries (2004); FASB 87; and FASB 132(R). Funding data are authors’ estimates based on the historical relationships between rates reported in the U.S. Department of Labor’s Form 5500 Series (2000-2007) and those in Standard & Poor’s (2000-2009). Reporting data for private plans from Standard & Poor’s (2007). Reporting data for state and local plans are authors’ calculations from Center for Retirement Research at Boston College Public Pension Database (PPD), 2009.
State and local pension plans
In the public sector, the rules for both reporting and funding public pension plans are set out in Govern-ment Accounting Standards Board (GASB) State-ments 25 and 27. GASB defines liabilities in terms of the PBO. GASB 25 states that the discount rate should be based on “an estimated long-term yield for the plan, with consideration given to the nature and mix of current and planned investments... .”5
The use of the PBO seems appropriate for pension plans in the public sector. Benefits promised under a public plan are accorded a higher degree of protec-tion than those under a private sector plan because, under the laws of most states, the sponsor cannot close down the plan for current participants.6 That is, whereas ERISA protects benefits earned to date, employees hired under a public plan have the right to earn benefits as long as their employment continues.7 Thus, the PBO, which includes the effect of future salary increases on the value of pension rights already earned by active workers, seems like the correct mea-sure of liability.8
As shown in Figure 2, by 2020 the projected annual obligations behind the PBO for public plans are significantly greater than those behind the ABO, which makes no allowance for plans’ additional obli-gations resulting from rising salaries in the future.
Source: Authors’ calculations from CRR PPD (2009), vari-ous annual reports, and actuarial valuations.
The guaranteed nature of public plans’ benefits – because the sponsor cannot shut down the plan for current participants – also means that the obligations of public pension plans should be discounted at a riskless rate of interest, which typically is below the
Figure 2. Future Benefit Obligations for Current State/Local Retirees and Active Workers, 2010-2078
$0
$50
$100
$150
$200
$250
$300
$350
2010 2020 2030 2040 2050 2060 2070
Benefits earned to date
Benefits earned to date plus effect of future salary increases
Bill
ion
s

Center for Retirement Research4
Figure 3. Yield to Maturity Rates of Different Assets, 2000-2009
2000 2003 2006 2009
9%
6%
3%
0%
Average reported state and local discount rate
AAA corporate bond
Treasury bond, 30-year
State and local municipal bond, 30-year
Sources: U.S. Federal Reserve (2000-2009) and authors’ calculations from CRR PPD (2001-2009).
yields that plans expect to earn on their investments (see Figure 3). This discrepancy is the nub of the controversy.9
Valuing Liabilities in the Public Sector at the Riskless Rate
For sponsors, trustees, fiduciaries, or regulators who want to measure the funded status of a going con-cern that will meet its obligations, the riskless rate is the appropriate discount rate.10 Using the return on the plan’s assets, as GASB recommends, produces misleading results. The returns on the bonds and stocks in the pension fund include premiums to cover the risk of holding these assets. Discounting pension benefits using the expected yield on these securities implies that the entire yield is available to help pay future benefits, making no allowance for the cost of expected losses, which is represented by the risk premium. It also suggests that a rise in the risk premium improves a plan’s funded status.
Standard financial theory suggests that future streams of payment should be discounted at a rate that reflects their risk.11 In the case of state and lo-cal pension plans, the risk is the uncertainty about whether payments will need to be made. Since these benefits are protected under most state laws, the pay-ments are, as a practical matter, guaranteed. Conse-quently, to assess accurately the status of a plan as a
going concern that will meet its obligations warrants discounting its stream of future benefits by the risk-free interest rate.12
Just what rate best represents the riskless rate is a subject of debate. Researchers have laid out some general characteristics.13 The rate should reflect as little risk as the liabilities themselves, be based on fully taxable securities (because pension fund returns are not subject to tax), and not have a premium for liquidity (because most pension fund liabilities are long term and do not require liquidity).14 Among the interest rates quoted in financial markets, those on Treasury securities come the closest to reflecting the yield that investors require for getting a specific sum of money in the future free of risk. Currently, the yield on 30-year Treasury bonds, about 4 percent, is likely less than the riskless rate due to the valuable liquidity they offer investors.15 Therefore, we would suggest increasing the current rate by about one per-centage point and using a number of about 5 percent for 2009.16
Figure 4 shows what liabilities would look like under alternative liability concepts and interest rates. In 2009, the aggregate liability for the sample of 126 state and local plans in our database was $3.4 trillion, calculated under the guidance provided by GASB 25 – a PBO concept and a typical discount rate of 8 percent. Assets in 2009 for these sample plans were $2.7 trillion, yielding an unfunded liability of $0.7 trillion. Using a riskless discount rate of 5 percent raises public sector PBO liabilities to $4.9 trillion, which yields an unfunded liability of $2.2 trillion.
Figure 4. Aggregate State and Local Pension Liability under Alternative Discount Rate Assumptions, 2009
3.0
3.7
4.2
4.7
3.4
4.3
4.9
5.6
$0
$2
$4
$6
8% 6% 5% 4%
ABO
PBO
Trill
ion
s
Source: Authors’ calculations from CRR PPD.

Issue in Brief 5
Although the present value of plans’ promised benefits depends on the choice of the discount rate, the promised benefits themselves do not. When the teachers or firefighters retire, they will get the amount calculated under the plan provisions, and how that future amount is reported today has no impact on the ultimate payment. But the choice of discount rate does matter for measuring the funded status of pen-sion plans.
Implications of a Riskless Rate
Valuing pension liabilities using a riskless rate is of-ten thought to have a number of implications – some valid and some not.17 One valid implication is that such a change would probably affect the attitudes of government officials and taxpayers toward liberalizing plan provisions when plans appear to be more than fully funded. One less valid implication is that chang-ing the valuation of liabilities would necessarily have an enormous immediate impact on required annual contributions. And a totally invalid implication is that the selection of the discount rate has any implications for appropriate investments for public plans. The fol-lowing discusses each of these points in turn.
Plan design
Recognizing the riskless nature of state and local pen-sion liabilities could avoid the type of benefit liber-alizations that took place in the 1990s, when many state and local plans appeared to be overfunded. For example, in 1999, the California Public Employees’ Retirement System (CalPERS) reported that assets equaled 128 percent of liabilities, and the California legislature enhanced the benefits of both current and future employees. It reduced the retirement age, increased benefit accrual rates, and shortened the salary base for benefits to the final year’s salary.18 If CalPERS liabilities had been valued at the risk-less rate, the plan would have been only 88 percent funded.19 An accurate reporting of benefits to liabili-ties would avoid this type of expansion for current employees. Similarly, an accurate accounting of li-abilities would increase the incentive for politicians to make necessary changes in retirement ages and other provisions for new employees to reflect the fact that Americans are living longer and healthier lives.
Plan funding
It is generally agreed that each generation of taxpay-ers should pay the full cost of the public services it receives. If a worker’s compensation includes a defined benefit pension, the cost of the benefit earned in that year (the normal cost) should be recognized and funded, not deferred until the pension is paid in retirement.20 The discipline of making state and local governments pay the annual costs also discourages governments from awarding excessively generous pensions in lieu of current wages.21
Reducing the discount rate from about 8 percent to 5 percent would raise the present value of benefits and increase the employer’s normal cost from about 7 percent to about 15 percent of payroll (assuming the employer paid this full increment).22 Since payrolls account for about 28 percent of state and local bud-gets, in normal times, the increase would be signifi-cant, but manageable. Higher normal cost payments will ensure that adequate reserves are put aside for today’s workers.
States and localities also have unfunded pen-sion obligations because either 1) they did not put away money at the time the benefits were earned or provided benefits retroactively; or 2) the value of plans’ assets dropped unexpectedly. The cost of these unfunded liabilities also needs to be distributed in some equitable fashion. As discussed above, with no change in the amortization period, the adoption of a 5-percent discount rate would increase the unfunded liability from $0.7 trillion to $2.2 trillion and thereby substantially increase the required amortization payment. But, in reality, what would such a change mean? Under current circumstances, states and localities are not in any position to double or triple their contributions. Therefore, implementation of any change would have to wait until the economy and markets recover. Moreover, changing the discount rate would have to be considered by the community of actuaries, accountants, and sponsors in the context of other changes, such as perhaps extending the amortization period from 30 to 40 years.23 That is, an increase in the measure of the unfunded liability need not automatically translate into an immediate and intolerable increase in annual amortization pay-ments for states and localities.
Center for Retirement Research6
Plan investments
The choice of a discount rate for valuing liabilities does not limit the selection of a plan’s assets. This view conflicts with those who contend that not only should liabilities be discounted by the riskless rate, but also that public plans should not be invested in risky assets. They argue that higher assumed returns allow taxpayers today to make lower contributions. If the anticipated returns do not materialize, assets will be inadequate and future taxpayers will be on the hook to make up the difference.24 So proponents of this argument contend that plan sponsors should invest only in riskless assets.
The problem with this argument is that it assumes a most extreme degree of risk aversion. If sponsors of public plans were averse to all risk, they would require the pension funds to hold only Treasury secu-rities. But when sponsors are willing to take at least as much risk as the average investor, the premiums on bonds and stocks cover their cost of holding these investments.
If sponsors of public plans are more willing and able to bear risk than the average investor – because they are perpetual entities and have the power to tax – then the premiums on stocks and bonds will exceed the risk premiums they require. This “surplus” re-turn reduces taxpayers’ net cost of paying future pen-sion liabilities. That is, the value of stocks and bonds to the pension funds exceeds their market value by an amount reflecting the present value of this surplus return.25
While discounting pension funds’ liabilities by the expected returns on their portfolios overstates their funded status, measures that ignore the surplus return could understate their funded status. Nev-ertheless, a clear understanding of the status of a pension fund requires calculating the present value of liabilities using the riskless rate. It also requires the explicit assessment of surplus returns, consid-ering their size, timing, and risks. Plans can then adjust their funding strategies to reflect these surplus returns. One possible adjustment is to aim for less than 100-percent funding. The point here is that if pension funds hold only riskless assets, they cannot earn a surplus return.
Conclusion
The argument is compelling that the liabilities of pub-lic pension plans, which are guaranteed under state law, should be discounted by a rate that reflects their riskless nature. Such a change would produce a large number. Liabilities would rise from $3.4 trillion to $4.9 trillion, and with $2.7 trillion of assets on hand, unfunded liabilities would rise from $0.7 trillion to $2.2 trillion.
What difference does such a change make? First, a more realistic measure of the funded status of the plans would deter plans from offering more gener-ous benefits in response to supposed excess assets. Second, it would increase the required payment for normal costs, which would have an immediate, but manageable impact on the budgets of states and localities. In terms of the amortization payments, a change in the discount rate will increase the amount to be amortized, but the timing of the payments is a policy decision. Finally, discounting by a riskless rate does not imply that plans should hold only risk-less assets. Managers of state and local plans could continue to invest in equities and other risky assets. If the returns on these assets resemble their long-run historical performance, plans’ unfunded liabilities would be paid off more quickly than anticipated, as the gains on their assets exceed the returns on Trea-sury securities.
Resolving the discount-rate debate would increase the confidence of private sector observers in the re-ports of state and local pension funds.

Endnotes
1 The concept used by the PBGC is “current liabili-ties,” which differs from the ABO in two ways. First, it requires a specific mortality table and, second, it mandates that the discount rate be a four-year weighted average of the 30-year Treasury rate (McGill et al., 2010).
2 ERISA and the Internal Revenue Code (IRC) re-quire plan sponsors to report funding information to the Department of Labor, the PBGC, and the Internal Revenue Service (IRS); the agencies develop a joint report: Form 5500.
3 The IRS publishes interest rates, which, in the wake of the Pension Protection Act of 2006, consist of segment rates to reflect the timing of the plan’s liabilities. The numbers reported in the table are the weighted average for these segments.
4 Financial Accounting Standards Board (FASB) 87 allows plans to choose a discount rate from among several corporate bond measures.
5 Statement 25 is titled “Financial Reporting for De-fined Benefit Pension Plans and Note Disclosures for Defined Contribution Plans.” Statement 27 is titled “Accounting for Pensions by State and Local Govern-mental Employers.” The provisions of GASB 25 and 27 became effective June 15, 1996.
6 National Conference on Public Employee Retire-ment Systems (2010).
7 Steffen (2001). Assuming that employers are con-stitutionally barred from changing all benefit provi-sions slightly overstates the riskless nature of public liabilities, since some states and localities can alter the Cost-of-Living Adjustment (COLA) that they grant beneficiaries from year to year. However, a survey of the 126 plans in the CRR PPD shows that plans offer-ing ad hoc COLAs account for only 20 percent of ag-gregate accrued liability. Discounting ad hoc COLAs at 8 percent, rather than the risk-free rate, does not significantly alter the percent increase in liabilities.
8 This assessment differs from that of Brown and Wilcox (2009), Novy-Marx and Rauh (2009a), and Bulow (1982), who argue that the ABO is the pre-ferred concept because it puts pension accruals on the same basis as wages and salaries.
9 For more details, see Bronner (2008); Bader and Gold (2003); Gold and Latter (2008); Novy-Marx and Rauh (2009b); and Arnott (2005).
10 For example, regulators do not mark down the value of banks’ and insurance companies’ liabilities when risk premiums rise. To do so would overstate their solvency. This logic is behind Biggs’ (2010) use of options to measure plans’ funded status. The options formula discounts a plan’s obligations at the riskless rate.
11 In economics and finance, the analysis of choice under uncertainty identifies the discount rate for riskless payoffs with the riskless rate of interest. See Gollier (2001) and Luenberger (1997). This corre-spondence underlies much of the current theory and practice for the pricing of risky assets and the setting of risk premiums. See Sharpe, Alexander, and Bailey (2003); Bodie, Merton, and Cheeton (2008); and Ben-ninga (2008).
12 Such an approach has been adopted by other public or semi-public plans. The Ontario Teachers’ Pension Plan 2009 Report used a discount rate in the financial valuation of 4.6 percent, which was equal to the yield of long-term Government of Canada Real Return Bonds, plus 0.5 percent, plus the assumed in-flation rate. In the Netherlands, fair value accounting for defined benefit plans has replaced the traditional actuarial approach (Ponds and van Riel, 2007).
13 Brown and Wilcox (2009).
14 Novy-Marx and Rauh (2009a) employ a state-specific taxable municipal bond rate based on the zero coupon municipal bond curve. Their rationale is that states are equally likely to default on their pension obligations as on their other debt.
15 The 30-year Treasury constant maturity series was discontinued on February 18, 2002, and re-introduced on February 9, 2006.
16 A 5-percent rate is also consistent, for example, with a riskless real rate of 2.5 percent and an inflation rate of 2.5 percent.
17 In addition to the reasons discussed below, using a riskless rate may discourage the use of pension obligation bonds and reduce the incentive to invest in riskier assets to reduce the size of the liability.
Issue in Brief 7

18 CalPERS (2009).
19 It is possible that benefits could be constrained through other means. But a cursory search surfaced only one example: the Florida Retirement System. Despite being more than fully funded from 1998 through 2006, Florida succeeded in restraining ben-efit increases through statutory stabilization methods. Article X of the Florida constitution, passed in 1976, requires that any proposed benefit increase must be accompanied by actuarially sound funding provisions. The subsequent addition of Part VII of Chapter 112 of the Florida statutes stipulates that total contribu-tions must cover both the normal cost and an amount sufficient to amortize the unfunded liability over no more than 40 years. What is more, the combination of an employee’s pension and Social Security benefits cannot exceed 100 percent of final salary. As a result of this legislation, Florida has not increased benefits substantially since the late 1970s. See Peng (2009). 20 The Actuarial Standards Board’s Actuarial Stan-dard of Practice No. 4 provides guidance for measur-ing pension obligations and determining plans’ costs.
21 Johnson (1997) found that the relative generos-ity of state and local government pensions is directly related to the ability to underfund the plans.
22 Actuaries use a number of actuarial cost methods to allocate the portion of future benefit payments to each year for funding purposes, but this exercise simply calculates the present value of the additional lifetime benefit accrued to the current workforce by one more year of service.
23 Increasing the amortization period raises its own set of issues. For example, payments made roughly 40 years or more in the future add little to the present value of the payment stream. Moreover, such a long amortization period might not be viewed as a credible funding strategy by bond-rating agencies and others.
24 Bader and Gold (2003).
25 If, in the extreme, pension funds had no aversion to risk, their surplus return would equal the entire difference between the returns on risky assets and Treasury securities. Adding the present value of this surplus return to the funded status of a pension fund would produce nearly the same result as calculating the present value of its liabilities using the expected return on its portfolio.
Center for Retirement Research8
References
American American Academy of Actuaries, Pension Committee. 2004. “Fundamentals of Current Pen-sion Funding and Accounting for Private Sector Pension Plans.” Washington, DC.
Arnott, Robert D. 2005. “The Pension Problem: On Demographic Time Bombs and Odious Debt.” The Financial Analysts Journal November/December: 12-17.
Bader, Lawrence N. and Jeremy Gold. 2003. “Rein-venting Pension Actuarial Science.” Pension Forum January: 1-13.
Bader, Lawrence, and Jeremy Gold. 2007. “The Case Against Stock in Public Pension Funds.” Financial Analysts Journal 63(1): 55-62.
Benninga, Simon. 2008. Financial Modeling. Cam-bridge MA: MIT Press.
Biggs, Andrew. 2010. “An Options Pricing Method for Calculating the Market Price of Public Sector Pen-sion Liabilities.” Working Paper 164. Washington, DC: American Enterprise Institute.
Bodie, Zvi, Robert Merton, and David Cheeton. 2008. Financial Economics. Upper Saddle River, NJ: Pren-tice Hall, Inc.
Bronner, David. 2008. “Letter in Response to ASB Re-quest for Comments.” Submitted to the Actuarial Standards Board on behalf of 72 state and local re-tirement systems. Available at: http://www.nasra.org/resources/Public_Plans_Letter.pdf.
Brown, Jeffrey R. and David Wilcox. 2009. “Discount-
ing State and Local Pension Liabilities.” American Economic Review: Papers and Proceedings 99(2): 538-542.
Bulow, Jeremy I. 1982. “What Are Corporate Pension Liabilities?” The Quarterly Journal of Economics 97(3): 435-452.
CalPERS. 2009. “A History of CalPERS Benefits.” California Retirement Dialogue 2010. Sacramen-to, CA.

Issue in Brief 9
Center for Retirement Research at Boston College. Public Pension Database, 2001-2009. Chestnut Hill, MA.
Financial Accounting Standards Board. 1985 (Decem-ber). Statement No. 87: “Employers’ Accounting for Pensions.”
Financial Accounting Standards Board. 2003 (Decem-ber). Statement No. 132R: “ Employers’ Disclo-sures about Pensions and Other Postretirement Benefits.”
Gold, Jeremy and Gordon Latter. 2008. “Marking Public Pension Plan Liabilities to Market.” Pen-sion Finance Institute Working Paper.
Gollier, Christian. 2001. The Economics of Risk and Time. Cambridge, MA: MIT Press.
Governmental Accounting Standards Board. 1994 (November). Statement No. 25: “Financial Report-ing for Defined Benefit Pension Plans and Note Disclosures for Defined Contribution Plans.”
Governmental Accounting Standards Board. 1994 (November). Statement No. 27: “Accounting for Pensions by State and Local Government Employees.”
Johnson, Richard W. 1997. “Pension Underfunding and Liberal Retirement Benefits of State and Local Government Workers.” National Tax Journal 50(1): 113-142.
Luenberger, David G. 1997. Investment Science. Oxford: Oxford University Press.
McGill, Dan M., Kyle N. Brown, John J. Haley, Syl-vester J. Schieber, and Mark Warshawsky. 2010. Fundamentals of Private Pensions, Ninth Edition. Oxford: Oxford University Press.
Mumy, Gene, Robert Novy-Marx, and Joshua D. Rauh. 2008. “Intergenerational Transfer of Public Pen-sion Promises.” Working Paper 14343. Cambridge, MA: National Bureau of Economic Research.
National Conference on Public Employee Retirement Systems (NCPERS). 2010. “State Protections for Retirement Benefits.” Available at: http://www.ncpers.org/ResourceCenter/Overview.asp.
Novy-Marx, Robert and Joshua D. Rauh. 2009a. “Public Pension Promises: How Big Are They and What Are They Worth?” Working Paper. Evanston, IL: Northwestern University, Kellogg School of Management. Available at: http://papers.ssrn.com/sol3/papers.cfm?abstract_id=1352608.
Novy-Marx, Robert and Joshua D. Rauh. 2009b. “The Liabilities and Risks of State-Sponsored Pension Plans.” Journal of Economic Perspectives (23)4: 191-210.
Ontario Teachers’ Pension Plan. 2009. “Taking Care of Business: 2009 Annual Report.”
Peng, Jun. 2009. State and Local Pension Fund Management. Auerbach Publications.
Ponds, Eduard H. M. and Bart van Riel. 2007. “The Recent Evolution of Pension Funds in the Neth-erlands: The Trend to Hybrid DB-DC Plans and Beyond.” Working Paper 2007-9. Chestnut Hill, MA: Center for Retirement Research at Boston College.
Sharpe, William, Gordon J. Alexander, and Jeffrey W. Bailey. 2003. Investments. Upper Saddle River, NJ: Prentice Hall, Inc.
Standard & Poor’s. 2000-2009. Compustat data. Ac-cessed through Wharton Research Data Services.
Steffen, Karen. 2001. “State Employee Pension Plans.” In Pensions in the Public Sector, 41-65. Philadelphia, PA: Pension Research Council.
U.S. Department of Labor, Employee Benefits Secu-rity Administration, Office of Participant Assis-tance. 2000-2007. Annual Return/Report Form 5500 Series for Plan Year 2000-2007. Washington, DC: U.S. Government Printing Office.

APPENDIX

Appendix A. Methodology for Changing the Discount Rate and Moving from PBO to ABO
To convert the PBO liability reported in plans’ annual reports to an ABO liability and to change the discount rate assumption, we set up a model that projects the level of currently accrued benefits that state and local em-ployers will need to pay in the future. To do this, we calculate expected accrued benefits for both active workers and retirees. The accrued benefit is a function of a worker’s salary and accrued service:
E(accrued benefit) = f(service, salary)
Accrued service depends on age, and salary depends on either age alone or age and projected total service, depending on whether the liability being calculated is an ABO or a PBO. Using age-service-salary matrices provided in the 2009 annual reports and actuarial valuations of the 10 largest pension plans, we are able to de-termine both the average accrued service of active employees in different age brackets and their average current salaries. The ABO equals:
E(accrued benefitABO
) = 2.5% * accrued service * current salary
following the benefit formula used by most state and local pension plans. Converting this ABO to a PBO requires assumptions about future salary growth. Plans’ annual reports provide projections of future wage growth for active employees of different ages as well as separation probabilities. The formula for expected termination salary thus becomes:
current wage probability of remaining a E(termination salary) = * ^(years until retirement * )salary growth public employee until retirement
The PBO can be calculated as:
E(benefitPBO
) = 2.5% * accrued service * termination salary
Each individual’s expected benefit is multiplied by the number of active employees in each age bracket to get an aggregate yearly benefit that is paid by the employer from the year the employee retires until death.
Retired workers are treated slightly differently than actives. Based on the CRR Public Pension Database (PPD), we know the total level of benefits paid to retired employees in 2009 and the proportion of those ben-efits owed to retirees of different ages. We therefore assume that the aggregate yearly level of benefits received by each age group in 2009 is that group’s aggregate expected yearly benefit.
The active and retiree benefits are further enhanced by a 3-percent Cost-Of-Living Adjustment (COLA) each year. Finally, we use the RP2000 mortality table used by most state and local plans to reduce the aggregate benefit paid by employers each year by the probability that all the retirees of each age are still alive in that year.
The result is a nominal stream of payments owed by state and local employers to current employees and retirees. The PBO stream is normalized so that, discounted at plans’ assumed investment return rate of 8 per-cent, it equals the reported 2009 aggregate liability of the 126 plans in the CRR PPD. The ABO stream is simi-larly adjusted. With this model, we can change the discount rate of the liability by “re-inflating” the normalized stream of benefits by an 8 percent interest rate, and then re-discounting it using a different yield curve.
Issue in Brief 11

About the CenterThe Center for Retirement Research at Boston Col-lege was established in 1998 through a grant from the Social Security Administration. The Center’s mission is to produce first-class research and forge a strong link between the academic community and decision-makers in the public and private sectors around an issue of critical importance to the nation’s future. To achieve this mission, the Center sponsors a wide variety of research projects, transmits new findings to a broad audience, trains new scholars, and broadens access to valuable data sources. Since its inception, the Center has established a reputation as an authori-tative source of information on all major aspects of the retirement income debate.
Affiliated InstitutionsAmerican Enterprise InstituteThe Brookings InstitutionMassachusetts Institute of TechnologySyracuse UniversityUrban Institute
Contact InformationCenter for Retirement ResearchBoston CollegeHovey House140 Commonwealth AvenueChestnut Hill, MA 02467-3808Phone: (617) 552-1762Fax: (617) 552-0191E-mail: [email protected]: http://crr.bc.edu
© 2010, by Trustees of Boston College, Center for Retirement Research. All rights reserved. Short sections of text, not to exceed two paragraphs, may be quoted without explicit permission provided that the authors are identified and full credit, including copyright notice, is given to Trustees of Boston College, Center for Retirement Research.
The CRR gratefully acknowledges the Center for State and Local Government Excellence for its support of this research. The Center for State and Local Government Excel-lence (http://www.slge.org) is a proud partner in seeking retirement security for public sector employees, part of its mission to attract and retain talented individuals to public service. The opinions and conclusions expressed in this brief are solely those of the authors and do not represent the opinions or policy of the CRR or the Center for State and Local Government Excellence.
crr.bc.edu
Center for Retirement Research12