values, beliefs and economic behaviors: a a comparative...
TRANSCRIPT

Carlos Pestana Barros & Nicolas Peypoch
A Comparative Analysis of Productivity Change in Italian and Portuguese Airports
WP 006/2007/DE _________________________________________________________
João Carlos Graça, João Carlos Lopes & Cláudia Niza
Values, beliefs and economic behaviors: a regional approach
WP 25/2013/DE/UECE/SOCIUS/ADVANCE _________________________________________________________
Department of Economics
WORKING PAPERS
ISSN Nº 0874-4548
School of Economics and Management TECHNICAL UNIVERSITY OF LISBON

1
Values, beliefs and economic behaviors: a regional approach
João Carlos Graça*, João Carlos Lopes** and Cláudia Niza***
* ISEG, Lisboa University (UL) and Centro de Investigação em Sociologia Económica e das
Organizações (SOCIUS)
** ISEG, Lisboa University (UL) and Research Unit on Complexity and Economics (UECE)
*** London School of Economics (LSE) (PhD) and Centro de Investigação Avançada em Gestão
(ADVANCE) (Bolseira)
Abstract. The purpose of this paper is to identify relationships between value orientations, beliefs and economic behaviors of agents, on one side, and differences between levels of economic development, on the other. Empirical analysis is based on a sample of Portuguese municipalities and correspondent parishes, organized in groups set by an urban-versus-rural typology and according to levels of development as measured by GDP per capita. Different value orientations, beliefs and behaviors were identified. Four clusters were thereby considered, generically correspondent to “stabilization”, “economic nationalism”, “entrepreneurship” and “consumerism”. These clusters are related to the spatial dimensions considered. Keywords: Values, beliefs, economic behaviors, Portuguese regions.
2
1. Introduction
The main purpose of this paper is to identify relationships between value orientations, beliefs and
economic behaviors of agents, on one side, and differences between levels of economic
development, on the other.
The empirical analysis is based on a sample of Portuguese municipalities and correspondent
parishes, organized in groups set by an urban-versus-rural typology and according to levels of
development as measured by GDP per capita.
Different value orientations, beliefs and behaviors were identified according to mostly either
supply-side or demand-side, as well as predominantly State versus Private Sector orientations.
Four clusters were thereby considered, that we generically named as corresponding to
“stabilization”, “economic nationalism”, “entrepreneurship” and “consumerism”. These clusters
are related to the spatial dimensions considered. Parishes named “rural”, “rural-urban” and “urban”
have shown, albeit in a small degree, a prevailing orientation to the State, whereas “developing”
parishes lean to private sector. Rural parishes are markedly consumerist, whereas in those said
“rural-urban” supply-side orientation prevails. Both “urban” and “developing” (correspondent to
zones going through big recent changes) occupy, in this context, an intermediate position.
Using various empirical techniques, namely descriptive statistics, principal component analysis,
econometrics (GMM), etc., an in-depth study of values, attitudes and behaviors is made based on
a significant and detailed sample of Portuguese population. This work can be an important
instrument of analysis and decision support for the implementation of regional policies.
2. Methodology
The methodology for data gathering was based on a classification combining a set of four
indicators: 1) rural condition; 2) accessibility to goods and services; 3) income and modernity; 4)
activity level and renovation. With these indicators, based on indexes proposed by Pereira et al
(2008), a cluster analysis was made classifying all the Portuguese parishes (4.037) as belonging to
one of four distinct clusters.

3
The four indicators aforementioned allowed the construction of four statistical indexes based on
the geographical characterization of each parish (regarding the “rural condition” and the
“accessibility to goods and services”) and operating also at the level of municipalities’ membership
(resulting from these two indexes of “economic contextualization”, named as index of “income
and modernity” and index of “activity and renovation”).
After systematically collecting data corresponding to the territorial units, each of the indexes was
build using factor analysis techniques. All these indexes confirm the existence of a largely
heterogeneous territory in terms of dimension of rurality, accessibility and economic context. After
identifying the homogeneous parishes, according to these criteria, a cluster analysis was operated,
applying to a sample representative of Mainland Portugal.
2.1 Municipalities’ analysis / Classification of parishes
The starting point for the cluster analysis was a classification of Portuguese parishes according
with the four indicators previously mentioned: rurality, accessibility to goods and services,
income-and-modernity, activity-and-renovation. Each parish has therefore one particular value for
each one of these indicators. The cluster analysis performed suggests the existence of four distinct
clusters. The final result, with the description of the content and profile of each cluster, as well as
the number of parishes by cluster, is presented in Figure 1.
< Figure 1 about here >
The cluster analysis was made at the parish level, as at the municipal level the results were not
statistically robust. Consequently, it was based on the results stemming from parishes that the
municipalities were indirectly grouped. The results, with a confidence level of 95% and a sample
error of 7%, are presented in Table 1.
< Table 1 about here >
The municipalities were studied as regards their parishes’ distribution and number of parishes by
cluster. This way we know how many parishes each municipality has in each cluster. Therefore,

4
we are able to identify those that are the more homogeneous municipalities by cluster, that is to
say, with the correspondent parishes more concentrated in just one cluster. Besides, this
categorization allows an estimation of resident population in each cluster.
At this stage, it was not considered the homogeneity of municipalities but only which of them
would correspond to each cluster, in order to allow us an approximation to total population. The
data concerning population by municipality were obtained from INE (2007). Using this procedure,
we have sufficient and adequate data for specifying our sample. The calculations made point to a
sample adequate dimension of 1.000 individuals for Inland Portugal: for a confidence level of
95%, a sample error of 3,1% and a Z value of 1,96, we obtained a sample dimension of 999.
We had to select 187 parishes distributed by the aforementioned clusters. Given the estimative of
population by cluster (B) and the correspondence of this value in the sample (C), it is possible to
calculate the number of individuals by parish (see Table 2).
< Table 2 about here >
Given the small number of parishes to select in clusters 2, 3 and 4, it is imperative to operate in
our final analysis at the municipality level. Since the absolute values to collect in each parish are
below 30, we must work with, respectively, 2 parishes by municipality in Cluster 1, 6 parishes by
municipality in Cluster 2, 15 parishes by municipality in Cluster 3 and 8 parishes by municipality
in Cluster 4 (Column F). Dividing the column D values by these values we obtain the number of
municipalities of the sample of column G. For a representative sample of 187 parishes we have
then a final sample of 30 municipalities. The numbers in the table are not exact but approximate,
in order to simplify the calculations.
The data collection by this procedure will be more rich and exact because we will exclude from
the municipalities the parishes that are not truly “characteristic” of that municipality, since they
are located in another cluster. We start with a representative sample of parishes which results in a
further aggregation of municipalities.

5
2.2 Selection of the municipalities to be questioned
According with Table 2, Column G, we need 10 municipalities in Clusters 1 and 2, and 5
municipalities in Clusters 3 and 4. For the final selection we use the information about the parishes’
distribution, now in order to:
1. Choose the most “homogeneous” municipalities by cluster; and
2. Try to obtain municipalities from all the clusters in all the major regions of the country,
whenever possible.
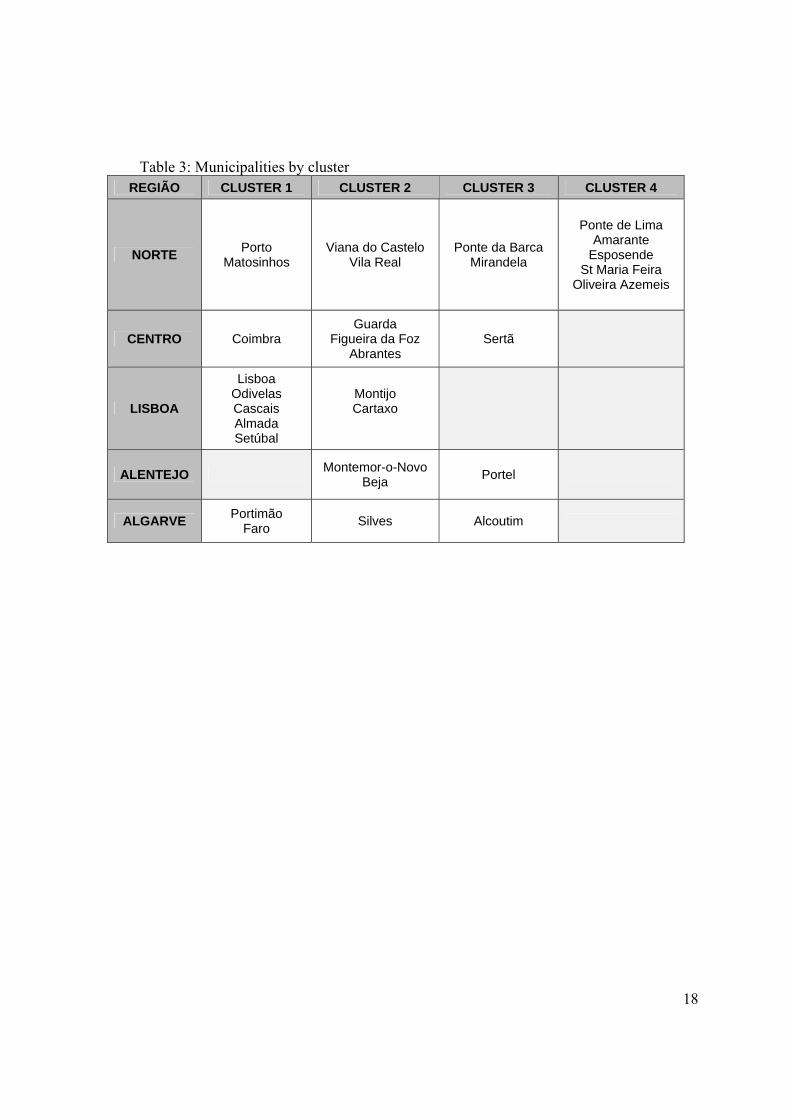
In Table 3 we have the distribution of municipalities by cluster, which constitutes the reference for
the choice of parishes.
< Table 3 about here >
This was one possible and viable selection, respecting all the defined criteria. Within these
municipalities, parishes were chosen to be considered based on the fact of their corresponding to
the cluster to which the municipality belongs and in the number (column F) presented at Table 2.
The aim of the adoption of this methodology was to allow us to proceed with the collection of data
in a systematic way. After the selection of municipalities in which to implement the questionnaire,
the field work occurred between April and September 2009. On the whole, 949 individuals
participated in filling the questionnaire, divided by municipalities and clusters according with the
results presented in Table 4.
< Table 4 about here >
In each municipality an average of 32 questionnaires were launched, with a minimum of 24 in Vila
Real and a maximum of 41 in Almada and Cascais. The distribution of individuals by municipality
is presented in Table 5.
< Table 5 about here >
6
The sample is composed by 593 females (64%) e 333 males (36%). The participants’ minimum
age is 16 years and the maximum 84, with an average value of 34 years (Standard Deviation equal
to 11.9).
3. Values, beliefs and economic behaviors
The purpose of this analysis was to provide a contribution to the understanding of how psycho-
sociological factors impact on economic life. Values and beliefs are cognitive components
essential in the formation of the relationships of individuals with the economy, even though the
influence of these cognitive components on the economic behavior (specifically regarding saving,
credit and investments) has not yet been fully clarified.
The economic beliefs have been associated with pathological behaviors regarding money (see,
concerning this, Furnham, 1996; 1997) and with the support for different human values (see
Heaven, 2001). In Bastounis et al (2004) data was collected from eight countries and it was shown
that the “control locus” (that is to say, the attribution of the causality of events to individuals’
external or internal causes) is related to the economic values supported: in synthesis, it can be said
that the external “control locus” is mostly related to the absence of trust on firms and to protest
against the unfair treatment of workers.
In this context, we aim at:
(1) Studying the structure of economic values in a Portuguese sample;
(2) Describing the beliefs of Portuguese citizens as regards the functioning of the economy;
(3) Identifying the prevalence of saving, credit, demand and investment behaviors;
(4) Understanding the connection between values, beliefs and economic behaviors.
3.1 Economic values
Regarding economic values, we adopted the Scale of Economic Values of O’Brien and Ingels (for
more details about this scale, see O’Brien et al, 1987), initially developed in the United States and
having afterwards been applied with adaptations in several countries.
7
A study of Principal Component Analysis (PCA) has in our case uncovered a structure
considerably different from the one originally defined by these authors, suggesting that the
common ideas about economics are much different in Portugal and the USA.
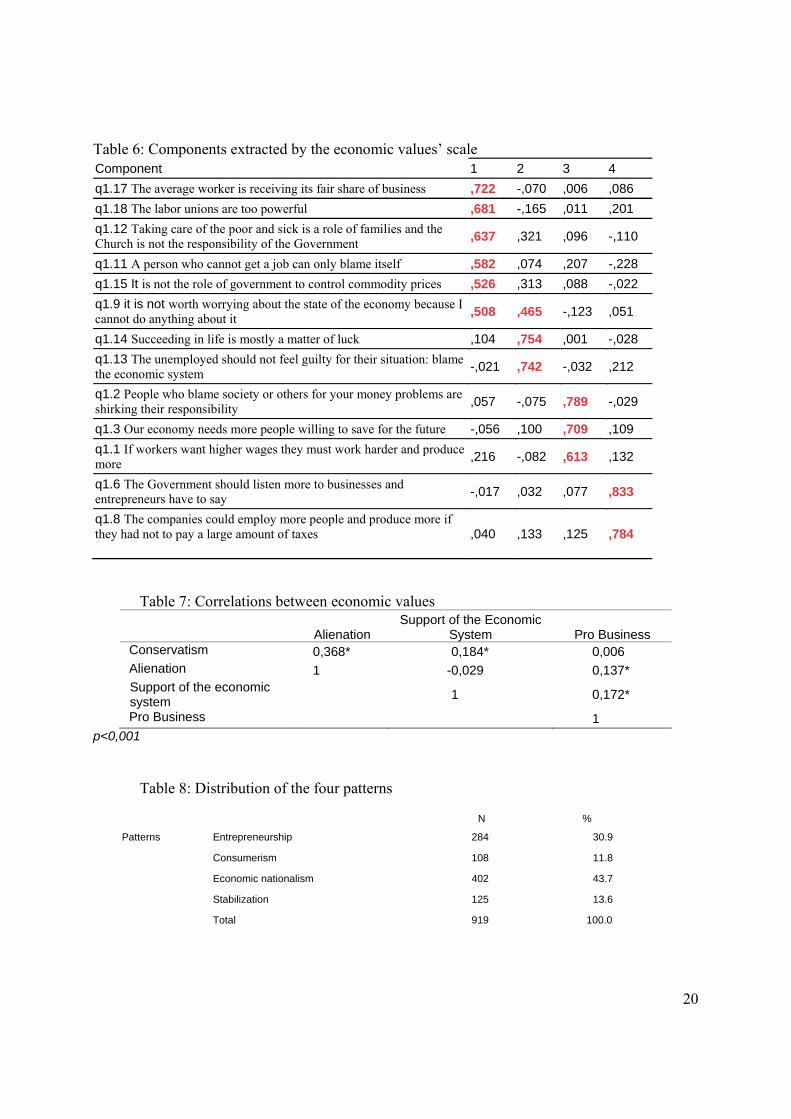
Four components were extracted [Sphericity test of Bartlett=1397.943, p<.05, Kaiser-Meyer-Olkin
.723 p<.05; Minimum communality .382], explaining a total variance of 54.2%. These components
are: 1) Conservatism, 2) Alienation, 3) Support of the economic system and 4) Pro-Business
leaning. The composition of these components is presented in Table 6.
< Table 6 about here >
Based the correlation analysis, one of the main conclusions is that Conservatism values are
strongly connected with Alienation, and also with Support of the economic system, but at a lower
scale. Alienation is also positively correlated with Pro-Business values as well as the Support of
the economic system (see Table 7).
< Table 7 about here >
3.2 Economic beliefs
With the purpose of studying the economic beliefs of Portuguese citizens, we used the scale
proposed in Leiser and Briskman-Mazliach (1996) about the common understanding of the
functioning of the Economy. This scale measures in multiple choice answers the explanations
given by participants about the unemployment-inflation trade-off, the causal factors being
attributed either to the individuals, the firms or the State. A descriptive analysis of the reported
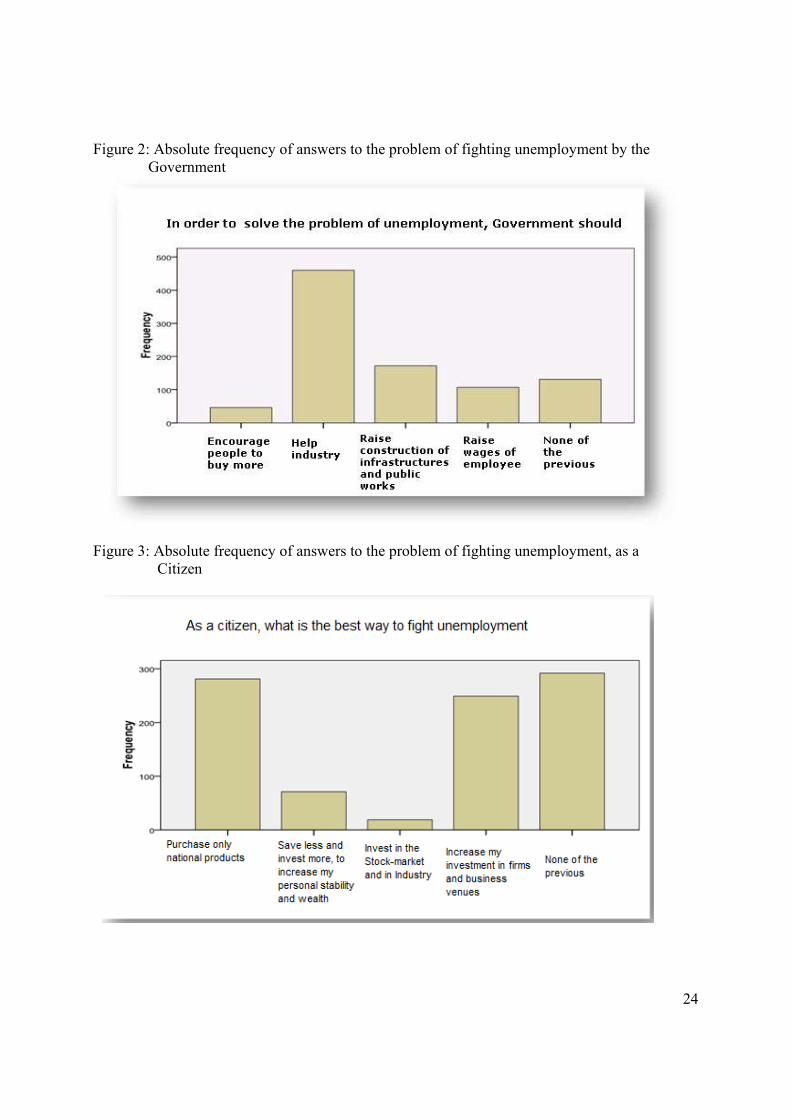
beliefs is presented, in synthesis, in Figures 2 to 6.
< Figures 2 to 6 about here >
Therefore, the majority of respondents think that, in order to mitigate the unemployment problem,
Government should help the firms, the citizens should buy only domestic products and the
investment of firms should be increased. On the other hand, the majority considers that saving has
not an impact on unemployment. The best strategy to fight inflation is, according to the majority
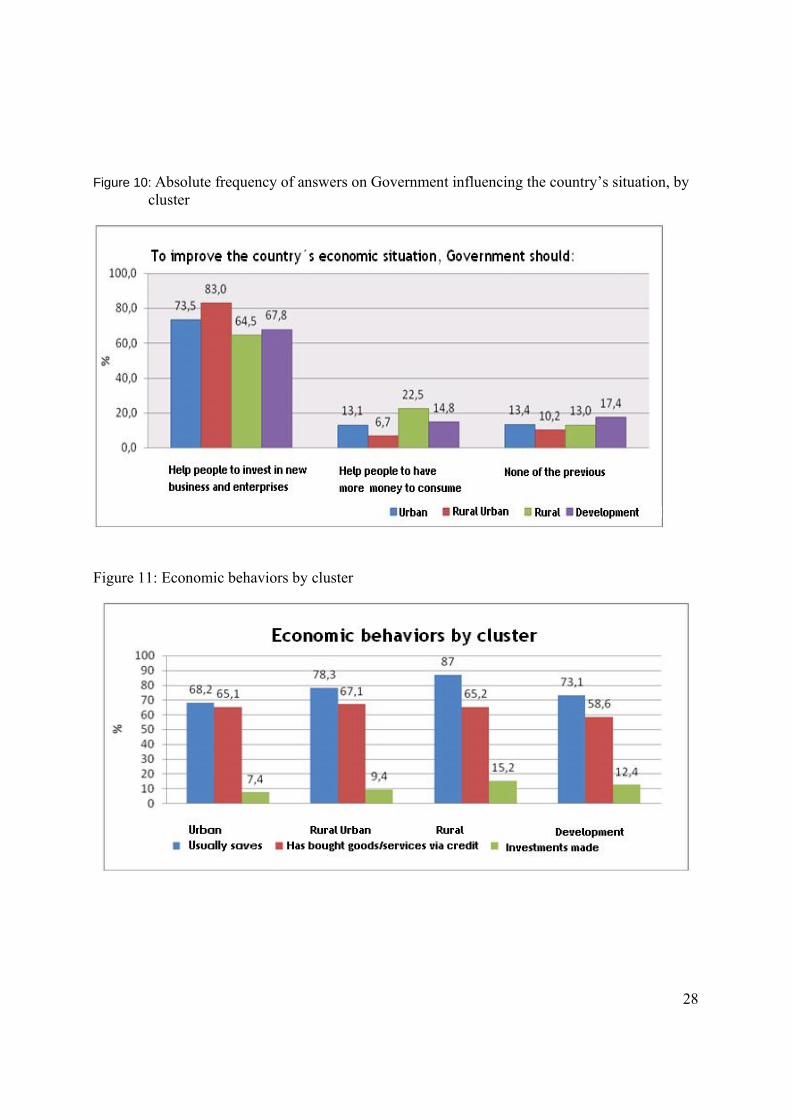
8
of respondents, to lower the interest rate, which may indeed be also considered a clear indication
of economic illiteracy. Finally, the respondents agree with the idea that the government should
help people investing in new businesses in order to improve the economic situation of the country.
In what regards the whole set of these five aspects, it is useful to consider each of the identified
clusters per se. The analysis of the individuals’ economic beliefs by cluster reveals the existence
of some significant differences. Although there are no differences about either how the government
should solve the unemployment problem (χ2=15.777, p>.05) or about the causes of inflation
(χ2=14.719, p>.05), there are differences across clusters about the way citizens should contribute
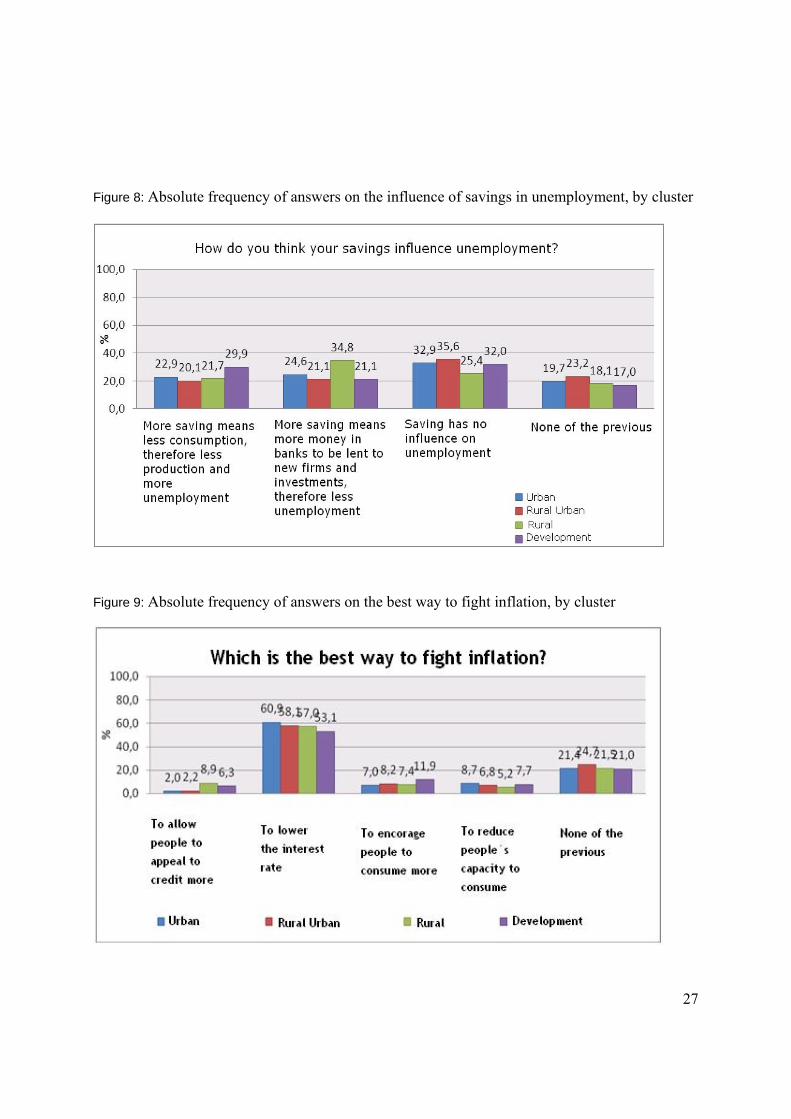
to lower unemployment (χ2=30.669, p=.002), about how savings influence unemployment
(χ2=17.614, p=0.04), about how to avoid inflation (χ2=23.537, p=.023) and about how the
government should improve the economic situation of the country (χ2=28.250, p<.05) (see Figures
7 to 10).
< Figures 7 to 10 about here >
The urban-rural cluster has the participants that are less inclined to invest on their personal wealth
and more inclined to investment in businesses as an instrument to fight unemployment. In what
concerns the way how savings affect unemployment, development cluster’s participants consider
mainly that more saving increases unemployment, while rural cluster’s members find that more
saving diminishes unemployment.
In order to avoid inflation, individuals of rural cluster consider more than others that persons
should be able to have more easy access to credit, but in the so-called development cluster the
opinions are more supportive of the idea of consuming more. Last, but not least, rural-urban
members are those more agreeing that government should help people investing with the aim of
improving the financial situation of the country.
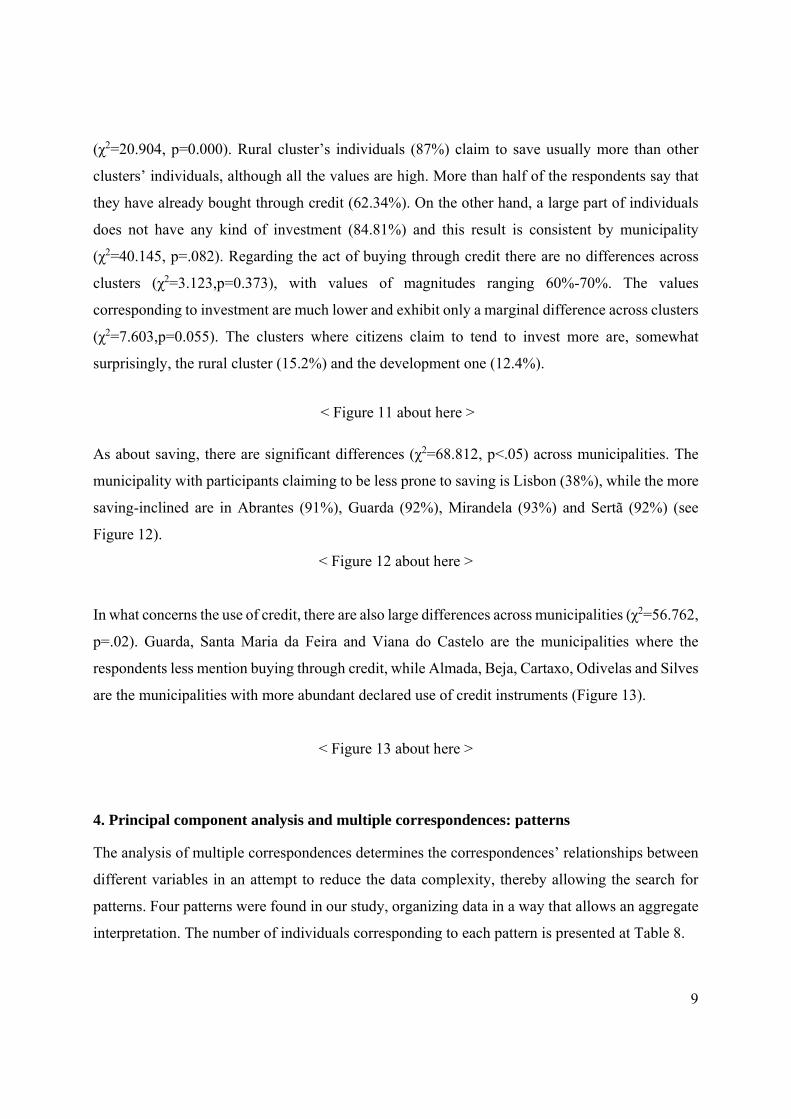
Regarding economic behaviors (Figure 11), the main conclusion is that the majority of respondents
claim to save (71.84%) There are differences by cluster concerning the experiences of saving
9
(χ2=20.904, p=0.000). Rural cluster’s individuals (87%) claim to save usually more than other
clusters’ individuals, although all the values are high. More than half of the respondents say that
they have already bought through credit (62.34%). On the other hand, a large part of individuals
does not have any kind of investment (84.81%) and this result is consistent by municipality
(χ2=40.145, p=.082). Regarding the act of buying through credit there are no differences across
clusters (χ2=3.123,p=0.373), with values of magnitudes ranging 60%-70%. The values
corresponding to investment are much lower and exhibit only a marginal difference across clusters
(χ2=7.603,p=0.055). The clusters where citizens claim to tend to invest more are, somewhat
surprisingly, the rural cluster (15.2%) and the development one (12.4%).
< Figure 11 about here >
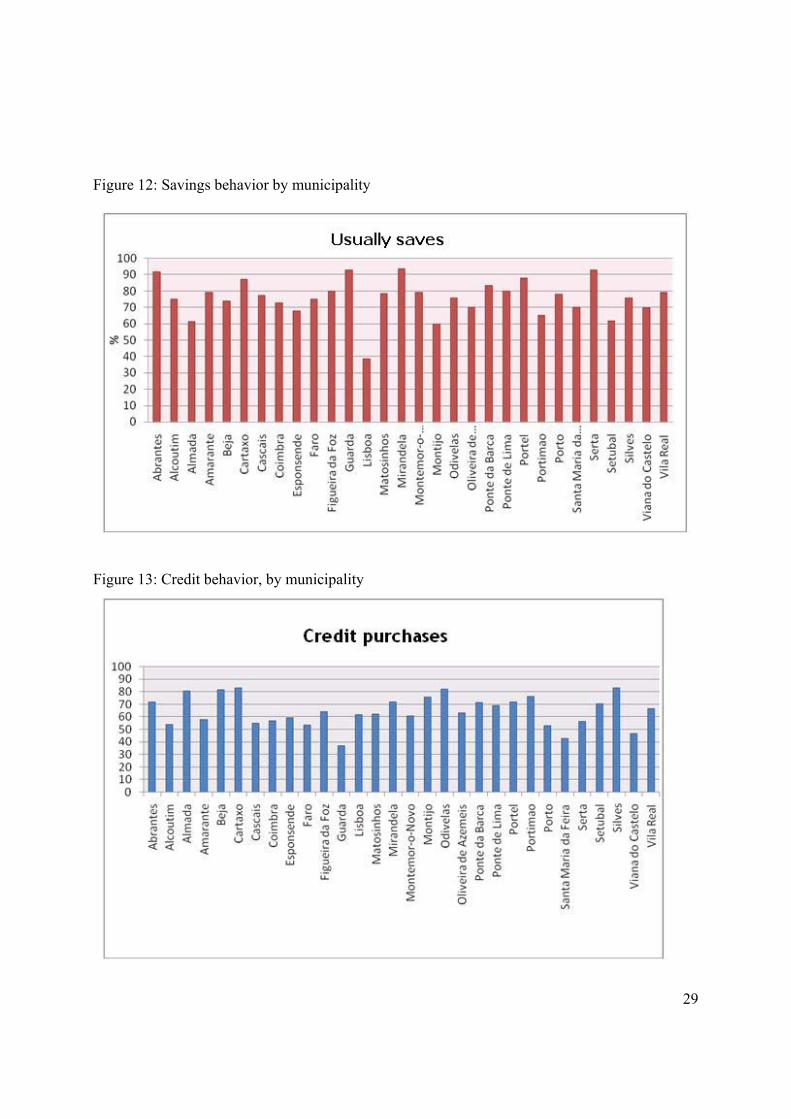
As about saving, there are significant differences (χ2=68.812, p<.05) across municipalities. The
municipality with participants claiming to be less prone to saving is Lisbon (38%), while the more
saving-inclined are in Abrantes (91%), Guarda (92%), Mirandela (93%) and Sertã (92%) (see
Figure 12).
< Figure 12 about here >
In what concerns the use of credit, there are also large differences across municipalities (χ2=56.762,
p=.02). Guarda, Santa Maria da Feira and Viana do Castelo are the municipalities where the
respondents less mention buying through credit, while Almada, Beja, Cartaxo, Odivelas and Silves
are the municipalities with more abundant declared use of credit instruments (Figure 13).
< Figure 13 about here >
4. Principal component analysis and multiple correspondences: patterns The analysis of multiple correspondences determines the correspondences’ relationships between
different variables in an attempt to reduce the data complexity, thereby allowing the search for
patterns. Four patterns were found in our study, organizing data in a way that allows an aggregate
interpretation. The number of individuals corresponding to each pattern is presented at Table 8.
10
< Table 8 about here >
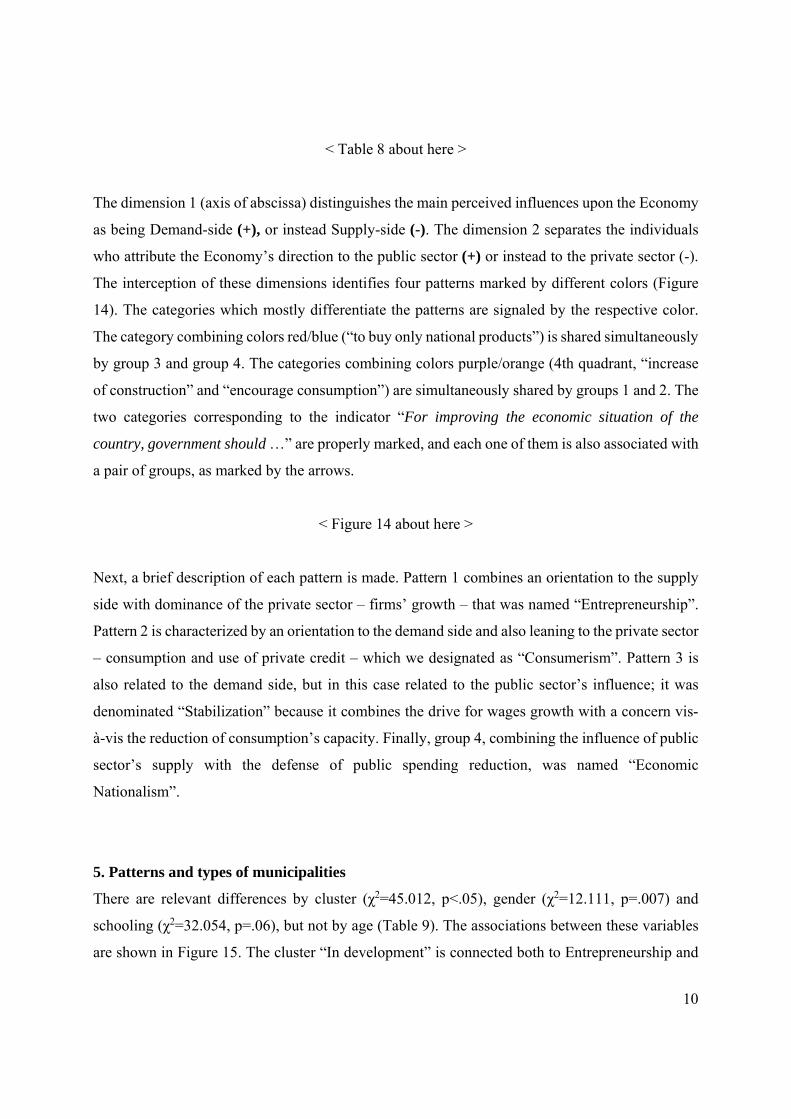
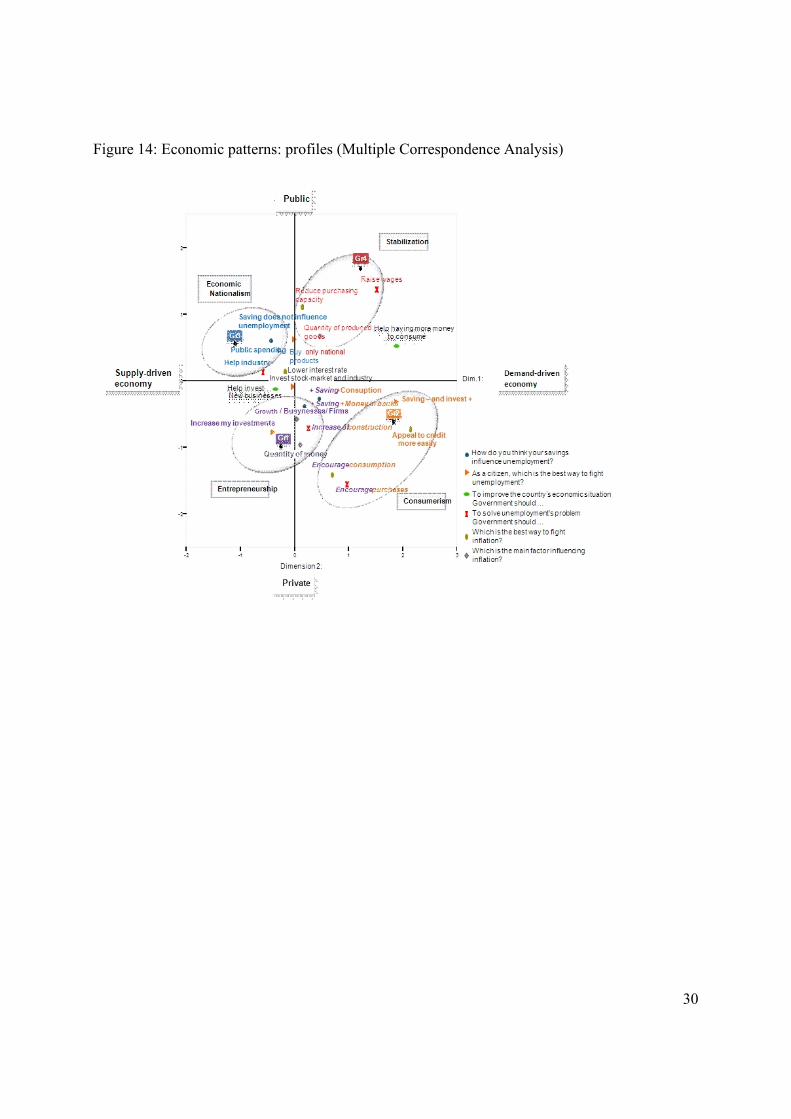
The dimension 1 (axis of abscissa) distinguishes the main perceived influences upon the Economy
as being Demand-side (+), or instead Supply-side (-). The dimension 2 separates the individuals
who attribute the Economy’s direction to the public sector (+) or instead to the private sector (-).
The interception of these dimensions identifies four patterns marked by different colors (Figure
14). The categories which mostly differentiate the patterns are signaled by the respective color.
The category combining colors red/blue (“to buy only national products”) is shared simultaneously
by group 3 and group 4. The categories combining colors purple/orange (4th quadrant, “increase
of construction” and “encourage consumption”) are simultaneously shared by groups 1 and 2. The
two categories corresponding to the indicator “For improving the economic situation of the
country, government should …” are properly marked, and each one of them is also associated with
a pair of groups, as marked by the arrows.
< Figure 14 about here >
Next, a brief description of each pattern is made. Pattern 1 combines an orientation to the supply
side with dominance of the private sector – firms’ growth – that was named “Entrepreneurship”.
Pattern 2 is characterized by an orientation to the demand side and also leaning to the private sector
– consumption and use of private credit – which we designated as “Consumerism”. Pattern 3 is
also related to the demand side, but in this case related to the public sector’s influence; it was
denominated “Stabilization” because it combines the drive for wages growth with a concern vis-
à-vis the reduction of consumption’s capacity. Finally, group 4, combining the influence of public
sector’s supply with the defense of public spending reduction, was named “Economic
Nationalism”.
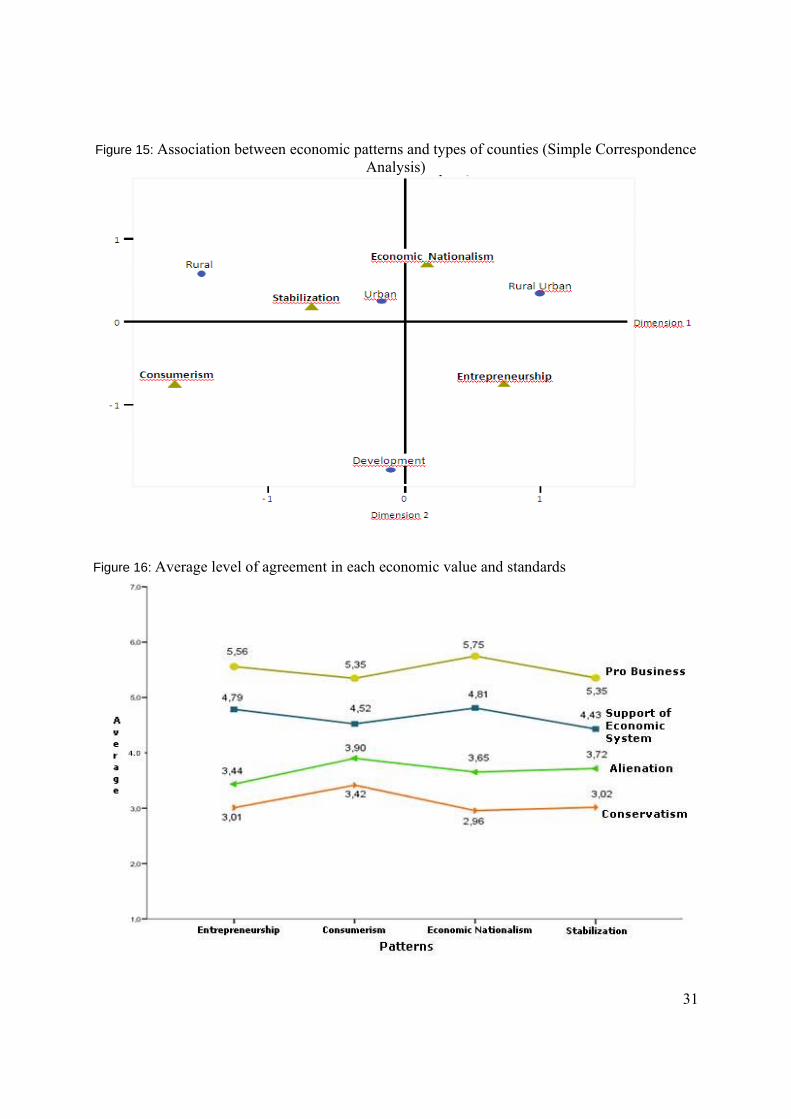
5. Patterns and types of municipalities
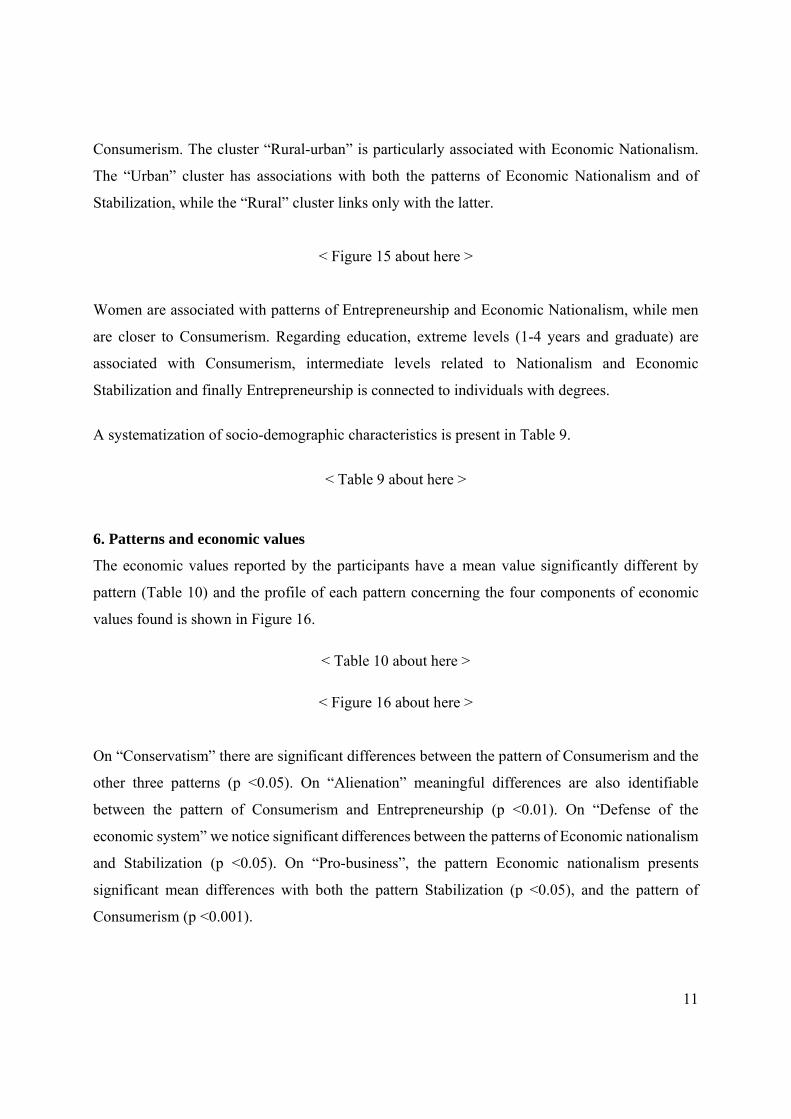
There are relevant differences by cluster (χ2=45.012, p<.05), gender (χ2=12.111, p=.007) and
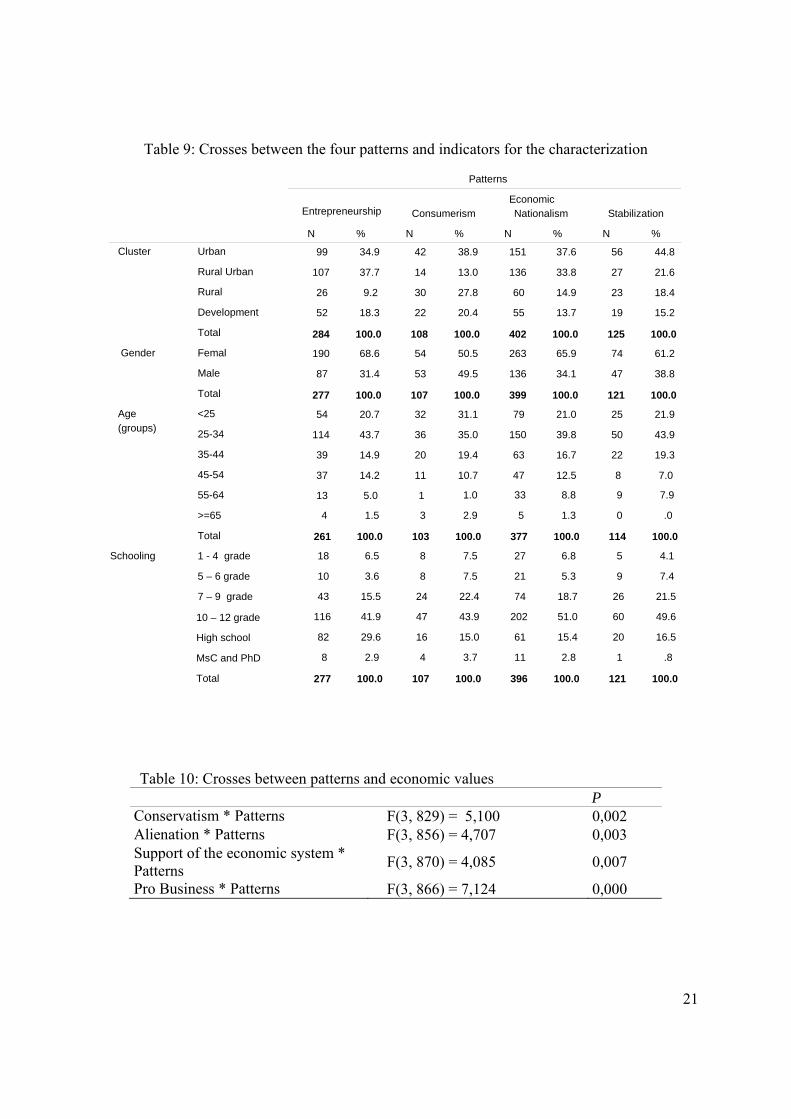
schooling (χ2=32.054, p=.06), but not by age (Table 9). The associations between these variables
are shown in Figure 15. The cluster “In development” is connected both to Entrepreneurship and
11
Consumerism. The cluster “Rural-urban” is particularly associated with Economic Nationalism.
The “Urban” cluster has associations with both the patterns of Economic Nationalism and of
Stabilization, while the “Rural” cluster links only with the latter.
< Figure 15 about here >
Women are associated with patterns of Entrepreneurship and Economic Nationalism, while men
are closer to Consumerism. Regarding education, extreme levels (1-4 years and graduate) are
associated with Consumerism, intermediate levels related to Nationalism and Economic
Stabilization and finally Entrepreneurship is connected to individuals with degrees.
A systematization of socio-demographic characteristics is present in Table 9.
< Table 9 about here >
6. Patterns and economic values
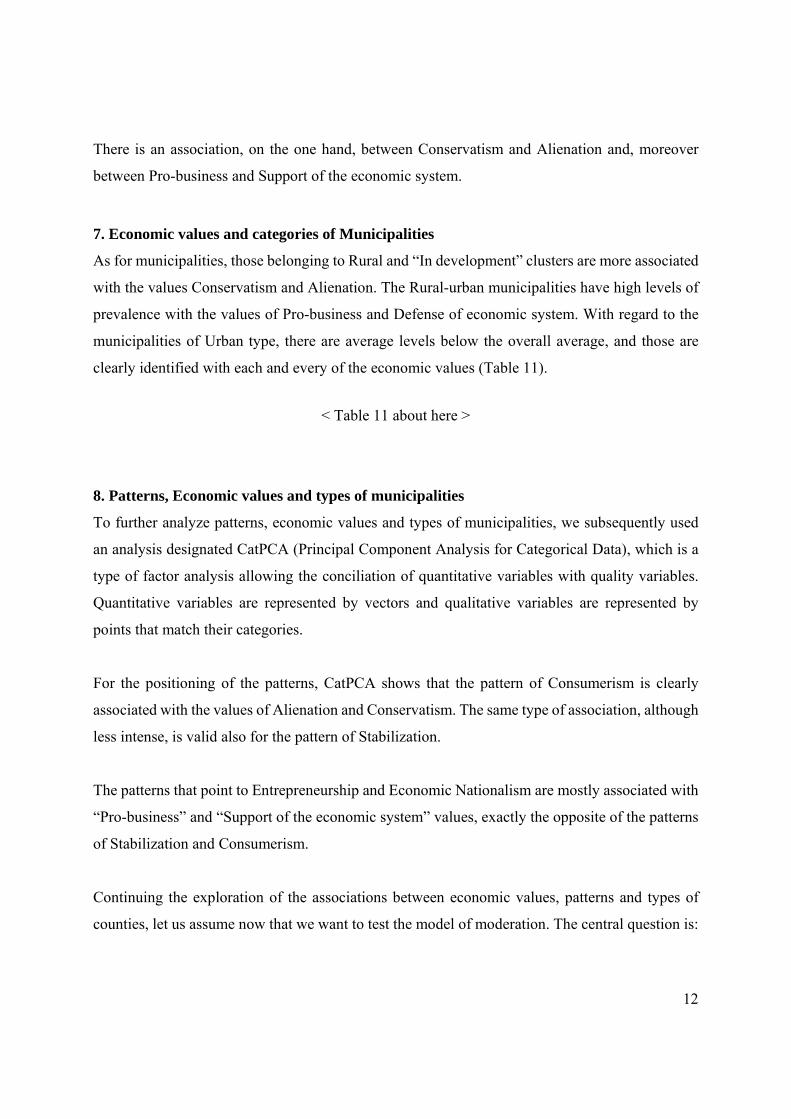
The economic values reported by the participants have a mean value significantly different by
pattern (Table 10) and the profile of each pattern concerning the four components of economic
values found is shown in Figure 16.
< Table 10 about here >
< Figure 16 about here >
On “Conservatism” there are significant differences between the pattern of Consumerism and the
other three patterns (p <0.05). On “Alienation” meaningful differences are also identifiable
between the pattern of Consumerism and Entrepreneurship (p <0.01). On “Defense of the
economic system” we notice significant differences between the patterns of Economic nationalism
and Stabilization (p <0.05). On “Pro-business”, the pattern Economic nationalism presents
significant mean differences with both the pattern Stabilization (p <0.05), and the pattern of
Consumerism (p <0.001).
12
There is an association, on the one hand, between Conservatism and Alienation and, moreover
between Pro-business and Support of the economic system.
7. Economic values and categories of Municipalities
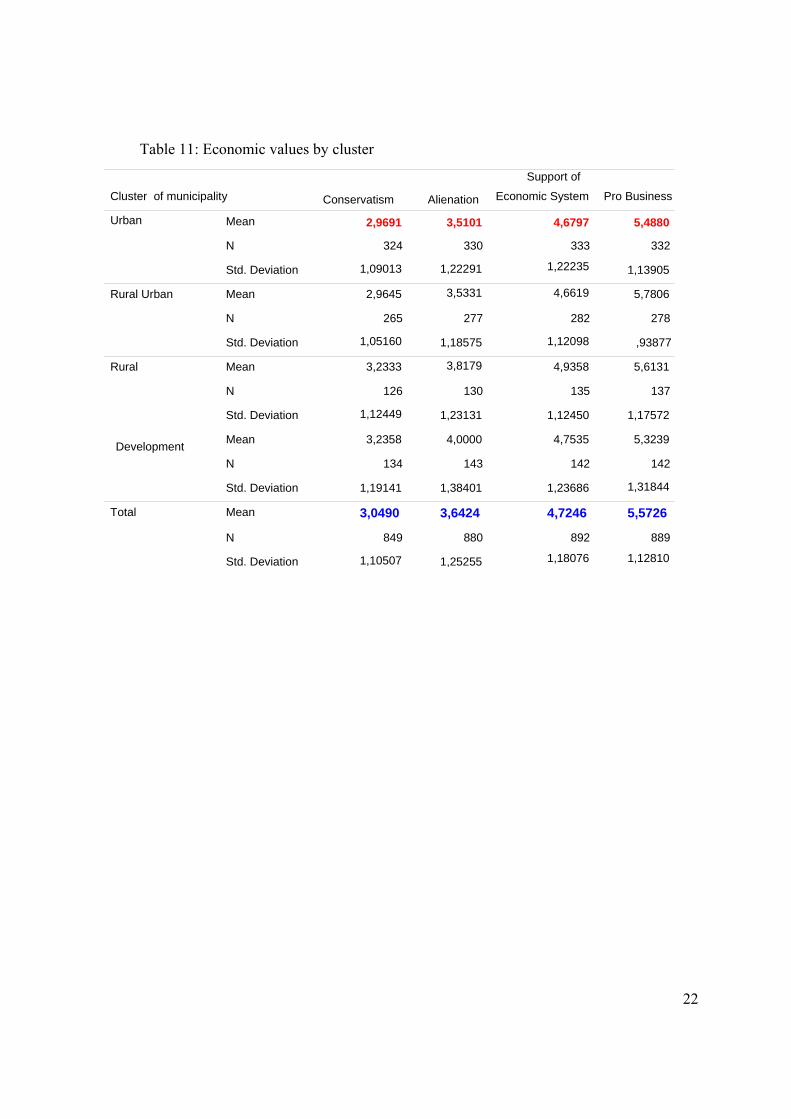
As for municipalities, those belonging to Rural and “In development” clusters are more associated
with the values Conservatism and Alienation. The Rural-urban municipalities have high levels of
prevalence with the values of Pro-business and Defense of economic system. With regard to the
municipalities of Urban type, there are average levels below the overall average, and those are
clearly identified with each and every of the economic values (Table 11).
< Table 11 about here >
8. Patterns, Economic values and types of municipalities
To further analyze patterns, economic values and types of municipalities, we subsequently used
an analysis designated CatPCA (Principal Component Analysis for Categorical Data), which is a
type of factor analysis allowing the conciliation of quantitative variables with quality variables.
Quantitative variables are represented by vectors and qualitative variables are represented by
points that match their categories.
For the positioning of the patterns, CatPCA shows that the pattern of Consumerism is clearly
associated with the values of Alienation and Conservatism. The same type of association, although
less intense, is valid also for the pattern of Stabilization.
The patterns that point to Entrepreneurship and Economic Nationalism are mostly associated with
“Pro-business” and “Support of the economic system” values, exactly the opposite of the patterns
of Stabilization and Consumerism.
Continuing the exploration of the associations between economic values, patterns and types of
counties, let us assume now that we want to test the model of moderation. The central question is:
13
does the variable type of municipality convey any influence or effect on the relationship between
patterns and economic values? We will then test the model presented in Figure 17.
< Figure 17 about here >
It is only interesting to search whether the effect of interaction is significant. Through the results
obtained with a econometric analysis using the General Linear Model (GLM) we have concluded
that there is a moderating effect (interaction) to the economic values: Conservatism (F = 2405,
p=0.011) and Pro-business (F=2,097, p=0.027). The profile plots (Figures 18 and 19) allow the
assessment concerning the contours of the interaction effect in each of the two situations with
significant effect.
< Figures 18 and 19 about here >
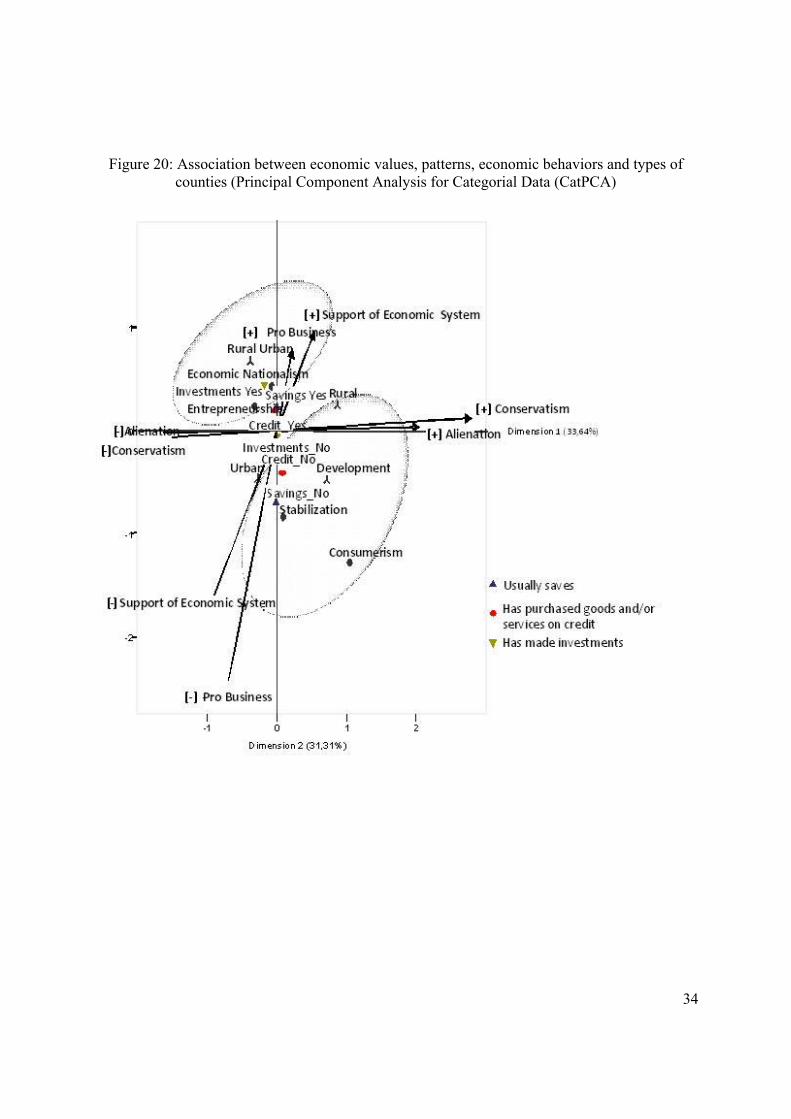
Returning to the relationship between economic values, patterns and types of counties, we add the
economic behaviors (Q5 – “do you usually save?”, Q10 – “have you already bought goods and
services on credit?”, Q17 – “do you have investments?”). To this end a further analysis of the
CatPCA type (Figure 20) was made. Given the configuration already obtained in previous CatPCA,
it is perceptible that the buying behaviors involving “having made investments”, “having
borrowed” and “having savings” emerge associated with the profile that combines the values of
pro-business and support of the system with the patterns of pro-investment and counter-
investment, and also the predominance of municipalities of rural-urban type.
< Figure 20 about here >
The absence of those economic behaviors is mostly associated with another profile. The pattern of
consumerism is more associated with the refusal of the economic behaviors in question. It is also
worth noting the agreement with values such as alienation and conservatism. This seems to be the
profile of both rural and developing municipalities.
14
9. Concluding remarks
This paper sought to identify relationships between evaluative orientations, beliefs and economic
behaviours of agents on the one hand, and differences in levels of regional development, on the
other.
The empirical analysis was based on a survey of almost one thousand people, living in a set of
Portuguese municipalities (and respective parishes) that were selected in order to constitute a
representative sample of the whole nation, according to a typology rural / urban and also according
to the level of development as measured by GDP per capita.
We identified patterns considering a higher prevalence of orientations either for the supply-side or
for the demand-side, as well as orientations predominantly for the State or for the market. This
methodology allowed us to construct four clusters, corresponding to "stabilization", "economic
nationalism", "entrepreneurship" and "consumerism". These clusters were then framed in a context
of spatial analysis, and crossed with different typologies at this level of analysis.
A key finding was the fact that the parishes named "rural", "rural-urban" and "urban" exhibit an
orientation that emphasizes the role of the state (although in general not very marked), while the
parishes said “in development” (i.e., those belonging to regions which have recently gone through
a strong structural change) are markedly oriented to the market.
Another important conclusion, and indeed somewhat unexpected, is that the “rural” parishes are
markedly consumerist, while the “rural-urban” are dominated by the orientation towards supply.
Interestingly, both “urban” and “developing” regions occupy, as to this criterion, an intermediate
position. In fact, the cluster “in development” is associated with both entrepreneurship and
consumerism. The “rural-urban” cluster is particularly related to economic nationalism. The
“urban” cluster has associations with both patterns of economic nationalism and of stabilization,
while the “rural” cluster relates only with the latter.

15
Regarding the intersection with values, we verify that the pattern of consumerism is clearly
associated with “alienation” and “conservatism” values. The same type of association, though less
intense, is shown by the pattern of stabilization. The patterns pointing to entrepreneurship and
economic nationalism are predominantly associated with “pro-business” and “support of the
economic system” values, exactly the opposite of the patterns of stabilization and consumerism.
Concerning the moderation by the typology of municipalities, we found the relevant fact that the
values of “pro-business” and “support of the economic system” are linked with the municipalities
of rural-urban type. The absence of these economic behaviours is mostly associated with the other
profile. It is also worth noting the agreement with values such as “alienation” and “conservatism”.
This seems to be the profile of both rural and developing municipalities.
These results are important for the formulation of economic and social policies taking into
consideration the regional dimension, which is, in our opinion, a crucial element for a better
knowledge of economies and societies, given the significant geographical differences in values,
beliefs and economic behaviors.
Finally, we should mention the important aspect that the enquiry supporting this study was carried
out before the ongoing economic crisis or in its very early stages, and so a important final
suggestion is that any updating/enlarging of the field research we have proceed to is likely an
important tool in order to assess both elements of permanence and possible shifts in mentalities
accompanying changes in economic situations, and vice-versa.
Aknowledgment. We thank the financial support from national funds given by the FCT
(Fundação para a Ciência e a Tecnologia), in the context of the Strategic Projects of SOCIUS an
UECE.
References

16
Bastounis M., Leiser D., Roland-Lévy, C. (2004), “Psychosocial variables involved in the
construction of lay thinking about the economy: Results of a cross-national survey”. Journal
of Econo Psychology, 25, pp. 263-278.
Furnham, A. (1996), “Attitudinal correlates and demographic predictors of monetary beliefs and
behaviours”. Journal of Organizational Behavior, 17(4), pp. 375-388.
Furnham, A, (1997), “The half full or half empty glass: The views of the economic optimist vs.
pessimist”. Human Relations, 50 (2), pp. 197-208.
Heaven P, (2001), “Economic beliefs and human values: Further evidence of the two-value
model?”. Journal of Social Psychology, 130 (5), pp. 583-589.
INE (2007), Anuário Estatístico, Lisboa.
Leiser, D., Briskman-Mazliach, R. (1996), The economic model questionnaire, Beer Sheva, Ben-
Gurion University.
O'Brien, M. U., Ingels, S. J. (1987), “The Economics Values Inventory”. The Journal of Economic
Education, 18 (1), pp. 7-17.
Pereira, E., Pereirinha, J., Passos, J. (2008), “Desenvolvimento de índices de caracterização do
território para o estudo da pobreza rural em Portugal Continental”. Revista Portuguesa de
Estudos Regionais, 21, pp. 3-32.

17
Appendix 1: Tables
Table 1: Number of parishes (total and sample) by cluster
Cluster Nr. Parishes Total % Nr. Parishes Sample Cluster 1 421 10,4 20 Cluster 2 1307 32,4 60 Cluster 3 1477 36,6 68 Cluster 4 832 20,6 39
Total 4037 100,00 187 Table 2: Sample details
A B C D E F G
CLUSTER Population by cluster
% of representative
national sample
Nr. Per. by
Sample
Nr Indiv Sample
by Parish
Nr Parishes by
Municipality
Nr Municipalities
Sample
Cluster 1 4,1Thous. 400 20 20 2 10 Cluster 2 3,3 Thous. 330 60 5 6 10 Cluster 3 1,1 Thous. 110 68 2 15 5 Cluster 4 1,5 Thous. 150 39 4 8 5 TOTAL 10 Thous. 1000 187 30
18
Table 3: Municipalities by cluster
REGIÃO CLUSTER 1 CLUSTER 2 CLUSTER 3 CLUSTER 4
NORTE Porto
Matosinhos Viana do Castelo
Vila Real Ponte da Barca
Mirandela
Ponte de Lima Amarante
Esposende St Maria Feira
Oliveira Azemeis
CENTRO Coimbra Guarda
Figueira da Foz Abrantes
Sertã
LISBOA
Lisboa Odivelas Cascais Almada Setúbal
Montijo Cartaxo
ALENTEJO Montemor-o-Novo
Beja Portel
ALGARVE Portimão
Faro Silves Alcoutim

19
Table 4: Questionnaires by cluster and Nr. of respective municipality Cluster Municipality Questionnaires 1 Urban 10 359 2 Rural-urban 10 291 3 Rural 5 147 4 Development 5 151 Total 30 948
Table 5: Distribution of individuals by municipality Concelho Cluster Questionnaires Abrantes 2 25 Alcoutim 3 28 Almada 1 41 Amarante 4 27 Beja 2 31 Cartaxo 2 31 Cascais 1 41 Coimbra 1 37 Esposende 4 32 Faro 1 28 Figueira da Foz 2 30 Guarda 2 28 Lisboa 1 39 Matosinhos 1 38 Mirandela 3 33 Montemor-o-Novo 2 26 Montijo 2 37 Odivelas 1 40 Oliveira de Azeméis 4 31 Ponte da Barca 3 30 Ponte de Lima 4 30 Portel 3 26 Portimão 1 26 Porto 1 35 Santa Maria da Feira 4 31 Sertã 3 30 Setúbal 1 34 Silves 2 26 Viana do Castelo 2 33 Vila Real 2 24 Total 948
20
Table 6: Components extracted by the economic values’ scale Component 1 2 3 4
q1.17 The average worker is receiving its fair share of business ,722 -,070 ,006 ,086
q1.18 The labor unions are too powerful ,681 -,165 ,011 ,201
q1.12 Taking care of the poor and sick is a role of families and the Church is not the responsibility of the Government
,637 ,321 ,096 -,110
q1.11 A person who cannot get a job can only blame itself ,582 ,074 ,207 -,228
q1.15 It is not the role of government to control commodity prices ,526 ,313 ,088 -,022
q1.9 it is not worth worrying about the state of the economy because I cannot do anything about it ,508 ,465 -,123 ,051
q1.14 Succeeding in life is mostly a matter of luck ,104 ,754 ,001 -,028
q1.13 The unemployed should not feel guilty for their situation: blame the economic system
-,021 ,742 -,032 ,212
q1.2 People who blame society or others for your money problems are shirking their responsibility
,057 -,075 ,789 -,029
q1.3 Our economy needs more people willing to save for the future -,056 ,100 ,709 ,109
q1.1 If workers want higher wages they must work harder and produce more
,216 -,082 ,613 ,132
q1.6 The Government should listen more to businesses and entrepreneurs have to say
-,017 ,032 ,077 ,833
q1.8 The companies could employ more people and produce more if they had not to pay a large amount of taxes
,040 ,133 ,125 ,784
Table 7: Correlations between economic values
Alienation Support of the Economic
System Pro Business Conservatism 0,368* 0,184* 0,006 Alienation 1 -0,029 0,137* Support of the economic system
1 0,172*
Pro Business 1 p<0,001
Table 8: Distribution of the four patterns
284 30.9 108 11.8 402 43.7 125 13.6 919 100.0
Entrepreneurship Consumerism Economic nationalism Stabilization
Total
Patterns N %
21
Table 9: Crosses between the four patterns and indicators for the characterization
Table 10: Crosses between patterns and economic values
P Conservatism * Patterns F(3, 829) = 5,100 0,002 Alienation * Patterns F(3, 856) = 4,707 0,003 Support of the economic system * Patterns
F(3, 870) = 4,085 0,007
Pro Business * Patterns F(3, 866) = 7,124 0,000
99 34.9 42 38.9 151 37.6 56 44.8
107 37.7 14 13.0 136 33.8 27 21.6
26 9.2 30 27.8 60 14.9 23 18.4
52 18.3 22 20.4 55 13.7 19 15.2
284 100.0 108 100.0 402 100.0 125 100.0
190 68.6 54 50.5 263 65.9 74 61.2
87 31.4 53 49.5 136 34.1 47 38.8
277 100.0 107 100.0 399 100.0 121 100.0
54 20.7 32 31.1 79 21.0 25 21.9
114 43.7 36 35.0 150 39.8 50 43.9
39 14.9 20 19.4 63 16.7 22 19.3
37 14.2 11 10.7 47 12.5 8 7.0
13 5.0 1 1.0 33 8.8 9 7.9
4 1.5 3 2.9 5 1.3 0 .0
261 100.0 103 100.0 377 100.0 114 100.0
18 6.5 8 7.5 27 6.8 5 4.1
10 3.6 8 7.5 21 5.3 9 7.4
43 15.5 24 22.4 74 18.7 26 21.5
116 41.9 47 43.9 202 51.0 60 49.6
82 29.6 16 15.0 61 15.4 20 16.5
8 2.9 4 3.7 11 2.8 1 .8
277 100.0 107 100.0 396 100.0 121 100.0
Urban Rural Urban Rural Development Total
Cluster
Femal Male Total
Genderrr
<25
25-34
35-44
45-54
55-64
>=65
Total
Agee (groups)
1 - 4 grade 5 – 6 grade 7 – 9 grade 10 – 12 grade
High school MsC and PhD
Total
Schooling
N %
Entrepreneurship
N %
Consumerism
N %
EconomicNationalism
N %
Stabilization
Patterns
22
Table 11: Economic values by cluster
2,9691 3,5101 4,6797 5,4880
324 330 333 332
1,09013 1,22291 1,22235 1,13905
2,9645 3,5331 4,6619 5,7806
265 277 282 278
1,05160 1,18575 1,12098 ,93877
3,2333 3,8179 4,9358 5,6131
126 130 135 137
1,12449 1,23131 1,12450 1,17572
3,2358 4,0000 4,7535 5,3239
134 143 142 142
1,19141 1,38401 1,23686 1,31844
3,0490 3,6424 4,7246 5,5726
849 880 892 889
1,10507 1,25255 1,18076 1,12810
Mean
N
Std. Deviation
Mean
N
Std. Deviation
Mean
N
Std. Deviation
Mean
N
Std. Deviation
Mean
N
Std. Deviation
Cluster of municipality
Urban
Rural Urban
Rural
Development
Total
Conservatism Alienation
Support of Economic System Pro Business

23
Appendix 2: Figures
Figure 1: Typology of parishes
24
Figure 2: Absolute frequency of answers to the problem of fighting unemployment by the Government
Figure 3: Absolute frequency of answers to the problem of fighting unemployment, as a Citizen

25
Figure 4: Absolute frequency of answers to “how do your savings affect unemployment?”
Figure 5: Absolute frequency of answers to the best way to fight inflation

26
Figure 6: Absolute frequency of answers to what the government should do to improve the
economic situation
Figure 7: Absolute frequency of answers to the problem of the best way to fight unemployment
as a citizen, by cluster
27
Figure 8: Absolute frequency of answers on the influence of savings in unemployment, by cluster
Figure 9: Absolute frequency of answers on the best way to fight inflation, by cluster
28
Figure 10: Absolute frequency of answers on Government influencing the country’s situation, by
cluster
Figure 11: Economic behaviors by cluster
29
Figure 12: Savings behavior by municipality
Figure 13: Credit behavior, by municipality
30
Figure 14: Economic patterns: profiles (Multiple Correspondence Analysis)
31
Figure 15: Association between economic patterns and types of counties (Simple Correspondence Analysis)
Figure 16: Average level of agreement in each economic value and standards

32
Figure 17: Model to test
Figure 18: Average level of agreement with the economic value of the second standard economic conservatism, tempered by the typology of counties
Patterns Economic Values
Type of Municipality

33
Figura 19: Average level of agreement with the pro-business economic value, according to
economic standards, moderate by the typology of counties
34
Figure 20: Association between economic values, patterns, economic behaviors and types of
counties (Principal Component Analysis for Categorial Data (CatPCA)