value stream mapping for a lean front office in-depth analysis and review value stream mapping for a...
TRANSCRIPT

Cincom In-depth Analysis and Review
Value Stream Mappingfor a Lean Front OfficeUncovering Opportunities in Sales Effectiveness
WHITE PAPER
SIMPLIF ICATION THROUGH INNOVATION ®

Table of Contents
Executive Summary . . . . . . . . . . . . . . . . . . . . . . . . . . . . . . . 3
History of Lean . . . . . . . . . . . . . . . . . . . . . . . . . . . . . . . . . . 3
Common Wastes in the Front Office . . . . . . . . . . . . . . . . 5
Hidden Wastes . . . . . . . . . . . . . . . . . . . . . . . . . . . . . . . . . . 7
Mapping Your Front-Office Processes . . . . . . . . . . . . . . . 8
Prioritizing Areas of Opportunities . . . . . . . . . . . . . . . . . 14
Recommendations . . . . . . . . . . . . . . . . . . . . . . . . . . . . . . 16
About Cincom . . . . . . . . . . . . . . . . . . . . . . . . . . . . . . . . . . 17
Cincom In-depth Analysis and Review
Value Stream Mappingfor a Lean Front Office
Uncovering Opportunities in SalesEffectiveness
WHITE PAPER

3
Executive SummaryBusinesses implementing lean manufacturing bypass thefront-office and target their manufacturing processes.After all, front-offices have paperwork, not inventory, right?However, order entry, quoting, scheduling, design, andengineering are front-office functions that can provide aneye-opening opportunity to create improvement,eliminate waste, and increase profits in your business. It’snot uncommon to discover that over 95% of the lead timein your order is found in the office functions – and only 5%of the lead time in the actual production of the product.This white paper spotlights areas of opportunity that areoften overlooked, as well as how the seven basic forms ofwaste can be found in front-office processes.
History of Lean1
Information flow and office processes are important to anybusiness and can directly affect lead time, quality, rework,and customer satisfaction. In many cases, a major portionof a product’s lead time is related to inefficient andineffective order processing and scheduling in the officenot on the factory floor. To better understand theopportunities that lie in the front office, it is important tounderstand how Lean Manufacturing became such acritical tool.
The history of Lean Manufacturing can be traced backalmost 100 years in some guises. Here is an overview.
Taiichi Ohno is regarded as the founder ofthe Toyota Production System (TPS) that wasdeveloped in 1950 following an excursion tothe Rouge Ford plant in the US by EijiToyoda, a young engineer who reported hisfindings on the Ford system back to Ohno.James Womack (1990) coined the phrase “LeanManufacturing” to describe TPS when they printed theresults of a five-year study into the automotive industry inthe book The Machine that Changed the World. Ohno(1998) describes the most important objective of the TPSas increasing production efficiency through consistentlyand thoroughly eliminating waste. The following figureillustrates how TPS differs from traditional approaches toimprove productivity through adding resources, andillustrates the impact of waste elimination on productionlead-time.
1 http://www.beyondlean.com/history-of-lean.html

So What Is Waste?Womack defines waste as any activity that consumesresources but adds no value as specified by the customer.In order for us to understand the waste within anyenterprise activity, Ohno broke waste up into sevenelements:
The Seven Wastes1. Overproduction - Producing things ahead of demand
2. Waiting - Inability to move to the next processing step
3. Transport - Unnecessary movement of materials between processes
4. Over-processing - Inappropriate processing of parts, due to poor tool and/or product design
5. Inventory - Storing more parts than the absolute minimum
6. Movement - Unnecessary movement of people during the course of their work
7. Defects - Production of defective parts
The seven wastes commonly found in physical production describes the four key elements of a TPS as:
• Just In Time (JIT)
• Jidoka
• Standardized Work
• Kaizen
In general, terms the key elements of Lean Manufacturing work together to continually improve productionprocesses. Put simply, waste elimination is accomplished through JIT and Jidoka, maintained through StandardizedWork, and improved through Kaizen.
Just In Time (JIT)
Producing what is needed, when it is needed, in exactly the amount needed (using pull systems [Kanban],continuous flow processing, and synchronizing the production speed.)
Jidoka
The ability of production to be stopped in the eventuality of a problem, either by the machines themselves or bypeople (using stop systems and error proofing).
Standardized Work
Standardize procedures concentrating on the most efficient human movements and work sequence for eachprocess.
Kaizen
Never-ending job design through continuous improvement.
4
LEAD TIME
ValueAdded
Waste
Traditional Focus - Work Longer-Harder-Faster - Add People or Equipment
Lean Manufacturing- Improve the Value Stream to eliminate Waste
Waste Elimination

5
Common Wastes in the Front Office1. Information DefectsInformation defects refers to anytime an information itemis either incorrect or missing. A general rule of thumb isthat man is only 80% effective in interpreting andprocessing information on a repetitive basis. Starting outwith incorrect information only serves to have anexponential effect on the Customer Fulfillment process.The negative effects can be measured:
• Inaccurate depiction of customer needs
• Inaccurate application of products or services tomeet customer needs
• Poor fitness of price to satisfy both customer andorganizational needs
• Poor fitness of delivery conditions
There are three common categories of information defectsin the customer fulfillment process:
Obsolete Product Feature DefectsAn obsolete product feature defect occurs when a productfeature selection is made knowingly or unknowingly thathas changed or is discontinued, and therefore no longermeets the needs of the customer. The most commonreasons are:
• Product modifications are made, but the changes havenot been effectively communicated out to the saleschannels.
• Product modifications have been communicated to thesales channels, however, the sales systems have notbeen updated.
Incorrect Pricing DefectsPricing is a two-part activity. The first part of pricinginvolves creating a list price for the product. This isgenerally based on several factors:
• Product cost (material, labor, burden)
• Anticipated profit margin
• Prevailing market conditions (competition, local markets,product life cycle position)
Since the target profit margin for a product is the moststable factor in the list price, defects are typically a resultof dynamics of cost and market. That is, with theincreasing effects of a global economy, material costs ofsteel, petroleum, and other natural resources can changesuddenly. List prices then fail to reflect the true coststructure of the product and could greatly reduce aproduct’s ability to perform in the market.
The second part of pricing is that of creating theappropriate selling price for an opportunity. Generally,there are three factors that determine the selling price:
• Sales-channel profitability
• Customer-preferred incentives
• Rebates or pass throughs2
The selling price defects can have a significant impact onsale-channel performance. Priced wrong, sales-channelprofitability can be negatively affected. If a channelcannot recoup the cost of sales and meet its own profittargets, it may ignore or limit selling a particular product infavor of a competitive product that is more profitable tothe channel.
Incorrect Product Feature DefectsIncorrect product features involve the selection of anotherwise valid choice by either the sales channel or thecustomer. It is important to recognize that incorrectselections are made for two reasons:
• The correct customer need was fitted with an incorrectproduct feature. This is the most typical in that, whilethe need was authentic, an understanding for how toserve the need was not.
• The correct product feature was fitted to an incorrectcustomer need. This defect can be rather elusive in thatit is often not found until late in the customer fulfillmentprocess, sometime after the product has beenproduced.
2 A pass through is a supplier rebate for a component or option selected by the customer; 100% of the incentive is passed on to the customer

2. Information Over-Processing
Excessive ReviewsIt is not uncommon for the customer fulfillment process tohave several discrete review sessions prior to order entry.These review sessions typically precede a translationprocess:
• Initial receipt from the sales-channel; a salesadministrator will verify customer and sales channelinformation prior to logging the opportunity.
• An application engineer will verify product featureselections made by the sales channels.
• A pricing analyst will verify that the price is accurate.
• A material planner will verify that the deliver dates aresupported by the production plan.
Excessive review sessions add unnecessary time delay tothe customer fulfillment process and don’t add anyadditional value from the customer’s perspective.
Obsolete Documents or FormsThroughout the life cycle of the customer fulfillmentprocess, temporary process work-arounds, deviations, andcustomer-specific activities have produced process tasksthat have become unnecessary. However, for one reasonor another, the temporary process tasks and thesupporting documentation were not removed from theofficial customer fulfillment process. Many times theoriginator of the added process task is no longer with theorganization or has assumed other responsibilities.
Redundant Data Processing (“The Excel Effect”)Another source of information over-processing is betterknown as the “Excel Effect.” Here is an example:
“Opportunities are entered into a trackingsystem. Because he cannot access thetracking system, or get the data out in aspecific format, the sales manager creates aspreadsheet to track opportunities, pipelineplanning, etc. The engineering managerneeds to monitor the opportunities that hehas assigned to his department. To do this,he uses the company’s PDM system tomonitor the opportunities. Throughout thecustomer fulfillment process, criticalopportunity information is processed inseveral different systems …”It quickly becomes evident from this example thatchanges to customer needs and product solutions mustpropagate through redundant procesess that addconsiderable time and effort to the customer fulfillmentprocess.
3. Information Idle Time (Wasted Time)Because the customer fulfillment process is usually amanually driven, asynchronous process, there is almostalways a queue in front of each process task. Thesequeues can stretch the customer fulfillment processtimeline as much as 600% (see next section). There areseveral process tasks where time delays from waiting aretypical:
• Waiting for cost and price estimates
• Waiting for engineering approval on specials
• Waiting to generate a correct proposal
• Waiting for commitment from manufacturing orprocurement
6

Hidden WastesWhile the common wastes in the front office areconsiderable, there are a couple of underlying wastes inparticular that can significantly constrain an organization'sability to serve it's customers and at the same time, satisfyorganizational goals:
1. Lost Scalability of the Sales ForceFor each day that a sales channel is unaware of (oruncertified on) new products, product enhancements, andcustomer applications, revenue is lost. Rapid developmentand deployment of value streams that support andeducate the sales channels is essential to a new productrollout. Sales effectiveness is increased with theknowledge of related products and their fit with customerneeds – provided at the point of need. Traditional wastesmeasured in process delays, rework, and informationdefects equate to millions of dollars in lost revenues,market share erosion, and customer retention.
2. Adaptability of Getting New Products toMarket Sooner
In today’s competitive business environment, wastes ininformation defects, redundant data processing, andinformation idle time can dramatically affect how newproducts are developed and brought to market. Having acomprehensive Value Stream that coordinates informationflow between sales and marketing, product development,and production for New Product Introduction (NPI) iscentral to achieving these objectives. According to AMRResearch, companies that do not effectively manage theirNew Product Introduction (NPI) processes can be up to56% later to market3. Data compiled by consulting firmPRTM indicates that companies also experience up to 26%lower margins due to poor NPI processes. The diagrambelow illustrates how the presence of information wastescan impact the time to value of a new productintroduction.
7
UnitVolume
Time
$$
Demand Availability
Lost Sales!!!
No Availability due to Delaysand Information Defects
Declining Demand = Lower Margin
3 Kevin O'Marah, Michael Burkett, Debra Hofman; Benchmarking the PERFECT Product Launch: It's All in the Mix; 2004; AMR Research Inc.

8
Mapping Your Front-Office Processes
1. Customer Order FulfillmentThe Customer Fulfillment (CF) process typically follows aconsistent flow from the salesperson working with theprospective company to jointly define the problem (oropportunity) to the delivery of value in the form of aproduct or service that meets (and hopefully exceeds) thecustomer’s requirements. While the following diagramillustrates the CF process for an information technologyprovider, the key deliverables within each step areconsistent in other industries.
The CF process is all about taking the unarticulated needsof the customer and translating them into a solutiontailored specifically for that customer. This solutionincludes not only the actual product being sold, but othermore intangible and significant objects like:
• Price
• Terms and conditions
• Delivery requirements
• Customer support tools
• Warranty support
It is important to note that these items are generally theresults of several business processes that may or may notbe synchronized to the CF process. An example of thismay be the production scheduling process, which tries tooptimize manufacturing resources, while possibly notsupporting the delivery requirements of the customer.When this occurs, time delays frequently result fromhaving to re-prioritize work, both in the office and on theshop floor, or the salesperson is forced to require thecustomer to pay a premium to get his or her order earlier.
The customer Inquiry-to-Order business process capturesthe complete interaction between the selling organizationand the prospect prior to an actual order being issued.During this phase, it is not uncommon to see as much as70% of all opportunities experience significant delays andrework due to processing wastes, inaccurate information,or opportunities just plain sitting around. A commonlycited figure is that companies lose 1% to 2% of the annualrevenue due to errors in the CF process4.
Attract Assess Confirm Deliver
• Company Introductions• Problem Definition• Project Definition• Technology Assessment• Vendor Assessment• Determination of fit
• AS-IS Process Review• TO-BE Process Definition• Requirement Definition• Solution Design• Solution Workshop• Statement of Work• Business Justification• Project Proposal
• Product and ServicesContract
• Project Plan Development• Architecture and Design• Product Modeling• Proof Project• Application Development• Integration• Product Maintenance
Procedures• Pilot Test• Acceptance Test
• Installation• Support Procedures• Customer Acceptance• Project ROI• Project Turnover
4 Tiihonen, Juha; Product Configurators – Information System Support for Configurable Products; Helsinki University of Technology, 2001

9
The following Value Stream Map depicts the processingsteps typically found in the CF process. Based onrepresentative samples in a complex sales process, the CFprocess yields six days of value-added activity comparedto forty days of non-value-added activity5. In other words,85% of the time, the opportunity is either waiting forinformation from other process tasks, or the information issimply being re-formatted without any additional valueadded at that process task.
Part of the underlying causes for the wastes found in theCF process can be found in the disparate informationsystems used by companies to support the customerorder process. According to AMR Research6:
• The average company has 4.3 order-fulfillment and 5.2order-capture systems.
• Over 50% of US companies have customer orders goingthrough more than one order-management system.
• Only 50% of companies have order-management systemthat share a common master product and customerdatabase.
1 Day10 Days
1 Day 1 Day10 Days 5
3 Days15 Days
Batch Size 1 Opp
L/T 1 Days
Fallout Rate 20 %Batch Size 1 Opp
L/T 2 Days
Fallout Rate 5 %
Batch Size 1 Opp
L/T 5 Days
Fallout Rate 5 %
Batch Size 1 Opp
L/T 5 Days
Fallout Rate 5 %
Batch Size 1 Opp
SalesOrganization Sales RepRequest for Resources
Opportunity Management
CRM (or manual)
LogOpportunity
Q
Q
Q
Q
Q Q
NeedsAssessment and
RecommendApproach
Quote
Estimate
OppValueEmail
ProposeQ
Unarticulated Needs
C
Customer
Full Custom
er Spec
Order
Won/Loss
Q
QProduct
ConfigurationVerify Design
andEng. Specials
Planningand
Scheduling
5 The definition of Value-Add is new information content that further defines the customer specification; Non Value-Add is reformatting of existinginformation content.
6 Lapide, Larry, Mixed Mode Customer Fulfillment Forces Integration Beyond SCE; AMR Research, Inc.; 2002

10
2. PricingPricing is one of the most important, yet least understood,of all the front-office processes. Many business managersestablish prices without formal pricing policies, basingthem on what competitors charge or on whatmanufacturers suggest. And, because the pricing processis typically not integrated to the rest of the CustomerFulfillment process, inefficiencies and errors in criticalinformation produce front-office wastes such as:
• List prices that do not support corporate objectives(margins)
• Selling prices that do not support customer acceptance
The results are lower revenues, diminished profits, andpressure on cash flows.
The manufacturer's pricing decision depends on thesupport of accurate cost accounting records. The mostcommon technique is cost-plus pricing, where themanufacturer charges a price to cover the cost ofproducing a product plus a reasonable profit. The cost-plus method is simple, but it does not encourage theefficient use of resources. The following equation istypically used as a basis for cost-plus pricing:
Cost-plus pricing is typically based on a manufacturingestimate7. Estimates of the costs associated withmanufacturing tasks are made for many reasons. Forexample, to:
• Justify planned capital expenditure
• Determine likely production costs for new or modifiedproducts
• Focus attention on areas of high cost
In principle, estimates are made of the resources required(e.g., materials, labor, and equipment), the cost of thoseresources, and the time for which they will be used. Fromthese factors an estimate of the costs of carrying out amanufacturing process is made. Accounting methods areusually used, for depreciation and cash flow analysis, whencapital expenditure justifications are to be made.
Price = (Material Costs * Material Multiplier + Labor Costs * Labor Multiplier
+ Equipment Costs * Equipment Multiplier)* Overhead Markup+ Outsourced Items * Outsource Multiplier
7 For other pricing strategies refer to McKinsey Quarterly “The CFO Guide to Better Pricing”;http://www.mckinseyquarterly.com/article_page.aspx?ar=1534&L2=5&L3=5; 2002
11
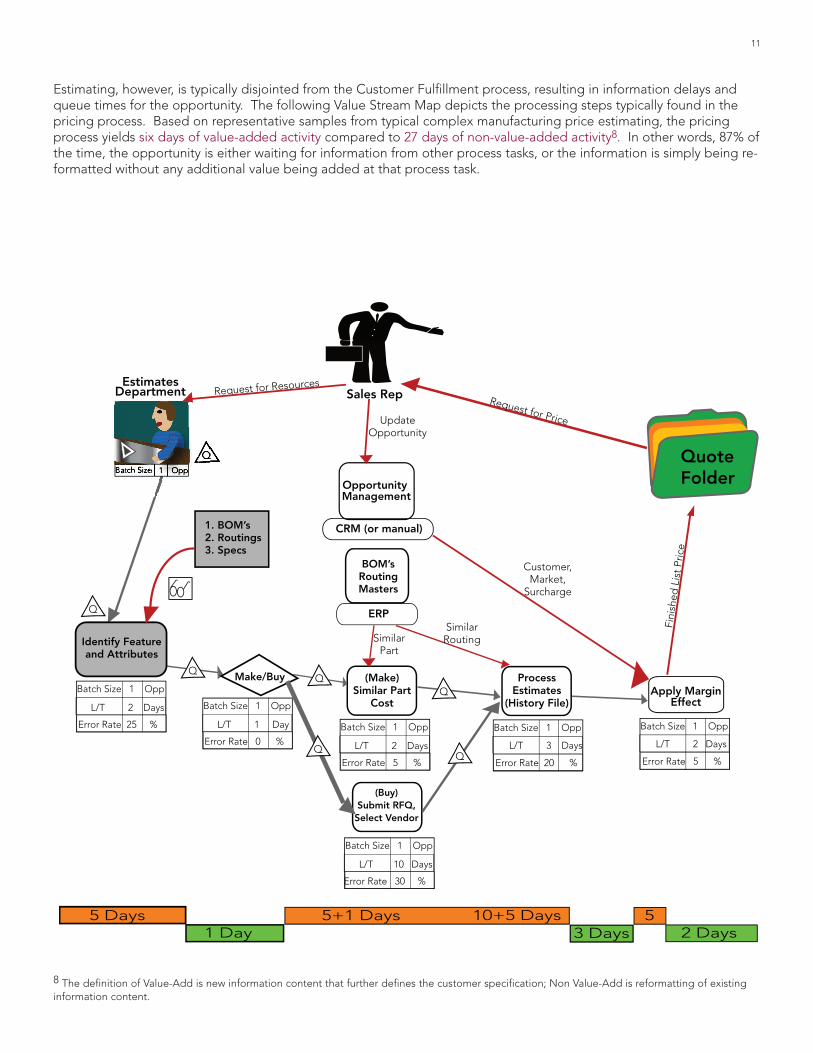
Estimating, however, is typically disjointed from the Customer Fulfillment process, resulting in information delays andqueue times for the opportunity. The following Value Stream Map depicts the processing steps typically found in thepricing process. Based on representative samples from typical complex manufacturing price estimating, the pricingprocess yields six days of value-added activity compared to 27 days of non-value-added activity8. In other words, 87% ofthe time, the opportunity is either waiting for information from other process tasks, or the information is simply being re-formatted without any additional value being added at that process task.
1 Day5 Days 10+5 Days
2 Days5+1 Days 5
3 Days
Batch Size 1 Opp
L/T 2 Days
Error Rate 25 %
Batch Size 1 Opp
L/T 1 Day
Error Rate 0 %Batch Size 1 Opp
L/T 2 Days
Error Rate 5 %
Batch Size 1 Opp
L/T 2 Days
Error Rate 5 %
Batch Size 1 Opp
EstimatesDepartment Sales RepRequest for Resources
Opportunity Management
CRM (or manual)
UpdateOpportunity
Q
Q
Q
Identify Featureand Attributes
Make/Buy
BOM’sRoutingMasters
1. BOM’s2. Routings3. Specs
(Make)Similar Part
Cost
Q
Request for Price
Fini
shed
List
Pric
eApply Margin
Effect
ERP
SimilarPart
(Buy)Submit RFQ,
Select Vendor
Batch Size 1 Opp
L/T 10 Days
Error Rate 30 %
QProcess
Estimates(History File)
SimilarRouting
Batch Size 1 Opp
L/T 3 Days
Error Rate 20 %
Customer,Market,
Surcharge
QuoteFolder
8 The definition of Value-Add is new information content that further defines the customer specification; Non Value-Add is reformatting of existinginformation content.

12
3. “Customer Specials”It is probably important to first define a “CustomerSpecial.” A customer special represents anything forwhich a predetermined product variant9 does not exist.Many times the customer special serves as a means for acustomer to specify a unique selection of a feature oroption of a given product or service. For example, whenordering a utility vehicle, a customer may request a largeraerial device than currently offered for the selected vehiclechassis. To enable the customer to choose the desiredselection of this feature, several analyses must occur:
• Fully describe the customer special in product-specificattributes.
• Perform a product design feasibility on the customerspecial.
• Perform an economic feasibility on the customer special.
• Modify the product structure accordingly to accept thecustomer special.
• “Codify” the customer special so that it can beincorporated into the product definition system.10
Processing customer specials requires that the customerspecial is described using attributes that are consistentwith the product structure. In other words, if for exampleweight and length are critical to the product structure,then the customer special must be expressed in term ofweight and length (among other attributes). This is acommon point of failure in that adequate attributes arenot discovered in the customer-special specificationphase, resulting in inaccurate and incomplete information.This adds unnecessary delays in the Customer Fulfillmentprocess.
9 A product variant is a specific product configuration that includes an appropriate set of option selections.
10 Part numbers, option codes, include/exclude rules, etc.

13
The following Value Stream Map depicts the processing steps typically found in the customer-specials process for acomplex product structure. Based on representative samples from typical complex manufacturing product structures,the customer-specials process yields eight days of value-added activity, compared to 15 days of non-value-addedactivity11. In other words, 47% of the time, the opportunity is either waiting for information from other process tasks, orthe information is simply being reformatted without any additional value being added at that process task.
11 The definition of Value-Add is new information content that further defines the customer specification; Non Value-Add is reformatting of existinginformation content.
1 Day 2 Days1-5
3-5 Days
Batch Size 1 Opp
L/T 2 Days
Repeat Rate 30 % Batch Size 1 Opp
L/T 1 Day
Repeat Rate 5 %
Batch Size 1 Opp
L/T 2 Days
Repeat Rate 15 %
Batch Size 1 Opp
L/T 2 Days
Repeat Rate 3 %
Batch Size 1 Opp
ProductEngineering Sales RepRequest for “Special”
Opportunity Management
CRM (or manual)
UpdateOpportunity
Q
Q
Q
Identify Featureand Attributes
Have wedone this
before
BOM’sRoutingMasters
Create“Special”
BOM
Q
Special Feature Content
Spec
ial F
eatu
re/O
ptio
n
Codify the“Special”
CAD, PLM, etc.
SimilarPart
PreliminaryDesign Spec
Batch Size 1 Opp
L/T 5 Days
Repeat Rate 25 %
Q IdentifyInclude/
Exclude Specs
Batch Size 1 Opp
L/T 3 Days
Repeat Rate 5 %
UpdateQuote
No
Batch Size 1 Opp
L/T 1 Days
Repeat Rate 10 %
Makethis a Std
Offer
Yes ConfigMgmnt
3-5 Days1-5 Days

14
Prioritizing Areas of OpportunitiesAnalysis is the conversion of Continuous Improvement (CI)data into Continuous Improvement decision-makinginformation. It includes reviewing, prioritizing, andselecting the most critical CI items to address.Opportunities for improving the front office should beanalyzed in terms of its consequence on cost, schedule,performance, and product quality. An individualopportunity may impact more than one of thesecategories. For example, frequent changes to customerneeds will impact all four.
A prioritization process may look something like:
• Determine a risk level for each CI opportunity bymapping each opportunity onto a risk matrix, a sampleof which is shown below.
• Process improvement teams evaluate the risk level foreach CI item and determine when appropriatemitigation plans will be required.
• This decision-making can be facilitated by the use of risklevels agreed to by the management team and theprocess improvement team.
The risk levels could be defined as:
• Tolerable Risk is a condition where opportunity isidentified as having little or no effect or consequence onbusiness objectives; the probability of occurrence is lowenough to cause little or no concern.
• Low Risk is a condition where opportunity is identifiedas having minor effects on business objectives; theprobability of occurrence is sufficiently low to cause onlyminor concern.
• Medium Risk is a condition where opportunity isidentified as one that could possibly affect businessobjectives, customer satisfaction, or order processinglead time. The probability of occurrence, is high enoughto require close control of all contributing factors.
• High Risk is the condition where opportunity isidentified as having a high probability of occurrence andthe consequence would affect organization goals(revenue, product introduction, etc.). The probability ofoccurrence is high enough to require close control of allcontributing factors, the establishment of opportunityactions, and an acceptable fallback position.
• Intolerable Risk is the condition where opportunity isidentified as having a high probability of occurrence,and the consequence would have significant impact onstrategic organization goals.

15
At the conclusion of opportunity prioritization, a consolidated list of opportunities is created, and a ProcessImprovement Action Plan is created and maintained.

16
Cincom, the Quadrant Logo, and Simplification Through Innovation areregistered trademarks of Cincom Systems, Inc. All other trademarks belong totheir respective companies.
© 2007, 2009 Cincom Systems, Inc.FORM QO070503-1 05/09Printed in U.S.A.All Rights Reserved
World Headquarters • Cincinnati, OH USA • US 1-800-2CINCOMFax 1-513-612-2000 • International 1-513-612-2769E-mail [email protected] • http://www.cincom.com
RecommendationsValue stream mapping the front-office process is apowerful tool for understanding the impact of informationon the Customer Fulfillment process. We can use thesetools to understand and communicate the impact oftraditional “push” techniques for information processing,and to visualize how alternative LEAN methodologies canradically improve process throughput and eliminate waste.
Through the systematic and continuous elimination ofwaste, organizations can realize significant financialbenefits12 in the front-office process:
• A 95% reduction in costs to complete an order.Nearly every manufacturing company has a roughmeasure of how much it costs to fulfill an order. Thepayoff of using a quote-to-order, order-to-cash, sales, orproduct-configuration strategy is that there is majorreduction in the costs of fulfilling orders for customizedproducts.
• Reduction in order cycle times from 17-33 hours to30 minutes. From an AMR Research survey of bestpractices in sales configuration, the medianimprovement in order cycle times dropped from worstcase, 33 hours, to less than one hour. In aggregate, theorder cycle times across all manufacturers were droppedto less than an hour.
• A 20% to 50% reduction in engineering support forpresales tasks. The cost implications of minimizingengineering support is significant, but the strategicpayoff of having engineering focused on new productdevelopment is a competitive advantage that takesyears to cultivate and grow. Having engineering focusedon tactical versus strategic issues can cost any companya product generation.
• Days Sales Outstanding (DSOs) reductions from anaverage of 60 to 29 days. This is a measure of howlong it takes a company’s customers to pay theirinvoices. Analysts see DSO reduction as a sign ofincreasing customer satisfaction.
About CincomFor nearly 40 years, Cincom’s software and services havehelped thousands of clients worldwide simplify themanagement of complex business processes. Cincomspecializes in the area of business where simplificationbrings the greatest value to managers who want to growrevenue, control costs, minimize risk, and achieve rapidROI better that their competitors.
Cincom serves thousands of clients on all continentsincluding BMW, Cooper Power Systems, Siemens,Rockwell Automation, and Trane.
12 Columbus, Louis; Best Practices in Quote-to-Order: MeasuringQuoting Strategies’ Financial Impact; Cincom Systems, Inc.; 2004