value of asset management - wapa...value of asset management 2018 introduction the office of asset...
TRANSCRIPT

VALUE OF ASSE T MANAGEMENT
Western AreaPower Administration

VALUE OF ASSET MANAGEMENT 2018
INTRODUCTIONThe Office of Asset Management is WAPA’s functional implementation of the structured philosophy of ISO 55000, the international standard for the management of assets.
Asset Management uses asset information gathered from field crews and subject matter experts during routine work activities to produce valuable data products, which are then used in capital planning, maintenance procedure decisions and other business decisions requiring risk-based analysis.
Assets being evaluated for health and risk include:
l Transmission lines ≥ 100-kV
l Power circuit breakers ≥ 100-kV
l Power transformers
l Phase-shifting transformers
l Oil-filled reactors
l Grounding transformers
WESTERN AREA POWER ADMINISTRATION 1
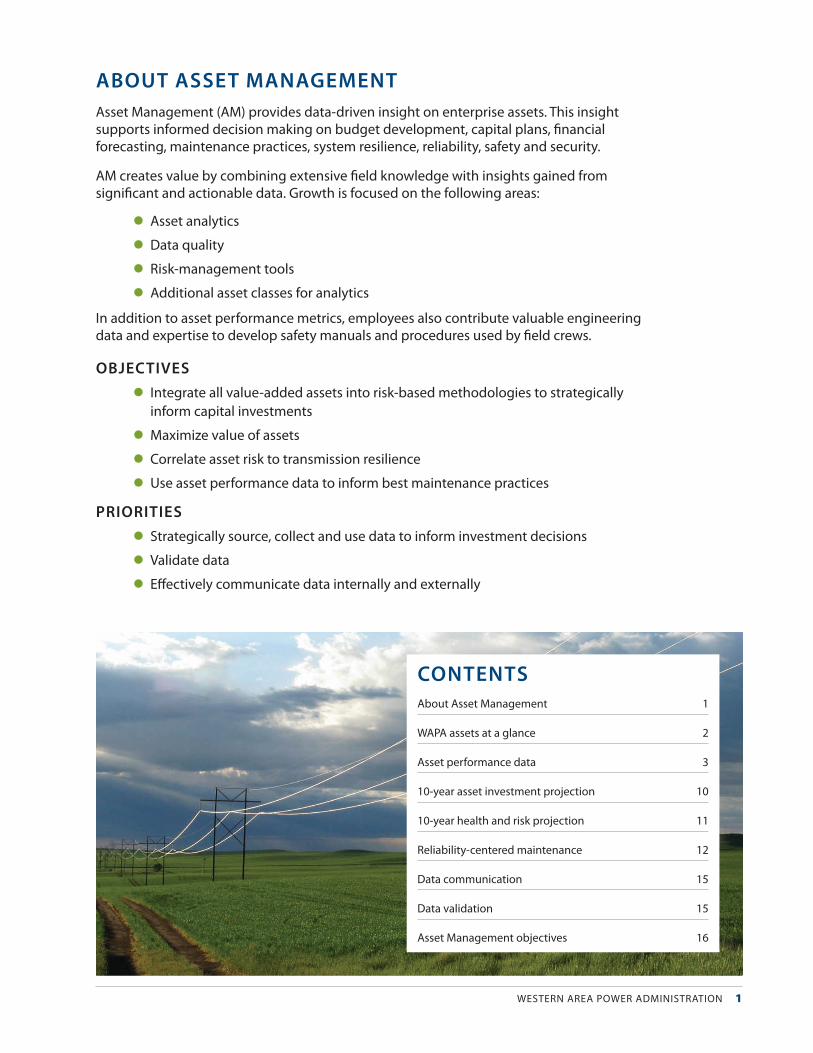
ABOUT ASSET MANAGEMENT
Asset Management (AM) provides data-driven insight on enterprise assets. This insight supports informed decision making on budget development, capital plans, financial forecasting, maintenance practices, system resilience, reliability, safety and security.
AM creates value by combining extensive field knowledge with insights gained from significant and actionable data. Growth is focused on the following areas:
l Asset analytics
l Data quality
l Risk-management tools
l Additional asset classes for analytics
In addition to asset performance metrics, employees also contribute valuable engineering data and expertise to develop safety manuals and procedures used by field crews.
OBJECTIVES l Integrate all value-added assets into risk-based methodologies to strategically
inform capital investments
l Maximize value of assets
l Correlate asset risk to transmission resilience
l Use asset performance data to inform best maintenance practices
PRIORITIES l Strategically source, collect and use data to inform investment decisions
l Validate data
l Effectively communicate data internally and externally
CONTENTSAbout Asset Management 1
WAPA assets at a glance 2
Asset performance data 3
10-year asset investment projection 10
10-year health and risk projection 11
Reliability-centered maintenance 12
Data communication 15
Data validation 15
Asset Management objectives 16
2 VALUE OF ASSET MANAGEMENT 2018
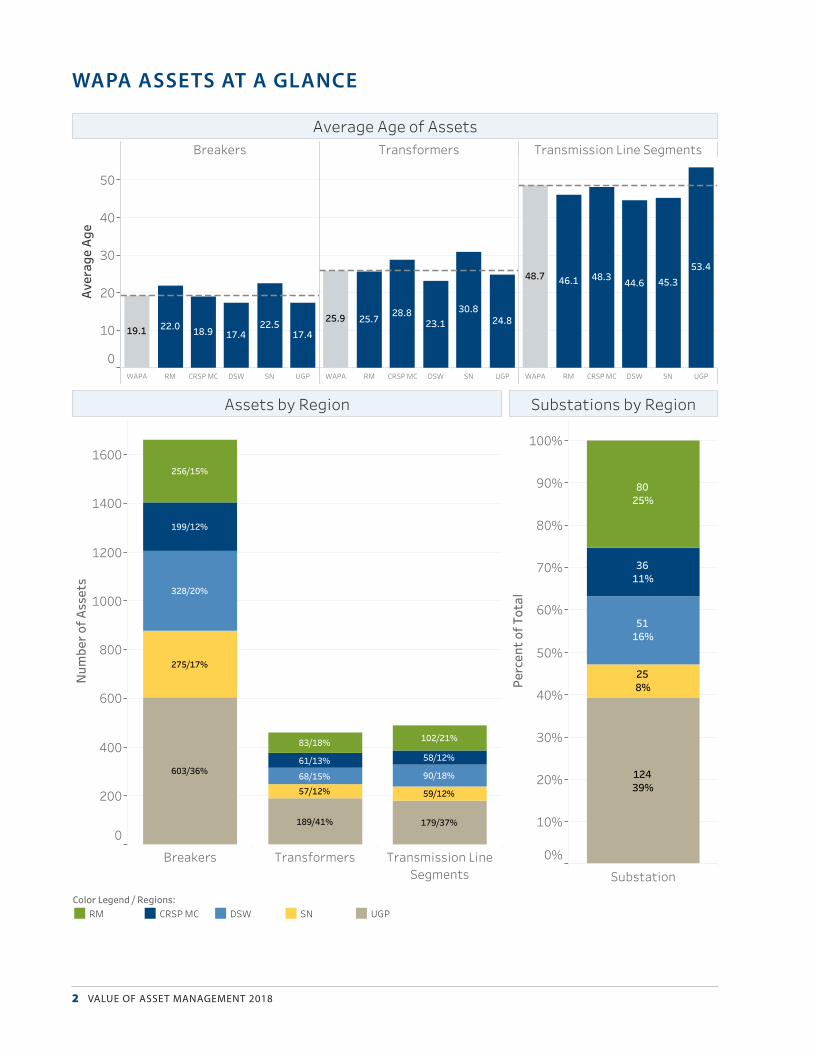
WAPA ASSETS AT A GLANCEOverview of WAPA Assets
Breakers Transformers Transmission LineSegments
0
200
400
600
800
1000
1200
1400
1600
Num
ber o
f Ass
ets
256/15%
102/21%
199/12%
328/20%
275/17%
603/36%
189/41% 179/37%
83/18%
61/13% 58/12%
68/15% 90/18%
57/12% 59/12%
Assets by Region
Breakers Transformers Transmission Line Segments
WAPA RM CRSP MC DSW SN UGP WAPA RM CRSP MC DSW SN UGP WAPA RM CRSP MC DSW SN UGP
0
10
20
30
40
50
Aver
age
Age
19.1 22.0 18.9 17.422.5
17.4
25.9 25.7 28.823.1
30.824.8
48.7 46.1 48.3 44.6 45.353.4
Average Age of Assets
Substation
0%
10%
20%
30%
40%
50%
60%
70%
80%
90%
100%
Perc
ent o
f Tot
al
8025%
3611%
5116%
12439%
258%
Substations by Region
Color Legend / Regions:RM CRSP MC DSW SN UGP
WESTERN AREA POWER ADMINISTRATION 3
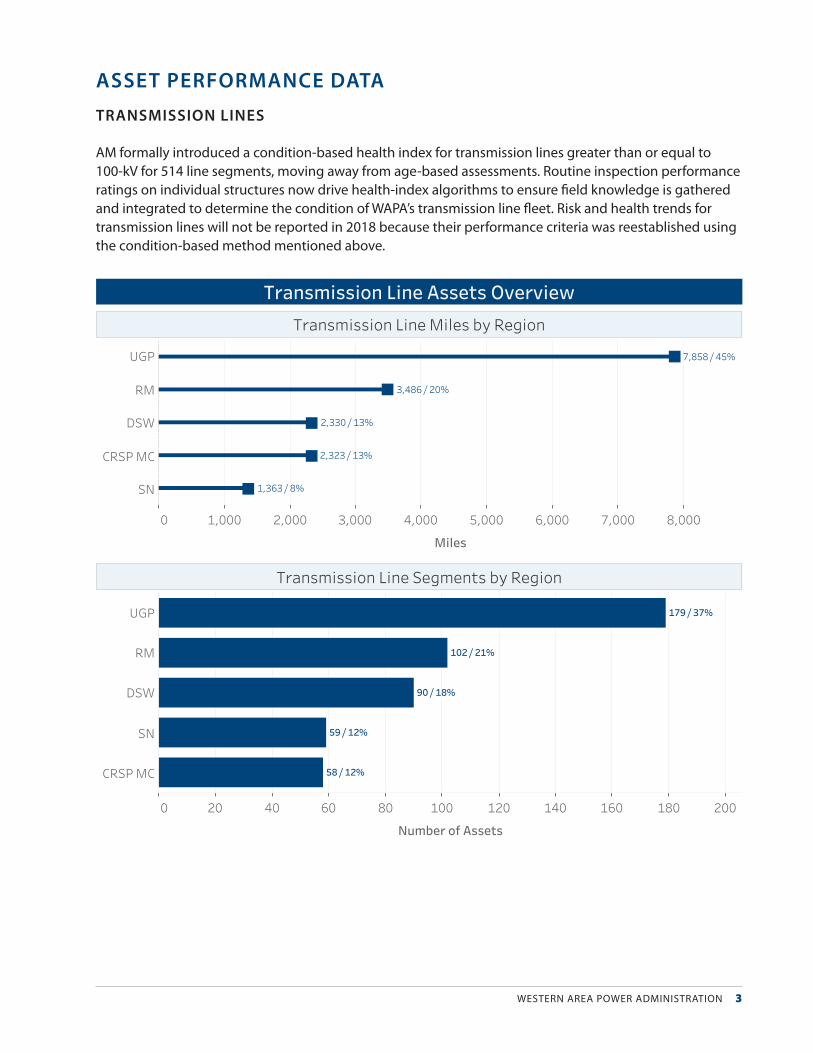
ASSET PERFORMANCE DATA
TRANSMISSION LINES
AM formally introduced a condition-based health index for transmission lines greater than or equal to 100-kV for 514 line segments, moving away from age-based assessments. Routine inspection performance ratings on individual structures now drive health-index algorithms to ensure field knowledge is gathered and integrated to determine the condition of WAPA’s transmission line fleet. Risk and health trends for transmission lines will not be reported in 2018 because their performance criteria was reestablished using the condition-based method mentioned above.
Transmission Line Assets Overview
0 1,000 2,000 3,000 4,000 5,000 6,000 7,000 8,000
Miles
UGP
RM
DSW
CRSP MC
SN
7,858 / 45%
3,486 / 20%
2,330 / 13%
2,323 / 13%
1,363 / 8%
Transmission Line Miles by Region
0 5 10 15 20 25 30 35 40 45 50 55
Years
UGP
WAPA
CRSP MC
RM
SN
DSW
53.4
48.7
48.3
46.1
45.3
44.6
Average Age of Transmission Lines
0 20 40 60 80 100 120 140 160 180 200
Number of Assets
UGP
RM
DSW
SN
CRSP MC
179 / 37%
102 / 21%
90 / 18%
59 / 12%
58 / 12%
Transmission Line Segments by Region

4 VALUE OF ASSET MANAGEMENT 2018
Transmission Line Assets Overview
0 1,000 2,000 3,000 4,000 5,000 6,000 7,000 8,000
Miles
UGP
RM
DSW
CRSP MC
SN
7,858 / 45%
3,486 / 20%
2,330 / 13%
2,323 / 13%
1,363 / 8%
Transmission Line Miles by Region
0 5 10 15 20 25 30 35 40 45 50 55
Years
UGP
WAPA
CRSP MC
RM
SN
DSW
53.4
48.7
48.3
46.1
45.3
44.6
Average Age of Transmission Lines
0 20 40 60 80 100 120 140 160 180 200
Number of Assets
UGP
RM
DSW
SN
CRSP MC
179 / 37%
102 / 21%
90 / 18%
59 / 12%
58 / 12%
Transmission Line Segments by Region
Transmission Lines Maintenance Items
0 5,000 10,000
Hours
$0.5M $1.0M $1.5M $2.0MCost
VEG MGMT
CLEARANCE
LOOSE
EXTERNAL - STORM
TESTING
DEGRADED
FOLLOW-UP /INSPECTION
FAILURE
DAMAGED
SWITCHING
Commentary:Chart above currently excludes "UNKNOWN," which accounts for88,234 Hours and $16.8M in costs. "UNKNOWN" will beresolved with improved failure coding, which is already in progress.
Color Legend / Measure:Total CostTotal Hours
Total HoursTotal Cost $24,914,852
128,818

WESTERN AREA POWER ADMINISTRATION 5
TRANSFORMERS
The asset class of transformers includes power transformers, grounding transformers, oil-filled reactors and phase-shifting transformers. Single-phase assets are typically considered stand-alone assets when part of a three-phase bank.
Transformer Assets Overview
0 2 4 6 8 10 12 14 16 18 20 22 24 26 28 30 32
Years
SN
CRSP MC
WAPA
RM
UGP
DSW
30.8
28.8
25.9
25.7
24.8
23.1
Average Age of Transformers
0 20 40 60 80 100 120 140 160 180 200
Number of Assets
UGP
RM
DSW
CRSP MC
SN
189 / 41%
83 / 18%
68 / 15%
61 / 13%
57 / 12%
Transformer Count by Region

6 VALUE OF ASSET MANAGEMENT 2018
Transformer Assets: Risk and Health Index Overview
2015 2016 2017 2018
0
10
20
30
40
Num
ber o
f Ass
ets
43
2927
25
Trend: Exceeds Risk Threshold > 2
2015 2016 2017 2018
0
5
10
15
Risk
Sco
re
Dispersion: Exceeds Risk Threshold > 2
2015 2016 2017 2018
-1
0
1
2
3
4
Num
ber o
f Ass
ets
3 3
1
2
Zero trend represents RMR, CRSP and DSW
Trend: Below Health Index Threshold < 50
2015 2016 2017 2018
0
10
20
30
40
50
Hea
lth
Inde
x
Dispersion: Below Health Index Threshold < 50
Commentary:Four out of the five regions have historically maintained a handful oftransformers above the risk threshold, while significant improvementscan be seen in UGP as it approaches a similar count to other regions in2018. Risk is typically adjusted by replacing an unhealthy asset oradding a redundant unit.
Commentary:Median risk scores, identifiable by the middle of the shaded area, havebeen between 4.50 to 5.50 over the most recent 4-year period. Of thefive regions, RMR's risk scores have consistently been on the upperrange, within the 4th quartile.
Commentary:Few transformers have historically fallen below the Health Indexthreshold of 50. Currently, only two transformers are below thisthreshold in 2018, one each within the SNR and UGP regions.Transformer health changes annually based on maintenance practicesto mitigate health.
Commentary:Transformer assets typically float between 40 and 50, when indeedbelow the threshold for Health Index. However, in 2018, one asset has ascore of 25 and outside the norm when looking at the last 4 years.
Color Legend / Regions:RMR CRSP DSW SNR UGP
Transformer Assets: Risk and Health Index Overview
2015 2016 2017 2018
0
10
20
30
40
Num
ber o
f Ass
ets
43
2927
25
Trend: Exceeds Risk Threshold > 2
2015 2016 2017 2018
0
5
10
15
Risk
Sco
re
Dispersion: Exceeds Risk Threshold > 2
2015 2016 2017 2018
-1
0
1
2
3
4
Num
ber o
f Ass
ets
3 3
1
2
Zero trend represents RMR, CRSP and DSW
Trend: Below Health Index Threshold < 50
2015 2016 2017 2018
0
10
20
30
40
50
Hea
lth
Inde
x
Dispersion: Below Health Index Threshold < 50
Color Legend / Regions:RM CRSP MC DSW SN UGP

WESTERN AREA POWER ADMINISTRATION 7
Transformer Maintenance ItemsTransformer Maintenance Items
0 1,000 2,000 3,000Hours
$0K $200K $400KCost
UNKNOWN
OTHER
CONTAMINATION
BUSHING
GASSING
LEAK
OIL
DGA
PROT ALRM-DEVICE
NITROGEN
PF
Power Transformers
0 500 1,000Hours
$0K $100K $200KCost
UNKNOWN
FAILURE
BUSHINGS
LEAK
MAINTENANCE
LTC
OTHER
TRIP/LOCKOUT
EXTERNAL -VANDALISM
NITROGEN
Mobile Transformers
Commentary:Failure refers to a bushing failure.
Color Legend / Measure:Total CostTotal Hours
Commentary:"UNKNOWN" will be resolved with improved failure coding, which isalready in progress.
0 100 200 300Hours
$0K $50K $100K $150KCost
LEAK
UNKNOWN
OTHER
OIL
TRIP/LOCKOUT
PROT ALRM-DEVICE
NITROGEN
GROUNDING
FUSE-CIRCUITBREAKER
FOLLOW-UP /INSPECTION
Oil Filled Reactors
0 100 200 300 400Hours
$0K $25K $50K $75KCost
OIL
UNKNOWN
FAILURE
PROTALRM-DEVICE
DGA
OTHER
Phase-Shifting Transformers
Total HoursTotal Cost $2,049,620
12,400
Total HoursTotal Cost $253,477
908 Total HoursTotal Cost $211,854
602
Total HoursTotal Cost $464,227
2,943

8 VALUE OF ASSET MANAGEMENT 2018
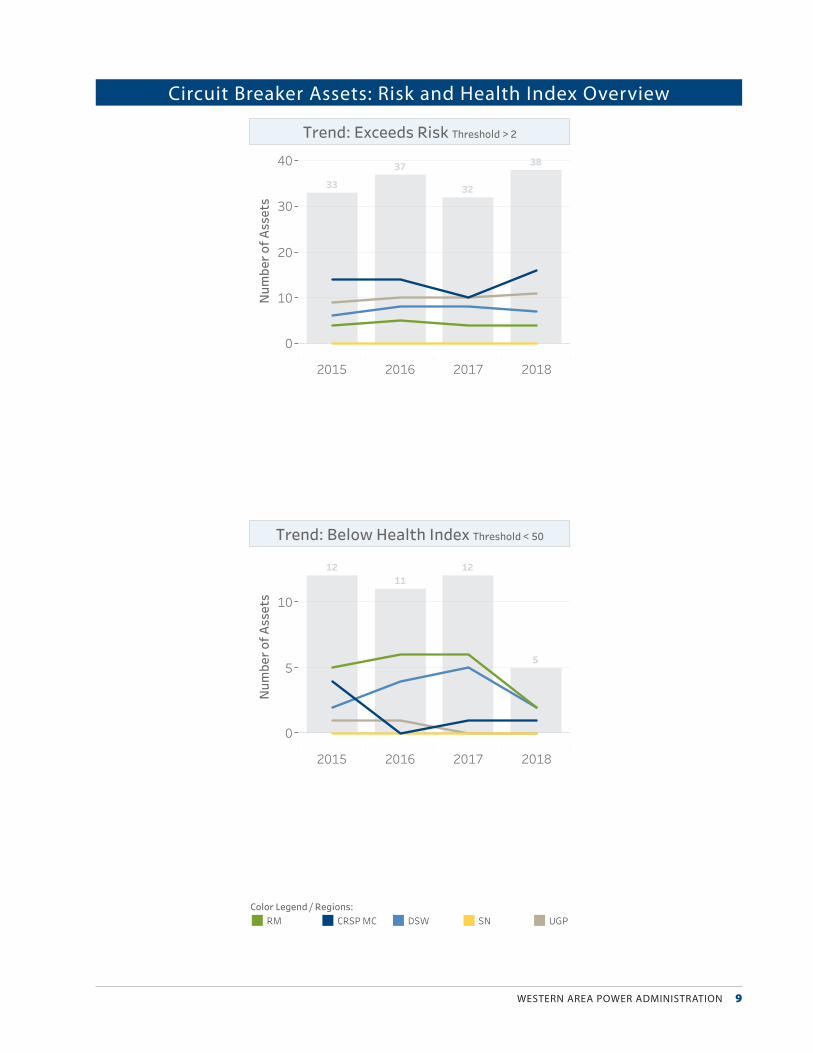
POWER CIRCUIT BREAKERS
The circuit breaker asset class includes all oil, gas, air and vacuum breakers operated at greater than or equal to 100-kV.
Breaker Assets Overview
0 2 4 6 8 10 12 14 16 18 20 22 24
Years
SN
RM
WAPA
CRSP MC
DSW
UGP
22.5
22.0
19.1
18.9
17.4
17.4
Average Age of Breakers
0 50 100 150 200 250 300 350 400 450 500 550 600 650
Number of Assets
UGP
DSW
SN
RM
CRSP MC
603 / 36%
328 / 20%
275 / 17%
256 / 15%
199 / 12%
Breaker Count by Region
WESTERN AREA POWER ADMINISTRATION 9
Breaker Assets: Risk and Health Index Overview
2015 2016 2017 2018
0
10
20
30
40
Num
ber o
f Ass
ets
33
37
32
38
Trend: Exceeds Risk Threshold > 2
2015 2016 2017 2018
0
5
10
15
20
Risk
Sco
re
Dispersion: Exceeds Risk Threshold > 2
2015 2016 2017 2018
0
5
10
Num
ber o
f Ass
ets
1211
12
5
Trend: Below Health Index Threshold < 50
2015 2016 2017 2018
0
10
20
30
40
50
Hea
lth
Inde
x
Dispersion: Below Health Index Threshold < 50
Color Legend / Regions:RM CRSP MC DSW SN UGP
Circuit Breaker Assets: Risk and Health Index Overview
10 VALUE OF ASSET MANAGEMENT 2018
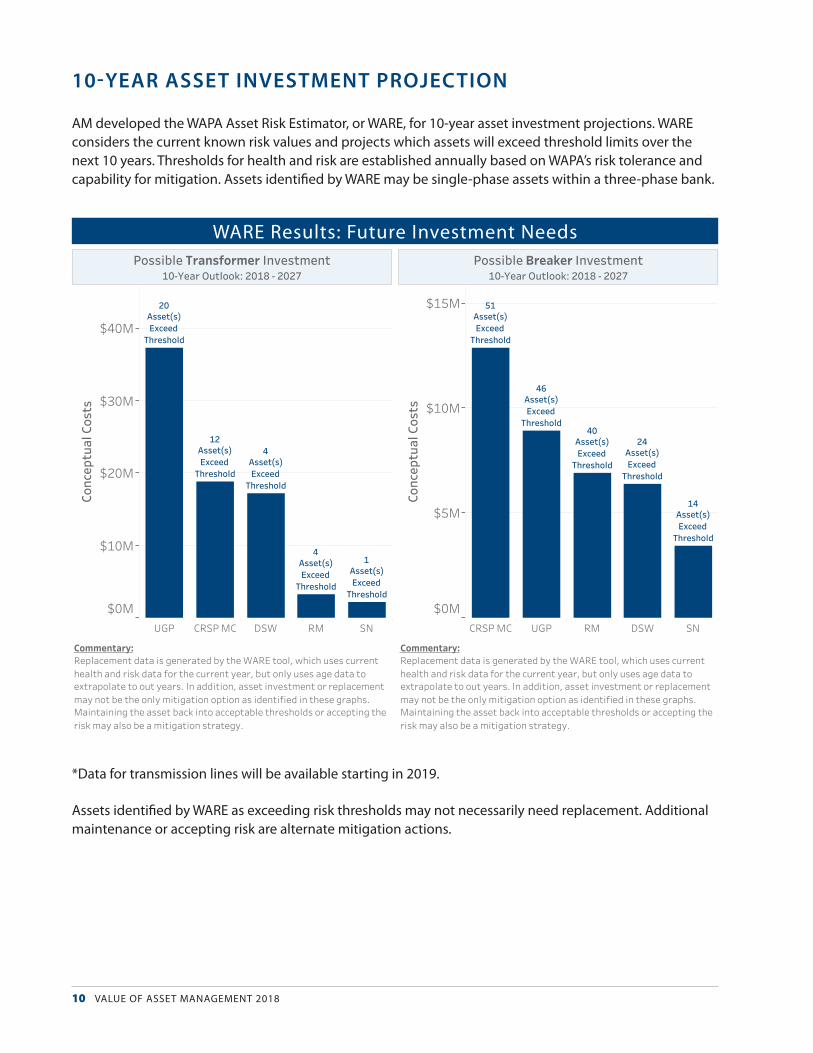
10-YEAR ASSET INVESTMENT PROJECTION
AM developed the WAPA Asset Risk Estimator, or WARE, for 10-year asset investment projections. WARE considers the current known risk values and projects which assets will exceed threshold limits over the next 10 years. Thresholds for health and risk are established annually based on WAPA’s risk tolerance and capability for mitigation. Assets identified by WARE may be single-phase assets within a three-phase bank.
WARE Results: Possible Future Investment Needs
Commentary:Replacement data is generated by the WARE tool, which uses currenthealth and risk data for the current year, but only uses age data toextrapolate to out years. In addition, asset investment or replacementmay not be the only mitigation option as identified in these graphs.Maintaining the asset back into acceptable thresholds or accepting therisk may also be a mitigation strategy.
Commentary:Replacement data is generated by the WARE tool, which uses currenthealth and risk data for the current year, but only uses age data toextrapolate to out years. In addition, asset investment or replacementmay not be the only mitigation option as identified in these graphs.Maintaining the asset back into acceptable thresholds or accepting therisk may also be a mitigation strategy.
UGP CRSP MC DSW RM SN
$0M
$10M
$20M
$30M
$40M
Conc
eptu
al C
osts
20Asset(s)ExceedThreshold
12Asset(s)ExceedThreshold
4Asset(s)ExceedThreshold
4Asset(s)ExceedThreshold
1Asset(s)ExceedThreshold
Possible Transformer Investment10-Year Outlook: 2018 - 2027
CRSP MC UGP RM DSW SN
$0M
$5M
$10M
$15M
Conc
eptu
al C
osts
51Asset(s)ExceedThreshold
46Asset(s)ExceedThreshold
40Asset(s)ExceedThreshold
24Asset(s)ExceedThreshold
14Asset(s)ExceedThreshold
Possible Breaker Investment10-Year Outlook: 2018 - 2027
*Data for transmission lines will be available starting in 2019.
Assets identified by WARE as exceeding risk thresholds may not necessarily need replacement. Additional maintenance or accepting risk are alternate mitigation actions.
WARE Results: Future Investment Needs

WESTERN AREA POWER ADMINISTRATION 11
10-YEAR HEALTH AND RISK PROJECTION
Assets that fall outside of the established thresholds are identified for mitigation actions.
The graphs below show a projection of health and risk for the respective assets if current thresholds are maintained.
Risk and Health Index Forecast
Commentary:If the current risk thresholds remain at current set points, risk scorestrend upwards. Reducing the current thresholds may be a solution tothe climbing trend.
Commentary:Health forecasts remain steady and no adjustments to thresholds maybe necessary.
Commentary:If the current risk thresholds remain at current set points, risk scorestrend upwards. Reducing the current thresholds may be a solution tothe climbing trend.
Commentary:Health forecasts remain steady and no adjustments to thresholds maybe necessary.
2018
2019
2020
2021
2022
2023
2024
2025
2026
2027
0.05
0.10
0.15
0.20
0.25
0.30
Risk
Sco
re
Transformer Risk Score Forecast
2018
2019
2020
2021
2022
2023
2024
2025
2026
2027
85
86
87
88
89
90
91
92
Hea
lth
Inde
x
Transformer Health Index Forecast
2018
2019
2020
2021
2022
2023
2024
2025
2026
2027
0.050.100.150.200.250.300.350.40
Risk
Sco
re
Breaker Risk Score Forecast
2018
2019
2020
2021
2022
2023
2024
2025
2026
2027
83
84
85
86
87
88
Hea
lth
Inde
x
Breaker Health Index Forecast
AverageMedian
Risk and Health Index Forecast
Commentary:If the current risk thresholds remain at current set points, risk scorestrend upward. Reducing the current thresholds may be a solution to theclimbing trend.
Commentary:Health forecasts remain steady and no adjustments to thresholds maybe necessary.
Commentary:If the current risk thresholds remain at current set points, risk scorestrend upward. Reducing the current thresholds may be a solution to theclimbing trend.
Commentary:Health forecasts remain steady and no adjustments to thresholds maybe necessary.
2018
2019
2020
2021
2022
2023
2024
2025
2026
2027
0.05
0.10
0.15
0.20
0.25
0.30
Risk
Sco
re
Transformer Risk Score Forecast
2018
2019
2020
2021
2022
2023
2024
2025
2026
2027
85
86
87
88
89
90
91
92
Hea
lth
Inde
x
Transformer Health Index Forecast
2018
2019
2020
2021
2022
2023
2024
2025
2026
2027
0.050.100.150.200.250.300.350.40
Risk
Sco
re
Breaker Risk Score Forecast
2018
2019
2020
2021
2022
2023
2024
2025
2026
2027
83
84
85
86
87
88
Hea
lth
Inde
x
Breaker Health Index Forecast
AverageMedian
Risk and Health Index Forecast
Commentary:If the current risk thresholds remain at current set points, risk scorestrend upwards. Reducing the current thresholds may be a solution tothe climbing trend.
Commentary:Health forecasts remain steady and no adjustments to thresholds maybe necessary.
Commentary:If the current risk thresholds remain at current set points, risk scorestrend upwards. Reducing the current thresholds may be a solution tothe climbing trend.
Commentary:Health forecasts remain steady and no adjustments to thresholds maybe necessary.
2018
2019
2020
2021
2022
2023
2024
2025
2026
2027
0.05
0.10
0.15
0.20
0.25
0.30
Risk
Sco
re
Transformer Risk Score Forecast
2018
2019
2020
2021
2022
2023
2024
2025
2026
2027
85
86
87
88
89
90
91
92
Hea
lth
Inde
x
Transformer Health Index Forecast20
18
2019
2020
2021
2022
2023
2024
2025
2026
2027
0.050.100.150.200.250.300.350.40
Risk
Sco
re
Breaker Risk Score Forecast
2018
2019
2020
2021
2022
2023
2024
2025
2026
2027
83
84
85
86
87
88
Hea
lth
Inde
x
Breaker Health Index Forecast
AverageMedian

12 VALUE OF ASSET MANAGEMENT 2018
RELIABILITY-CENTERED MAINTENANCE
Reliability-centered maintenance, or RCM, is a systematic approach to routine maintenance that focuses on preserving important power system equipment functions. WAPA’s RCM program is based on studies that technically evaluate equipment failure modes and causes as well as identify ways these failures can be prevented. The outcome of these studies are lists of preventive maintenance tasks to be performed at specified time intervals on substation equipment and transmission lines. Spikes in Sierra Nevada regional data are due to the Carr Fire.
Crew Hours Overview as of FYE 2018
Commentary:This is a graphical representation of the percent of time crews in eachregion and WAPA as a whole perform direct work on WAPA assets(wrench time). Wrench time includes preventive maintenance,emergency maintenance, reactive maintenance, correctivemaintenance, construction, operations support, and minor additions,enhancements, and retirements. A goal of 60 % or higher has beenestablished based on industry trending. Maximizing crew time forperforming direct work is a measure of resource managementeffectiveness.
Commentary:This is a graphical representation of the total percent of time thatcrews in each region and WAPA as a whole perform emergency andcorrective maintenance on WAPA assets. A goal of 16% or less has beenestablished based on industry trending. Capturing this metric providesan indication of the overall effectiveness of the Reliability-CenteredMaintenance program. A poor maintenance program would result in anincrease of crew time expended on failing equipment, although in somecases emergency and corrective maintenance may be attributed tocauses beyond RCM control.
50%
55%
60%
65%
70%68%67%
69%
72%
64%
Minimum Threshold
Percent Direct2-Yr Trend of the 4-Qtr Moving Average
0%
5%
10%
15%
3%
4%3%
10%
4%
Maximum Threshold
Percent Repair2-Yr Trend of the 4-Qtr Moving Average
Color Legend / Regions:RM DSW SN UGP WAPA

WESTERN AREA POWER ADMINISTRATION 13
Crew Hours Overview as of FYE 2018
Commentary:This is a graphical representation of the total percent of time thatcrews in each region and WAPA as a whole perform administrativeduties. Administrative duties include performing “paperwork” such asdrawing updates, general engineering support, credit cardreconciliation, timekeeping, as well as human resource-related dutiesincluding training, attending meetings, union activities, safety andsecurity investigations and environmental inspections. Although nohard goal has been established, 25% or less is considered acceptable onaccount of the amount of training and compliance activities (safety,environmental, NERC, WECC, etc.) are imposed on maintenance craftforces. Minimizing administrative duties of craft personnel results inbetter use of the employee skillset.
Commentary:This is a graphical representation of the total percent of time thatcrews in each region and WAPA as a whole perform any work while inovertime. Although there is no set goal for this metric, tracking percentovertime gives a fair indication of resource (FTE) needs and systemhealth, as typical emergency-type work is unscheduled and often timeseither starts and/or ends during typical non-working hours (overtime).It is worth noting that weather as well as othernon-maintenance-related emergencies are also captured in this metricsuch as the Carr Fire in Sierra Nevada that burned in Shasta and Trinitycounties in California, which resulted in a spike in overtime formaintenance crews to respond to system needs.
0%
5%
10%
15%
20%
25%
15%
12%
21%
16%
11%
Percent Administrative2-Yr Trend of the 4-Qtr Moving Average
0%
5%
10%
15%
12%11%11%
16%
13%
Percent Overtime2-Yr Trend of the 4-Qtr Moving Average
Crew Hours Overview as of FYE 2018
Commentary:This is a graphical representation of the percent of time crews in eachregion and WAPA as a whole perform direct work on WAPA assets(wrench time). Wrench time includes preventive maintenance,emergency maintenance, reactive maintenance, correctivemaintenance, construction, operations support, and minor additions,enhancements, and retirements. A goal of 60 % or higher has beenestablished based on industry trending. Maximizing crew time forperforming direct work is a measure of resource managementeffectiveness.
Commentary:This is a graphical representation of the total percent of time thatcrews in each region and WAPA as a whole perform emergency andcorrective maintenance on WAPA assets. A goal of 16% or less has beenestablished based on industry trending. Capturing this metric providesan indication of the overall effectiveness of the Reliability-CenteredMaintenance program. A poor maintenance program would result in anincrease of crew time expended on failing equipment, although in somecases emergency and corrective maintenance may be attributed tocauses beyond RCM control.
50%
55%
60%
65%
70%68%67%
69%
72%
64%
Minimum Threshold
Percent Direct2-Yr Trend of the 4-Qtr Moving Average
0%
5%
10%
15%
3%
4%3%
10%
4%
Maximum Threshold
Percent Repair2-Yr Trend of the 4-Qtr Moving Average
Color Legend / Regions:RM DSW SN UGP WAPA
14 VALUE OF ASSET MANAGEMENT 2018
0% 1% 2% 3% 4% 5% 6% 7%
% of [RM+CM+EM] Costs ($32.2M)
Transformer
Gas Breaker
DC Systems
Mobile Trans.
Oil Breaker
Switch
CT/PT/CCVT
INTERPTR
Oil Reactor
Phase Shifter
Cap Bank
Mobile Cap Bank
Vacuum Breaker
Arrester
Air Reactor
Air Breaker
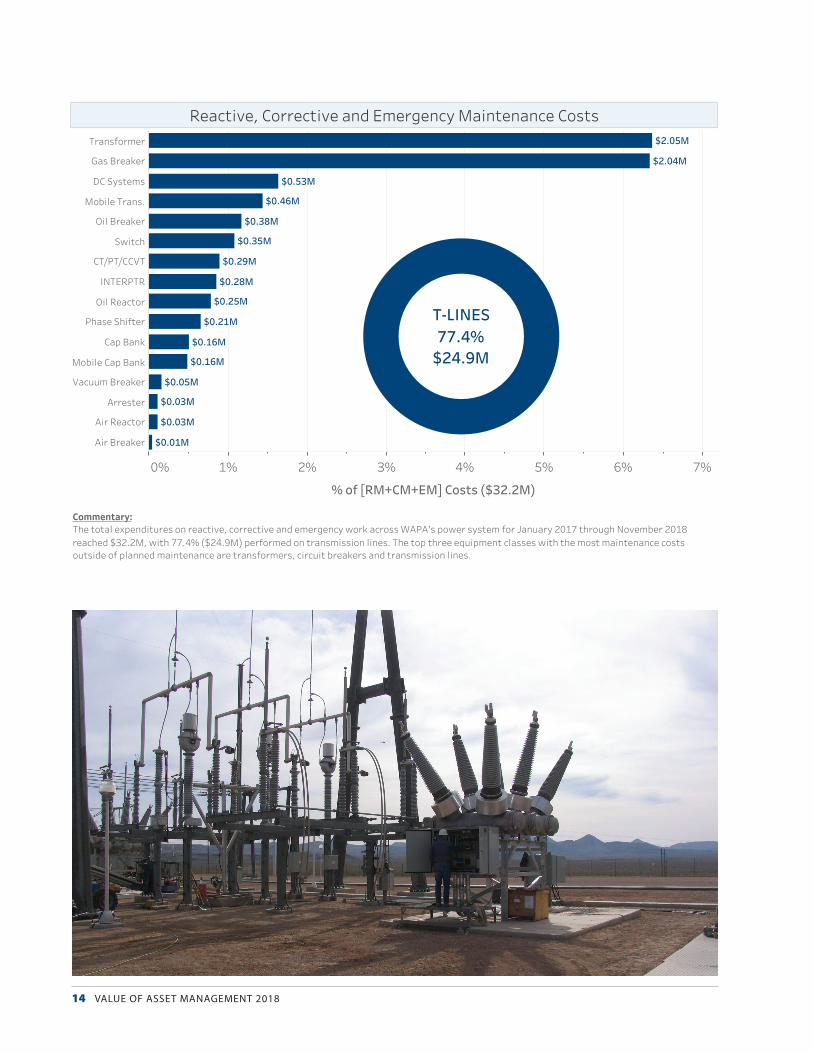
$2.05M
$2.04M
$0.53M
$0.46M
$0.38M
$0.35M
$0.29M
$0.28M
$0.25M
$0.21M
$0.16M
$0.16M
$0.05M
$0.03M
$0.03M
$0.01M
Reactive, Corrective and Emergency Maintenance Costs
Commentary:The total expenditures on reactive, corrective and emergency work across WAPA’s power system for January 2017 through November 2018reached $32.2M, with 77.4% ($24.9M) performed on transmission lines. The top three equipment classes with the most maintenance costsoutside of planned maintenance are transformers, circuit breakers and transmission lines.
T-LINES77.4%
$24.9M

WESTERN AREA POWER ADMINISTRATION 15
DATA COMMUNICATION
AM must effectively communicate data to stakeholders who use the information to inform their business and capital planning decisions. To ensure strategic communication, an Asset Management Communication Plan is used. This plan identifies all stakeholder groups and assigns roles and responsibilities for executing key communication needs. Stakeholder groups include:
INTERNAL l Senior Leadership Team
l Regional rate-setting organizations
l Financial Leadership Council
l Power Marketing Management Council
l Power System Operations Council
l WAPA Maintenance Management Council
l Information Technology Senior Leadership Team
l Acquisition Collaboration Team
l Regional Asset Management specialists
l HQ Asset Management specialists
l Regional capital planning groups
EXTERNAL l Regional customer groups
l Customer representatives
l North American Transmission Forum
l Electric Power Research Institute
l Regional capital planning groups
l Technical committees
l Engineering and operating committees
DATA VALIDATION
Accurate and current asset management data is important to achieve the confidence required by stakeholders. Validating data is carried out in two ways: qualitatively and quantitatively.
l Incorrect data and missing data reports are prepared monthly to identify gaps in asset data that may be driving incorrect asset health or risk scores
l Asset management data is validated with knowledgeable field crews to ensure asset scoring is representative of true field conditions
16 VALUE OF ASSET MANAGEMENT 2018
ASSET MANAGEMENT OBJECTIVES
NEAR TERM l Strategically add asset classes to the AM portfolio in support of regional capital
investment needs
l Communicate asset management data analyses to stakeholders
l Create more intuitive and informational displays to share asset management data
l Gain better understanding of the causes of planned reactive, unplanned corrective and emergency maintenance that is occurring between preventative maintenance cycles
LONG TERM l Integrate asset health for condition-based maintenance activities
l Streamline collection of asset and maintenance data from field crews and operational systems
l Integrate artificial intelligence into data gathering, validation and analysis
l Implement full lifecycle management of assets

WESTERN AREA POWER ADMINISTRATION 17
CONTACT AM
Asset Management Program
Western Area Power Administration
www.wapa.gov/About/Pages/asset-management
Chris Lyles, VP of Asset Management
720.962.7249

ENERGYU.S. DEPARTMENT OF
WESTERN AREA POWER ADMINISTRATIONP.O. Box 281213
Lakewood, CO 80228-8213www.wapa.gov
Western AreaPower Administration