value chain analysis for the ntt coffee industry2007... · belu, and kota kupang. the demographics...
TRANSCRIPT

IFC SADI Agri Sectors
Value Chain Analysis for
The NTT Coffee Industry
May 2007

Value chain analysis for SADI agri sectors The NTT Coffee Industry
Report Authors:
Nick Giera and Jock Struthers: Nimmo-Bell , Wellington and Hawkes Bay, New Zealand Disclaimer
Disclaimer While every effort has been made to ensure the accuracy of information in this report, no liability is accepted for errors of fact or opinion, or for any loss or damage resulting from reliance on, or the use of, the information it contains. This report is for the use of the International Finance Corporation (IFC) and is not to be disclosed to third parties without their consent.

Value chain analysis for SADI agri sectors The NTT Coffee Industry
Table of Contents Executive Summary .................................................................................................... 1 1. Indonesia within the global coffee industry .................................................... 10 2. Size and structure of the NTT coffee industry ................................................ 13 3. Productivity and performance of NTT coffee industry .................................. 15 4. Market conditions for the NTT coffee industry .............................................. 19 5. Coffee industry supporting structures and related industries ....................... 28 6. Value chain cost analysis ................................................................................. 29 7. NTT coffee product value chain table – from smallholder perspective .......... 33 8. Summary of industry potential, issues and recommendations ...................... 40 Appendix 1 Wet coffee bean processing ................................ ................................ ....................... 45 Dried coffee bean processing .................................................................................... 46 List of people met ...................................................................................................... 47

Value chain analysis for SADI agri sectors The NTT Coffee Industry
______________________________________________________________________________ 1
Executive Summary NTT Coffee Industry: Summary of Industry Potential, Issues and Recommendations Industry Potential The sector profile and value chain cost analysis identifies the potential for improved smallholder coffee returns. The main factors that give the NTT province potential in this regard are summarised below. • Indonesian coffee has natural low acidity and high body flavour due to the soils and
climate. This style is different to the natural high acidity-low body coffee produced in Brazil and Central America. Consumers in the largest export market (USA) prefer the Indonesian style putting the industry in a favourable position. One of the main barriers to increasing exports is the wide range in quality, largely due to poor on-farm post harvest practices.
• There has already been interest shown in parts of NTT, namely Flores, as a region
producing distinctive flavoured “Juria” Arabica coffee and will invest in developing and improving supply in the region (Flores is 35-40% Juria). The nature of Flores soils, climate, tree varieties and climates in growing areas give coffee this distinctive flavour. Small volumes of Grade 1 coffee were exported from Ngada in 2006 for Rp 24,000 kg, over 30 percent higher than equivalent coffee from other regions.
• There may be potential for other parts of NTT (e.g., Sumba) to also take advantage
of this opportunity to supply lead firms such as Starbucks for the benefit of smallholders.
• The mountain climate in some areas reduce pest and disease challenge and current
production practices have very low inputs. This production system produces a heavier bean (favoured by buyers and receiving 10% better price for parchment) and would make the transition to organic production and certification relatively smooth if viable market opportunities became available.
• There are areas of undeveloped land that could potentially be planted in coffee and
areas that require rehabilitation that would increase the region’s total production. • Smallholder farm gate prices are affected by world prices. World coffee prices are
currently strong, supported by high demand for mild flavoured coffees such as Arabica. The demand for specialty and differentiated coffee is growing rapidly. The short to medium term price outlook is favourable for these styles.
• The analysis shows that there is potential to lift smallholder returns by improving
post harvest fermentation practices and working with existing buying groups (e.g., Komodo Jaya) to improve smallholder returns.
Value chain analysis for SADI agri sectors The NTT Coffee Industry
______________________________________________________________________________ 2
• Anecdotal evidence suggests that farmers could improve returns by increasing
yields of Arabica and Robusta varieties with improved access to finance for inputs and crop husbandry.
Industry Issues and Value Chain Analysis The following points summarise the main issues for the coffee industry, as they relate to the needs of smallholders.
• Current coffee crop yields are low due to a lack of tree management and pruning,
reducing yields and producers returns. In lowland areas farmers lack an understanding of pest and disease management and access to inputs to lift yields and bean quality.
• The quality of bean and parchment sold by farmers varies greatly between villages
and seasons and is also affected by poor post harvest practices. The variation in bean quality forces traders to use mixing practices that reduce the overall farm gate price.
• Farmers in upland areas rely heavily on Arabica coffee for cash income (proximity
to markets and limited arable land limits other cash enterprises). Farmers relying on coffee for cash income are exposed to the risk of poor coffee yields due to changeable seasonal weather. Anecdotal evidence suggests that weather patterns are becoming less predictable.
• There is no ‘open market’ for smallholders to sell coffee and the practice of making
50 percent advance payments through collectors (Ijon) can result in a lack of transparency on the final price. Anecdotal evidence suggests that the “Ijon” (and final price) can depend on how urgently the smallholder needs the money.
• A risk for the Indonesian industry is the current lack of processing capacity to
handle increasing volumes of coffee being produced. This puts the industry at risk of developing a reputation as low quality producer.
• The local port of Reo doesn’t have a container ship facility so coffee must be shipped
in sacks to Makassar (for current speciality buyer) and containerised there before export.
• Current post harvest practices mean that parchment must be dried and sold within a
few days otherwise beans developed a “musty” taint. Improved drying practices (drying parchment down to 12% moisture) reduce the need for farmers to immediately sell coffee and provide farmers with more flexible marketing options.
• There are currently no local institutions able to ensure the geographical authenticity
of NTT coffee exported under a specific geographical identity such as “Flores

Value chain analysis for SADI agri sectors The NTT Coffee Industry
______________________________________________________________________________ 3
Coffee”. Despite place names being the main point of quality differentiation for importers and roasters in export markets (according to previous studies), place names are applied to coffee at the site of export and is to a large extent, arbitrary. Recent moves by corporate coffee buyers to establish geographical identity for Flores Coffee (primarily Starbucks and the use of FairTrade certification) appear to be positive steps in ensuring that price premiums reach producers.
• The coffee supply chain is relatively efficient although current collector and trader
handling practices (e.g., poor processing, mixing coffee grades) distort price-quality signals and reduce the incentive for most farmers to undertake best practice post-harvest handling.
• Current post harvest practices promoted by Indonesian Centre of Coffee and Cocoa
Research (Jember) are not favoured by private sector buyers. • NTT coffee producers are susceptible to world price fluctuations in world
commodity markets for green bean coffee. • The current mixed quality of coffee produced in NTT makes farmers susceptible to
heavy price discounts from collectors and traders and puts them in a weak selling position.
• Smallholders face a number of other barriers to improving returns associated with
supporting structures and related industries: - Farmers have little or no access to working capital to purchase necessary agri-
inputs in a timely manner; - Low availability of improved seedlings to begin a cycle of replacing old and
senile trees; - A low level of extension services provided by government Ministry of
Agriculture or DINAS;
Recommendations for IFC TA
The following points summarise the key recommendations that arise out of the value chain analysis and field research. The recommendations are aimed at improving smallholder returns through a long-term (3-10 year) Technical Assistance (TA) program.
• Work with existing buying groups and processors (e.g., Lion Lestari) to expand Flores operation and/or replicate farmers accreditation and improved post harvest practices in Sumba.
• Provide business development services to the Komodo Jaya buying group to
manage current financial and operational problems and improve its level of service to smallholders.
• Include risk management strategies for farmers in demonstration and improved
practices programme such as having a mix of Robusta and Arabica trees. This

Value chain analysis for SADI agri sectors The NTT Coffee Industry
______________________________________________________________________________ 4
can help to manage market (price fluctuations) and production risks that can result from unseasonably wet or dry weather at flowering. An unseasonably wet flowering season has the opposite effect on Robusta as it does on Arabica. Having a mix of Arabica and Robusta coffee can be a good way for farmers to manage this risk.
• Undertake further research into the home consumption and cash income needs
of smallholders in coffee producing areas so that IFC TA can be directed at reducing smallholder-dependence on coffee for income by developing other potential crops/enterprises.
• Undertake further research into the environmental sustainability of the current
coffee producing practices to minimise environmental degradation and ensure farmers have long-term future in economically viable coffee growing.
• Improve smallholders’ access to working capital by assisting the development of
improved farmer loan capacity within local banks and PUSKUD. The IFC A2F program will have an important linking role in this TA intervention. New models of making capital available to smallholders via farmer associations and marketing mechanisms should be explored.
• Engage the BEE component of the IFC SADI subprogram to investigate and
understand what institutional support is required to ensure geographical authenticity of coffee produced in NTT and exported from Makassar under specific geographical identities.
• Establish a demonstration farm with existing lead buying firms and farmers’
buying groups to improve coffee quality, growing and post harvest practices. A demonstration farm program should include the following components: - Training on tree pruning and management of agri-inputs - Replacement of senile trees, seedling selection and planting - Nutrient and pest and disease requirements - Safe handling of agri-chemicals and principles of sustainable agriculture and
environmental protection (e.g., the Good Agricultural Practices (GAP) standard).
- Improved post harvest handling to pulping, fermentation and drying practices
- Inter-row cropping in newly planted areas - Farm planning and budgeting
• Engage local DINAS in demonstration farm field days so that the DINAS
becomes an initiator of future smallholder training sessions.

Value chain analysis for SADI agri sectors The NTT Coffee Industry
______________________________________________________________________________ 5
An Overview of Agribusiness in NTT East Nusa Tenggara (Nusa Tenggara Timur / NTT) NTT province consists of 566 islands with a land area of 47.3 thousand km2. the provincial population is around 4.1 million (2004), spread over 42 islands. The main islands in NTT include Flores, Sumba, Timor, and Alor. The West Timor region, which is directly adjacent to the Democratic Republic of Timor Leste, constitutes 32 percent of the total area and is inhabited by around 38 percent of the total population of NTT. There is no single common “culture" to be found in NTT with the populations on the different islands of the province making up at least 40 different ethno-linguistic groups. The cultural traditions of Sumba are different from those of Timor, Alor, or Flores. Compared with most other Indonesian provinces, NTT is notable for its diversity. Administratively, the NTT province is divided into 15 kabupaten and one kota. Out of them, four kabupaten and one kota are located in West Timor. They are Kab. Kupang, Kab. TTS, Kab. TTU, Kab. Belu, and Kota Kupang. The demographics and map of the West Timor region is shown below. Table 1 Profile of NTT and the Five Kabupaten/Kota in West Timor, 2004
Kabupaten Description NTT Province Kupang TTS TTU Belu
Kota Kupang
Area (Km2) 17,349.9 5,898.3 3,947 2669.7 2,445.6 160.3 Population 4,188,774 337,406 405,993 197,174 352,176 258,104 Population Density/ Km2 88 57 103 74 144 1,610 # of Kabupaten /Kota 16 - - - - - #of Kecamatan 203 28 21 9 17 4 # Villages & Kelurahan 2,569 186 212 159 166 45 Source: SMERU Research Institute (October 2006)

Value chain analysis for SADI agri sectors The NTT Coffee Industry
______________________________________________________________________________ 6
Figure 1. Map of West Timor region
Agriculture is an important part of the regional economy in East Nusa Tenggara making up more than 40 percent of Gross Regional Domestic Product (GRDP) (Ministry of Agriculture 2006). However due to stronger growth (relative to agriculture) in other sectors, agriculture’s share of GDRP declined form 51 to 42 percent from 1990-2003. The livestock sub-sector makes the largest contribution to agriculture in NTT at around 42 – 45 percent and or around 13 – 14 percent of GRDP . Agriculture is also important for regional employment where smallholder farming, transport, trading and downstream services account for around 80 percent of total employment. The major agricultural products of NTT include cattle, corn, tamarind, candlenut, tubers, nuts, betel nut and coconut. Kabupaten Kupang is the main producer of cattle in NTT; almost 25 percent of the total cattle in NTT come from this kabupaten. The Dutch are identified NTT has "minus-area" of limited development potential 300 years before the Indonesian government officially classified the province as a "daerah-minus”. NTT has the poorest soils and lowest rainfall in all of Indonesia and the mountainous terrain on many of its islands limits the possibilities for extensive agriculture. The province also experiences pronounced El-Nino weather patterns ensuring that once every few years (on average, one year in three) there is likely to be a drought. A number of droughts have had a significant impact on the province over the past century with the 1997 98 drought being one of the worst on record. Under these conditions farmers must strive to minimise risk rather than maximise production and with low investment in the province there are few alternative forms of employment.

Value chain analysis for SADI agri sectors The NTT Coffee Industry
______________________________________________________________________________ 7
Most of NTT's population (86 percent during the 1990s) is involved in agriculture and engaged in some of the least productive forms of agriculture in Indonesia Fox, J, 2007)1. The limited economic activities in NTT are reflected from the low GRDP per capita figures of only Rp2.2 million (2003), while on West Timor the GRDP per capita ranged between Rp1.7-1.9 million. NTT has a high rate of poverty and the number and proportion of the poor are shown in the table below.
Table 2 The number and proportion of poor people in West Timor, 2004
Kabupaten# of poor in Kab. (000s)
% of Kab. pop'n
Kupang 109 33%TTS 149.5 37%TTU 62.7 31%Belu 70.4 21%Kota Kupang 27.8 11%NTT Province 1,152.10 28%National 17%
Source: SMERU Research Institute (October 2006) NTT has only a small manufacturing industry (3.2 percent of GRDP, 2003) with limited scope for generating employment opportunities and the region has a heavy reliance on imported manufactured goods from Java. With agriculture forming the basis for such a large share of economic activity in NTT, improving this sectors’ performance will have a relatively large impact on poverty alleviation. The climate in this region is semi-arid climate, with the relatively low rainfall and the low indigenous vegetation. The main agricultural activities are livestock and estate crops. Local authorities estimate that there is around 740,000 hectares of dry meadow areas that have potential for development into cattle grazing, however anecdotal evidence from field research suggests that the area available for grazing is decreasing and being used for other uses such as horticultural crops. NTT is a major livestock producing region and is the second largest producer of beef cattle producer in Eastern Indonesia, behind South Sulawesi (DGLS, 2006). Cattle fattening is a traditional farming enterprise and a major source of cash income for farmers, especially on West Timor Island. The dry climate and steep terrain on West Timor Island lends itself to livestock production and the region has a history of producing high quality Bali cattle for export to Java. A major industry issue has been the decline in cattle populations in NTT due to high demand for beef and unsustainable slaughter rates.
1 SMERU newsletter article- James, J. Fox, professor at the Research School of Pacific and Asian Studies, the Australian National University.

Value chain analysis for SADI agri sectors The NTT Coffee Industry
______________________________________________________________________________ 8
Estate crops such as coffee and cocoa grow well in NTT. The province has recently been identified by major coffee buyers as a producer of high grade Arabica coffee and various donor funded programs are seeking to catalyse development of the coffee sector on Flores. The historical lack of smallholder access to fertiliser and agrichemicals and the pristine mountain environment may provide significant marketing opportunities for Arabica coffee if the industry is able to organise reliable supply. Aquaculture and fisheries, in various forms (open water, brackish water pond, fresh water pond, paddy field and seaweed culture) is also a major primary industry and mainly located on Flores. With the province spread over 566 islands the cost of transport for NTT between the districts and with other parts of Indonesia is high and is a barrier to trade and further economic development The role of sea transportation is important for the province. A major problem is the poor condition of roads during periods of high rainfall. Official state data indicates that only 20 percent of the region’s regency and village roading are in good condition while other roads can be prone to slips and closure during heavy rain (BPS NTT, 2003). The limited size of local markets for the sale of agricultural products (due to very low levels of local consumer disposable income) highlights the importance of the region’s infrastructure for trade. In general, smallholders can capture the best returns by supplying export (including inter-regional export) markets. With high transportation costs and a lack of investment in NTT processing capabilities agricultural products for interregional and export market have been limited to traditional products e.g., cattle, cashew nut, sea weed and coffee. Other products such as banana, orange and avocado struggle to compete in Java markets due to the high cost of transportation. The fieldwork conducted for the VCA of priority commodities covered the areas of Kupang, and TTS Sub District for Beef Cattle, Ruteng, and Bajawa (Manggarai Sub District) for Coffee and West Manggarai Sub District for Cassava. Business Operating Environment in NTT The business operating environment in NTT, with respect to the level of informal and formal charges and taxes that farmers, middlemen and traders are required to pay was found to be a significant frustration of local business people although not necessarily a significant barrier to business. Further field research in this area is required to identify the impact that local charges have on the beef cattle industry. A recent study on the NTT business operating environment by the SMERU Institute found that the NTT cattle industry has been the subject of various regulations and excessive charges, starting at the village level. Most regulations include charges, such as: the certification of calves and a permit to export, retribusi to cover the administration cost, a quota limit on the number of cattle exported, and the SPK charge for issuing a

Value chain analysis for SADI agri sectors The NTT Coffee Industry
______________________________________________________________________________ 9
permit for import and export, the services of slaughtering houses, the services of livestock markets, the services of livestock health checks, and quarantine. Other findings include that the presence of many middlemen and traders at the village and sub-district (kecamantan) levels has very limited impact on price information, since product prices are mostly determined by a small number of inter-island or large traders that form a monopsony market structure. The recent increase in the number of traders and exporters coming to Kupang, has not fully benefited farmers, due to the limited information on product location and excessive inspections that give rise to informal charges and uncertainty. The study found that the regional governments in NTT persist with imposing charges and regulations to agricultural products although the contribution of these charges to regional government revenues is very small. Some progress has been made on reducing regulations and charges for agricultural food crops, however less progress has been made in the beef cattle industry. The regulations and licensing have drawn out informal charges applied at various levels that distort the marketing of cattle (amongst other agricultural products) and in turn limit the opportunity of farmers to receive better prices and incomes.

Value chain analysis for SADI agri sectors The NTT Coffee Industry
______________________________________________________________________________ 10
Coffee Sector Profile and Value Chain Analysis 1. Indonesia within the Global Coffee Industry Indonesia is a major coffee producer Indonesia is a major producer and exporter of coffee. Approximately 93 percent of Indonesian production is made up of Robusta coffee which is grown in low land areas. Arabica makes up just 7 percent of total production and is grown in high altitude areas above 2,000 ft asl. The table below shows the country’s position as an international coffee producer and the seasonal fluctuations that can occur from to year. Table 3 World Coffee Production (tonnes)
2001 2002 2003 2004 2005 2006 % of totalBrazil (A/R) Apr-Mar 1,850,220 2,917,020 1,727,220 2,356,320 1,976,640 2,550,720 34%Vietnam (R) Oct-Sep 787,980 693,300 913,800 850,440 809,940 900,000 12%Colombia (A) Oct-Sep 719,940 713,340 671,820 722,520 717,540 696,000 9%Indonesia (R/A) Apr-Mar 409,980 407,100 394,260 452,160 519,540 411,000 6%Ethiopia (A) Oct-Sep 225,360 221,580 232,440 300,000 270,000 330,000 4%India (A/R) Oct-Sep 300,600 275,280 270,480 280,320 277,020 300,300 4%Mexico (A) Oct-Sep 266,280 261,000 252,000 232,020 240,000 270,000 4%Guatemala(A/R) Oct-Sep 220,140 244,200 216,600 222,180 220,500 240,000 3%Peru (A) Apr-Mar 164,940 174,000 158,460 201,300 145,200 210,000 3%Honduras (A) Oct-Sep 182,160 149,820 178,080 154,500 192,240 162,000 2%Other Producers 1,372,260 1,353,240 1,309,200 1,273,860 1,294,740 1,359,300 18%World Production 6,499,860 7,409,880 6,324,360 7,045,620 6,663,360 7,429,320 100%Source: International Coffee Organisation The data above also shows how Brazil and Vietnam have rapidly increased their share of world coffee exports. Brazil produces strong flavoured Arabica and Vietnam mainly produces Robusta. Vietnam is emerging as a competitor to Indonesian Robusta production however; the Arabica produced in Brazil is a strong flavoured style distinct from the mild flavoured Arabica produced in Indonesia and particularly NTT. The tables below provide a breakdown of coffee exporting countries and volumes over 2006 to 2007, showing exports of Arabica and Robusta coffee. Indonesia is a relatively small producer of Arabica coffee at just below two percent of world exports in 2006 exporting approximately 68,000 tonnes. Brazil and Columbia are the main producers and exporters of Arabica coffee with 39 and 18 percent of world exports in 2006 respectively.

Value chain analysis for SADI agri sectors The NTT Coffee Industry
______________________________________________________________________________ 11
Indonesia is however a major exporter of Robusta coffee. A recent report on the Indonesian coffee industry2 reported that in 2006, Indonesia exported approximately 283,960 tons of Robusta, down from the previous year when it exported 331,788 tons, making it the second largest exporter of Robusta coffee (16.5 percent of world production) behind Vietnam. Vietnam dominates world exports of Robusta coffee with over 45 percent of the world Robusta exports. India is also emerging as a major Robusta producer with eight percent of the world production in 2006. Table 4 Top 10 Coffee Exporting Countries (tonnes)Country Type 2005/06 % of total 2006/07 % of totalBrazil A/R 1,542,367 30% 1,683,909 30%Vietnam R 777,468 15% 956,679 17%Colombia A 622,884 12% 661,877 12%Indonesia A/R 410,208 8% 301,852 5%Peru A 135,786 3% 241,359 4%India A/R 169,999 3% 219,678 4%Guatemala A 200,937 4% 199,284 4%Ethiopia A 143,191 3% 176,128 3%Honduras A 150,888 3% 169,562 3%Mexico A 120,961 2% 161,798 3%Others A/R 881,493 17% 887,631 16%Total 5,156,183 100% 5,659,757 100% Table 5 Robusta coffee exports by country 2005Country 2005 2006Vietnam 839,646 787,370 46%Indonesia 331,788 283,960 16%Brazil 162,016 149,771 9%Uganda 119,025 85,157 5%Côte d'Ivoire 117,494 125,051 7%India 104,884 139,871 8%Cameroon 33,227 34,230 2%Ecuador 32,538 30,591 2%Thailand 20,526 33,517 2%Tanzania 13,293 12,118 1%Other 36,351 39,904 2%TOTAL 1,810,788 1,721,540 100%
2 Integrated Value Chain Analysis for Coffee Production in Indonesia. Global Development Solutions, LLC. January 2007.

Value chain analysis for SADI agri sectors The NTT Coffee Industry
______________________________________________________________________________ 12
Table 6 Arabica coffee exports by country 2005Country 2005 2006 % of totalBrazil 1,477,541 1,367,108 39%Colombia 660,271 644,131 18%Guatemala 207,442 200,892 6%Peru 175,292 177,861 5%Ethiopia 157,197 160,488 5%Honduras 143,714 175,714 5%Mexico 114,441 150,460 4%Costa Rica 90,590 74,781 2%El Salvador 78,718 76,115 2%Papua New Guinea 67,012 59,382 2%Other 335,057 355,508 10%Indonesia 55,515 68,517 2%Total 3,562,790 3,510,957 100% Source: Global Development Solutions, 2007 The graph below shows the breakdown and growth of Indonesian coffee exports between 1994 and 2004. The growth in exports shows the increased international demand for coffee, especially mild flavoured coffee styles such as Arabica, and increased production. The most significant increases have been from Arabica exports, (from 18,000 to 52,000 tonnes) and from added value forms such as roasted and ground coffee (6,000 to 13,000 tonnes). Figure 2
Indonesian Coffee Exports (tonnes)
-
100,000
200,000
300,000
400,000
500,000
600,000
700,000
800,000
1993/9
4
1994
/95
1995
/96
1996
/97
1997/9
8
1998/9
9
1999/0
0
2000/0
1
2001/0
2
2002/0
3
2003/0
4
Year
To
nn
es
Total Production Total Export Robusta Arabica Roasted & other forms

Value chain analysis for SADI agri sectors The NTT Coffee Industry
______________________________________________________________________________ 13
The US has quickly become Indonesia’s largest coffee export market. The United States, Japan and Germany are the primary export destinations for both Arabica and Robusta coffee from Indonesia. Specifically, the United States is the largest importer of both Arabica $32.5 million (37.3%) and Robusta $19.4 million (20.2%) from Indonesia. Japan prefers strong flavoured or Robusta style coffee whereas the North American markets favours the mild flavoured coffee, such as the natural flavour of the coffee produced in Indonesia. Table 7 Volume Destination of Indonesian Robusta Coffee 1999 - 2004
Country 1999 2000 2001 2002 2003 2004Volume (000 MT)USA 62.3 23.1 20.2 22.5 28.6 61.5Germany 46.3 42.4 22 48.3 51.8 47.9Japan 48.9 61.6 49.1 46.3 45.1 50.5Singapore 0.9 1 7.6 19.1 7.7 9.3
Netherland 1.1 1.9 2.6 2.9 0.3 0.02Others 158.4 171 99.3 134.4 143.1 135.9Total 317.9 301 200.8 273.5 276.6 305.12
Average Price (c/kg) $1.28 $0.87 $0.55 $0.49 $0.64 $0.79 Source : Kustiari, Reni (2007) 2. Size and structure of the NTT Coffee Industry NTT is a relatively small coffee producer There is a range of data existing on the regional spread of coffee production in Indonesia. The Ministry of Agriculture (Estates Crops Division) estimates that NTT has around 5 percent of Indonesia’s total planted area, and due to lower than average yields (52 percent of the national average) only 3 percent of total production. The total estimate of NTT planted area ranges between 61,000 and 113,000.

Value chain analysis for SADI agri sectors The NTT Coffee Industry
______________________________________________________________________________ 14
Table 8 Indonesian Harvested Area by Province, 2005 Indonesia, 2005
Province Area (ha) % of area
1. Aceh 100,263 8% 2. North Sumatra 51,353 4% 3. West Sumatra 51,600 4% 4. South Sumatra 273,451 22% 5. Bengkulu 122,844 10% 6. Lampung 168,006 13% 7. Central Java 41,993 3% 8. East Java 92,488 7% 9. East Nusa Tenggara 61,437 5%10. South Sulawesi 68,577 6%11. Others 212,879 17%Indonesia 1,244,891 100% Source: Director General of Estate Crops, Indonesian Ministry of agriculture, 2006 For both Arabica and Robusta, production of coffee is dominated by smallholder farmers, where the average size of a farm ranges from 1.0 – 1.5 hectares. The coffee sector generates direct employment for over 2 million farmers in Indonesia. Table 9 Coffee Sector Profile for Indonesia
Area Under Cultivation (ha)Arabica (2005) Smallholder Gov’t Private Total
Total hectares planted 99,499 6,672 4,315 110,486
Total hectares mature trees 54,424 5,751 1,592 61,767Total production (ton) 40,931 4,458 1,641 47,030
Average yield/ha (kg) 752 775 1,031 761
Number of farmersAverage output/farmer (kg)
Robusta (2005) Smallholder Gov’t Private Total
Total hectares planted 1,150,056 19,925 21,576 1,191,557Total hectares mature trees 877,399 18,678 15,468 911,545
Total production (ton) 606,123 12,549 9,149 627,821
Average yield/ha (kg) 527 639 424 527Number of farmers
Average output/farmer (kg)
Total number of farmersTotal production – 2005 (ton)
Average farm size
Source: Integrated Value Chain Analysis for Coffee Production in Indonesia. Global Development Solutions, LLC. January 2007.
334
2,049,042674,850
1.0 – 1.5 ha
1,307,043
224,414239
1,824,628

Value chain analysis for SADI agri sectors The NTT Coffee Industry
______________________________________________________________________________ 15
Manggarai and Sumba are the major producing sub-districts in NTT The table below shows the total production and productivity of smallholder coffee farms in NTT. NTT coffee production is relatively concentrated in Manggarai and Sumba districts accounting for around 55 and 22 percent respectively of the total NTT coffee area. Manggarai has higher yields per hectare, (closer to the Indonesian average of 518kg per hectare) while most other regions are below the national average.
Table 10 Production profile of NTT smallholder coffee (2002)
Regency Productive Plant
Area (ha) Production
(ton) Productivity
(kg/ha) # of Farmer (household)
1. Sumba Barat 6,300 1,850 293.7 20,966 2. Sumba Timur 290 58 200.0 946 3. Kupang 93 13 139.8 263 4. Timor Tengah Selatan 70 41 585.7 930 5. Timor Tengah Utara 157 26 165.6 1,000 6. Belu 179 45 251.4 536 7. Alor 305 144 472.1 749 8. Flores Timur 1,329 332 249.8 3,983 9. Lembata 297 104 350.2 1,244 10. Sikka 1,098 141 128.4 2,350 11. Ende 1,106 389 351.7 3,430 12. Ngada 2,372 1,633 688.4 5,079 13. Manggarai 16,612 8,474 510.1 40,917
East Nusa Tenggara 30,208 13,250 438.6 82,393
Source : Statistical Estate Crops of Indonesia, 2002 3. Productivity and Performance of NTT Coffee Industry
NTT farmers manage coffee with low inputs Coffee is grown at both low altitudes (mainly Robusta variety) and in elevated mountain regions. Smallholder coffee producers in high altitude locations of NTT such as Manggarai (Flores) are able to produce viable yields and quality Arabica coffee without applying fertiliser or undertaking pest control. In these areas the trees are grown under indigenous forest while more productive land close to the village is used for subsistence foods crops. The mountain climate reduces the pest and disease challenge for trees in these locations and farmers often have no access to synthetic fertilisers. The current lack of fertiliser reduces bean size and yields for farmers (unfavourable for selling parchment) but improves the bean density which is desired by processors and exporters. There is current high demand from two leading coffee processors/exporters for NTT Arabica coffee due to the unique flavour produced.

Value chain analysis for SADI agri sectors The NTT Coffee Industry
______________________________________________________________________________ 16
Highland farmers rely on coffee for cash income Coffee yields (both Arabica and Robusta) are affected by weather conditions at flowering (at the end of the dry season). Higher than usual rainfall during flowering can reduce yields by up to 30 to 40 percent and can be a major cause of fluctuating yields from year to year. This can be a problem for farmers in mountain areas who rely heavily on coffee production for cash income. The limited areas of arable land are usually used for subsistence food crops. In lowland and coastal areas of Flores farmers have more options for cash crops (e.g., vanilla, cashew, cocoa, nutmeg, rice, cassava, coconut). The affect of season (wetter or drier than normal dry season) usually has an opposite affect on Robusta coffee. Having a mix of Arabica and Robusta coffee can be a good way for farmers to manage this risk. Harvesting usually takes place from April to October with the peak around April-May for Arabica and June-October for Robusta. Immediately following harvest the red cherries are pulped or peeled to free the bean of the skin using a traditional wooden pulping machine (luvak) and skins are spread under trees for fertiliser and the parchment is dried down to a safe moisture content for transport. Coffee yield and quality is also affected by the timing of cherry picking, and a common problem for processors is receiving beans with a wide range of ripeness. Cherries that are picked while still green (as opposed to red) reduce the final quality of the green bean. Coffee cherries picked at a green stage also have lower bean weight and parchment yield than fully ripe beans. The affect of harvest time also impacts the parchment yield with yields as high as four to six litres of parchment per kilogram of cherry during the peak harvest period in May and closer to 2.5 to 3.5 in July (heavier beans). The graph below shows the production profile in Flores.

Value chain analysis for SADI agri sectors The NTT Coffee Industry
______________________________________________________________________________ 17
Figure 3
Flores Coffee Production Profile
0
1
2
3
4
5
6
7
8
Jan Feb Mar Apr May Jun Jul Aug Sep Oct Nov Dec
Months
kg p
er tr
ee p
er w
eek
Farmers in Manggarai undertake on-farm fermentation by either traditional dry fermentation; pulped beans are stored in a sack over night and spread out for drying over three days; or wet fermentation. In wet fermentation pulped beans are soaked in the water over night, washed the following day then sun dried for three days. Providing the pulping process it correctly done, processors and buyers prefer the dry fermentation as it results in a stronger flavoured coffee. Best practice drying is for 21 days down to 12 percent moisture content. Both processes are illustrated in the Appendix. Both forms of fermented coffee are received by buyers and processors (e.g., PT Lion Lestari). Moisture content is the major determinant of quality and (maximum 16% and minimum 12%) and coffee is often re-dried by farmers associations or collectors (e.g., PD Komodo Jaya) to meet buyer standards. Pocoranaka is the main coffee producing district in Manggarai The central coffee producing area in Manggarai is the Pocoranaka district producing 3,000 tonnes of processed green bean per year. There are three main coffee varieties grown in Manggarai, with Robusta being the most common variety in lower elevations (up to 700 metres) and Arabica grown in mountain areas (above 800 – 1,500 metres).
Variety Area Production (tonnes) Robusta 17,000 hectares 7,000 Arabica Hyrbid 5,000 hectares 3,500 – 5,000 Arabica Juria N/A 1,000
While coffee is a main source of income, fieldwork research indicates that smallholders rely on mixed rice and corn for daily consumption (roughly 1 kg of rice (Rp5,000/kg) and one 1kg of milled corn (Rp 3,000/kg) for a family unit of seven to eight people. Corn is usually planted twice a year with cassava, while rice is generally purchased in local markets.
Value chain analysis for SADI agri sectors The NTT Coffee Industry
______________________________________________________________________________ 18
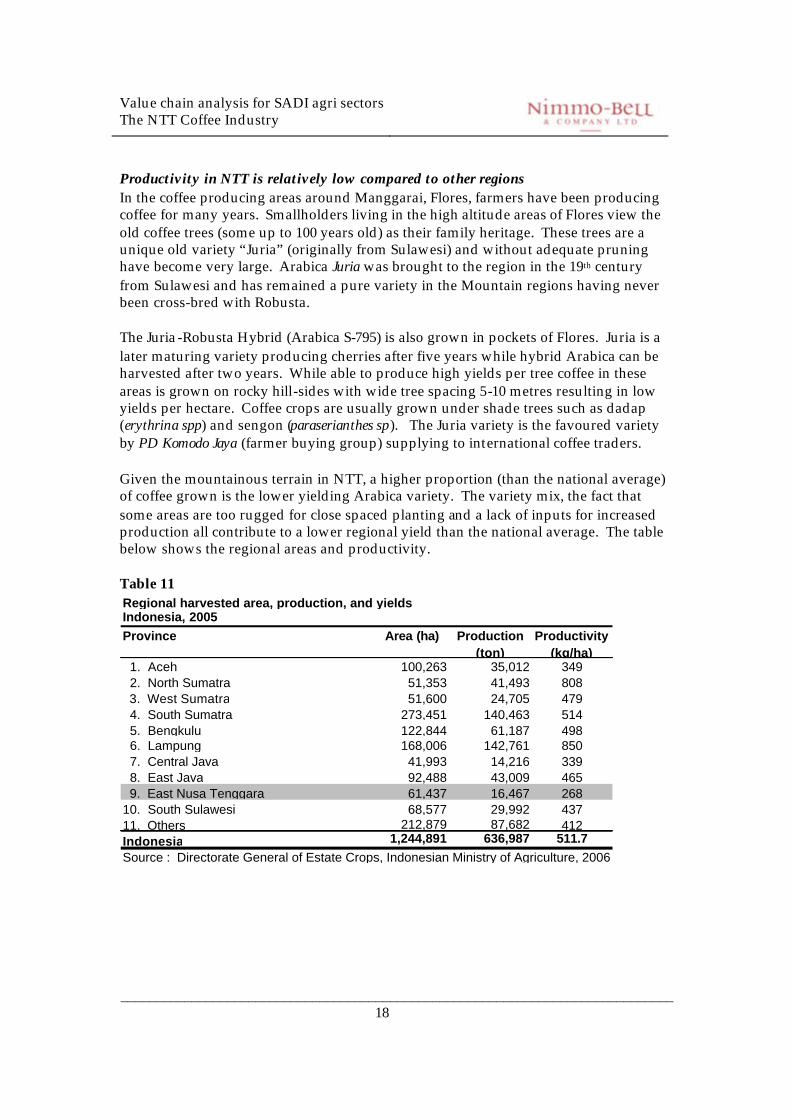
Productivity in NTT is relatively low compared to other regions In the coffee producing areas around Manggarai, Flores, farmers have been producing coffee for many years. Smallholders living in the high altitude areas of Flores view the old coffee trees (some up to 100 years old) as their family heritage. These trees are a unique old variety “Juria” (originally from Sulawesi) and without adequate pruning have become very large. Arabica Juria was brought to the region in the 19th century from Sulawesi and has remained a pure variety in the Mountain regions having never been cross-bred with Robusta. The Juria-Robusta Hybrid (Arabica S-795) is also grown in pockets of Flores. Juria is a later maturing variety producing cherries after five years while hybrid Arabica can be harvested after two years. While able to produce high yields per tree coffee in these areas is grown on rocky hill-sides with wide tree spacing 5-10 metres resulting in low yields per hectare. Coffee crops are usually grown under shade trees such as dadap (erythrina spp) and sengon (paraserianthes sp). The Juria variety is the favoured variety by PD Komodo Jaya (farmer buying group) supplying to international coffee traders. Given the mountainous terrain in NTT, a higher proportion (than the national average) of coffee grown is the lower yielding Arabica variety. The variety mix, the fact that some areas are too rugged for close spaced planting and a lack of inputs for increased production all contribute to a lower regional yield than the national average. The table below shows the regional areas and productivity. Table 11 Regional harvested area, production, and yields Indonesia, 2005Province Area (ha) Production
(ton)Productivity
(kg/ha) 1. Aceh 100,263 35,012 349 2. North Sumatra 51,353 41,493 808 3. West Sumatra 51,600 24,705 479 4. South Sumatra 273,451 140,463 514 5. Bengkulu 122,844 61,187 498 6. Lampung 168,006 142,761 850 7. Central Java 41,993 14,216 339 8. East Java 92,488 43,009 465 9. East Nusa Tenggara 61,437 16,467 26810. South Sulawesi 68,577 29,992 43711. Others 212,879 87,682 412Indonesia 1,244,891 636,987 511.7Source : Directorate General of Estate Crops, Indonesian Ministry of Agriculture, 2006

Value chain analysis for SADI agri sectors The NTT Coffee Industry
______________________________________________________________________________ 19
4. Market Conditions for the NTT Coffee Industry Coffee is a global commodity where prices are affected by supply and demand conditions in world markets. Prior to 1989, traded coffee volumes were based on agreed quota levels in producer and consumer countries. One of the objectives of the quota system was to stabilise international market prices as well as to ensure reliable supply for major importing countries. This system was administered by the International Coffee Organization (ICO) under an agreement of 42 producer countries and 16 consumer countries. The quota system began to breakdown as producer countries increased production putting pressure on world prices. Indonesia was one of producer countries affected the said condition. In 1989 the system was abandoned and world prices continued to be depressed (Kustiari, 2007). Domestic coffee trade in Indonesia is regulated by the Indonesian Ministry of Trade who set requirements and guidance for local and international exporters3. In 2001 coffee export taxes were removed to enhance market competitiveness and foreign exchange earnings (Kustiari, 2007). While the domestic trade is regulated by central government, the nature of regional coffee trade is determined by production systems, processing practices, and relationship among farmers and traders. The majority of the coffee “marketing channel” in Indonesia is under control private traders and exporters. Industry studies estimate that the proportion of production and marketing volumes owned by state owned estate crop companies is only three percent (Jong, 1997). The main factors that affect regional coffee supply chains are: (1) topography and geographical location of producing areas (i.e., smallholders receive less per kg in very remote areas where traders or collectors must pay for parchment to be transported by donkey to central towns and cities); (2) trader capital (e.g., if trader capital is not limited they have more ability to buy larger volumes of coffee from farmers and influence prices within small areas); and (3) the distance of rural and urban areas (Kustiari, 2007). Domestic coffee consumption in Indonesia has increased significantly over the past decade driven almost entirely by soluble coffee (mainly lower grades and Robusta). Consumption fell sharply after the start of the Asian crisis and has never fully recovered to pre-crisis levels. Consumption fell from about 120,000 tonnes to about 78,000 tonnes during the crisis and is thought to have reached 102,000 tonnes in 2004.
3 Other industry organizations include Dinas Perkebunan (Estate Crops Office)- guide PBS (Perkebunan Besar Swasta/Private Estate Crops Enterprise), PTPN (Perkebunan Negara/State Owned Estate Crops Company). The AEKI (Asosiasi Eksportir Kopi Indonesia/Indonesian Coffee Exporter Association) assists the industry by organising exporters and providing as market development and research services.

Value chain analysis for SADI agri sectors The NTT Coffee Industry
______________________________________________________________________________ 20
The Indonesian coffee industry has undergone significant changes The buying and trading of coffee within the industry has undergone significant changes over the past ten years. These changes have in general improved the transparency of coffee purchases and helped to improve farm-gate prices. During the late 1990s, quality concerns of green bean shipments resulted in major coffee buyers in the United States and Europe only sourcing coffee from large traders. A major concern being that if a container was rejected by a major US buyer small traders would inevitably attempt to reship the container at a later date. For Indonesian coffee exporters, changes to buying and exporting occurred in a dramatic way as the country’s largest buyer and traditional trader of coffee was found to be:
• concealing farm gate prices; • forcing sma llholders to supply on credit; • mixing good quality Arabica with inferior grade coffee and Robusta; and • tampering with shipment samples.
These practices kept farm gate prices down for the entire industry in Indonesia.
As a result of corrupt trading practices some traders and exporters were able to earn profits of USD$5,000 – $10,000 per container shipment or around 50 cents per kilo (Green Bean). Established industry stakeholders report that lead coffee buying firms made changes to the way they sourced coffee. Since the introduction of improved transparency systems average margins are around USD 10 cents per kilo. Starbucks has helped changed the way Indonesian traders and exporters source coffee In 2005 Starbuck made the largest recorded order from a lead exporter of Indonesian Robusta and Arabica (Sumatra, Java and Sulawesi). The exporter had for many years been using the practices outlined above and earning super -profits from trading coffee. The bean mixing practices often misled buyers and damaged the reputation of Indonesian coffee producers. Before the recent changes, exporters of this type were able to ship poor quality coffee to small buyers (mainly in Europe) without fear of rejection due to the cost that can cause buyers. When Starbucks uncovered the corrupt buying and exporting practices, it made an additional order of the same size from other Indonesian exporters at a new higher price (i.e., 50 percent higher than the previous order) while maintaining the first order at the lower price. With the large volumes that Starbucks buy from Indonesia, it had a significant influence on the overall price for Indonesian exporters. With new higher priced contracts in place the exporter has had to honour the original contract at a significant loss. The new higher price was accompanied with a ‘Starbucks certification’ program of improved supply chain transparency and traceability that ensures price premiums are paid directly to accredited farmer associations. This program is equivalent to Fair-

Value chain analysis for SADI agri sectors The NTT Coffee Industry
______________________________________________________________________________ 21
Trade programs and is a positive step made by the largest buyer of specialty coffee to improve smallholder returns and improve the sustainability of its supply base. Starbucks is currently sourcing Arabica in small volumes from Flores, NTT. Starbucks is now the largest buyer of specialty coffee to the USA and sets the standards for Arabica prices and quality requirements. Smallholders are very dependent on world coffee prices A number of reports have documented the significant impact the coffee price crisis has had on the economic well being of smallholders in developing countries. The figure below shows the fluctuations in world coffee prices between 1989 and 2004 and demonstrates how closely correlated producers prices (and therefore returns) are with world coffee prices. Figure 4
World Robusta Price (US cents/lb)
0.0
20.0
40.0
60.0
80.0
100.0
120.0
140.0
160.0
1989 1990 1991 1992 1993 1994 1995 1996 1997 1998 1999 2000 2001 2002 2003 2004
Year
To
nn
es
Producer Prices Exporter Prices (FOB) International Prices (London)
Source : Kustiari, Reni (2007)
International coffee markets have changed over the past few years Since 1970 world coffee prices have declined at an average of 3 percent per annum for Arabica and 5 percent for Robusta. This trend has resulted in a coffee price crisis and has had significant economic and social impacts for coffee producing countries (which are predominantly developing countries). The decline in prices has been largely caused by continuing production increases without a corresponding increase in world consumption, until recently. The figure below shows the decline in world coffee prices.

Value chain analysis for SADI agri sectors The NTT Coffee Industry
______________________________________________________________________________ 22
Figure 5
Arabica and Robusta prices, 1970 - 2002
Source: Lewin et al., 2004 (from ICO database) Price volatility between years is mainly caused a by weather shocks in the main producing countries (e.g., Brazil). However, the long-term trend has been declining coffee prices since the 1970s. In recent years, significant structural changes have emerged to manage price volatility. One area of structural change has been increasing share of world supply from Brazilian, Vietnamese and Colombian producers combined with quality improvements. Increased access to financial and futures markets in these countries have also enabled some producers to manage risk and smooth shipments across cyclical production swings. World prices have steadily declined while world production has increased World production, as estimated by the USDA, has been rising by an average of 1.8 percent per year over the past 40 years. The main cause of these production increases has been a combination of:
• producer responses to sudden big price increases, • falling production costs, • new low-cost entrants, and • inconsistent policy responses to price falls that delay market exit but encourage
market entry. Most of the recent growth in world supply has come from increases in Brazil, Vietnam and recently Colombia. Production has also changed since 1994 – 1995 when the price rises caused by the Brazilian frost encouraged some countries to expand production rapidly.

Value chain analysis for SADI agri sectors The NTT Coffee Industry
______________________________________________________________________________ 23
World markets have experienced growth in specialty coffee Due to the unique location of remote highland villages and largely unspoiled growing environment NTT coffee producers (e.g., in Flores and Sumba) have an opportunity to market coffee as a specialty product from a distinct location. A number of industry studies have identified the specialty coffee industry as the fastest-growing segment of the global coffee market (Neilsen, J. 2004). The large number and popularity of roaster-retailer chains, offering coffee beans from various regional origins, supports the increased use of geographical identification within the specialty coffee sector. There is also an assumption with specialty coffee that producers capture a larger proportion of the final price. Specialty and differentiated coffee has benefits and limitations (Lewin et al., 2004) Emerging markets in non traditional markets (Asia, Eastern Europe, and the former Soviet Union) are experiencing rapid growth in consumption. This is mainly for inexpensive, soluble coffees, though tastes are changing toward improved quality and characteristics. Soluble types are important to developing these traditionally tea-drinking markets because most consumers are unfamiliar with coffee-brewing methods. North America and Japan are growing slowly. Northern European consumption, particularly in Germany is stagnant, but in southern Europe, there are some increases with the differentiated product market (specialty coffee) growing the fastest. The differentiated product market requires that producers distinguish their products by distinct origin, defined processes, or exceptional characteristics, such as superior taste or few defects. These can be traded through more lucrative channels than the typical industrial grades that flow in the undifferentiated commodity channels and include:
• Geographic Indications of Origin (appellations) • Gourmet and specialty • Organic • Fair trade • Eco-friendly or shade grown • Other certified coffees
While these differentiated segments can provide some producers with competitive advantages and added value, they are not necessarily easy to access and are still relatively small. They are also important because of their potential to provide better social, economic, or environmental benefits for farmers. While price premiums are currently attractive, it should not be the only reason for entering these markets as at least in some cases these premiums will diminish. Other benefits of this market segment include:
• Increased use of rural labor and organizational development • Crop diversification and reduced input costs minimize financial risk • Better natural resource management and biodiversity conservation

Value chain analysis for SADI agri sectors The NTT Coffee Industry
______________________________________________________________________________ 24
• Reduced risk due to improved drought and erosion resistance • Crop resilience to adverse weather • Fewer health risks due to potential mishandling of agrochemicals
While coffee market analyses point to strong growth in specialty and differentiated coffees, there is a potential for market sa turation to reduce prices at current growth rates. These markets are still small and even modest changes in supply and demand can impact prices. Most of the major coffee companies are instituting increased requirements for sustainable growing practices that will require further adoption and certification of these practices. Several very large buyers that are now testing the market with these products claim that supply limitations will constrain expansion of this market (Lewin et al., 2004). Geographical Identification of Toraja Arabica coffee has been established (through their investment in marketing) and is owned by Key Coffee for export to the Japanese market. Previous analysis (Neilson, J. 2004) of the Sulawesi coffee industry indicates that while this strategy achieves 50 percent price premiums for Key Coffee in the Japanese market, the benefits of the geographical identity do not reach producers. Local market issues Currently smallholder farmers sell coffee as either fresh cherries, pulped and fermented parchment, or cherries that have been fermented and dried then processed to remove skins (Asalan). There is no ‘open market’ for smallholders to sell coffee (e.g., at local markets) all coffee buyers have collectors that collect coffee directly from farmers. Buyers can make a advance payments to smallholders “Ijon” through their collectors and is usually 50 percent of the expected crop. This practice ensures supply for buyers but can result in a lack of transparency on the final price. Anecdotal evidence suggests that the “Ijon” (and final price) can depend on how urgently the smallholder needs the money. The PD Komodo Jaya buying group, with the help of lead coffee buying firms, had early success in encouraging farmers to produce fermented parchment, improving the quality of the final coffee bean and farm gate prices. The returns of various marketing and added-value activities are shown in Section 4.6. Encouraging best practice handling of coffee beans at the village level has been little in important for the ability of PD Komodo Jaya to offer higher prices and deliver improved quality to its buyers. Transport time from village to processing sites is a maximum of 1-2 days before parchment (50 percent moisture) needs to be dried down to 12 percent moisture and processed to green bean.
Value chain analysis for SADI agri sectors The NTT Coffee Industry
______________________________________________________________________________ 25
PD Komodo Jaya and PT Lion Lestari are working to improve farmers’ trading conditions PD Komodo Jaya was established as a local government company to buy coffee through farmers’ groups. Coffee is being sold to Starbucks through PT Lion Lestari in Makassar. Starbucks and PT Lion Lestari are buying the unique Juria Arabica from upland villages and are working through Komodo Jaya to improve farmers’ growing, harvest and post harvest practices. Komodo Jaya provides three main services to farmers: marketing; transportation and construction services; and farmer credit. In 2003, PD Komodo Jaya approached PT Lion Lestari (coffee processor and exporter) about sending Juria Arabica, Hybrid Arabica and Robusta coffee samples via one of PD Komodo Jaya’s customer in Surabaya. Lion Lestari organised field visit for major coffee buyers, near Ruteng, Flores and thereafter conducted training on harvest and post-harvest practices. In 2004 and 2005 Komodo Jaya facilitated the sale of three, and seven containers respectively (20 tonnes per container) of parchment at between Rp 4,000 and 5,000 per litre of parchment (0.25kg per litre). The coffee is being purchased through farmer groups and farmers are receiving prices of approximately 10 percent higher than traditional marketing channels. While Komodo Jaya was successful in working with Lion Lestari, internal management problems have reduced their involvement with farmer-groups. PT Lion Lestari began buying coffee from Flores in 2001 (previously growing coffee in Toraja). The company has established new environmental standards for their coffee purchased from Komodo Jaya . Lion Lestari does not buy coffee: (1) that was planted in conservation areas in 2004; (2) planted in the surrounding watershed areas; and (3) that may cause environmental degradation especially (e.g., waterway pollution). PT Lion Lestari is currently working to certify smallholder farmers in Flores for organic and fair-trade certification. There are 3,300 farmers from the three Flores regions certified or close to achieving full certification status. These farmers are organized into farmers’ groups (at the village level around 45-50 farmers per group) and larger farmers co-ops containing around three farmers’ groups. Buying through farmer co-ops is a requirement of fair trade certification and traditional growing practices are very close to organic product requirements. USAID has also shown interest in assisting the program with achieving farmer certification. The cost of verification experts are currently paid by E-Com (Lion Lestari’s main buyer). The size of the program is outlined below.

Value chain analysis for SADI agri sectors The NTT Coffee Industry
______________________________________________________________________________ 26
Table 12 Size of PT Lion Lestari’s Program in Flores Island, NTT, 2007
Item Quantity Remark No of farmers (person) 3,300 Average area per farmer (hectare) 1.0 Total growing area in the program (hectare) 3,300 Expected cherry production (kg/ha) 2,100 Parchment per hectare (litre) 700 1 litre = 3 kg
Marketing channel of coffee in Manggarai is presented below. Individual farmers can perform the roles of producer, local collector, village trader and also be part of a farmer’s group. Usually farmers with higher social status adopt the roles of local collector and village traders. The complexity of the marketing channel illustrated below shows that implementing supply chain transparency programs, such as FairTrade, can be challenging and is likely to require reducing the involvement of intermediaries. Figure 6 Marketing channel of coffee in Manggarai Regency, NTT Source: Field research
Individual Farmer
Local Collector
Customary Processor
Village Trader
District Trader
Regency Trader
Contemporary Processor
Trade Agency (PD Komodo Jaya)
Local Market
Exporter (PT Lion Lestari)
Exporter (Surabaya)
Regional Trader (Surabaya)
Starbuck Company
International Consumer
Domestic Consumer
Farmer’s Group

Value chain analysis for SADI agri sectors The NTT Coffee Industry
______________________________________________________________________________ 27
There is strong demand for Flores NTT coffee While the export volumes of branded Flores Arabica have been low to date, lead buyers (e.g., Starbucks) have recognised the region as a producer of unique flavoured coffee and expressed a willingness to develop the name as specialty coffee producing region. This interest extends to improving on-farm and post harvest practices to improve bean and parchment quality. Small amounts of Grade 1 coffee (Arabica juria) were exported from Ngada in 2006 for Rp 24,000 kg, 30 percent higher than equivalent coffee from other regions. Starbucks lead the industry in terms of price and quality standards. Being the largest buyer for the largest specialty coffee market (USA) Starbucks can pay up to Rp13,000/l of parchment for the right quality coffee, nearly three times current average prices in Flores (Rp4,500 – 5,000/l). Indonesian coffee has natural low acidity and high body flavour due to the soils and climate. This style is different to the natural high acidity-low body coffee produced in Brazil and Central America. Consumers in the largest export market (USA) prefer the Indonesian style putting the industry in a favourable position. One of the main barriers to increasing exports is the wide range in quality, largely due to poor on-farm post harvest practices. Currently coffee produced in Flores is not differentiated as Flores coffee and mixed with Sumatran or Kalosi coffee and sold as such. The practice of mixing coffees from a number of regions is common as it has been very difficult for exporters to buy and market small volumes of coffee from unknown regions such as Flores. Large companies with the resources to adopt a long-term strategy for the purchase and marketing of regional coffee, are now able to invest in the local supply channels. A major buyer is now working to assist farmers gain certification (Fair-trade, Starbucks certification) and developing the brand as producing region. Anecdotal evidence (pers comm. K. Gartner) indicates that there is very high demand (and 30% premium) for Fair-trade organic coffee in the USA, Japan and Europe. A leading exporter of Flores coffee (ECom Ltd) is using Fair Trade Organic and Starbucks certification to build the reputation of the region. Trading conditions in Sumba (the other main producing region) were not researched. In March 2007 Fair-trade certification attracted a premium of around USD50 cents per kilo for green bean or 15 percent over non-certified coffee for exporters. This premium must be given back to farmers otherwise the supply chain loses certification. Equally certification can open up new markets for the coffee. Fair-trade and Starbucks certification focus on supply chain transparency, traceability and ensuring that price premiums reach smallholders. Organic certification is for on-farm practices only.
Value chain analysis for SADI agri sectors The NTT Coffee Industry
______________________________________________________________________________ 28
5. Coffee Industry Supporting Structures and Related Industries The National Cocoa and Coffee Research Institute provides technical assistance to growers The local government of Manggarai Regency has collaborated with Puslit Koka (Research Institute for Coffee and Cacao) of Jember (East Java) to develop coffee production in the district over a five-year programme, beginning in 2004/2005. It is funded by local government (APBD (Anggaran Pendapatan dan Belanja Daerah). The programme focuses on smallholder coffee technology development, particularly harvest and post harvest handling. The programme is implemented through farmer’s groups in the form of training of picking, processing, and packaging of dried coffee bean (ose). Introduced technologies include, (1) pulping; (2) washing methods; (3) improved coffee drying equipment (21 days); and (4) handling for transport (at 12 percent moisture). Anecdotal evidence indicates that farmers have been reluctant to adopt the improved practices due to additional labour requirement without significant price increases. To address the situation the local government (Estate Crops Office/Dinas Perkebunan) is collaborating with a private company in establishing UPH (Unit Pengolahan Hasil/Processing Unit) and providing a loan of approximately Rp 120 million to farmer’s groups to purchase 60 tons of fresh coffee bean (@ Rp 2,000/kg) and processing through UPH (farmers normally receive Rp 2,500 for fresh bean from the market). The outcomes of the processing venture are not known yet. UPH has also purchased parchment coffee from farmers with the price of Rp 14,000/kg (water content 12%), which is twice the price for standard quality parchment. The local government has also introduced other development programmes (such as the farmers’ empowerment programme to improve farmers’ bargaining power) and appears to be relatively active in encouraging growth in the industry. The farmers’ empowerment programme also provided price quality and market information to farmer groups and is implemented by the Cooperative Office (Dinas Koperasi) and collaborating with PD Lahir Sejati Unggul (exporter). In order to increase PAD (pendapatan asli daerah/locally-generated revenue), the local government of Manggarai Regency had implemented the regulation of SPPMK (sumbangan peningkatan produksi dan mutu kopi/contribution for increasing production and quality of coffee). However, this regulation has been annulled because it was contradictory with central government regulation. Hence, local government launched new regulation called third party (businessmen) contribution of about 2.5 percent of the quantity of trading coffee based on the price of Rp 100 per kilogram fresh coffee bean. Farmers lack access to finance from well functioning financial institutions Farmers have little or no access to working capital for the timely purchase of quality agri-inputs, such as pulping machines, fertiliser for low land Robusta varieties and new seedlings. Farmers can obtain informal credit from local traders and collectors although this system often lacks transparency.

Value chain analysis for SADI agri sectors The NTT Coffee Industry
______________________________________________________________________________ 29
Local banks have had poor lending experiences with farmers in the past and also lack an understanding of rural finance requirements and sources of loan security (see earlier section on rural credit). The industry also lacks investment in processing facilities to handle the increasing volume of coffee being produced. This puts the industry at risk of developing a reputation as a low quality producer. 6. Value Chain Cost Analysis The following tables allocate costs and returns for coffee industry stakeholders at various stages of the supply chain. The estimates are based on a field assessment and are verified with previous research undertaken in the sector. Assumptions have also been verified by industry stakeholders. Table 13 Smallholder selling Arabica traditional dried bean "Asalan" (per hectare) Income (per hectare) Unit Volume IDR/Unit IDR USDTrees per hectare 250Harvested cherries/tree kg 21Harvested cherries kg 5,250
Conversion of cherries to parchment kg/l 1.8Parchment 2,917
Conversion of parchment to Asalan GB litre/kg A 4.0Dry fermented bean "Asalan" 12%WC 729 14,000 10,208,333
Total Income 10,208,333 1,134 Production Costs (per hectare)Labour pruning + weeding lbr days 13 15,000 195,000 22 Labour harvest days 250 15,000 3,750,000 417 Trad pulping process (luvak) kg 729 100 72,917 8 Fermentation and drying 5,250 100 525,000
Total Production Costs 4,542,917 446
Gross Profit/Margin per hectare 5,665,417 688 The returns for best practice growing, harvesting and marketing through the Komodo Jaya company shows the returns achievable by improving post harvest practices and establishing direct links with coffee buyers.

Value chain analysis for SADI agri sectors The NTT Coffee Industry
______________________________________________________________________________ 30
Table 14 Smallholder selling Arabica parchment through Komodo Jaya buying group (per hectare) Income (per hectare) Unit Volume IDR/Unit IDR USDTrees per hectare 250Harvested cherries/tree kg 21Harvested cherries kg 5,250
Conversion of cherries to parchment kg/l 1.8Parchment litre 2,917 5,500 16,041,667 1,782 Total Income 16,041,667 1,782 Production Costs (per hectare)Labour pruning lbr days 13 15,000 195,000 22 Labour harvest days 250 15,000 3,750,000 417 Pulping kg 5,250 100 525,000 58 Fermentation, drying & handling kg 5,250 100 525,000 58
1,533 Rp/lTotal Production Costs 4,470,000 497
Gross Profit/Margin per hectare 11,571,667 1,286 Collector of fresh cherries and processor The table below shows the estimated returns for a local collector buying fresh cherries undertaking pulping, fermentation and drying to parchment stage and selling to local buyers. Some farmers with better access to labour and capital (such as a head of farmer group) also fulfil the collector role for their local villages as a means of improving their income. Table 15 Income (per tonne) Unit Volume IDR/Unit IDR USDFresh cherries collected tonnes 60Harvested cherries kg 60,000
Conversion of cherries to parchment kg/l 1.8Parchment 33,333 5,500 183,333,333 Waste from fermentation 1,538 13,000 19,994,000
Total Income 203,327,333 22,591.93 Production Costs (per tonne)Fresh cherry kg 60,000 2,500 150,000,000 16,666.67 Transport from farms kg 60,000 50 3,000,000 333.33 Pulping cherries kg 60,000 100 6,000,000 666.67 Fermenation, wash and dry kg 15,000 500 7,500,000 833.33 Transport and handling kg 15,000 150 2,250,000 250.00 Restribution kg 15,000 100 1,500,000 166.67 Total Costs 170,250,000 18,916.67
Gross Profit/Margin (per tonne) 33,077,333 3,675.26 Coffee processor for Flores coffee- parchment to green bean for export The table below shows indicative returns for processors undertaking contract processing an exporter. Profitability for this intermediary is based on the quality of parchment (i.e., defects and waste material), transport costs and volumes.

Value chain analysis for SADI agri sectors The NTT Coffee Industry
______________________________________________________________________________ 31
Table 16 Income Unit Volume IDR/Unit IDR USDYield from parchment to kilos (grade 1) 3.25 Processing fee (grade 1 G Bean) kg 1.00 2,300 2,300 0.26
Total Income 2,300
Production CostsProcessing kg 1 2,100 -
Densmtris testing kg 1 40 40 Hulling kg 1 50 50 Drying kg 1 131 131 Sorting kg 1 300 300 Other processing costs kg 1 79 79
Total Processing Costs kg - Tranpsort (Flores-Makassar) kg 480 480 Overheads (e.g., wharehouse) kg 1,000 1,000 Other costsTotal Production Costs 2,080 0.23
Gross Profit/Margin per kilo green bean 220 0.02 Coffee exporter buying parchment and exporting green bean The table below shows indicative returns for exporters buying parchment direct from farmers and paying collectors, a contract processor to process from parchment to green form and exporting on international markets. Table 17 Income Unit Volume IDR/Unit IDR USD
Export sales of Green Bean kg 1.00 25,200
Total Income 25,200 2.80
Production CostsRaw materials (parchment) litre 3.25 5,500 17,875 1.99 10% loss- hand grading litre 0.33 5,500 1,788 0.20 Operational Cost Collector litre 3.58 600 2,145 0.24 Processing fee kg 1 2,100 2,100 0.23 Other costs kg 1 - - Total Production Costs 23,908 2.66
Gross Profit/Margin per kilo green bean 1,293 0.14
The diagram below illustrates how value is distributed along the coffee value chain from the farmer to the exporter. This diagram, in combination with the estimate of economic returns made in the tables above, show that farmers are able to capture a higher proportion of the final export price by selling parchment as opposed to selling fresh cherries. This value-added activity can be achieved without significant increases in total costs (see tables above). What is not shown in the figure below are the margins made by roasters and coffee retailers (selling coffee drinks) in the US market. Indonesian coffee industry experts believe that roasting adds a further (USD) $23 dollars per kilo and processing into finished coffee drinks adds a further $45 per kilo.

Value chain analysis for SADI agri sectors The NTT Coffee Industry
______________________________________________________________________________ 32
Figure 7
Coffee Value Chain PricesPrices received by farmer through Komodo Jaya buying group
(Price (Rp/kg) or kg equivalent)
Farmer(fresh cherries
Collector(selling
parchment)
LocalTrader/
Komodo Jaya
Makassar Exporter(Green Bean)
2,500
22,000
25,200(USD2.80)
Cost of Production
1,533
15-23,000
Farmer(“Asalan”)
14,000 (per kg equivalent for 1 litre)
Toll processing parchment to GBRp2,100/kg

Value chain analysis for SADI agri sectors
_____________________________________________________________________________________________________________________ 33
7. NTT Coffee Product Value Chain Table – From Smallholder Perspective INBOUND LOGISTICS
Observations
Issues Recommended Strategies
HUMAN RESOURCE MANAGEMENT
Farmers are able to produce coffee in highland areas with no synthetic fertiliser inputs or pesticides. Farmers view the Juria variety as their family heritage and so have traditional knowledge of managing coffee trees. Farmers usually share coffee harvest duties and other major events.
Farmers generally lack knowledge of the best practices for managing trees (e.g. pruning and harvest).
Assist key stakeholders (e.g., Lion Lestari, PD. Komodo Jaya, DINAS, etc.) to improve local farmers knowledge and skills through demonstration and extension programmes. Include farm budgeting skills and training programmes so that farmers are able to save cash for any necessary farm inputs.
TECHNOLOGY AND DEVELOPMENT
Knowledge and access to on-farm pulping machines are poor. The quality of seedlings provided by government can be poor.
A reliance on family labour and other labour from the village can mean it's difficult to train farm labour to select only the best quality cherries.
Assist key stakeholders (e.g., Lion Lestari, PD. Komodo Jaya, DINAS, etc.) to improve local farmers knowledge and access to pulping machinery and best practice harvest management. Involve key stakeholders in improving quality of seedling Establish demonstration farm to improve region specific knowledge of input use and culture selection, including leverage IFC’s Sulawesi program.

Value chain analysis for SADI agri sectors
_____________________________________________________________________________________________________________________ 34
INBOUND LOGISTICS
PROCUREMENT
Farmers lack capital for routine expenses due to a lack of cash income from other crops.
Farmers lack capital to pay for improved technologies and improved seedlings and lack the time and knowledge to train harvest labour
Use existing farmer groups to research opportunities to improve farmer-access to finance through IFC SADI's A2F program. Explore the feasibility of a warehouse receipts program and how it could be applied for NTT coffee growers to improve access to finance.
OPERATIONS (Production)
Observations
Issues Recommended Strategies
HUMAN RESOURCE MANAGEMENT
Lack of understanding of post harvest produces poor quality coffee beans.
Poor harvest practices and post harvest fermentation practices produces a wide range of coffee quality and creates incentives for traders to mix high quality was poor quality coffee. The result is that market opportunities are limited by these practices.
Work with existing stakeholders (e.g. buyers and farmer groups) to expand the current coverage of supply chain programs, such as FairTrade and Starbucks certification. Working with "model farmers" may help to change farmers attitudes to traditional post harvest practices (e.g., encouraging the use of field pulping with the traditional luvak pulper)

Value chain analysis for SADI agri sectors
_____________________________________________________________________________________________________________________ 35
TECHNOLOGY AND DEVELOPMENT
Best practice field luvak pulpers are not always available for farmers.
Buyers accept poor quality of coffee pay low prices and therefore the supply chain has adapted to sell a wide range of coffee quality.
Work with existing stakeholders (e.g. buyers and farmer groups) to expand the current coverage of supply chain programs, such as FairTrade and Starbucks certification. Collaborate with CV. Lion Lestari to establish demonstration farm with farmer groups to improve the knowledge of best practices.
PROCUREMENT
Access to agri-inputs for low land Robusta coffee producers can be limited by a lack of capital. Farmers also lack capital for harvest and routine household consumption.
A lack of access to capital and for on-farm practices reduces coffee quality.
Use existing farmer groups to research opportunities to improve farmer-access to finance through IFC SADI's A2F program. Collaborate with national research institutions (e.g., Coffee and Cocoa Research Centre in Jember) to improve on-farm practices. Establish demonstration farm to improve region specific knowledge of input use and culture selection, including leverage IFC’s Sulawesi program.

Value chain analysis for SADI agri sectors
_____________________________________________________________________________________________________________________ 36
OUTBOUND LOGISTICS
Observations
Issues Recommended Strategies
HUMAN RESOURCE MANAGEMENT
Farmers understand that improved quality is likely to result in higher prices .
A lack of knowledge and capital limit farmers’ ability to improve coffee quality, production and coffee returns.
Establish a demonstration farm to improve region specific knowledge of input use and culture selection, including leverage IFC’s Sulawesi program. Work with local traders and collectors to helping them understand the potential benefits of improved pricing and mixing practices may improve the overall quality of coffee produced in target sub-districts.
TECHNOLOGY AND DEVELOPMENT
Current pulping and post harvest fermentation practices result in poor quality coffee. The topography can be a major barrier to deliver coffee to central collectors and processors due to the risk that dry fermented coffee can become tainted.
In remote areas which is transportation became a constraint, coffee farmers usually produce Ose green bean (asalan), resulting in poor prices and a wide range of quality.
Conduct further research on whether current coffee transport and collection systems in NTT can be improved through investmen t in infrastructure or provision of finance to supply chain intermediaries. Encourage ACIAR (SP 3) to identify best practices technology for post harvest and processing with existing industry buyers and stakeholders.
PROCUREMENT The seasonal nature of cash income for smallholder farmers can mean that farmers lack cash for routine household consumption and lab
Current system of Ijon for forward payment and finance can conceal actual market prices from smallholders.
Use existing farmer groups to research opportunities to improve farmer-access to finance through IFC SADI's A2F program.

Value chain analysis for SADI agri sectors
_____________________________________________________________________________________________________________________ 37
OUTBOUND LOGISTICS
Observations
Issues Recommended Strategies
for harvest. The current marketing channels can be complex resulting in a number of transactions prior to processing.
Explore the feasibility of a warehouse receipts program and how it could be applied for NTT coffee growers to improve access to finance. Encourage agreement between buyers and farmers on required coffee quality.
MARKETING AND SALES
Observations
Issues Recommended Strategies
HUMAN RESOURCE MANAGEMENT
Knowledge of prices can be limited in remote areas.
Farmers are often in a weak bargaining position at the time of sale.
Explore the feasibility of a warehouse receipts program and how it could be applied for NTT coffee growers to improve access to price information and timely capital.

Value chain analysis for SADI agri sectors
_____________________________________________________________________________________________________________________ 38
TECHNOLOGY AND DEVELOPMENT
Poor methods of transportation from fields to village and central buying stations can reduce coffee quality. A lack of adequate telecommunication facilities can limit price information. Existing roading infrastructure does not seem to present a barrier to transporting coffee around Ruteng however, more remote areas are affected by poor infrastructure.
Coffee quality can be reduced from beans developing a musty taste while stored in bags at moisture levels above 12%. Farmers only have limited access to price information.
Conduct further research on whether current coffee transport and collection systems in NTT can be improved through investment in infrastructure or provision of finance to supply chain intermediaries. Research the benefits of improved telecommunications in remote areas to improve price information to farmers.
PROCUREMENT
In highland areas farmers mainly rely on coffee for cash income.
A reliance on coffee for cash income can expose smallholders to the risk of price fluctuations and seasonal effects on production.
Investigate how smallholders can improve their total annual income by diversified and their sources of income by developing an integrated farming system.

Value chain analysis for SADI agri sectors
_____________________________________________________________________________________________________________________ 39
SERVICE
Observations
Issues Recommended Strategies
HUMAN RESOURCE MANAGEMENT
Lack of understanding by local government (e.g., DINAS and BAPPEDA) on smallholder needs and issues. A lack of understanding and inability of coffee chain intermediaries to provide for smallholder coffee farmers’ basic imports and marketing services. A strong traditional socio hierarchy exists at the Village and sub district level.
Local government usually design program using a top down approach Market failures mean that the private sector doesn't usually require a high standard of coffee.
Involve local government institutions (e.g., DINAS and BAPPEDA) and private sector collectors and traders in demonstration farm and extension programmes to improve the industry's understanding of farmers’ needs and issues; and vice versa.
TECHNOLOGY AND DEVELOPMENT
The involvement of local government in technology dissemination is poor.
Current private sector buyers believe that existing post harvest practice recommendations from national research institutes do not result in improved coffee quality.
Engage national research providers with existing lead buying firms to reach agreement on optimum recommended harvest and post harvest practices.
PROCUREMENT
The role of financial institution in funding the smallholders farmer is very limited
Limited access to finance in the off-season means that farmers lack cash for routine household consumption and are forced to rely on "Ijon" for forward payment on expected coffee harvest.
Encourage collaboration between IFC SADI’s A2F program, lead coffee buyers and farmer groups to develop smallholder finance programs.

Value chain analysis for SADI agri sectors
______________________________________________________________________________ 40
8. Summary of Industry Potential, Issues and Recommendations 8.1. Industry Potential The sector profile and value chain cost analysis identifies the potential for improved smallholder coffee returns. The main factors that give the NTT province potential in this regard are summarised below. • Indonesian coffee has natural low acidity and high body flavour due to the soils and
climate. This style is different to the natural high acidity-low body coffee produced in Brazil and Central America. Consumers in the largest export market (USA) prefer the Indonesian style putting the industry in a favourable position. One of the main barriers to increasing exports is the wide range in quality, largely due to poor on-farm post harvest practices.
• There has already been interest shown in parts of NTT, namely Flores, as a region
producing distinctive flavoured “Juria” Arabica coffee and will invest in developing and improving supply in the region (Flores is 35-40% Juria). The nature of Flores soils, climate, tree varieties and climates in growing areas give coffee this distinctive flavour. Small volumes of Grade 1 coffee were exported from Ngada in 2006 for Rp 24,000 kg, over 30 percent higher than equivalent coffee from other regions.
• There may be potential for other parts of NTT (e.g., Sumba) to also take advantage of
this opportunity to supply lead firms such as Starbucks for the benefit of smallholders.
• The mountain climate in some areas reduce pest and disease challenge and current
production practices have very low inputs. This production system produces a heavier bean (favoured by buyers and receiving 10% better price for parchment) and would make the transition to organic production and certification relatively smooth if viable market opportunities became available.
• There are areas of undeveloped land that could potentially be planted in coffee and
areas that require rehabilitation that would increase the region’s total production. • Smallholder farm gate prices are affected by world prices. World coffee prices are
currently strong, supported by high demand for mild flavoured coffees such as Arabica. The demand for specialty and differentiated coffee is growing rapidly. The short to medium term price outlook is favourable for these styles.
• The analysis shows that there is potential to lift smallholder returns by improving
post harvest fermentation practices and working with existing buying groups (e.g., Komodo Jaya) to improve smallholder returns.
• Anecdotal evidence suggests that farmers could improve returns by increasing
yields of Arabica and Robusta varieties with improved access to finance for inputs and crop husbandry.
Value chain analysis for SADI agri sectors
______________________________________________________________________________ 41
8.2. Industry Issues and Value Chain Analysis The following points summarise the main issues for the coffee industry, as they relate to the needs of smallholders.
• Current coffee crop yields are low due to a lack of tree management and pruning, reducing yields and producers returns. In lowland areas farmers lack an understanding of pest and disease management and access to inputs to lift yields and bean quality.
• The quality of bean and parchment sold by farmers varies greatly between villages and seasons and is also affected by poor post harvest practices. The variation in bean quality forces traders to use mixing practices that reduce the overall farm gate price.
• Farmers in upland areas rely heavily on Arabica coffee for cash income (proximity to markets and limited arable land limits other cash enterprises). Farmers relying on coffee for cash income are exposed to the risk of poor coffee yields due to changeable seasonal weather. Anecdotal evidence suggests that weather patterns are becoming less predictable.
• There is no ‘open market’ for smallholders to sell coffee and the practice of making 50 percent advance payments through collectors (Ijon) can result in a lack of transparency on the final price. Anecdotal evidence suggests that the “Ijon” (and final price) can depend on how urgently the smallholder needs the money.
• A risk for the Indonesian industry is the current lack of processing capacity to handle increasing volumes of coffee being produced. This puts the industry at risk of developing a reputation as low quality producer.
• The local port of Reo doesn’t have a container ship facility so coffee must be shipped in sacks to Makassar (for current speciality buyer) and containerised there before export.
• Current post harvest practices mean that parchment must be dried and sold within a few days otherwise beans developed a “musty” taint. Improved drying practices (drying parchment down to 12% moisture) reduce the need for farmers to immediately sell coffee and provide farmers with more flexible marketing options.
• There are currently no local institutions able to ensure the geographical authenticity of NTT coffee exported under a specific geographical identity such as “Flores Coffee”. Despite place names being the main point of quality differentiation for importers and roasters in export markets (according to previous studies), place names are applied to coffee at the site of export and is to a large extent, arbitrary. Recent moves by corporate coffee buyers to establish geographical identity for Flores Coffee (primarily Starbucks and the use of FairTrade certification) appear to be positive steps in ensuring that price premiums reach producers.
Value chain analysis for SADI agri sectors
______________________________________________________________________________ 42
• The coffee supply chain is relatively efficient although current collector and trader handling practices (e.g., poor processing, mixing coffee grades) distort price-quality signals and reduce the incentive for most farmers to undertake best practice post-harvest handling.
• Current post harvest practices promoted by Indonesian Centre of Coffee and Cocoa Research (Jember) are not favoured by private sector buyers.
• NTT coffee producers are susceptible to world price fluctuations in world commodity markets for green bean coffee.
• The current mixed quality of coffee produced in NTT makes farmers susceptible to heavy price discounts from collectors and traders and puts them in a weak selling position.
• Smallholders face a number of other barriers to improving returns associated with supporting structures and related industries:
– Farmers have little or no access to working capital to purchase necessary agri-inputs in a timely manner;
– Low availability of improved seedlings to begin a cycle of replacing old and senile trees;
– A low level of extension services provided by government Ministry of Agriculture or DINAS;
8.3. Recommendations for IFC TA The following points summarise the key recommendations that arise out of the value chain analysis and field research. The recommendations are aimed at improving smallholder returns through a long-term (3-10 year) Technical Assistance (TA) program.
• Work with existing buying groups and processors (e.g., Lion Lestari) to expand Flores operation and/or replicate farmers accreditation and improved post harvest practices in Sumba.
• Provide business development services to the Komodo Jaya buying group to manage current financial and operational problems and improve its level of service to smallholders.
• Include risk management strategies for farmers in demonstration and improved practices programme such as having a mix of Robusta and Arabica trees. This can help to manage market (price fluctuations) and production risks that can result from unseasonably wet or dry weather at flowering. An unseasonably wet flowering season has the opposite effect on Robusta as it does on Arabica. Having a mix of Arabica and Robusta coffee can be a good way for farmers to manage this risk.
• Undertake further research into the home consumption and cash income needs of smallholders in coffee producing areas so that IFC TA can be directed at reducing smallholder-dependence on coffee for income by developing other

Value chain analysis for SADI agri sectors
______________________________________________________________________________ 43
potential crops/enterprises.
• Undertake further research into the environmental sustainability of the current coffee producing practices to minimise environmental degradation and ensure farmers have long-term future in economically viable coffee growing.
• Improve smallholders’ access to working capital by assisting the development of improved farmer loan capacity within local banks and PUSKUD. The IFC A2F program will have an important linking role in this TA intervention. New models of making capital available to smallholders via farmer associations and marketing mechanisms should be explored.
• Engage the BEE component of the IFC SADI subprogram to investigate and understand what institutional support is required to ensure geographical authenticity of coffee produced in NTT and exported from Makassar under specific geographical identities.
• Establish a demonstration farm with existing lead buying firms and farmers’ buying groups to improve coffee quality, growing and post harvest practices. A demonstration farm program should include the following components:
– Training on tree pruning and management of agri-inputs – Replacement of senile trees, seedling selection and planting – Nutrient and pest and disease requirements – Safe handling of agri-chemicals and principles of sustainable agriculture
and environmental protection (e.g., the Good Agricultural Practices (GAP) standard).
– Improved post harvest handling to pulping, fermentation and drying practices
– Inter-row cropping in newly planted areas – Farm planning and budgeting
• Engage local DINAS in demonstration farm field days so that the DINAS becomes an initiator of future smallholder training sessions.

Value chain analysis for SADI agri sectors
______________________________________________________________________________ 44
References AEKI. 1990. Produksi dan Tataniaga Kopi di Indonesia (Production and Marketing of Coffee
in Indonesia). Asosiasi Eksportir Kopi Indonesia (Indonesian Coffee Exporter Association). Jakarta.
DGEC. 2003. Statistical Estate Crops of Indonesia, 2002. Directorate General of Estate Crops, Indonesian Ministry of Agriculture. Jakarta.
______. 2006. Statistical Estate Crops of Indonesia, 2005. Directorate General of Estate Crops, Indonesian Ministry of Agriculture. Jakarta.
Jong, 1997. Imperfections in the Coffee Market : the Influence of the Earning of Indonesian Coffee Farmer. Working Paper Graduate of the Faculty of Economics. University of Groningen. The Hague.
Kustiari, R. 2007. Analisis Ekonomi tentang Posisi dan Prospek Kopi Indonesia di Pasar Internasional (Economic Analysis on Indonesian Coffee’s Position and Prospect in International Markets). Doctoral Dissertation. IPB. Bogor.
Lewin, B., Giovannucci, D., Varangis, P. (2004). Coffee Markets New Paradigms in Global Supply and Demand
Najiyati and Danarti. 2006. Kopi, Budidaya, dan Penanganan Lepas Panen (Coffee, Cultivation, and Postharvest Handling). Penebar Swadaya. Yogyakarta.
Neilson, J. (2004) The politics of place- Geographical identities along the coffee supply chain from Toraja to Tokyo, Chapter 14; Food Chains

Value chain analysis for SADI agri sectors
______________________________________________________________________________ 45
APPENDIX 1
Wet Coffee Bean Processing
Picking Sorting Dried Processing
Pulping
selected fresh coffee bean
red fresh coffee bean
floating coffee bean
coffee’s skin
Fermenting
husked and phlegm coffee bean
Drying
husked and phlegm coffee bean
husked and non phlegm coffee bean
Hulling
husked and dried coffee bean
Sorting
husked and epidermis skin
dried coffee bean

Value chain analysis for SADI agri sectors
______________________________________________________________________________ 46
Dried Coffee Bean Processing
Picking Sorting
Drying
red/green and damage coffee bean
red fresh coffee bean
dried fresh coffee bean
husked and epidermis skins
floating coffee bean
Hulling
Sorting
dried coffee bean
Wet Processing
Dried Processing
green/damaged coffee bean

Value chain analysis for SADI agri sectors
______________________________________________________________________________ 47
List of people met Kornel Gartner, Coffee Processing and Exporter. Jl. Tulip C1 No. 31. Makassar 90231, South Sulawesi, Indonesia Pak Donsius, Komodo Jaya Company, Ruteng, Flores NTT. Carolus (Biting Village, Pocoranaka District, Manggarai Regency), coffee farmer/local collector Carolus is coffee farmer and local collector trader as well as head of farmer’s group (100 members who own 1 hectare of coffee farm averagely). Carolus informed that the price of coffee farm land in his village is about Rp 7.5 million/250 m2 (Rp 300 million/ha). Male hired labour cost is Rp 15,000/person/day (8 hours/day, excluding meal cost), while female hired labour is less about 75 percent than male hired labour cost. As a local collector trader, Carolus just purchased Robusta Coffee from farmers in his village. Carolus received coffee from farmers in his house on Monday to Friday and sold it to Ruteng every Saturday. Trading capital derived from trader in Ruteng (Kelimutu Shop) of about Rp 25-30 million per week Carolus purchased coffee from farmers based on standard price which has been determined by trader (Rp 8,000-10,000/kg). Carolus obtained net profit about Rp 500/kg after reducing transportation cost to Ruteng of about Rp 10,000/sack (100 kg/sack). Averagely, Carolus purchased 2.5-3 tons of coffee per week during peak harvested period (June-August) and about 700-800 kg per week during lean harvested period (April, May, September, and October). Carolus informed that there are 15 local collector traders in his village. Coffee purchased farmer’s coffee which was simply dried within two weeks on the ground. Carolus processed coffee using his pulper equipment without sorting. Processing cost was about Rp 10,000/sack (Rp 400/kg). Carolus has one unit of pulper equipment which was bought Rp 3 million six years ago. The capacity of pulper was about one sack (100 kg) per hour. This pulper was used to process Carolus’ coffee and other farmers’ coffees with the cost of Rp 400 per kilogram. Carolus informed that some people in his village cultivated rice and aqua culture (rice and fish in wet land). The cropping pattern was once a year. Apart from that, most of people in the village cultivated dry land with vegetable and secondary crops such as squash, string bean, tomato, chili, and cassava. Most of productions were consumed by farmers’ household. Cassava, in particular, was consumed by households and for feeding the swine. At present, farmer’s group is being rearranged. One of farmer’s group activities is making organic fertilizer under the guidance of local church organization. Organic fertilizer is sold Rp 40,000/sack (50 kg) as income source of farmer’s group.

Value chain analysis for SADI agri sectors
______________________________________________________________________________ 48
Ben Milo (Susu Village, Ngadabawa District, Ngada Regency), coffee farmer, trader. Beni Milo is coffee’s farmer, trader, and head of farmer’s group. Sometime in July 2004, PD Komodo Jaya approached local community in Susu Village, Ngadabawa District, Ngada Regency. However, people were not interested. Even PD Komodo Jaya tried to provide milk and tested Beni’s pulper, people were still uninterested. After socializing to community and sending processed coffee sample to PD Komodo Jaya, people were interested and willing to carry out coffee transaction with PD Komodo Jaya. Currently, there are two farmer’s group which are dealing with PD Komodo Jaya , namely “Karya Kasih” (25 members) and “Maju Bersama” (20 members). The average of coffee farm was 0.5-1 hectare per member. Both farmers’ groups are located in the districts of Bejawa and Golewa (central coffee producing areas of Ngada Regency). Farmers’ coffees were processed at Beni’s House. Processing coffees are as follows : (1) fresh coffee beans were collected and weighted at farmers’ house. Transportation cost to Beni’s house was about Rp 100/kg (15 km distance) and Rp 50/kg (5-6 km distance); (2) coffees were processed using pulper equipments (capacity of 2-3 tons/hour). Beni Milo has three units of pulper which was bought Rp 5 million per unit; (3) coffees were soaked in fermented trough (size of 2.5 x 1.75 x 0.80 meters and capacity of 2-3 tons) – cost for constructing fermented trough was Rp 3 million per unit; (4) coffees were washed and sorted in washed trough (size of 2 x 2.5 x 1 meters) and floated coffee beans were separated); (5) coffees were filtered and dried using plastic canvas (size of 60 x 25 meters and capacity of 8 tons) – dried process was normally carried out within one day; (6) coffees were sorted (broken coffee beans were separated) and kept in the store (size of 2.5 x 11 meters and capacity of 5 tons) for two days; and (6) handling process of coffees needed 20 workers which were hired Rp 25,000/person/day (without meal). Coffees were transported to PD Komodo Jaya in Ruteng (96 km distance) with transportation cost of about Rp 850,000/truck (5-5.5 tons capacity). Local tax (retribution) was Rp 100 per kilogram of fresh coffee bean price. There were no illegal taxes since Beni had authorization letter of legal tax. Selling price of coffee was Rp 5,000 per litre of parchment coffee (1 litre of parchment coffee is equal to 1.8 kg of fresh coffee bean). Farmer’s group obtained trading fee Rp 100 per litre, while Beni Milo gained profit of about Rp 500 per litre. Payment from PD Komodo Jaya had been conducted through Bank transfer or direct cash payment. Meanwhile, floated and broken (retained) coffee beans were milled and sold it Rp 13,000-14,000 per kilogram. Approximately, Beni Milo gained gross profit of about Rp 50 million per year with total hired labour costs of about Rp 15 million per year. Beni Milo had ever-unpleasant experience with PD Komodo Jaya in 2006. At that time , PD Komodo Jaya refused Beni’s coffees due to full capacity of the store of PD Komodo Jaya. Beni Milo sold his coffees to Chinese trader in Ruteng with the price of Rp 5,500 per litre (higher than the price of PD Komodo Jaya). The Chinese trader was a subscribed buyer of Beni’s fresh coffee beans previously (2001-2002). At that time, Beni gained average profit of about Rp 100 per kilogram. Even though Beni had unpleasant experience with PD Komodo Jaya, he was more interested in dealing with PD Komodo Jaya. Aggregately, he gained higher profit as compared to other coffee transactions such as Chinese trader. Apart from that, Beni perceived that he was provided by technical assistant from PD Komodo Jaya and his coffees were traded to international market (Starbuck).