value capture techniques in hong kong and tokyositeresources.worldbank.org/.../murakami-web.pdf ·...
TRANSCRIPT
1
Value Capture Techniques in Hong Kong and Tokyo:Strategic Transit Finance and Station Area Development
Jin MurakamiCity University of Hong Kong
Hong KongR+P Model
2
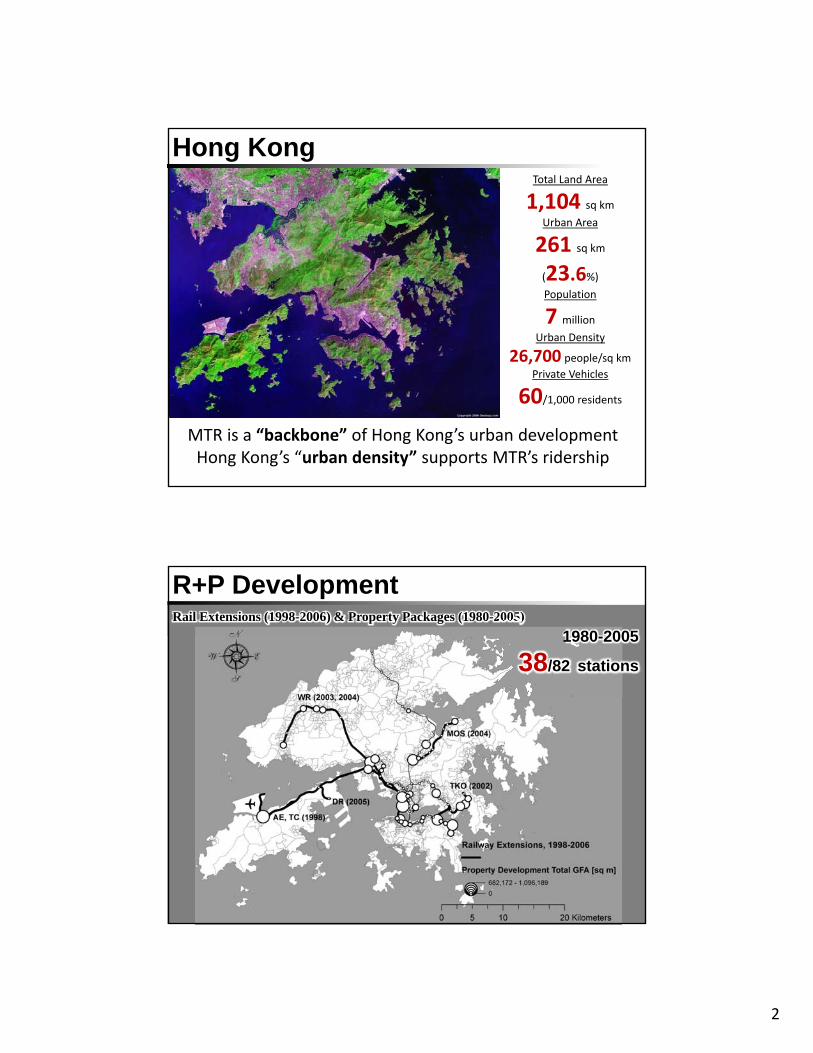
Total Land Area
1,104 sq km
Urban Area
261 sq km
(23.6%)
Population
7 million
Urban Density
26,700 people/sq km
Private Vehicles
60/1,000 residents
Hong Kong
MTR is a “backbone” of Hong Kong’s urban developmentHong Kong’s “urban density” supports MTR’s ridership
R+P DevelopmentRail Extensions (1998-2006) & Property Packages (1980-2005)
1980-2005
38/82 stations

3
MTR Corporation
http://eoimages.gsfc.nasa.gov/images/imagerecords/0/896/earth_lights_lrg.jpg
MTR Corporation, 2001-2010
Source: Murakami, Jin. 2012. Transit Value Capture
1 HKD = 0.27 BRL
Net
Op
erat
ing
inco
me
Value Capture Mechanism
http://eoimages.gsfc.nasa.gov/images/imagerecords/0/896/earth_lights_lrg.jpg
HKSAR
PrivateDevelopers
Development Rights
MTR Corp.R+P Programme
Green-fieldPrice
After-rail Price
Financial Return 1980-2005
US$18 billion

4
Integrated Development Package
Source: AL Stephan (2013)
Kowloon Station (1998‐2010): 13.5 ha
Station Typology
Source: Murakami (2010)
5
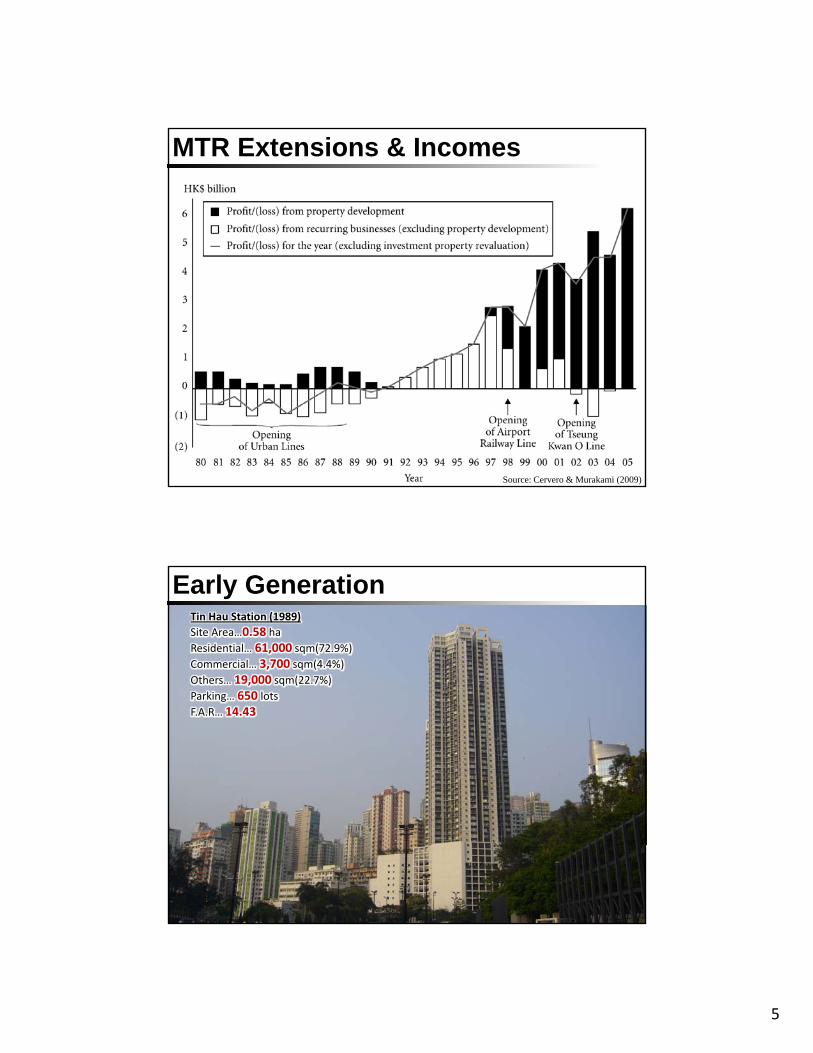
Source: Cervero & Murakami (2009)
MTR Extensions & Incomes
Early Generation
0.58ha0.58ha
Tin Hau Station (1989)
Site Area…0.58 ha
Residential… 61,000 sqm(72.9%)
Commercial… 3,700 sqm(4.4%)
Others… 19,000 sqm(22.7%)
Parking… 650 lotsF.A.R… 14.43
6
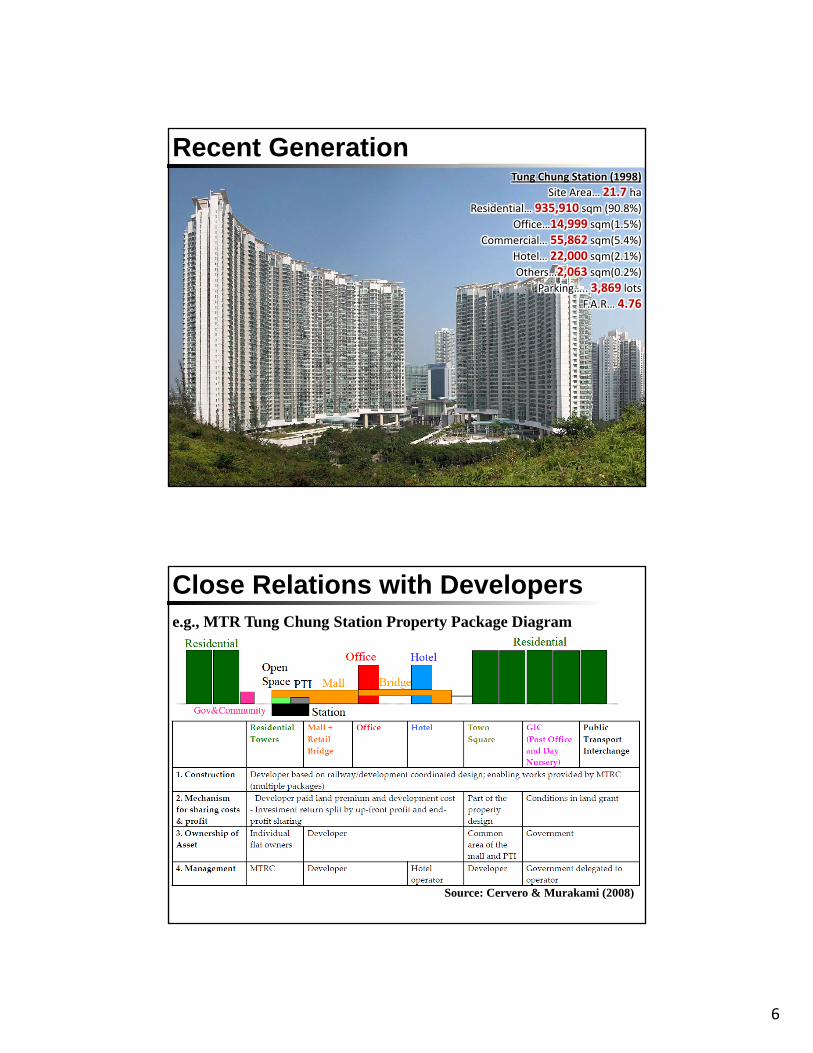
Recent Generation
21.70ha21.70ha
Tung Chung Station (1998)
Site Area… 21.7 haResidential… 935,910 sqm (90.8%)
Office…14,999 sqm(1.5%)
Commercial… 55,862 sqm(5.4%)
Hotel… 22,000 sqm(2.1%)
Others…2,063 sqm(0.2%)
Parking….. 3,869 lots
F.A.R… 4.76
Close Relations with Developerse.g., MTR Tung Chung Station Property Package Diagram
Source: Cervero & Murakami (2008)
7
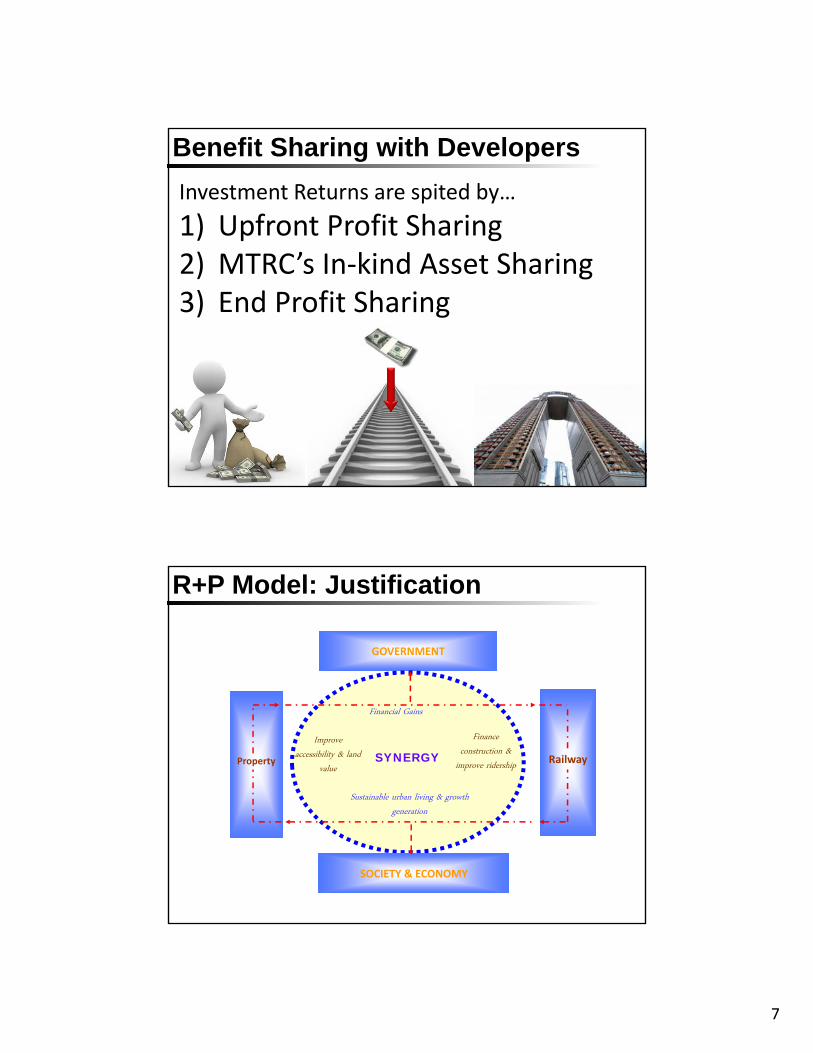
Benefit Sharing with Developers
Investment Returns are spited by…
1) Upfront Profit Sharing2) MTRC’s In‐kind Asset Sharing3) End Profit Sharing
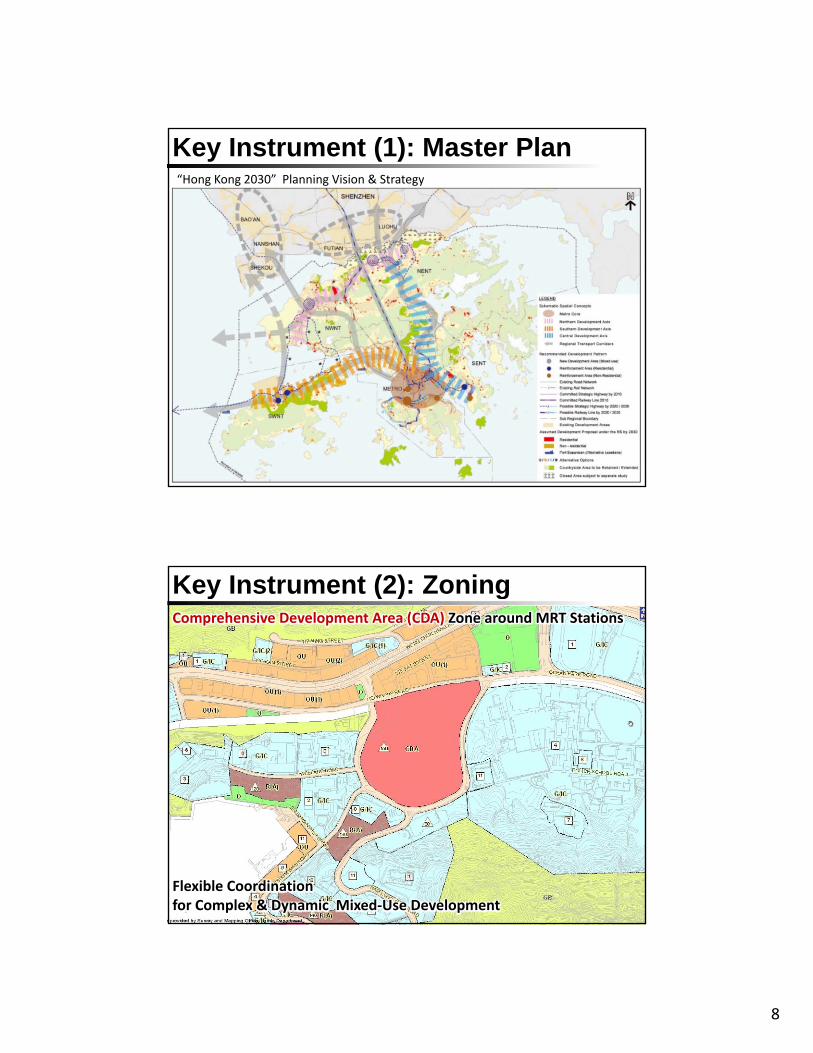
GOVERNMENT
Property RailwaySYNERGYImprove
accessibility & land value
SOCIETY & ECONOMY
Finance construction &
improve ridership
Financial Gains
Sustainable urban living & growth generation
R+P Model: Justification
8
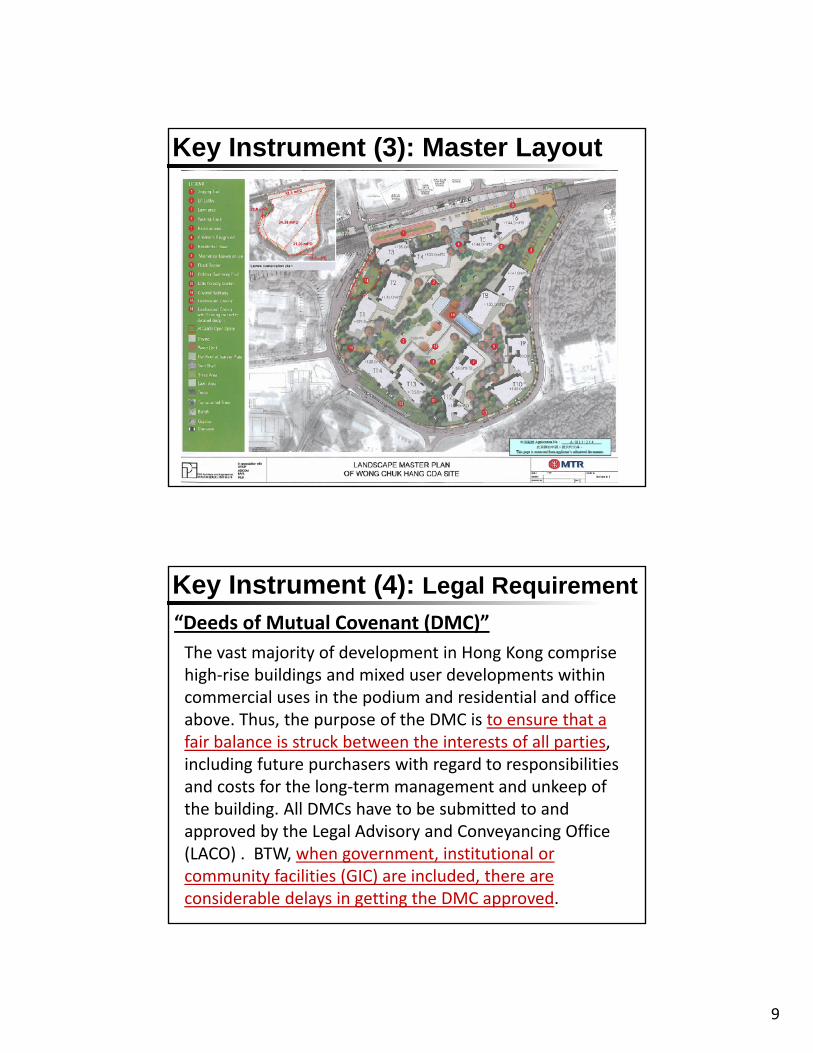
Key Instrument (1): Master Plan“Hong Kong 2030” Planning Vision & Strategy
Key Instrument (2): ZoningComprehensive Development Area (CDA) Zone around MRT Stations
Flexible Coordination for Complex & Dynamic Mixed‐Use Development
9
Key Instrument (3): Master Layout
Key Instrument (4): Legal Requirement
The vast majority of development in Hong Kong comprise high‐rise buildings and mixed user developments within commercial uses in the podium and residential and office above. Thus, the purpose of the DMC is to ensure that a fair balance is struck between the interests of all parties, including future purchasers with regard to responsibilities and costs for the long‐term management and unkeep of the building. All DMCs have to be submitted to and approved by the Legal Advisory and Conveyancing Office (LACO) . BTW, when government, institutional or community facilities (GIC) are included, there are considerable delays in getting the DMC approved.
“Deeds of Mutual Covenant (DMC)”
10
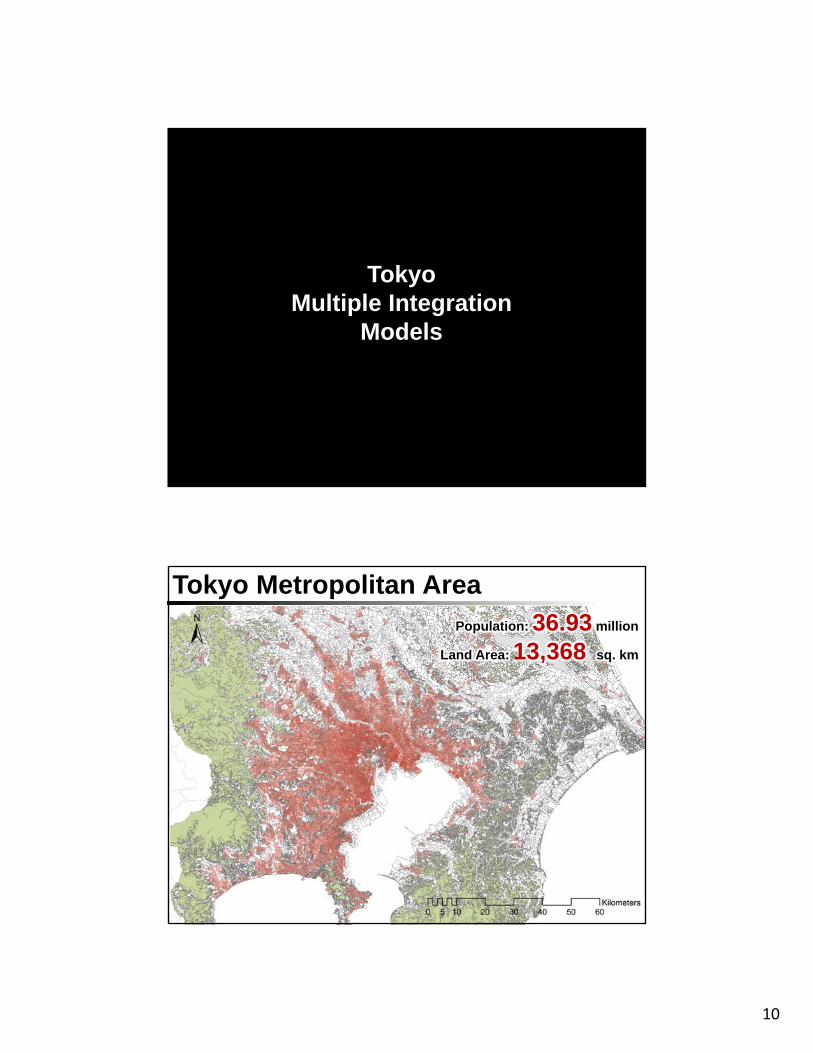
Tokyo Multiple Integration
Models
Tokyo Metropolitan AreaPopulation: 36.93 million
Land Area: 13,368 sq. km
11
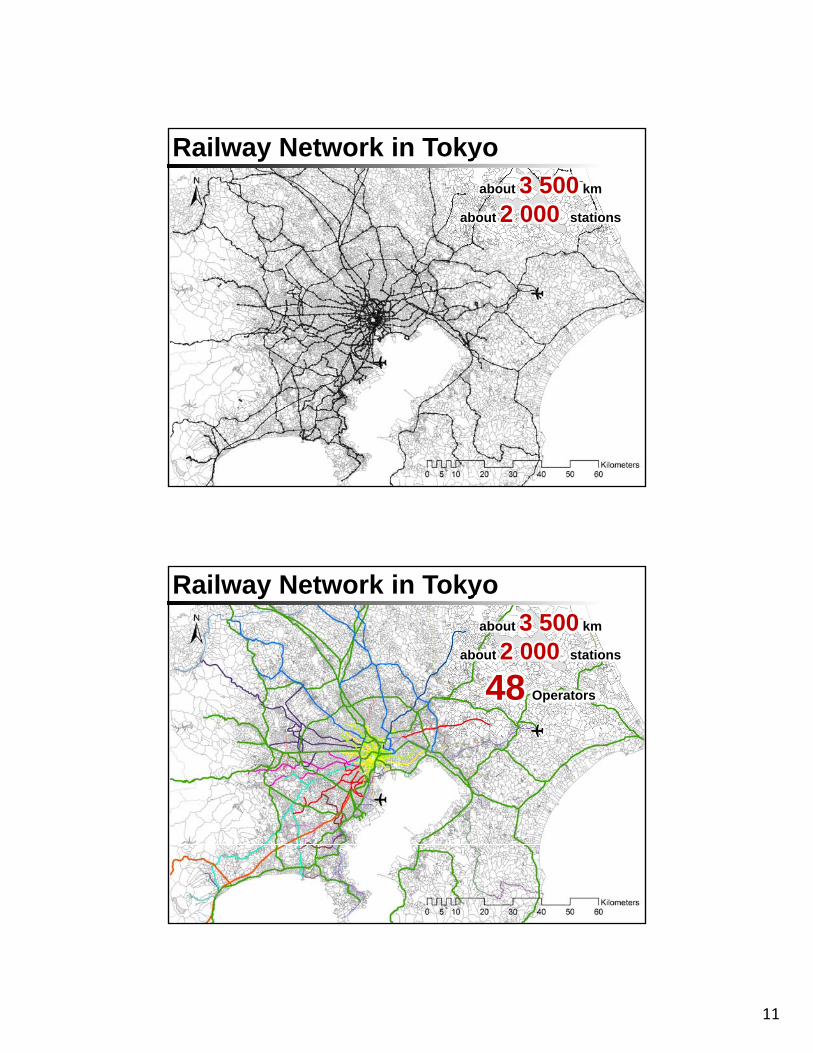
Railway Network in Tokyo
http://eoimages.gsfc.nasa.gov/images/imagerecords/0/896/earth_lights_lrg.jpg
about 3 500 km
about 2 000 stations
Railway Network in Tokyo
http://eoimages.gsfc.nasa.gov/images/imagerecords/0/896/earth_lights_lrg.jpg
about 3 500 km
about 2 000 stations
48 Operators
12
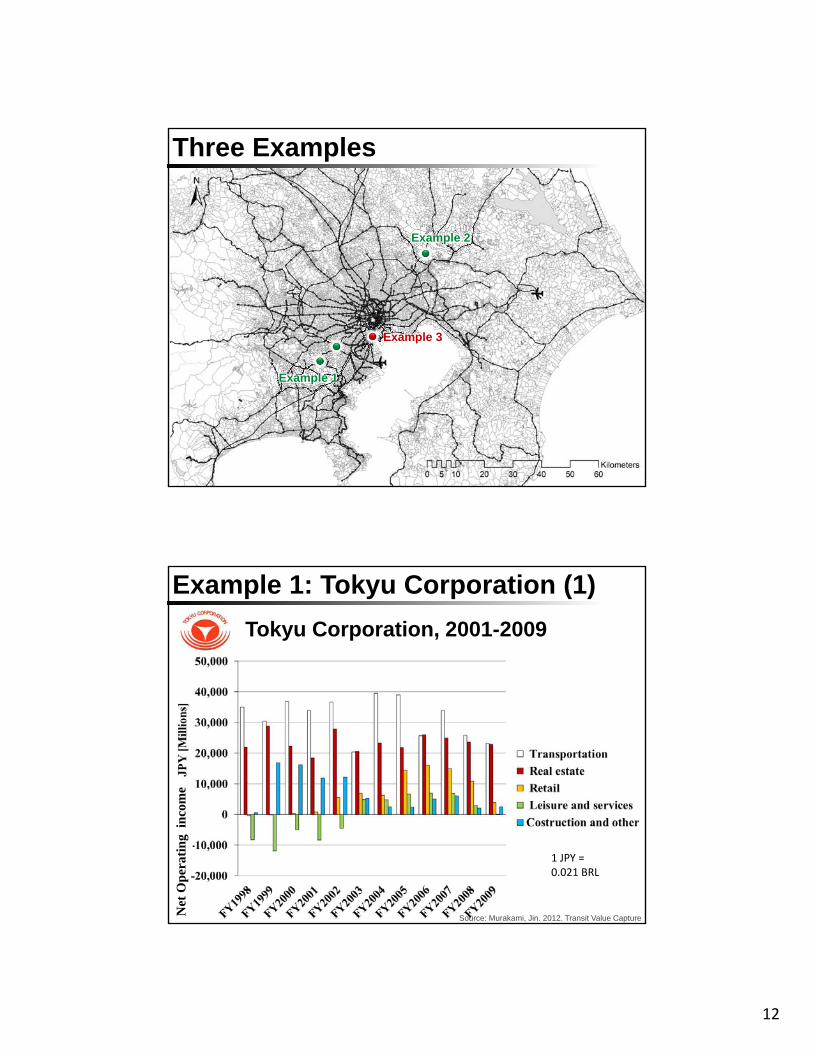
Three Examples
Example 3
Example 1
Example 2
Example 1: Tokyu Corporation (1)
http://eoimages.gsfc.nasa.gov/images/imagerecords/0/896/earth_lights_lrg.jpg
Tokyu Corporation, 2001-2009
Source: Murakami, Jin. 2012. Transit Value Capture
Net
Op
erat
ing
inco
me
1 JPY = 0.021 BRL
13
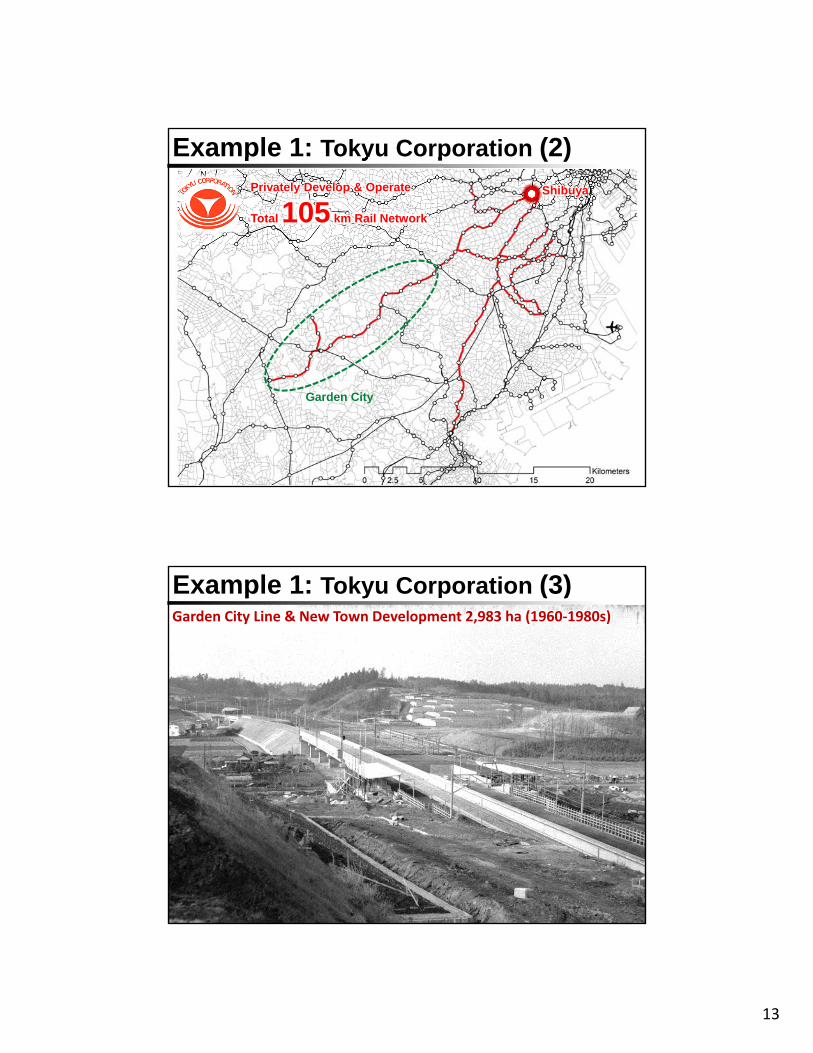
Example 1: Tokyu Corporation (2)Privately Develop & Operate
Total 105 km Rail Network
Garden City
Shibuya
Tama‐Plaza Station Area (5.1 ha)
Example 1: Tokyu Corporation (3)
Source: Nikken Sekkei Corporation
Garden City Line & New Town Development 2,983 ha (1960‐1980s)
14
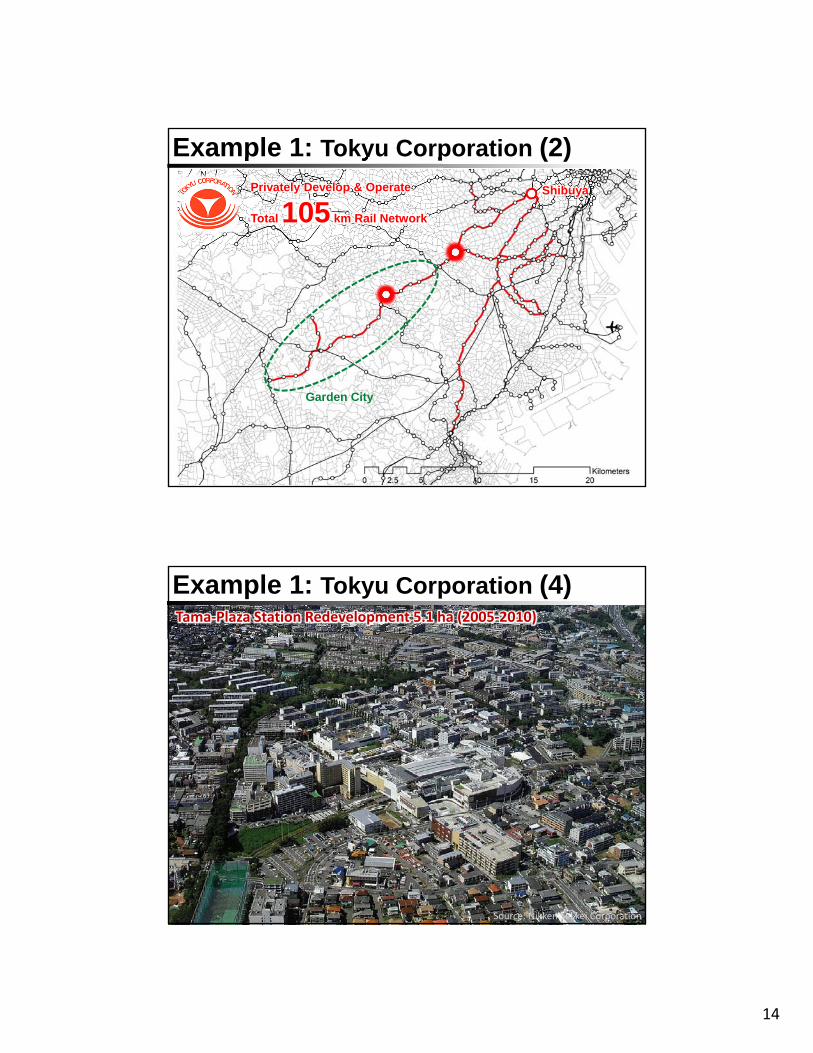
Example 1: Tokyu Corporation (2)Privately Develop & Operate
Total 105 km Rail Network
Garden City
Shibuya
Tama‐Plaza Station Redevelopment 5.1 ha (2005‐2010)
Example 1: Tokyu Corporation (4)
Source: Nikken Sekkei Corporation
15
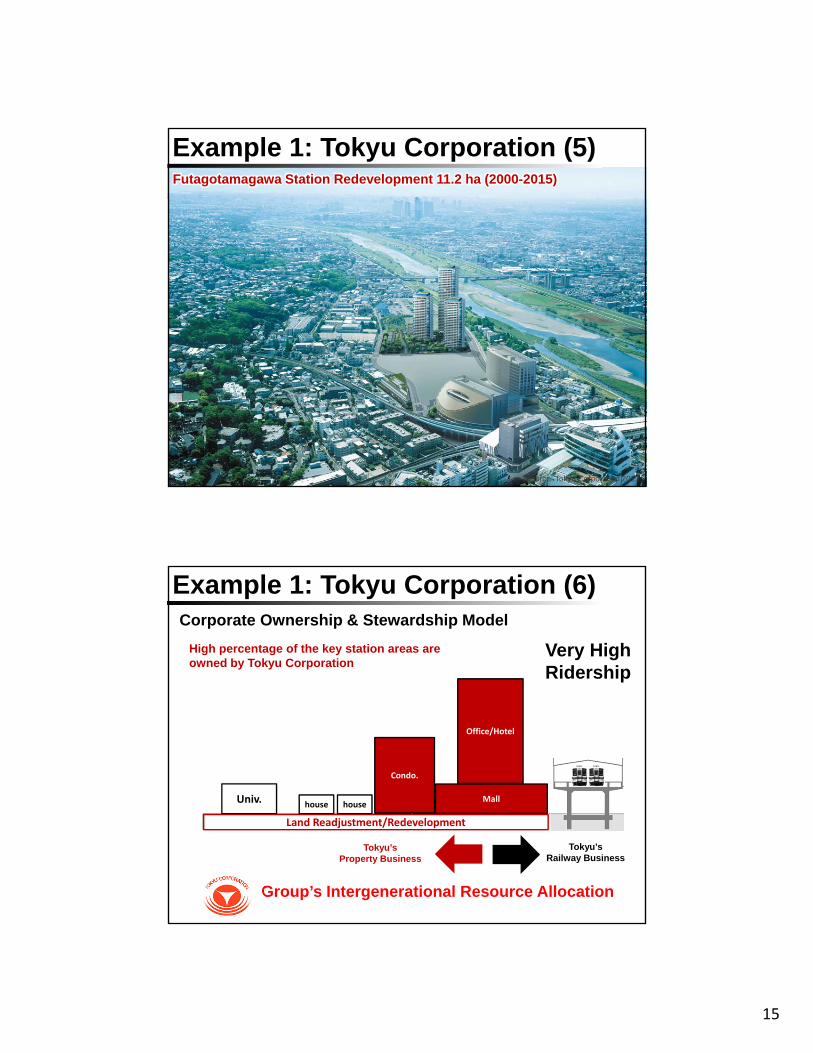
Futagotamagawa Station Redevelopment 11.2 ha (2000-2015)
Source: Tokyu Corporation 2013
Example 1: Tokyu Corporation (5)
Shop
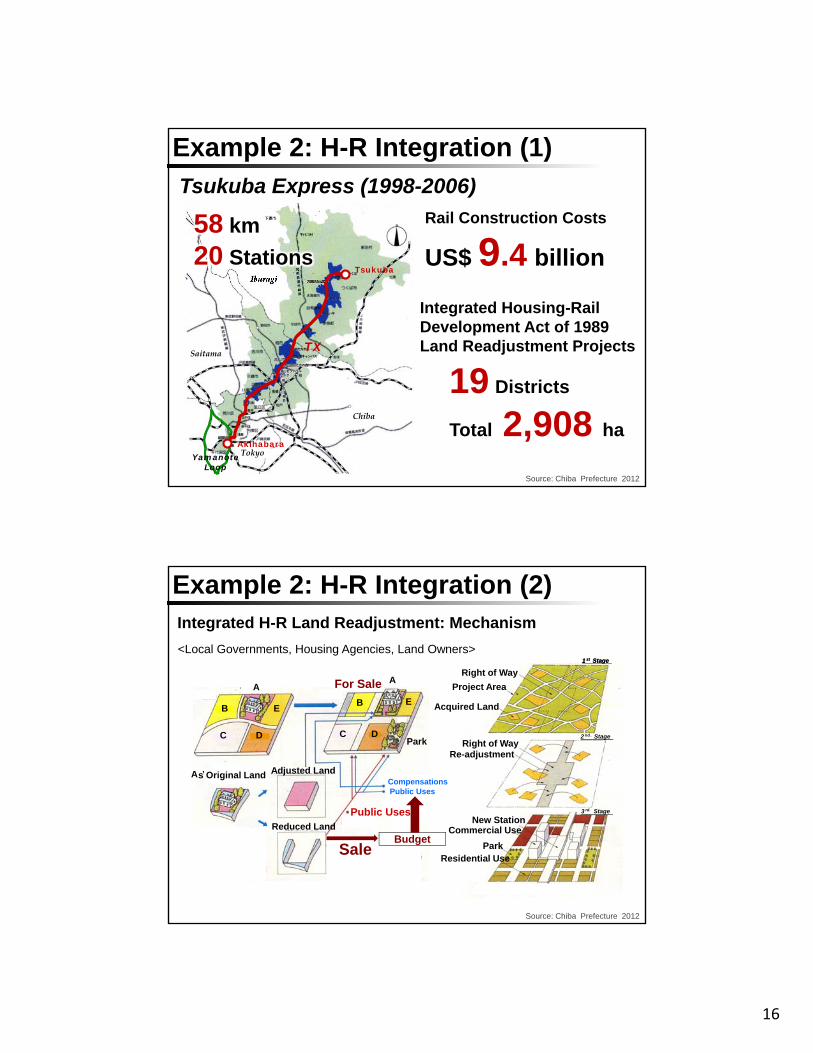
Corporate Ownership & Stewardship Model
Group’s Intergenerational Resource Allocation
Very-LowRidership
Farm LandLand Readjustment
Univ. house house house houseMall
High percentage of the key station areas are owned by Tokyu Corporation
Tokyu’sRailway Business
Tokyu’sProperty Business
HighRidership
Land Readjustment/Redevelopment
Condo.
Office/Hotel
Very HighRidership
Example 1: Tokyu Corporation (6)
16
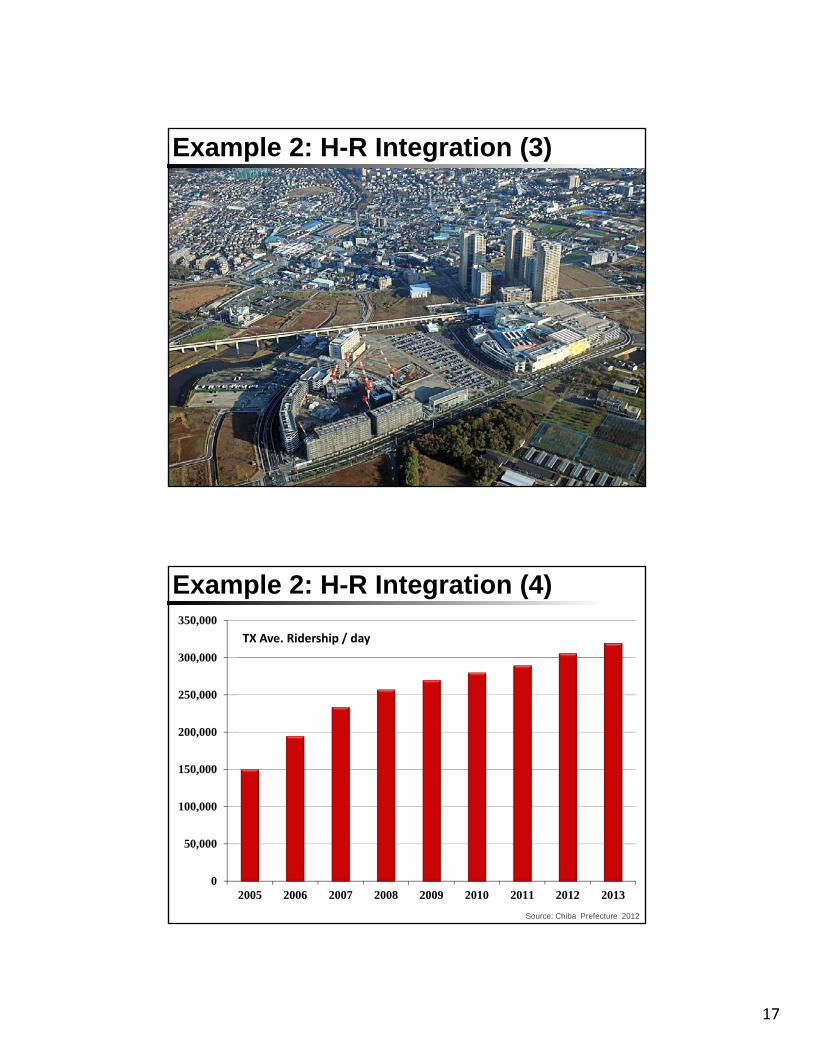
Example 2: H-R Integration (1)
Source: Chiba Prefecture 2012
Tsukuba Express (1998-2006)
Chiba
Ibaragi
Saitama
TokyoYamanoteLoop
TX
Tsukuba
AkihabaraPlanning AreaIntensive Area
Chiba
Ibaragi
Saitama
TokyoYamanoteLoop
TX
Tsukuba
AkihabaraPlanning AreaIntensive Area
58 km
20 Stations
Rail Construction Costs
US$ 9.4 billion
Integrated Housing-Rail Development Act of 1989Land Readjustment Projects
19 Districts
Total 2,908 ha
Example 2: H-R Integration (2)
Source: Chiba Prefecture 2012
AA
BB E
E
DDC C
Park
A’s Original Land Adjusted Land
Reduced Land
Public Uses
Investment
Public Budget
Public UsesCompensations
Sale
For SaleAA
BB E
E
DDC CPark
A ’s Original Land Adjusted Land
Reduced Land
Budget
Compensations
Sale
For Sale
Public Uses
Public Uses
1 st Stage
Right of Way
Land Re-adjustment Project Area
Acquired Land
Readjustment
2 nd . Stage
3 rd. StageNew Station
Right of Way
Commercial Use
Park
Residential Use
1 st Stage
Right of Way-Project Area
Acquired Land
Re-adjustment
2 nd . Stage
3 rd. Stage
New Station
Right of Way
Commercial Use
ParkResidential Use
Integrated H-R Land Readjustment: Mechanism
<Local Governments, Housing Agencies, Land Owners>
17
Example 2: H-R Integration (3)
Source: Chiba Prefecture 2012
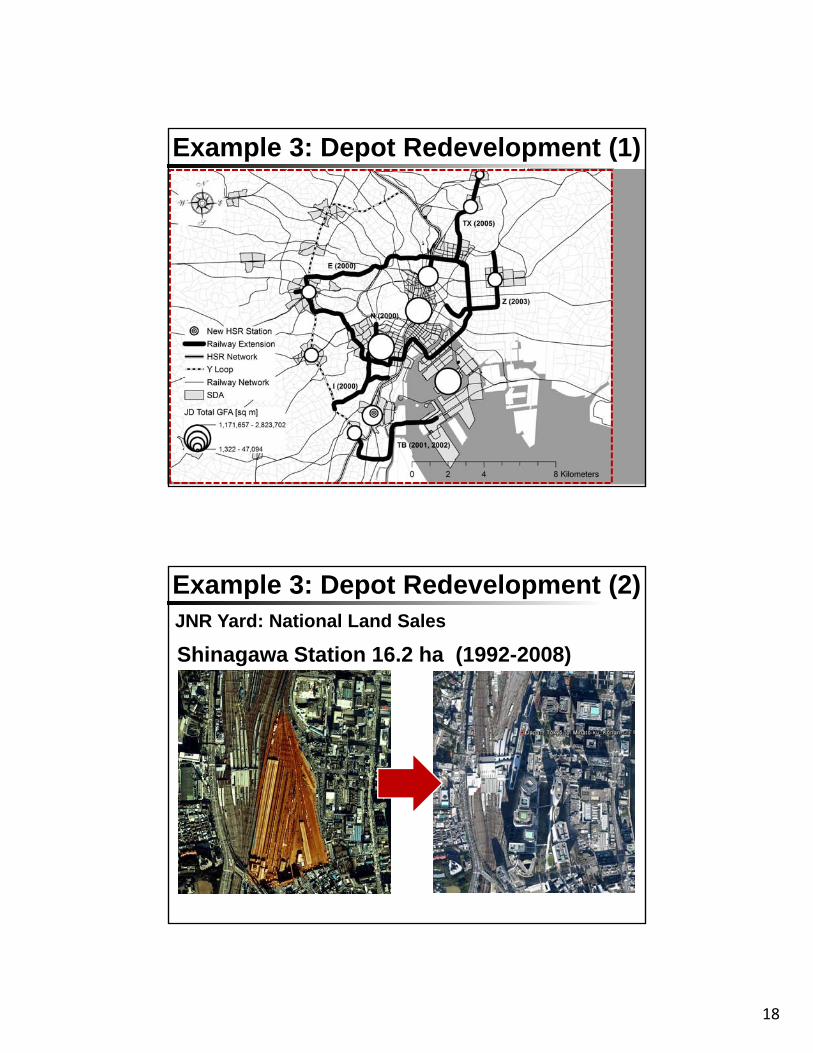
Example 2: H-R Integration (4)
Source: Chiba Prefecture 2012
0
50,000
100,000
150,000
200,000
250,000
300,000
350,000
2005 2006 2007 2008 2009 2010 2011 2012 2013
TX Ave. Ridership / day
18
Example 3: Depot Redevelopment (1)
Source: JNR Settlement Corporation 2008
Urban Regeneration
JNR Yard: National Land Sales
Shinagawa Station 16.2 ha (1992-2008)
Example 3: Depot Redevelopment (2)
19
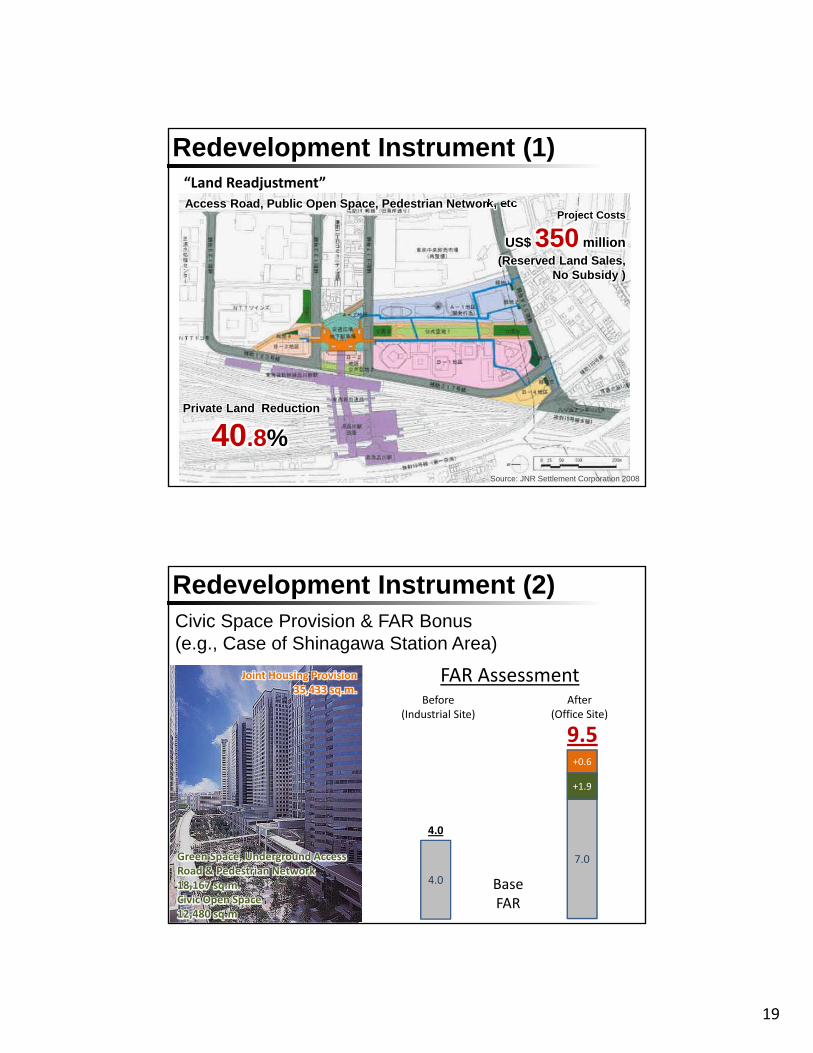
Redevelopment Instrument (1)
Original Land OwnershipSuperblock DistrictsAccess Road, Public Open Space, Pedestrian Network, etc
Private Land Reduction
40.8%
Source: JNR Settlement Corporation 2008
Project Costs
US$ 350 million(Reserved Land Sales,
No Subsidy )
“Land Readjustment”
Redevelopment Instrument (2)Civic Space Provision & FAR Bonus(e.g., Case of Shinagawa Station Area)
4.0
FAR AssessmentBefore
(Industrial Site)
4.0
7.0
BaseFAR
After(Office Site)
Green Space, Underground Access Road & Pedestrian Network18,167 sq.m. Civic Open Space12,480 sq.m
+1.9
Joint Housing Provision35,433 sq.m.
+0.6
9.5
20
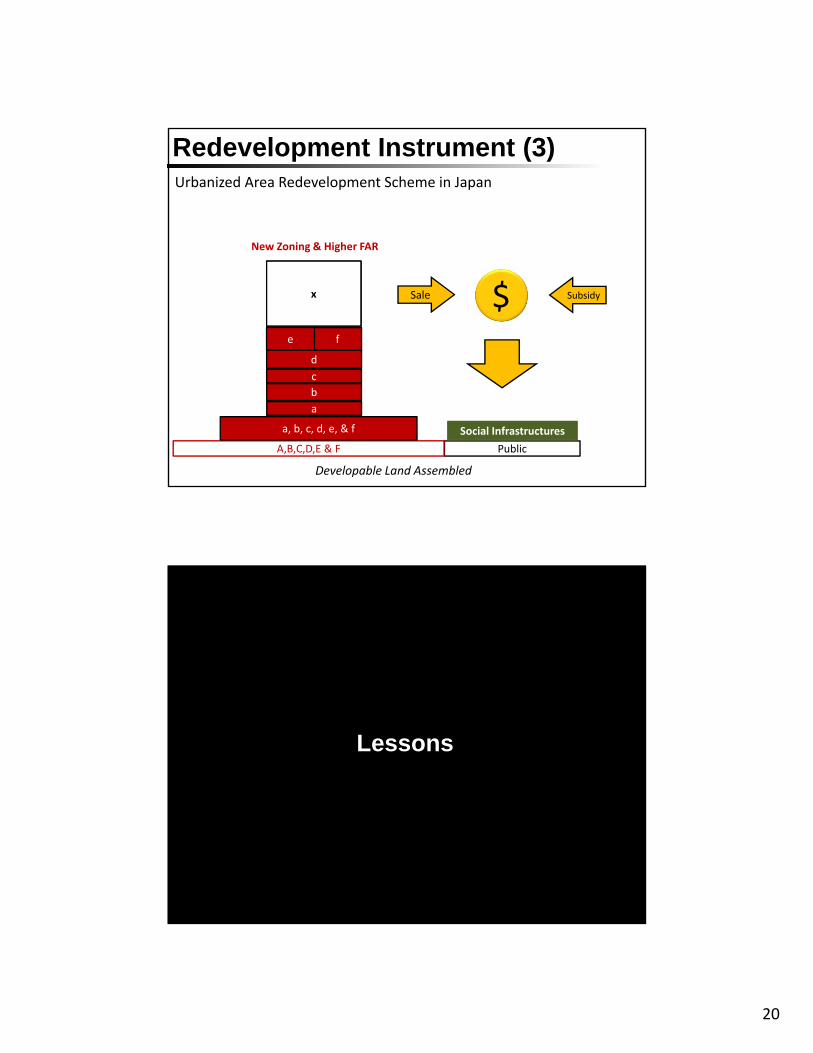
Redevelopment Instrument (3)
A B C D F F
a b cd e f
PublicA,B,C,D,E & F
a, b, c, d, e, & f
a
b
c
d
fe
xx Sale $ Subsidy
Social Infrastructures
New Zoning & Higher FAR
Developable Land Assembled
Urbanized Area Redevelopment Scheme in Japan
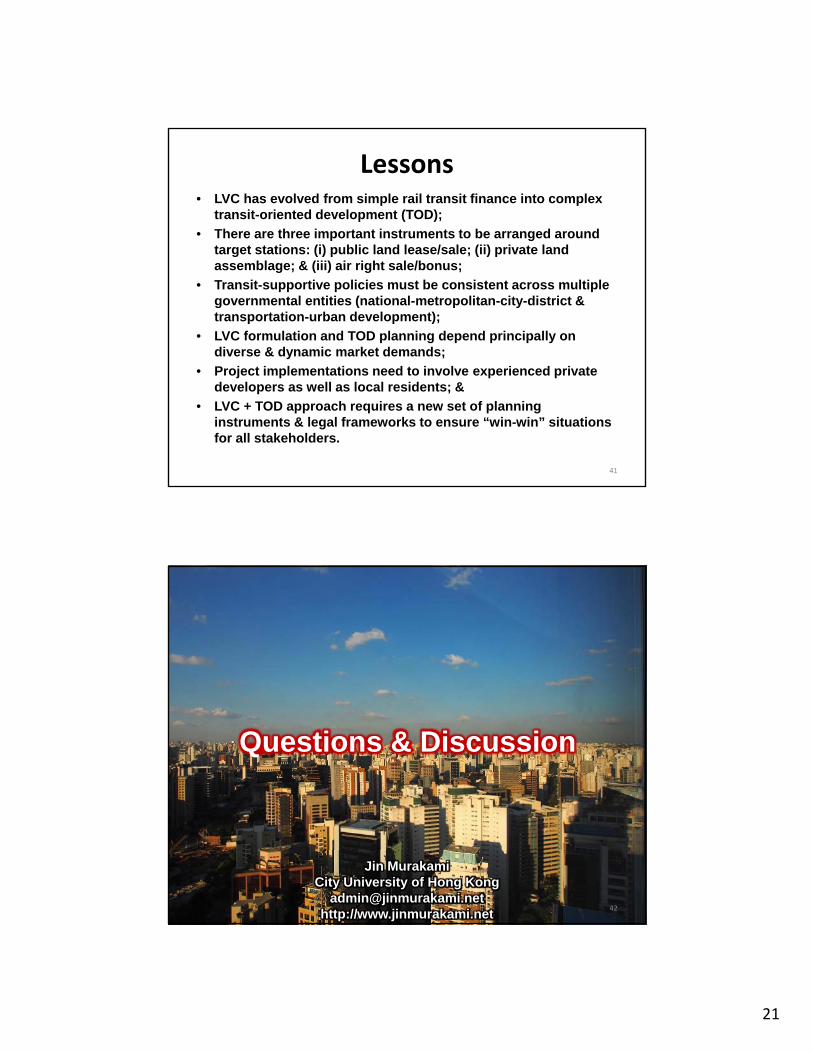
Lessons
21
Lessons• LVC has evolved from simple rail transit finance into complex
transit-oriented development (TOD);
• There are three important instruments to be arranged around target stations: (i) public land lease/sale; (ii) private land assemblage; & (iii) air right sale/bonus;
• Transit-supportive policies must be consistent across multiple governmental entities (national-metropolitan-city-district & transportation-urban development);
• LVC formulation and TOD planning depend principally on diverse & dynamic market demands;
• Project implementations need to involve experienced private developers as well as local residents; &
• LVC + TOD approach requires a new set of planning instruments & legal frameworks to ensure “win-win” situations for all stakeholders.
41
Questions & Discussion
Jin MurakamiCity University of Hong Kong
[email protected]://www.jinmurakami.net
42