valuation report of coal mining
TRANSCRIPT

8/12/2019 Valuation Report of Coal Mining
http://slidepdf.com/reader/full/valuation-report-of-coal-mining 1/71
APPENDIX VI VALUATION REPORT
VALUATION REPORT
INNER MONGOLIA YITAI GROUP COMPANY LIMITEDUNDERGROUND COAL MINING OPERATIONSInner Mongolia Autonomous RegionPeople’s Republic of China
Prepared For
INNER MONGOLIA YITAI COAL CO., LTD.
ByJohn T. Boyd CompanyMining and Geological ConsultantsPittsburgh, Pennsylvania
Report No. 3434.13March 2012
VI-1

8/12/2019 Valuation Report of Coal Mining
http://slidepdf.com/reader/full/valuation-report-of-coal-mining 2/71
APPENDIX VI VALUATION REPORT
John T. Boyd CompanyMining and Geological Consultants
Chairman
James W. Boyd 7 March 2012
File: 3434.13President and CEO
John T. Boyd II
Managing Director and COO
Ronald L. Lewis Inner Mongolia Yitai Coal Co., Ltd.Tianjiao North Road
Vice Presidents Dongsheng DistrictRichard L. Bate Ordos, Inner MongoliaJames F. Kvitkovich People’s Republic of ChinaRussell P. Moran
John L. Weiss
William P. Wolf Attention: Ms. Jian Qing’eSecretary of the Board of Directors
Vice President Subject: Valuation ReportBusiness Development Inner Mongolia Yitai Group Company LimitedGeorge Stepanovich, Jr. Underground Coal Mining Operations
Inner Mongolia Autonomous RegionManaging Director — Australia People’s Republic of ChinaIan L. Alexander
Managing Director — China
Dehui (David) Zhong
Ladies and Gentlemen:Assistant to the President
Mark P. Davic John T. Boyd Company (BOYD) was engaged on 23 June 2010 tocomplete an independent valuation of five underground coal mining
operations of Inner Mongolia Yitai Group Company Limited (YitaiGroup) located in the Dongsheng Coalfield in the Inner MongoliaAutonomous Region. The basis of coal resource and reserve reportingis the JORC Code and of valuation preparation is the VALMIN Code.
Pittsburgh4000 Town Center Boulevard, Suite 300Canonsburg, PA 15317(724) 873-4400(724) 873-4401 Fax
The reader is referred to a companion Competent Person’s Reportprepared by BOYD in March 2012, which provides the basis of theestimated coal reserves, mine plans, and related economics used toprepare this Valuation Report.
Denver(303) 293-8988
Brisbane
61 7 3232-5000 Respectfully submitted, [email protected]
Beijing JOHN T. BOYD COMPANY86 10 6500-5854 By:
Ronald L. LewisManaging Director and COO
www.jtboyd.com Competent Evaluator
VI-2

8/12/2019 Valuation Report of Coal Mining
http://slidepdf.com/reader/full/valuation-report-of-coal-mining 3/71
APPENDIX VI VALUATION REPORT
TABLE OF CONTENTS
Page
LETTER OF TRANSMITTAL . . . . . . . . . . . . . . . . . . . . . . . . . . . . . . . . . . . . . . . . . . . . . . . . . . . . . . . . . VI-2
TABLE OF CONTENTS . . . . . . . . . . . . . . . . . . . . . . . . . . . . . . . . . . . . . . . . . . . . . . . . . . . . . . . . . . . . . . VI-3
GLOSSARY AND DEFINITIONS . . . . . . . . . . . . . . . . . . . . . . . . . . . . . . . . . . . . . . . . . . . . . . . . . . . . . . . . VI-51.0 INTRODUCTION . . . . . . . . . . . . . . . . . . . . . . . . . . . . . . . . . . . . . . . . . . . . . . . . . . . . . . . . . . . . . . VI-9
1.1 Scope of Work/Purpose . . . . . . . . . . . . . . . . . . . . . . . . . . . . . . . . . . . . . . . . . . . . . . . . . . . . . . VI-9
1.2 Assets Summary Description . . . . . . . . . . . . . . . . . . . . . . . . . . . . . . . . . . . . . . . . . . . . . . . . . . VI-10
1.3 Source Data . . . . . . . . . . . . . . . . . . . . . . . . . . . . . . . . . . . . . . . . . . . . . . . . . . . . . . . . . . . . . . . VI-10
1.4 BOYD Background and Qualifications . . . . . . . . . . . . . . . . . . . . . . . . . . . . . . . . . . . . . . . . . . . VI-11
1.5 Competent Evaluator and Specialists . . . . . . . . . . . . . . . . . . . . . . . . . . . . . . . . . . . . . . . . . . . . VI-12
1.6 Certification of Competent Evaluator . . . . . . . . . . . . . . . . . . . . . . . . . . . . . . . . . . . . . . . . . . . VI-13
1.7 Reporting Considerations . . . . . . . . . . . . . . . . . . . . . . . . . . . . . . . . . . . . . . . . . . . . . . . . . . . . . VI-13
Figure
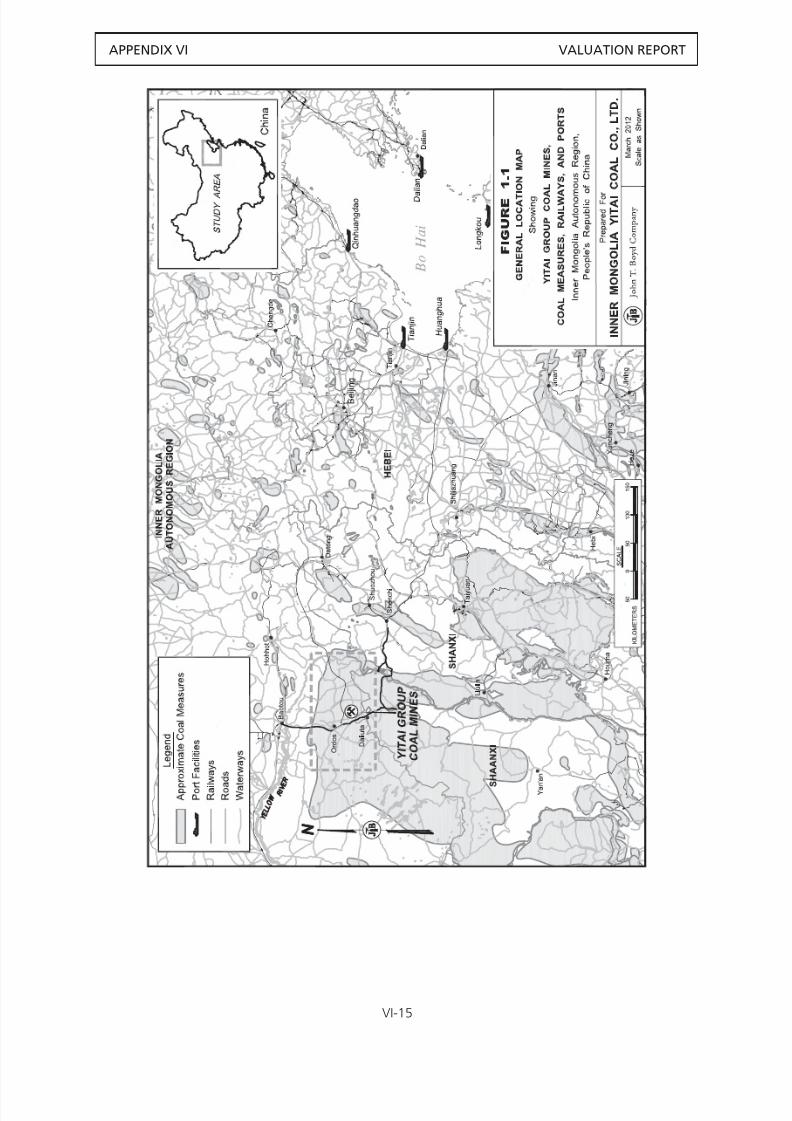
1.1: General Location Map Showing Yitai Group Coal Mines, Coal Measures, Railways, and Ports . . . . . . . . . . . . . . . . . . . . . . . . . . . . . . . . . . . . . . . . . . . . . . . . . . . . . . . . . . . . . . . . . . . . . . VI-15
1.2: Map Showing Mining and Exploration Right Areas and Selected TransportationInfrastructure . . . . . . . . . . . . . . . . . . . . . . . . . . . . . . . . . . . . . . . . . . . . . . . . . . . . . . . . . . . . . . . VI-16
2.0 VALUATION OPINION . . . . . . . . . . . . . . . . . . . . . . . . . . . . . . . . . . . . . . . . . . . . . . . . . . . . . . . . . . VI-17
3.0 SUMMARY OF ASSETS . . . . . . . . . . . . . . . . . . . . . . . . . . . . . . . . . . . . . . . . . . . . . . . . . . . . . . . . . VI-18
3.1 Introduction . . . . . . . . . . . . . . . . . . . . . . . . . . . . . . . . . . . . . . . . . . . . . . . . . . . . . . . . . . . . . . . VI-18
3.2 Geology and Resources . . . . . . . . . . . . . . . . . . . . . . . . . . . . . . . . . . . . . . . . . . . . . . . . . . . . . . VI-19
3.2.1 Geologic Setting . . . . . . . . . . . . . . . . . . . . . . . . . . . . . . . . . . . . . . . . . . . . . . . . . . . . . . . . VI-19
3.2.2 Resources and Reserves . . . . . . . . . . . . . . . . . . . . . . . . . . . . . . . . . . . . . . . . . . . . . . . . . . . VI-19
3.2.3 Coal Quality . . . . . . . . . . . . . . . . . . . . . . . . . . . . . . . . . . . . . . . . . . . . . . . . . . . . . . . . . . . . VI-19
3.3 Mine Operation . . . . . . . . . . . . . . . . . . . . . . . . . . . . . . . . . . . . . . . . . . . . . . . . . . . . . . . . . . . . VI-20
3.3.1 Mines . . . . . . . . . . . . . . . . . . . . . . . . . . . . . . . . . . . . . . . . . . . . . . . . . . . . . . . . . . . . . . . . . VI-20
3.3.2 Historical Production . . . . . . . . . . . . . . . . . . . . . . . . . . . . . . . . . . . . . . . . . . . . . . . . . . . . . VI-21
3.3.3 Staffing . . . . . . . . . . . . . . . . . . . . . . . . . . . . . . . . . . . . . . . . . . . . . . . . . . . . . . . . . . . . . . . VI-22
3.3.4 Mine Operating Costs . . . . . . . . . . . . . . . . . . . . . . . . . . . . . . . . . . . . . . . . . . . . . . . . . . . . VI-23
3.4 Life-of-Mine Planning . . . . . . . . . . . . . . . . . . . . . . . . . . . . . . . . . . . . . . . . . . . . . . . . . . . . . . . . VI-23
3.5 Future Operations . . . . . . . . . . . . . . . . . . . . . . . . . . . . . . . . . . . . . . . . . . . . . . . . . . . . . . . . . . VI-24
3.5.1 Three-Year Projections . . . . . . . . . . . . . . . . . . . . . . . . . . . . . . . . . . . . . . . . . . . . . . . . . . . VI-24
3.5.2 Capital Spending . . . . . . . . . . . . . . . . . . . . . . . . . . . . . . . . . . . . . . . . . . . . . . . . . . . . . . . . VI-26
3.5.3 Operating Costs . . . . . . . . . . . . . . . . . . . . . . . . . . . . . . . . . . . . . . . . . . . . . . . . . . . . . . . . . VI-26
3.6 Environmental Overview . . . . . . . . . . . . . . . . . . . . . . . . . . . . . . . . . . . . . . . . . . . . . . . . . . . . . VI-28
Tables
Estimated Operating Costs
3.1: Dadijing Mine . . . . . . . . . . . . . . . . . . . . . . . . . . . . . . . . . . . . . . . . . . . . . . . . . . . . . . . . . . . VI-30
3.2: Baoshan Mine . . . . . . . . . . . . . . . . . . . . . . . . . . . . . . . . . . . . . . . . . . . . . . . . . . . . . . . . . . . VI-32
3.3: Dingjiaqu Mine . . . . . . . . . . . . . . . . . . . . . . . . . . . . . . . . . . . . . . . . . . . . . . . . . . . . . . . . . . VI-33
3.4: Chengyi Mine . . . . . . . . . . . . . . . . . . . . . . . . . . . . . . . . . . . . . . . . . . . . . . . . . . . . . . . . . . . VI-34
3.5: Baijialiang Mine . . . . . . . . . . . . . . . . . . . . . . . . . . . . . . . . . . . . . . . . . . . . . . . . . . . . . . . . . . VI-35
3.6: Yitai Group Composite . . . . . . . . . . . . . . . . . . . . . . . . . . . . . . . . . . . . . . . . . . . . . . . . . . . . VI-36
3.7: Projected Operating Performance, Yitai Group Mines . . . . . . . . . . . . . . . . . . . . . . . . . . . . VI-38
VI-3

8/12/2019 Valuation Report of Coal Mining
http://slidepdf.com/reader/full/valuation-report-of-coal-mining 4/71
APPENDIX VI VALUATION REPORT
Page
Figures
LOM Plans
3.1: Dadijing Mine No. 3-2 Seam . . . . . . . . . . . . . . . . . . . . . . . . . . . . . . . . . . . . . . . . . . . . . . . . VI-39
3.2: Dadijing Mine, No. 4-2 Seam . . . . . . . . . . . . . . . . . . . . . . . . . . . . . . . . . . . . . . . . . . . . . . . VI-40
3.3: Dadijing Mine, No. 5-1 Seam . . . . . . . . . . . . . . . . . . . . . . . . . . . . . . . . . . . . . . . . . . . . . . . VI-413.4: Dadijing Mine, No. 5-2 Seam . . . . . . . . . . . . . . . . . . . . . . . . . . . . . . . . . . . . . . . . . . . . . . . VI-42
3.5: Baoshan Mine, No. 6 Seam . . . . . . . . . . . . . . . . . . . . . . . . . . . . . . . . . . . . . . . . . . . . . . . . . VI-43
3.6: Dingjiaqu Mine, No. 4-2 Seam . . . . . . . . . . . . . . . . . . . . . . . . . . . . . . . . . . . . . . . . . . . . . . VI-44
3.7: Dingjiaqu Mine, No. 5-2 Seam . . . . . . . . . . . . . . . . . . . . . . . . . . . . . . . . . . . . . . . . . . . . . . VI-45
3.8: Chengyi Mine, No. 5 Seam . . . . . . . . . . . . . . . . . . . . . . . . . . . . . . . . . . . . . . . . . . . . . . . . . VI-46
3.9: Chengyi Mine, No. 6 Seam . . . . . . . . . . . . . . . . . . . . . . . . . . . . . . . . . . . . . . . . . . . . . . . . . VI-47
3.10: Baijialiang Mine, No. 4-2 Seam . . . . . . . . . . . . . . . . . . . . . . . . . . . . . . . . . . . . . . . . . . . . . VI-48
4.0 VALUATION . . . . . . . . . . . . . . . . . . . . . . . . . . . . . . . . . . . . . . . . . . . . . . . . . . . . . . . . . . . . . . . . . VI-49
4.1 Introduction . . . . . . . . . . . . . . . . . . . . . . . . . . . . . . . . . . . . . . . . . . . . . . . . . . . . . . . . . . . . . . . VI-49
4.2 Risk Assessment . . . . . . . . . . . . . . . . . . . . . . . . . . . . . . . . . . . . . . . . . . . . . . . . . . . . . . . . . . . . VI-494.2.1 Introduction . . . . . . . . . . . . . . . . . . . . . . . . . . . . . . . . . . . . . . . . . . . . . . . . . . . . . . . . . . . . VI-49
4.2.2 General Assessment . . . . . . . . . . . . . . . . . . . . . . . . . . . . . . . . . . . . . . . . . . . . . . . . . . . . . VI-50
4.2.3 Geologic Risk . . . . . . . . . . . . . . . . . . . . . . . . . . . . . . . . . . . . . . . . . . . . . . . . . . . . . . . . . . . VI-51
4.2.4 Operational Risks — Naturally Occurring Events . . . . . . . . . . . . . . . . . . . . . . . . . . . . . . . . VI-51
4.2.5 Operational Production Risks . . . . . . . . . . . . . . . . . . . . . . . . . . . . . . . . . . . . . . . . . . . . . . VI-52
4.2.5.1 Production Risks . . . . . . . . . . . . . . . . . . . . . . . . . . . . . . . . . . . . . . . . . . . . . . . . . . . . . VI-52
4.2.5.2 Event Risks . . . . . . . . . . . . . . . . . . . . . . . . . . . . . . . . . . . . . . . . . . . . . . . . . . . . . . . . . VI-53
4.2.5.3 Major Underground Fires . . . . . . . . . . . . . . . . . . . . . . . . . . . . . . . . . . . . . . . . . . . . . . VI-53
4.2.5.4 Explosions . . . . . . . . . . . . . . . . . . . . . . . . . . . . . . . . . . . . . . . . . . . . . . . . . . . . . . . . . . VI-54
4.2.5.5 Floods . . . . . . . . . . . . . . . . . . . . . . . . . . . . . . . . . . . . . . . . . . . . . . . . . . . . . . . . . . . . . VI-554.2.6 External Risk — Regulation . . . . . . . . . . . . . . . . . . . . . . . . . . . . . . . . . . . . . . . . . . . . . . . . VI-55
4.2.7 Market Risk . . . . . . . . . . . . . . . . . . . . . . . . . . . . . . . . . . . . . . . . . . . . . . . . . . . . . . . . . . . . VI-56
4.3 Valuation Method Selected . . . . . . . . . . . . . . . . . . . . . . . . . . . . . . . . . . . . . . . . . . . . . . . . . . . VI-56
4.4 Major Assumptions . . . . . . . . . . . . . . . . . . . . . . . . . . . . . . . . . . . . . . . . . . . . . . . . . . . . . . . . . VI-57
4.5 Valuation Procedure . . . . . . . . . . . . . . . . . . . . . . . . . . . . . . . . . . . . . . . . . . . . . . . . . . . . . . . . . VI-58
4.6 Coal Pricing . . . . . . . . . . . . . . . . . . . . . . . . . . . . . . . . . . . . . . . . . . . . . . . . . . . . . . . . . . . . . . . VI-58
4.7 Base Case FMV . . . . . . . . . . . . . . . . . . . . . . . . . . . . . . . . . . . . . . . . . . . . . . . . . . . . . . . . . . . . . VI-59
4.8 Probable Value Range . . . . . . . . . . . . . . . . . . . . . . . . . . . . . . . . . . . . . . . . . . . . . . . . . . . . . . . VI-60
Tables
Discounted Cash Flow4.1: Dadijing Mine . . . . . . . . . . . . . . . . . . . . . . . . . . . . . . . . . . . . . . . . . . . . . . . . . . . . . . . . . . . VI-61
4.2: Baoshan Mine . . . . . . . . . . . . . . . . . . . . . . . . . . . . . . . . . . . . . . . . . . . . . . . . . . . . . . . . . . . VI-63
4.3: Dingjiaqu Mine . . . . . . . . . . . . . . . . . . . . . . . . . . . . . . . . . . . . . . . . . . . . . . . . . . . . . . . . . . VI-64
4.4: Chengyi Mine . . . . . . . . . . . . . . . . . . . . . . . . . . . . . . . . . . . . . . . . . . . . . . . . . . . . . . . . . . . VI-65
4.5: Baijialiang Mine . . . . . . . . . . . . . . . . . . . . . . . . . . . . . . . . . . . . . . . . . . . . . . . . . . . . . . . . . . VI-66
4.6: Yitai Group Composite . . . . . . . . . . . . . . . . . . . . . . . . . . . . . . . . . . . . . . . . . . . . . . . . . . . . VI-67
4.7: Coal Price Summary, Yitai Group Mines . . . . . . . . . . . . . . . . . . . . . . . . . . . . . . . . . . . . . . . VI-69
APPENDIX
A. 27 July 2010 Letter to John T. Boyd Company . . . . . . . . . . . . . . . . . . . . . . . . . . . . . . . . . . . . . VI-70
B. 1 March 2012 Letter to John T. Boyd Company . . . . . . . . . . . . . . . . . . . . . . . . . . . . . . . . . . . . VI-71
VI-4

8/12/2019 Valuation Report of Coal Mining
http://slidepdf.com/reader/full/valuation-report-of-coal-mining 5/71
APPENDIX VI VALUATION REPORT
GLOSSARY AND DEFINITIONS
The following terminology and definitions are used in this coal valuation report.
Terminology Source Definition
Competent Evaluator HKEx A Competent Person undertaking mineral valuations that
satisfy HKEx rule 18.23.Competent Person HKEx A person that satisfies HKEx rules 18.21 and 18.22.
DCF BOYD Discounted cash flow.
Depreciated ReplacementValue
BOYD The current value of a fixed or personal property/equipmentasset to an ongoing mining operation calculated bymultiplying the current (new) cost of an asset by itspercentage of remaining life. Percentage of remaining life isdetermined by dividing estimated remaining asset life by theassigned original useful life:
RLDRV = NC X (UL)DRV: Depreciated replacement valueNC: New cost
RL: Remaining life
UL: Useful original life
Remaining life is the appraiser’s judgment regarding suchfactors as age, operating schedule, maintenance history,obsolescence, condition, remaining mine life, and overalloriginal useful life of the asset. If the asset is useful to themining operation and does not have a life as long as theremaining mine life, then the asset must be replaced. If minelife is shorter than remaining life, the installed useful life ofthe asset ends with termination of mining (with possiblysome salvage value remaining).
This method yields the highest value for the asset, predicatedon the premium paid for a required asset which is installedand in-service as part of an ongoing business. Depreciatedreplacement value has no relationship to accounting practices(book value) or to prevailing market conditions for usedmining equipment.
Expert VALMIN D10: may be either:
(a) an “Independent individual” who prepares and acceptsresponsibility for a Report, or
(b) a “Representative Expert” who is the nominated
representative of a legally constituted body. He or shesupervises the preparation of a Report and acceptsresponsibility for it on behalf of that body.
Independent Individual Expert:
(a) must be Competent in and have had at least ten yearsof relevant and recent general mining experience in themining industry, as may be appropriate;
(b) have had at least five years of relevant and recentexperience in the assessment and/or valuation ofmineral assets or securities, as may be appropriate;
(c) hold appropriate licenses;
VI-5

8/12/2019 Valuation Report of Coal Mining
http://slidepdf.com/reader/full/valuation-report-of-coal-mining 6/71
APPENDIX VI VALUATION REPORT
Terminology Source Definition
(d) be a member of an appropriate professional associationhaving an enforceable code of ethics.
Representative Expert: should preferably have the samelength of experience and degree of competence as is requiredof an Independent Individual Expert. If this is not the case, he
or she must engage a “Senior Specialist” who:(a) is competent and has had at least ten years of relevant
and recent experience in the mining industry, as may beappropriate;
(b) has had at least five years of relevant and recentexperience in the assessment and/or valuation ofmineral assets and securities, as may be appropriate;
(c) holds the appropriate licenses;
(d) is a member of an appropriate professional associationhaving an enforceable code of ethics.
Fair Market Value VALMIN D43: the amount of money (or the cash equivalent of someother consideration) determined by the Expert in accordancewith the provisions of the VALMIN Code for which themineral asset should change hands on the Valuation Date inan open and unrestricted market between a willing buyer anda willing seller in an “arm’s length” transaction, with eachparty acting knowledgeably, prudently, and withoutcompulsion.
Feasibility Study HKEx A comprehensive design and costing study of the selectedoption for the development of a mineral project in whichappropriate assessments have been made of realisticallyassumed geological, mining, metallurgical, economic,marketing, legal, environmental, social, governmental,engineering, operational, and all other relevant factors, which
are considered in enough detail to demonstrate at the timeof reporting that extraction is reasonably justified and thefactors reasonably serve as the basis for a final decision by afinancial institution to finance the development of theproject.
Gross Cash Flow BOYD Revenue less operating cash cost; can be determined on apre-tax (income tax) or a post-tax basis.
Indicated Resource HKEx That part of a mineral Resource for which tonnage, densities,shape, physical characteristics, grade, and mineral contentcan be estimated with a reasonable level of confidence.
Inferred Resource HKEx That part of a mineral Resource for which tonnage, grade,and mineral content can be estimated with a low level of
confidence. It is inferred from geological evidence, sampling,and assumed but not verified geological and/or gradecontinuity.
JORC HKEx The Australasian Code for Reporting of Exploration Results,Mineral Resources and Ore Reserves (2004 edition), aspublished by the Joint Ore Reserves Committee, as amendedfrom time to time.
LOM BOYD Life-of-Mine.
Measured Resource HKEx That part of a mineral Resource for which tonnage, densities,shape, physical characteristics, grade, and mineral contentcan be estimated with a high level of confidence.
VI-6

8/12/2019 Valuation Report of Coal Mining
http://slidepdf.com/reader/full/valuation-report-of-coal-mining 7/71
APPENDIX VI VALUATION REPORT
Terminology Source Definition
Mineral VALMIN D19: any naturally occurring material found in or on theearth’s crust that is useful to and/or has a value placed on itby humankind, excluding crude oil, natural gas, coal-basedmethane, tar sands, and oil-shale, which are classified asPetroleum as defined in D35.
Mineral Asset VALMIN D20: all property, including but not limited to real property,intellectual property, mining, and exploration tenements heldor acquired in connection with the exploration of, thedevelopment of, and the production from those tenementstogether with all plant, equipment, and infrastructure ownedor acquired for the development, extraction, and processingof minerals in connection with those tenements. MostMineral Assets can be classified as either:
Exploration Areas — properties where mineralization may ormay not have been identified, but where a Mineral orPetroleum Resource has not been identified.
Advanced Exploration Areas — properties where
considerable exploration has been undertaken and specifictargets have been identified that warrant further detailedevaluation, usually by drill testing, trenching or some otherform of detailed geological sampling. A resource estimatemay or may not have been made but sufficient work willhave been undertaken on at least one prospect to provideboth a good understanding of the type of mineralizationpresent and encouragement that further work will elevateone or more of the prospects to the resource category.
Pre-Development Projects — properties where MineralResources have been identified and their extent estimated(possibly incompletely) but where a decision to proceed withdevelopment has not been made. Properties at the earlyassessment stage, properties for which a decision has beenmade not to proceed with development, properties on careand maintenance, and properties held on retention titles areincluded in this category if Mineral Resources have beenidentified, even if no further Valuation, Technical Assessment,delineation, or advanced exploration is being undertaken.
Development Projects — properties for which a decision hasbeen made to proceed with construction and/or production, butwhich are not yet commissioned or are not yet operating atdesign levels.
Operating Mines — mineral properties, particularly minesand processing plants, that have been commissioned and are
in production.
Net Cash Flow BOYD Gross Cash Flow less Capital Cost; can be expressed on apre-tax (income tax) or post-tax basis.
NPVs HKEx Net present values.
Off-Mine-Site Selling Costs BOYD Includes all transportation and sales component necessary toreach final point of dispatch (truck to rail dispatch, dispatchto port, port fees, rail fees, G&A, sales, commissions, taxesand/or miscellaneous fees).
VI-7

8/12/2019 Valuation Report of Coal Mining
http://slidepdf.com/reader/full/valuation-report-of-coal-mining 8/71
APPENDIX VI VALUATION REPORT
Terminology Source Definition
Prefeasibility Study HKEx A comprehensive study of the viability of a mineral projectthat has advanced to a stage where the mining method, forunderground mining, or the pit configuration, for an openpit, has been established and an effective method of mineralprocessing has been determined. It includes a financial
analysis based on realistically assumed or reasonableassumptions of technical, engineering, legal, operating,economic, social, and environmental factors and theevaluation of other relevant factors which are enough for aCompetent Person, acting reasonably, to determine if all orpart of the mineral Resource may be classified as a mineralReserve.
Probable Reserve HKEx With regard to minerals, the economically mineable part ofan Indicated, and in some circumstances a Measured,Resource.
Professional Association VALMIN D27: a self-regulating body such as one of engineers or
geoscientists or both that:(a) has been given authority or recognition by statute;
(b) admits members primarily on the basis of theiracademic qualifications and professional experience;
(c) requires compliance with professional standards ofexpertise and behavior according to a code of ethicsestablished by the association; and
(d) has enforceable disciplinary powers, including that ofsuspension or expulsion of a member, should its code ofethics be breached.
Proved Reserve HKEx With regard to minerals, the economically mineable part of aMeasured Resource.
Recognized ProfessionalOrganization
HKEx A self-regulatory organization of professional individuals inthe mining or petroleum industry which admits individuals onthe basis of their academic qualifications and experience,requires compliance with professional standards ofcompetence and ethics established by the organization, andhas disciplinary powers, including the power to suspend orexpel a member.
Reserve HKEx With regard to minerals, the economically mineable part of aMeasured, and/or Indicated Resource, taking into accountdiluting materials and allowances for losses, which may occur
when the material is mined. Appropriate assessments to aminimum of a Prefeasibility Study must have been carriedout. Mineral Reserves are subdivided in order of increasingconfidence into Probable Reserves and Proved Reserves. Note:although the term Mineral Reserve is used throughout thisChapter, it is recognized that the term Ore Reserve is used inthe JORC Code.
Resources HKEx With regard to minerals, a concentration or occurrence ofmaterial of intrinsic economic interest in or on the earth’scrust in such form, quality, and quantity that there arereasonable prospects for their eventual economic extraction.The location, quantity, grade, geological characteristics, and
continuity of a mineral Resource are known, estimated,
VI-8

8/12/2019 Valuation Report of Coal Mining
http://slidepdf.com/reader/full/valuation-report-of-coal-mining 9/71
APPENDIX VI VALUATION REPORT
Terminology Source Definition
or interpreted from specific geological evidence and knowledge.Mineral Resources are sub-divided, in order of increasinggeological confidence, into Inferred, Indicated, and MeasuredResources, as defined in the JORC Code.
Risk VALMIN D30: the chance of an event occurring that will have an
impact on objectives. A risk may be quantifiable in terms ofthe likelihood of loss, less than expected returns, or anundesirable outcome.
Scoping Study HKEx A preliminary evaluation of a mineral project, including anassessment of the economic viability of mineral Resources.Scoping Studies should include forecasts production schedulesand cost estimates based on data under which the Resourcesare identified.
Specialist VALMIN An individual who may be retained by the Expert to preparesections of Reports concerning matters about which theExpert is not personally Competent. Specialists must acceptresponsibility for the sections of the reports they prepare.
Technical Value VALMIN D36: an assessment of a Mineral Asset’s future net economicbenefit at the Valuation Date under a set of assumptionsdeemed most appropriate by an Expert or Specialist,excluding any premium or discount to account for suchfactors as market or strategic considerations.
Tenement VALMIN D37: any form of title or right such as a license, permit, orlease granted by the responsible government in accordancewith its mining legislation that confers on the holder certainrights to explore for and/or extract minerals that may be, or isknown to be contained under the surface of the land.“Tenure” and “Title” have the same connotation as a“Tenement.” All references to Tenements should be qualifiedby denoting its type (e.g., “mining” license or “exploration”Tenement).
VALMIN Code HKEx The Code for the Technical Assessment and Valuation ofMineral and Petroleum Assets and Securities for IndependentExpert Reports (2005 edition), as prepared by the VALMINCommittee, a joint committee of the Australasian Institute ofMining and Metallurgy, the Australian Institute ofGeoscientists, and the Mineral Industry ConsultantsAssociation as amended from time to time.
Valuation Date VALMIN D41: the reference date on which the monetary amount of aValuation in “dollars of that day” terms is current. This date
could be different from the dates of completion or signing ofthe Report or the cut-off date of available data.
Valuation Report HKEx The public valuation report prepared by a CompetentEvaluator on Mineral or Petroleum Assets in compliance withSEHK rule 18.34 and the applicable Reporting Standard, asmodified by this Chapter. It may form part of a CompetentPerson’s Report.
1.0 INTRODUCTION
1.1 Scope of Work/Purpose
This independent valuation of the five Yitai Group underground mining operations was prepared for
Inner Mongolia Yitai Coal Co., Ltd (Yitai) for use in a public filing on the Stock Exchange of Hong Kong (HKEx).
VI-9

8/12/2019 Valuation Report of Coal Mining
http://slidepdf.com/reader/full/valuation-report-of-coal-mining 10/71
APPENDIX VI VALUATION REPORT
In preparing this report, we have relied on a companion report: Competent Person’s Report, prepared byBOYD in March 2012. The Valuation Date for this study is 1 January 2012. This report is prepared in accordancewith HKEx Chapter 18 and the VALMIN Code.
1.2 Assets Summary Description
The Yitai Group assets being valued include the following five underground coal mining operationslocated within the Dongsheng Coalfield in the Inner Mongolia Autonomous Region:
EstimatedRemaining
Reserves (Mt)As of
1 January2012
Annual Coal Production (Mt)
MiningOperation
Yitai GroupEquity
Interest(% owned)
Date ofInitial
Operation
MiningRight
ApprovedCapacity
ApprovedProductionCertificate
Capacity2011
Actual
Dadijing . . . . . . . . . . . . . . . . . . . . . . . 100.0 4/1/2008 52 1.2 3.0 4.46Baoshan . . . . . . . . . . . . . . . . . . . . . . 73.0 6/1/2007 15 1.2 1.9 2.16Dingjiaqu . . . . . . . . . . . . . . . . . . . . . 73.0 12/1/2008 16 1.2 2.3 3.05Chengyi . . . . . . . . . . . . . . . . . . . . . . . 100.0 2/1/2009 5 0.6 1.2 0.94
Baijialiang . . . . . . . . . . . . . . . . . . . . . 100.0 1/1/2008 * 0.3 1.9 2.07
* 0.49 Mt of Estimated Remaining reserve
The five Yitai Group mines are fully developed and have made the transition to modern longwall (LW)mining technology.
1.3 Source Data
The reader is referred to the BOYD Competent Person’s Report for a listing of source data used to preparethis supporting document. For purposes of this Valuation Report, BOYD requested and received the followingadditional source data:
• Additional details for forward 2012-2014 mining and business plans (projections).
– Coal prices by product type.
– General and administrative cost.
– Selling costs and taxes.
– Financial costs.
– Fully Mechanized (FM) LW and development equipment replacement plan by year for eachmine.
• Coal sales.
– Existing coal sales commitments (or contracts) for forward sales.
– Summary of historical coal sales contracts, showing the name of customer, name of mine, coalquality requirement, FOB price, tonnage, and other additional pricing agreement.
– FOB mine coal sales prices for all five mines on the close of the first day of each month in 2011.
– Minegate sales by product type with tonnage and average FOB mine prices (including VAT) for2011.
– Port (off-site) sales by product type with tonnage, point of sales, average port prices, port
charges, rail transport, G&A and sales commissions for 2011.
VI-10

8/12/2019 Valuation Report of Coal Mining
http://slidepdf.com/reader/full/valuation-report-of-coal-mining 11/71
APPENDIX VI VALUATION REPORT
• Existing assets.
– Fixed asset summary listing for Yitai Group mines and facilities as of 1 January 2012 showingoriginal and net asset values.
– Annual depreciation rates by asset classes.
– Depreciation schedule table for all the assets for each mine from 1 January 2012 until the end ofmine life.
• Mineral and land costs.
– Mineral resource compensation fees.
– Outstanding mining right fees to be paid (owed) for Yitai Group mines as of 1 January 2012.
– Mining right fees paid in and future payment schedules for Yitai Group mines as of 1 January2012.
– Land usage fees and future payment schedules for Yitai Group mines as of 1 January 2012.
• Baijialiang Mine.
The equipment use plan after mine closure (where the equipment will be transferred) for BaijialiangMine, which is projected to be depleted in 2012.
• Other forward planning considerations.
– Production fee projections by year with detailed breakdowns for the period 2012 — 2014 andbeyond.
– Expected coal processing (coal preparation plant (CPP) processing) requirements for the YitaiGroup mines.
– Rate and calculation method for all the fees/taxes levied by tax department or administrativeorganizations.
– Expected VAT obligation as percent of selling price and expected deductions to VAT forpurchase of goods and services.
1.4 BOYD Background and Qualifications
BOYD is one of the largest independent consulting firms in the world exclusively serving the mining,financial, utility, power, and related industries. We have provided services on a continuous basis since 1943 inover 50 countries. Our full-time staff includes specialists in the analysis of geology, reserves, mine planning andcosts, material handling, markets, business planning, transport, and environmental issues. Our full range ofprofessional services includes:
• Due diligence of mining operations • Asset appraisals• Fuel and energy supply planning • Minerals industry restructuring
• Permitting and environmental analysis • Privatization studies
• Contract negotiations • Geologic, reserve and mine plan modeling
• Market and transport analyses • Exploration design and supervision
• Economic feasibility studies and valuations • Reserve and geotechnical studies
• Assessment of existing operations • Technical assistance in legal matters
• Strategic business planning • Monitoring of operating companies
• Transport issues • Financial analysis
BOYD also possesses extensive computer and software systems to estimate reserves and complete mine
plans. These include Vulcan, MINCOM, SurvCADD, and others.
VI-11

8/12/2019 Valuation Report of Coal Mining
http://slidepdf.com/reader/full/valuation-report-of-coal-mining 12/71
APPENDIX VI VALUATION REPORT
Our headquarters office is located in the Pittsburgh, Pennsylvania, region in the United States. Branchoffices are established in Denver, Colorado (US); Brisbane, Australia; and Beijing, People’s Republic of China(PRC). Please visit our website, www.jtboyd.com, for additional details.
BOYD has extensive experience in preparing Competent Person’s Technical Review and Valuation reportsfor international financing purposes and for public stock exchange filings. We are knowledgeable of listing
requirements of the HKEx, London Stock Exchange, and NI43-101 (Canadian requirements), JORC Code,U.S. Securities and Exchange (SEC) Rules, etc. We are familiar with the level of independent reporting requiredby international investors and financial institutions.
Among our Chinese coal projects, we represented Shenhua Group Corporation as their Technical Advisorfor the China Shenhua Energy Company Limited (China Shenhua) IPO on the HKEx. Our work included ananalysis of reserves (JORC, SEC, and UN Reporting Standards), coal quality, mine operations, processing,material handling, rail and ocean transport facilities, and economics. Shenhua Group Corp.’s reserve holdingswere evaluated according to JORC Code and the HKEx Rule 18 requirements. We subsequently prepared fourresource studies commissioned by China Shenhua for material acquisition HKEx filings. We also prepared ITRsfor MP Logistics International Holdings Limited (Ming Kei Energy Holdings Limited) for a transaction involvingtwo openpit mines in Xinjiang Uygur Autonomous Region, for Fushan International Energy Group Limited’sacquisition of Fortune Dragon Group Limited mines in Shanxi Province, for Artfield Group Limited’s very
substantial acquisition HKEx filing for the Ming Kei Energy Holdings Limited openpit mines in Xinjiang UygurAutonomous Region, and for GCL-Poly Energy Holdings Limited’s acquisition of the Duolun Mine in the InnerMongolia Autonomous Region. Our Chinese non-coal projects include the ITR for the Lumena ResourcesCorporation IPO on the HKEx.
BOYD is a recognized consultancy having worldwide stature. We were retained by Her Majesty’sGovernment, Department of Trade and Industry, regarding the privatization of British Coal Corporation(British Coal) and were actively involved with N M Rothschild, the lead financial advisor, during the course ofthis project. Our work assisted in the restructuring of the industry, and the coal mining operations of BritishCoal were successfully privatized.
We have completed over 2,000 resource and reserve audits. BOYD’s reserve statements have been usedby client companies, including some of the largest US coal producers. We have worked with and for virtuallyall of the major international banks. Numerous financial agencies have used our services to opine on property/ mine operations. We have the proven ability to prepare a bankable document that is accepted and used withconfidence by major financial institutions and other investors around the world.
1.5 Competent Evaluator and Specialists
Competent Evaluator for this Valuation Report is Mr. Ronald L. Lewis, who is serving as RepresentativeExpert as defined by VALMIN. Mr. Lewis clearly meets all HKEx Rule 18.23 requirements:
• Employed by BOYD for approximately 40 years, currently serving as Chief Operating Officer (COO)and overall Managing Director (MD).
• Relevant experience includes: oversight of all BOYD consulting activities and senior management
approval of BOYD work products, direct participation in mining and mineral resource/reserve andvaluation assignments.
• Independently recognized expert in mineral valuation serving as an expert witness in over 40 legalproceedings.
• Registered Member of the Society for Mining, Metallurgy, and Exploration, Inc. (a RecognizedProfessional Organization under the JORC Code), and a registered Professional Engineer in theUnited States.
Mr. Lewis has directed and participated in the preparation of this Report, and accepts responsibility forthe Report on behalf of BOYD. Key Senior Specialists who assisted Mr. Lewis are:
Mr. James F. Kvitkovich — Vice President, BS (Mining Engineering) Mr. Kvitkovich has 30 years of
experience in assessment and evaluation of underground coal mining operations throughout the world. He is
VI-12

8/12/2019 Valuation Report of Coal Mining
http://slidepdf.com/reader/full/valuation-report-of-coal-mining 13/71
APPENDIX VI VALUATION REPORT
a Registered Professional Engineer within the United States and is highly experienced with regard to reviewingand evaluating continuous miner (CM) and LW mining operations. Mr. Kvitkovich is a Registered Member ofthe Society for Mining, Metallurgy, and Exploration, Inc., and is a Competent Person as defined in the JORCCode and HKEx Chapter 18 Rule 18.21.
Mr. Paul D. Anderson — Director of Geological Services, BS (Geology) Mr. Anderson is a Certified
Professional Geologist (AIPG) with 35 years of professional experience in exploration, evaluation, anddevelopment of coal and mineral deposits. Mr. Anderson is a Registered Member of the Society for Mining,Metallurgy, and Exploration, Inc., and a member of the American Institute of Professional Geologists and isqualified as a Competent Person as defined in the JORC Code and HKEx Chapter 18 Rule 18.21.
1.6 Certification of Competent Evaluator
As evidenced by Mr. Lewis’s signature to this report, he certifies that, to the best of his knowledge andbelief:
• The statements of fact contained in this Report are true and correct.
• The reported analyses, opinions, and conclusions are limited only by the reported assumptions andlimiting conditions, and are my personal, and BOYD’s impartial, and unbiased professional analyses,
opinions, conclusions, and recommendations.
• I (Mr. Lewis), nor BOYD, have no present or prospective interest in the Yitai Group assets that are thesubject of this Report, and I, nor BOYD, have no personal interest with respect to the partiesinvolved.
• I, nor BOYD, have no bias with respect to any property that is the subject of this report or to theparties involved with this assignment.
• BOYD’s engagement in this assignment was not contingent upon developing or reportingpredetermined results.
• BOYD’s compensation for completing this assignment is not contingent upon the development orreporting of a predetermined value or direction in value that favors the cause of the client, the
amount of the value opinion, the attainment of a stipulated result, or the occurrence of asubsequent event directly related to the intended use of this appraisal.
• My analyses, opinions, and conclusions were developed and this report has been prepared inconformity with the VALMIN Code.
• I have not made a personal inspection of the property that is the subject of the report, butrepresentatives of BOYD have visited the Yitai Group mines in conjunction with the preparation ofthe companion Competent Person’s Independent Technical Review report.
1.7 Reporting Considerations
BOYD is a privately owned consultancy firm with headquarters in the United States. Our company wasselected for this assignment on the basis of our internationally recognized expertise in exploration, resource/ reserve studies, mine development, and valuation.
Estimates of resources and reserves, as well as projections of mine and processing plant output, andfinancial results, are inherently forward-looking statements. Actual performance may differ from projectionsof future performance due to various reasons beyond the control of BOYD, including, but not limited to:inherent uncertainties in geologic data interpretation, occurrence of unforeseen geological conditions,change or lack of development in key domestic and international markets, material changes in market prices,variances in the execution of construction and mine plans, and significant changes in projectedmaterials, supplies, parts and equipment, operating costs, and expenditures. Imposition of different central,regional, and/or local government policies could affect future coal production. For example, increasedenvironmental compliance and changes in regulatory oversight for health and safety could result in reducedoutput and increased costs. Possible variations of future performance from the projections presented in this
report are addressed in more detail in specific sections of this report.
VI-13

8/12/2019 Valuation Report of Coal Mining
http://slidepdf.com/reader/full/valuation-report-of-coal-mining 14/71
APPENDIX VI VALUATION REPORT
We believe the Yitai Group mining operations are appropriately equipped and operated, and except fornormal geologic, operational, and other risks associated with underground coal mining in the PRC, BOYD hasnot identified any concerns and/or risks that we consider extraordinary. Management of each mine is a criticalelement in achieving both production plans and a high degree of safety. Yitai Group’s output plans are basedon operating the mines and production facilities consistent with each operation’s production capacity. In theevent that any unforeseeable events result in decreased production, BOYD is of the opinion that Yitai Group
does not have additional capacity and scheduling to make up for any loss of production volumes.
The primary source of information (written and verbal) relied upon by BOYD in preparing this ValuationReport was provided by Yitai and Yitai Group. We have exercised reasonable care in reviewing the informationprovided and received written confirmation from Yitai that all historical data have been accurately reportedand all forward projections are prepared and/or approved by competent professionals and Yitai Groupmanagement. Information regarding historical coal sales taking place beyond the minegate (pricing andrelated costs beyond the minegate) were provided in summary form and used by BOYD as provided. We haveno reason to believe that any material facts have been withheld. We are not responsible for any material errorsor omissions in the information provided.
The valuation opinion presented in this report represents the independent professional opinion of theCompetent Evaluator and BOYD based on our review of available project information. Our expertise is intechnical and valuation issues, and BOYD is not qualified to offer, nor do we represent that any of our findingsinclude, matters of a legal or accounting nature. We have relied on information provided by Yitai and YitaiGroup regarding land tenure, legal rights held, and ownership. We have not independently researched landand/or coal certificate rights, nor have we reviewed or verified the ownership or structure of the variousentities with interests in Yitai Group. BOYD is not qualified to assess PRC legal matters and does not purport tooffer a legal opinion on the status of ownership/control and/or the right to mine.
Although we believe all findings and conclusions to be reasonable, we rely on information developed byothers and reflect mining and marketing conditions, and our interpretation of regulations, as of the date of theVR.
Following this page are:
Figure
1.1: General Location Map Showing Yitai Group Coal Mines, Coal Measures, Railways, and Ports
1.2: Map Showing Mining and Exploration Right Areas and Selected Transportation Infrastructure
Respectfully submitted,
JOHN T. BOYD COMPANYBy:
Paul D. Anderson James F. KvitkovichDirector of Geological Services Vice President
Ronald L. LewisManaging Director and COO
VI-14
8/12/2019 Valuation Report of Coal Mining
http://slidepdf.com/reader/full/valuation-report-of-coal-mining 15/71
APPENDIX VI VALUATION REPORT
VI-15

8/12/2019 Valuation Report of Coal Mining
http://slidepdf.com/reader/full/valuation-report-of-coal-mining 16/71
APPENDIX VI VALUATION REPORT
VI-16

8/12/2019 Valuation Report of Coal Mining
http://slidepdf.com/reader/full/valuation-report-of-coal-mining 17/71
APPENDIX VI VALUATION REPORT
2.0 VALUATION OPINION
The assignment of this report is to opine on the Fair Market Value (FMV) of the five Yitai Groupunderground coal mines, as of 1 January 2012. Based on the production, sales, cost, and other data providedto BOYD for the purposes of this assignment and our LOM plan and DCF analysis, we developed anindependent opinion of the value of the Yitai Group mines.
According to our discounted cash flow analysis, the Base FMV of the five mining operations on the YitaiGroup basis is RMB8,726 million.
Mine
Full InterestValuation
FMV (DCF-NPV)(1)(2)Yitai Group
Ownership (%)
Yitai GroupOwnership
Valuation(1),(2),(3)
Dadijing . . . . . . . . . . . . . . . . . . . . . . . . . . . . 4,349 100.0 4,349Baoshan . . . . . . . . . . . . . . . . . . . . . . . . . . . . 2,559 73.0 1,868Dingjiaqu . . . . . . . . . . . . . . . . . . . . . . . . . . . 2,495 73.0 1,821Chengyi . . . . . . . . . . . . . . . . . . . . . . . . . . . . 594 100.0 594Baijialiang . . . . . . . . . . . . . . . . . . . . . . . . . . . 94 100.0 94
Total . . . . . . . . . . . . . . . . . . . . . . . . . . . 10,090 8,726
(1) RMB millions (as of 1 January 2012).
(2) Figures may not add due to rounding
(3) Yitai Group interest basis.
To provide guidance on the probable range in values, we have completed a series of sensitivity DCF-NPVanalyzes. The probable range in value using the variables below to the specified Base Case FMV parametersusing a 10% discount factor are as follows:
Sensitivity Case
ValuationFMV
(DCF-NPV)(1),(2)
Sales Prices (+20%) . . . . . . . . . . . . . . . . . . . . . . . . . . . . . . . . . . . . . . . . . . . . . . . . . . 11,300Sales Price (+10%) . . . . . . . . . . . . . . . . . . . . . . . . . . . . . . . . . . . . . . . . . . . . . . . . . . 10,000Operating Cost (–10%) . . . . . . . . . . . . . . . . . . . . . . . . . . . . . . . . . . . . . . . . . . . . . . 9,200Capital Cost (–10%) . . . . . . . . . . . . . . . . . . . . . . . . . . . . . . . . . . . . . . . . . . . . . . . . . 8,800Capital Cost (+10%) . . . . . . . . . . . . . . . . . . . . . . . . . . . . . . . . . . . . . . . . . . . . . . . . . 8,600Operating Cost (+10%) . . . . . . . . . . . . . . . . . . . . . . . . . . . . . . . . . . . . . . . . . . . . . . 8,300Flat Chinese Income Tax Rate (25%) . . . . . . . . . . . . . . . . . . . . . . . . . . . . . . . . . . . . 7,800Sales Prices (–10%) . . . . . . . . . . . . . . . . . . . . . . . . . . . . . . . . . . . . . . . . . . . . . . . . . . 7,500Production (–10%) . . . . . . . . . . . . . . . . . . . . . . . . . . . . . . . . . . . . . . . . . . . . . . . . . . 7,400Sales Prices (–20%) . . . . . . . . . . . . . . . . . . . . . . . . . . . . . . . . . . . . . . . . . . . . . . . . . . 6,100
(1) RMB millions (as of 1 January 2012).
(2) Yitai Group interest basis.
The probable range in value using discount factors ranging from 8% to 12% are as follows:
DiscountFactor (%)
Yitai Group OwnershipValuation(1),(2)
8 . . . . . . . . . . . . . . . . . . . . . . . . . . . . . . . . . . . 9,5559 . . . . . . . . . . . . . . . . . . . . . . . . . . . . . . . . . . . 9,12210 . . . . . . . . . . . . . . . . . . . . . . . . . . . . . . . . . . 8,72611 . . . . . . . . . . . . . . . . . . . . . . . . . . . . . . . . . . 8,36112 . . . . . . . . . . . . . . . . . . . . . . . . . . . . . . . . . . 8,025
(1) RMB millions (1 January 2012).
(2) Yitai Group Interest basis.
VI-17

8/12/2019 Valuation Report of Coal Mining
http://slidepdf.com/reader/full/valuation-report-of-coal-mining 18/71
APPENDIX VI VALUATION REPORT
We developed life-of-mine (LOM) plans for each mine that provide the foundation of the cash flowprojections. Level of study of the LOM plans is considered to be Prefeasibility. All plans are limited to definedJORC Code qualified Proven and Probable Reserves (as developed by BOYD in the Competent Person’s Report(CPR)).
The major valuation parameters and assumptions used to develop our base FMV are as follows:
1. Annual coal production, operating cost, and capital expenditures are derived from the LOM plan(developed by BOYD) for each mine.
2. All costs and prices are expressed in constant RMB values.
3. Annual cash flow projections are calculated on an after-tax basis, with annual capital expendituresdeducted in the year incurred. Yitai provided Chinese tax rates for individual mines, that variedbetween 15 and 25%, which recognize preferred tax rates for Inner Mongolia A.R. industrialdevelopment.
4. Discounting is completed using a fixed rate of 10% with mid-year discounting used when assigningthe period applicable to each year.
3.0 SUMMARY OF ASSETS
3.1 Introduction
A detailed description of the Yitai Group mining operations is contained in the companion report:Competent Person’s Report, Inner Mongolia Yitai Coal Co., Ltd., March 2012, as prepared by BOYD. Thischapter provides a summary of the Yitai Group assets included in this independent Valuation Report.
Yitai Group underground mines are located in southern Inner Mongolia, near the boundary of Shaanxiand Shanxi provinces, and within China’s largest coal-producing region. The following Yitai Group miningrights areas were included in this Report:
Mining RightsArea
YitaiGroupEquity
Interest(% owned)
MiningCertificate Number
AuthorizedMining RightOutput
Capacity(Mtpa)
AuthorizedMining
Elevation(m)
MiningMethod
Area(km2)
Mining Right
Grant Date(month/yr)
ExpirationDate*
(month/yr)
Dadijing . . . . . 100.0 C1500002011061120115049 1.20 1,115-1,320 UG 11.6 06/2011 12/2018Baoshan . . . . 73.0 C1500002011071120115196 1.20 1,100-1,300 UG 25.0 07/2011 12/2018Dingjiaqu . . . 73.0 C1500002011061120115051 1.20 1,120-1,240 UG 17.4 06/2011 12/2018Chengyi . . . . . 100.0 C1500002011061120115048 0.60 1,224-1,362 UG 5.1 06/2011 12/2013Baijialiang . . . 100.0 C1500002011061120115050 0.30 1,242-1,308 UG 6.5 06/2011 10/2013
* Terms are normally renewable prior to expiration.
Note: UG = underground
BOYD has reviewed the mining rights documentation presented by Yitai with regard to the Yitai Groupcoal holdings. To the extent supported by the documentation and from BOYD’s standing as a technical expert,we have accepted that Yitai Group holds the mining right certificates for the areas evaluated in this report. Weunderstand that these rights reference only underground extraction methods.
Mine
Coal ProductionCertificate
Number
AuthorizedOutput
Capacity(Mtpa)
MiningMethod
CertificateGrant Date
ExpirationDate
Yitai Group Mines
Dadijing . . . . . . . . . . . . . . . . . . . . . . . . . 201527280154 3.00 FM LW 4/15/2010 12/31/2023Baoshan . . . . . . . . . . . . . . . . . . . . . . . . . 201527280369 1.90 FM LW 4/15/2010 12/31/2025Dingjiaqu . . . . . . . . . . . . . . . . . . . . . . . . 201527280378 2.30 FM LW 4/15/2010 12/31/2023Chengyi . . . . . . . . . . . . . . . . . . . . . . . . . 201527230041 1.20 FM LW 4/15/2010 4/30/2019
Baijialiang . . . . . . . . . . . . . . . . . . . . . . . . 201527280139 1.90 FM LW 4/15/2010 4/30/2012
VI-18

8/12/2019 Valuation Report of Coal Mining
http://slidepdf.com/reader/full/valuation-report-of-coal-mining 19/71
APPENDIX VI VALUATION REPORT
3.2 Geology and Resources
3.2.1 Geologic Setting
On a global basis, the geological setting or nature of the coal deposits controlled by Yitai Group are judged to be simple to moderate in complexity (i.e., not geologically complex). The mine and exploration areasevaluated are located within the Dongsheng Coalfield.
The coal-bearing strata within the Dongsheng Coalfield occur in the Middle and Lower Jurassic-age Yan’an Formation, containing coal seams 2 through 7. There are several principal coal seams that areuniform in occurrence generally 3 to 6 m thick and other secondary seams that range in thickness from 1 to 3m.
Yitai’s/Yitai Group’s geological and geotechnical staff’s technical knowledge of the reserve base andassociated geologic settings is adequate to support projected long-term mining operations.
Based on our review of the coal resource data and the methodology used to define the resources, ourvisits to the active mining operations, and interaction with Yitai personnel, we have a high degree ofconfidence that the resource estimates shown in this report are professionally prepared and representative ofthe specified mine properties.
3.2.2 Resources and Reserves
Using source data provided by Yitai, BOYD has independently assessed this information and preparedresource and reserve estimates in accordance with JORC Code. Our estimates of the Measured, Indicated, andInferred Resources and Proved and Probable Recoverable and Marketable Reserves for the five Yitai Groupmining rights areas, as of 31 December 2011, are summarized as follows:
Control Type& Mine
In-Place Resource (Mt)Recoverable Reserves
(Mt)Processing
Yield %
Marketable Reserves(Mt)
% ofReservesMeasured Indicated Inferred Total Proved Probable Total Proved Probable Total
Inner Mongolia Yitai Group Company Limited
Mining Rights
Dadijing 7.45 63.01 — 70.46 6.20 48.04 54.24 95 5.82 45.96 51.78 58Baoshan 7.40 17.89 — 25.29 4.37 11.66 16.03 91 3.93 10.62 14.55 17
Dingjiaqu 11.14 13.00 0.31 24.45 8.73 8.82 17.55 93 8.10 8.19 16.29 19Chengyi 5.71 2.41 0.37 8.49 3.57 1.53 5.10 95 3.38 1.44 4.82 5
Baijialiang 0.05 0.61 — 0.66 0.04 0.47 0.51 96 0.04 0.45 0.49 1
Total 31.75 96.92 0.68 129.35 22.91 70.52 93.43 21.27 66.66 87.93 100
Note: Tonnages shown for Baoshan and Dingjiaqu reflect 100% equity
Approximately 24% of the Marketable Reserves are in the Proved classification. Based upon projectedcoal output levels and current BOYD reserve base estimate, projected FM LW mine lives are as follows:
Mine Projected Life (years)*
Dadijing . . . . . . . . . . . . . . . . . . . . . . . . . . . . . . . . . . . . . . . . . . . . . . . . . . . . . . . . . . . . . . 21Baoshan . . . . . . . . . . . . . . . . . . . . . . . . . . . . . . . . . . . . . . . . . . . . . . . . . . . . . . . . . . . . . 7Dingjiaqu . . . . . . . . . . . . . . . . . . . . . . . . . . . . . . . . . . . . . . . . . . . . . . . . . . . . . . . . . . . . . 7Chengyi . . . . . . . . . . . . . . . . . . . . . . . . . . . . . . . . . . . . . . . . . . . . . . . . . . . . . . . . . . . . . . 4Baijialiang . . . . . . . . . . . . . . . . . . . . . . . . . . . . . . . . . . . . . . . . . . . . . . . . . . . . . . . . . . . . —**
* Based on BOYD LOM planning projections and BOYD Marketable reserves estimates.
**Depletion of LW reserves in 2nd Q 2012.
3.2.3 Coal Quality
The Dongsheng Coalfield supports numerous mining operations and is a major source of thermal coal in
the PRC. Therefore, coal quality characteristics are well known and documented. According to Chinese coal
VI-19

8/12/2019 Valuation Report of Coal Mining
http://slidepdf.com/reader/full/valuation-report-of-coal-mining 20/71
APPENDIX VI VALUATION REPORT
classification, the Yitai Group mines principally produce long flame (CY41) coal with non-caking (BN31) coalproduction.
The Yitai Group mine output is characterized by medium to high calorific value, non-caking coal (high-volatile C bituminous rank) with low sulfur content. Calorific value varies with moisture and ash content but istypically 5,000 to 5,500 Kcal/kg on an as-received basis, including partings and mining dilution.
Typical Yitai Group coal quality (as-received basis) is as follows:
Characteristic(as-received basis) Parameter
Moisture (%) . . . . . . . . . . . . . . . . . . . . . . . . . . . . . . . . . . . . . . . . . . . . . . . 17-20Ash (%) . . . . . . . . . . . . . . . . . . . . . . . . . . . . . . . . . . . . . . . . . . . . . . . 8-18Sulfur (%) . . . . . . . . . . . . . . . . . . . . . . . . . . . . . . . . . . . . . . . . . . . . . . . 0.2-0.7Volatile Matter (%) . . . . . . . . . . . . . . . . . . . . . . . . . . . . . . . . . . . . . . . . . . . . . . . 22-27Calorific Value (Kcal/kg) . . . . . . . . . . . . . . . . . . . . . . . . . . . . . . . . . . . . . . . . . . . 5,000-5,500
The coal seams typically contain few in-seam partings, and therefore, mines can produce an acceptablequality of coal product on a screened, raw (without coal washing) basis.
Yitai Group operations utilize a combination of screening, crushing, and hand-picking to increaseproduct quality. At Baijialiang, Baoshan, and Dadijing mines, the coal is screened at 50 mm. Lump coal (plus 50mm) is sold directly on site, while the minus 50-mm size coal is transported to nearby rail loading stations. AtChengyi and Dingjiaqu mines, however, coal is crushed to minus 50-mm size to be transported to the railloading stations. According to Yitai Group, there is no plan to build coal washing facilities at any of the minesites. It is BOYD’s opinion that this arrangement is appropriate since the screened coal products achieveacceptable quality for the markets or, if necessary, raw coal can be transported to Yitai’s Zhunge’erzhao CPPfor processing. BOYD’s valuation analysis assumes that the current practice of producing saleable raw coalproducts continues.
3.3 Mine Operation
3.3.1 Mines
Yitai Group owns and operates five small to medium-sized underground LW mines. These mines havetransitioned to FM mining operations by combining multiple small local mining right areas. The currentapproved production certificate output level for these mines ranges from 1.2 to 3.0 Mtpa, as follows:
Mine
Yitai GroupEquity
Interest(% owned)
Date of InitialOperation(1)
CurrentApproved
Mining RightOutput
Capacity(Mtpa)
ApprovedProductionCertificate
Capacity(Mtpa)
Estimated(2)
RemainingReserveTonnes
as of31 December
2011(millions) Integrated from Local Mines
Dadijing . . . . 100.0 4/1/2008 1.2 3.0 52 Dadijing, Dashuigou
Baoshan . . . . 73.0 6/1/2007 1.2 1.9 15 Baoshan, Qiaojiata, NiujialiangDingjiaqu . . . 73.0 12/1/2008 1.2 2.3 16 Sanhechang No. 2, DingjiaquChengyi . . . . 100.0 2/1/2009 0.6 1.2 5 Chengyi, YelaisetaiBaijialiang . . . 100.0 1/1/2008 0.3 1.9 * Baijialiang, Naomutu
(1) After integration from local mines.
(2) BOYD estimate of marketable tonnes according to JORC Code classification.
* 0.49 Mt of remaining LW mineable reserves.
BOYD visited the five subject mines in August 2009, February 2011 and February 2012. Based on our fieldobservations, the mines are well capitalized and organized, utilizing FM LW mining systems supportedpredominantly by roadheader development units. Underground mining conditions are generally favorable, withrelatively thick coal seams and minimal seam gradients; depth of mining is relatively shallow (less than 200 m).
Third-party service entities provide a supplemental source of workers and are employed to provide certain
VI-20

8/12/2019 Valuation Report of Coal Mining
http://slidepdf.com/reader/full/valuation-report-of-coal-mining 21/71
APPENDIX VI VALUATION REPORT
services in the coal production process on an as-needed basis. Yitai Group maintains the overall management ofeach mine, while the third-party service providers working at the mines report to the general managersappointed by Yitai Group at each mine.
MineBOYD Visit
DateMining
TechniquesNo. of LW
Faces
ManufacturingSource of LW
FaceOff-Site Coal
Transportation
Dadijing . . . . . . . . . . 8/30/2009 & 2/18/2011& 2/2/2012 LW/RH/DB 1 D T to RLST/CBaoshan . . . . . . . . . . 8/30/2009 & 2/17/2011
& 2/2/2012 LW/RH 1 D T to RLST/CDingjiaqu . . . . . . . . . 8/27/2009 & 2/17/2011
& 2/2/2012 LW/RH 1 D T to RLST/CChengyi . . . . . . . . . . 8/31/2009 & 2/17/2011
& 2/2/2012 LW/RH 1 D T to RLST/CBaijialiang . . . . . . . . 8/30/2009 & 2/17/2011
& 2/2/2012 LW/RH 1 D T to RLST/C
Note:
LW = Longwall D = Domestic T = Truck
RH = Roadheader RLST = Rail Loading Station
DB = Drill and Blast C = Customer
Yitai Group’s reserve base offers the potential for highly efficient LW mine designs comparable to thoseemployed at similar highly mechanized mines in the United States and Australia. Higher levels of output can beanticipated from the existing and future LW installations.
3.3.2 Historical Production
Yitai Group’s production in the past six years has been increasing, especially in the years 2008 and 2009,when the mines transitioned to FM LW techniques, as shown below:
ROM Coal Production (tonnes — millions)
2006 2007 2008 2009 2010 2011
Mine DB FM DB FM DB FM Total DB FM Total DB FM Total DB FM Total
Dadijing . . . . . 0.63 — 1.33 — 1.71 1.34 3.05 1.37 1.90 3.27 1.50 2.27 3.77 1.42 3.04 4.46Baoshan . . . . . 0.06 — 0.72 — — 1.68 1.68 — 1.53 1.53 — 1.81 1.81 — 2.16 2.16Dingjiaqu . . . . 0.04 — 0.17 — 0.13 — 0.13 — 2.21 2.21 — 2.80 2.80 — 3.05 3.05Chengyi . . . . . 0.02 — 0.15 — 0.16 0.04 0.20 — 0.88 0.88 — 1.11 1.11 — 0.94 0.94Baijialiang . . . . 0.32 — 0.38 — 0.25 1.22 1.47 — 1.75 1.75 — 1.97 1.97 — 2.07 2.07
Total . . . . 1.06 — 2.74 — 2.25 4.28 6.53 1.37 8.27 9.64 1.50 9.96 11.46 1.42 11.26 12.68
DB = Drill & Blast, FM = Fully Mechanized
Note: Figures may not add due to rounding and reflect 100% equity in all cases.
0.0
2.0
4.0
6.0
8.0
10.0
14.0
12.0
2006 2007 2008 2009 2010 2011
Yitai Group Mines’ Historical Production – ROM Coal
(tonnes – millions)
VI-21

8/12/2019 Valuation Report of Coal Mining
http://slidepdf.com/reader/full/valuation-report-of-coal-mining 22/71
APPENDIX VI VALUATION REPORT
Yitai Group mines employ modern LW mining techniques. Physical mining conditions are generallyconsidered among the most favorable observed by BOYD in the world coal mining industry and highlyconducive to the utilization of LW and roadheaders. Although the mines only evolved from drill and blast (DB)mining techniques to FM LW using domestic equipment in the 2006 — 2011 period, the transition has beensuccessfully managed. Yitai Group’s mine plans appear appropriate for the geologic and geotechnical settingsobserved in the current mines and reflect known or potential mining hazards. Yitai Group mines are producing
at higher output levels than those shown in the design documents. This is common in the PRC, particularlywhere a mining operation has introduced newer FM LW systems.
3.3.3 Staffing
Yitai Group engages third-party service providers for their main source of personnel for development andproduction work. Yitai Group mines had 2,288 mine-related, registered employees (as of 1 January 2012),summarized as follows:
Staffing as of 1 January 2012*
Mine UG
SurfaceCoal
Processing
SurfaceService/ Other Total
Dadijing . . . . . . . . . . . . . . . . . . . . . . . . . . . . . . . . . . . . . . . . . . 674 — 142 816Baoshan . . . . . . . . . . . . . . . . . . . . . . . . . . . . . . . . . . . . . . . . . . 317 — 102 419Dingjiaqu . . . . . . . . . . . . . . . . . . . . . . . . . . . . . . . . . . . . . . . . . 260 8 85 353Chengyi . . . . . . . . . . . . . . . . . . . . . . . . . . . . . . . . . . . . . . . . . . 203 27 77 307Baijialiang . . . . . . . . . . . . . . . . . . . . . . . . . . . . . . . . . . . . . . . . 213 39 141 393
Subtotal . . . . . . . . . . . . . . . . . . . . . . . . . . . . . . . . . . . . . . . . . . 1,667 74 547 2,288
* Includes third-party service providers.
Of total personnel, 246 are Yitai Group employees. Yitai Group’s employment approach is also commonlyused at other mines in the PRC to varying extents. Third-party service providers are generally comprised ofexperienced workers from other coal-producing areas. Yitai Group’s personnel are generally involved in minemanagement only. The overall staffing level is comparable to similar regional coal producers and is much lower
than that of other coal-producing areas within the PRC using more labor-intensive mining techniques andoperating in less favorable conditions. The present personnel complement for the headquarters, managementsupport staff, and auxiliary management production support staff is adequate for the planned scale ofoperations and is expected to remain relatively constant over the mine service lives.
Labor productivity in 2011 for total mine and underground employees was 5,540 and 7,610 producttonnes per employee-year, respectively, for the Yitai Group mines. Yitai Group’s average labor efficiency for2011 detailed by mine is as follows:
2011Output Tonnes
(millions)
Number of EmployeesProductivity
(tonnes/employee-yr)
Mine Mine Underground Mine Underground
Dadijing . . . . . . . . . . . . . . . . . . . . . . . . . . . . . 4.463 816 674 5,470 6,620
Baoshan . . . . . . . . . . . . . . . . . . . . . . . . . . . . . 2.161 419 317 5,160 6,820Dingjiaqu . . . . . . . . . . . . . . . . . . . . . . . . . . . . 3.055 353 260 8,650 11,750Chengyi . . . . . . . . . . . . . . . . . . . . . . . . . . . . . 0.938 307 203 3,050 4,620Baijialiang . . . . . . . . . . . . . . . . . . . . . . . . . . . . 2.069 393 213 5,260 9,710
Yitai Group Total/Average . . . . . . . . . . . . . . . 12.685 2,288 1,667 5,540 7,610
Note: Figures may not add due to rounding.
Yitai Group’s labor efficiency (raw tonnes divided by payroll personnel count) is comparable to theinternational coal industry.
VI-22

8/12/2019 Valuation Report of Coal Mining
http://slidepdf.com/reader/full/valuation-report-of-coal-mining 23/71
APPENDIX VI VALUATION REPORT
3.3.4 Mine Operating Costs
According to information provided by Yitai Group, average mine operating costs by year were as follows:
Operating Costs (RMB/ROM tonne)*
Mine 2006 2007 2008 2009 2010 2011
Dadijing . . . . . . . . . . . . . . . . . . . . . . . . . . . . . . . . . . . . . . . . . . . . 62 74 74 103 102 107Baoshan . . . . . . . . . . . . . . . . . . . . . . . . . . . . . . . . . . . . . . . . . . . . 28 67 70 69 82 83Dingjiaqu . . . . . . . . . . . . . . . . . . . . . . . . . . . . . . . . . . . . . . . . . . . 50 52 111 67 66 67Chengyi . . . . . . . . . . . . . . . . . . . . . . . . . . . . . . . . . . . . . . . . . . . . 52 55 75 94 100 121Baijialiang . . . . . . . . . . . . . . . . . . . . . . . . . . . . . . . . . . . . . . . . . . . 45 54 72 67 72 73
Yitai Group Average* . . . . . . . . . . . . . . . . . . . . . . . . . . . . . . . . . 55 67 74 82 85 89
* Composite costs include a weighted average of DB and FM output.
A breakdown of operating costs on a composite basis is as follows:
Operating Costs (RMB/ROM tonne)*
Category 2006 2007 2008 2009 2010 2011
(RMB/ROM tonne)
Cash CostsMaterials / Supplies . . . . . . . . . . . . . . . . . . . . . . . . . . . . . . . 4 3 6 5 4 7Maintenance/Repairs . . . . . . . . . . . . . . . . . . . . . . . . . . . . . . — — 5 1 2 1Power / Fuel . . . . . . . . . . . . . . . . . . . . . . . . . . . . . . . . . . . . . 1 1 2 2 3 3Salary & Welfare . . . . . . . . . . . . . . . . . . . . . . . . . . . . . . . . . 5 9 8 7 8 9Production Fees . . . . . . . . . . . . . . . . . . . . . . . . . . . . . . . . . . 38 45 47 60 60 62
Subtotal – Cash Costs . . . . . . . . . . . . . . . . . . . . . . . . . 48 59 69 75 76 81
Non-Cash CostsDepreciation . . . . . . . . . . . . . . . . . . . . . . . . . . . . . . . . . . . . 7 8 5 8 9 8
Subtotal – Non-Cash Costs . . . . . . . . . . . . . . . . . . . . . 7 8 5 8 9 8Total . . . . . . . . . . . . . . . . . . . . . . . . . . . . . . . . . . . . . . . 55 67 74 82 85 89
* Average composite costs include a weighted average of DB with FM output achieved with FM LW face methods.
Note: Figures may not add due to rounding.
Yitai Group mines’ operating costs are in-line with BOYD’s expectations based on our experience in Chinaand the type of mines, technology employed, and output levels.
3.4 Life-of-Mine Planning
In order to have a reliable basis to project future revenue, operating and capital costs, and cash flow forthe Yitai Group, BOYD has extended the available three-year projections to a life-of-mine (LOM) plan for minesin the Yitai Group (except for Baijialiang, which closes in 2012). This is a necessary step in the valuation ofmining operations using the income method (of valuation). We have restricted all future mine plans to defined
Marketable Reserve areas in accordance with VALMIN, JORC, and HKEx Chapter 18 requirements. The level ofmine planning is considered Prefeasibility.
BOYD’s LOM projections and operating performance, shown in Table 3.7, include annual ROM output,LW face retreat distance (meters), LW face moves, and average seam thickness. The LOM period extends from2012 to 2033, with the following mine operating schedule:
Mine Last Year of Mine Operation
Dadijing . . . . . . . . . . . . . . . . . . . . . . . . . . . . . . . . . . . . . . . . . . . . . . . . . 2033Baoshan . . . . . . . . . . . . . . . . . . . . . . . . . . . . . . . . . . . . . . . . . . . . . . . . 2018Dingjiaqu . . . . . . . . . . . . . . . . . . . . . . . . . . . . . . . . . . . . . . . . . . . . . . . . 2019Chengyi . . . . . . . . . . . . . . . . . . . . . . . . . . . . . . . . . . . . . . . . . . . . . . . . . 2015
Baijialiang . . . . . . . . . . . . . . . . . . . . . . . . . . . . . . . . . . . . . . . . . . . . . . . 2012
VI-23

8/12/2019 Valuation Report of Coal Mining
http://slidepdf.com/reader/full/valuation-report-of-coal-mining 24/71
APPENDIX VI VALUATION REPORT
Using the LOM LW face layouts developed for the CPR reserve analysis, we sequenced the Yitai Groupmines through the planned LW faces at LW face retreat rates consistent with Yitai Group’s recent operatinghistory and our experience with similar Chinese coal mines.
LW face retreat rate varied by mine, based on BOYD estimates. We assume that Yitai Group will maintainsufficient LW face equipment redundancy to support the projected face retreat meterage, where LW face
relocations (moves) exceed two per year. BOYD’s LOM sequencing by mine by seam is shown in Figures 3.1 to3.10. Output projections also include tonnage from LW development estimated at 7% of total ROM output.We have assumed that LW development is adequate to avoid LW face relocation delays. Detailed developmenttiming has not been performed, but recognizing the mines’ recent LW performance, we are confident thatYitai Group has the resources to avoid LW face delays due to insufficient gate development.
3.5 Future Operations
3.5.1 Three-Year Projections
BOYD’s review of future operations was based on Yitai’s internally prepared three-year mine plans,business projection data submittals, and discussions with corporate and mine management, financial, andengineering staff. The internal mine plan begins 1 January 2012 and ends 31 December 2014. Available mine
plan forecasts were evaluated for reasonableness according to recent operating history.
Yitai Group Historical and Projected Output Tonnes (millions)
Historical Projected
0.0
2.0
4.0
6.0
8.0
10.0
12.0
14.0
2006 2007 2008 2009 2010 2011 2012 2013 2014
The transition from DB practices to FM LW technology has been accomplished in all Yitai Group mines,and the mine infrastructures in these mines have been shown to be capable of supporting the proposedoutput levels. BOYD has reviewed the plans for 2012 — 2014 and the reserve tonnages in the Yitai Groupmines. Based on our review, output plans for the mines, are achievable in our opinion except as noted. Outputfrom open pit and room and pillar mining may be required to supplement LW face output at Dadijing,
Dingjiaqu, and Baijialiang mines. Room and pillar mining methods are deployed on occasion to recover coalresources not suitable for FM LW mining methods. Depletion of FM LW reserves is expected at the Baijialiang Minein 2012. Of the 0.80 Mt output projected in 2012, 0.31 Mt is generated from room and pillar mining operationsand 0.49 Mt from FM LW operations. We project that Dingjiaqu will be transitioning into thinner LW coal reservesin 2013 and LW face out will be affected. Of the 3.0 Mt output projected in 2013 and 2014, 0.50 and 1.00 Mt isgenerated from room and pillar mining operations and 2.50 and 2.00 Mt is produced from FM LW operations in2013 and 2014, respectively. Dadijing will continue utilizing room and pillar mining operations for a portion of itsoutput. Output projections for 2012 include 0.90 Mt generated from room and pillar mining operations open pitmining operations are projected to provide 1.0 Mt annually in 2013 and 2014 at Dadijing.
VI-24

8/12/2019 Valuation Report of Coal Mining
http://slidepdf.com/reader/full/valuation-report-of-coal-mining 25/71
APPENDIX VI VALUATION REPORT
The following table shows Yitai Group ROM coal output projections for the period 2012 through 2014:
Projected ROM Output(tonnes — millions)
Mine 2012 2013 2014
Dadijing* . . . . . . . . . . . . . . . . . . . . . . . . . . . . . . . . . . . . . . . . . . . . 4.20 4.50 4.50Baoshan . . . . . . . . . . . . . . . . . . . . . . . . . . . . . . . . . . . . . . . . . . . . . 2.20 2.20 2.20Dingjiaqu** . . . . . . . . . . . . . . . . . . . . . . . . . . . . . . . . . . . . . . . . . . 3.00 3.00 3.00Chengyi . . . . . . . . . . . . . . . . . . . . . . . . . . . . . . . . . . . . . . . . . . . . . 1.20 1.20 1.20Baijialiang*** . . . . . . . . . . . . . . . . . . . . . . . . . . . . . . . . . . . . . . . . 0.80 — —
Total**** . . . . . . . . . . . . . . . . . . . . . . . . . . . . . . . . . . . . . . . . 11.40 10.90 10.90
* Yitai Group Dadijing output projections include 0.90 Mt of room and pillar output 2012.
** We project that Dingjiaqu will be transitioning into thinner coal reserves in 2013 and LW face output will be affected. Of the
3.0 Mt output projected in 2013 and 2014, 0.5 and 1.0 Mt is generated from room and pillar operations.
*** Based on BOYD’s reserve estimation, we project that Baijialiang mine will deplete its FM LW reserves in 2012. Of the 0.80 Mt
output projection in 2012, 0.31 Mt is projected from room and pillar mining operations.
**** Open pit mining at several mines may also contribute to Yitai Group’s output (including 1.0 Mt annually at Dadijing in 2013
and 2014).
Yitai Group production on a product output tonnage basis is equivalent to the ROM (raw coal) tonnagesince Yitai Group sells its coal on an unwashed (raw coal) basis.
Yitai Group staffing projections are summarized as follows:
Employees at Full Production
Dadijing Baoshan Dingjiaqu Chengyi Baijialiang Total
CategoryYitaiGp. Other
YitaiGp. Other
YitaiGp. Other
YitaiGp. Other
YitaiGp. Other
YitaiGp. Other
Underground . . . . . . . 19 610 21 327 — 269 — 219 — 213 40 1,638Surface . . . . . . . . . . . . — — — — 4 12 12 15 32 7 48 34
Service . . . . . . . . . . . . . 24 118 25 86 56 29 32 45 25 116 162 394
Subtotal . . . . . . . . 43 728 46 413 60 310 44 279 57 336 250 2,066
Total . . . . . . . . 771 459 370 323 393 2,316
Yitai Group’s projected average labor productivity at full output by mine is as follows:
ProjectedFull Operation
OutputTonnes (Mt)
EmployeesProductivity
(tonnes/employee-yr.)
TotalMine
UndergroundOnly
TotalMine
UndergroundOnlyMine
Dadijing . . . . . . . . . . . . . . . . . . . . . . . . . . . . . . . 4.20 771 629 5,450 6,710Baoshan . . . . . . . . . . . . . . . . . . . . . . . . . . . . . . . 2.20 459 348 4,790 6,320
Dingjiaqu . . . . . . . . . . . . . . . . . . . . . . . . . . . . . . 3.00 370 269 8,110 11,150Chengyi . . . . . . . . . . . . . . . . . . . . . . . . . . . . . . . 1.20 323 219 8,720 5,480Baijialiang . . . . . . . . . . . . . . . . . . . . . . . . . . . . . 0.80 393 213 2,040 3,760
Yitai Group Total/Average . . . . . . . . . . . . . . . . . 11.40 2,316 1,678 4,920 6,790
Projected staffing levels remain fairly consistent with actual staffing at the Yitai Group mining operations.Added personnel who were used during the transition period in order to expedite the mine upgrades arereassigned to regular production duties to support the increased mine output levels.
VI-25

8/12/2019 Valuation Report of Coal Mining
http://slidepdf.com/reader/full/valuation-report-of-coal-mining 26/71
APPENDIX VI VALUATION REPORT
3.5.2 Capital Spending
During this assignment, Yitai Group provided internal capital spending estimates from 2012 through2014 for the five active mines. Additionally, BOYD has projected capital spending for face transitions andadditional production equipment as needed in LOM planning. Our analysis utilizes Yitai Group’s plans forequipment from the Baijialiang Mine after its closure in 2012. A summary of 2012 through 2014 capital
spending is summarized below:Projected Capital
Expenditures (RMB-millions)(1)
Mine 2012 2013 2014 Total
Dadijing . . . . . . . . . . . . . . . . . . . . . . . . . . . . . . . . . . . . . . . . . . . . . . . . . . . . . . . . . . 48 21 16 85Baoshan . . . . . . . . . . . . . . . . . . . . . . . . . . . . . . . . . . . . . . . . . . . . . . . . . . . . . . . . . . 26 14 15 55Dingjiaqu . . . . . . . . . . . . . . . . . . . . . . . . . . . . . . . . . . . . . . . . . . . . . . . . . . . . . . . . . 23 23 22 68Chengyi . . . . . . . . . . . . . . . . . . . . . . . . . . . . . . . . . . . . . . . . . . . . . . . . . . . . . . . . . . 10 9 8 27Baijialiang . . . . . . . . . . . . . . . . . . . . . . . . . . . . . . . . . . . . . . . . . . . . . . . . . . . . . . . . — — — —
Yitai Group Total . . . . . . . . . . . . . . . . . . . . . . . . . . . . . . . . . . . . . . . . . . . . . . . 107 67 61 235
(1) Figures may not add due to rounding.
Capital spending is adequate for face replacements during the period. Following 2014, sustaining capitalwas projected on an approximate RMB6 per ROM tonne basis, excluding new production equipment necessaryto sustain LOM planning. Baoshan Mine plans to replace its LW with used equipment from Nalinmiao No. 1(Yitai). An additional FM LW face is planned at Dadijing Mine, which will be sourced from Baijialiang Mine afterits closure in 2012. (RMB40 million) is projected for a second LW Face at Dingjiaqu in 2015.
Projected capital spending is adequate to support the projected output levels utilized in our valuation. Thecurrent domestic faces in our opinion are capable of sustaining the projected production plans, althoughroutine maintenance and replacement due to normal wear and tear are required. Capital spending estimatesby mine are shown in Tables 4.1 through 4.6.
Since the transition to FM LW technology is complete, Yitai Group’s capital spending is used for sustainingthe current production level. Operating mines generally have adequate equipment and infrastructure(including shafts, inclines, belt conveyor systems, electrical systems, pumping systems, etc.) necessary tosupport projected output levels. Additional openings (shafts, inclines) or extensions of openings may beperiodically required for ventilation or to access deeper occurring coal seams and/or more remote areas of thereserve. The relatively shallow operating depths of the Yitai Group mines require relatively low levels ofexcavation work. Thus, the impact of access projects on capital spending is relatively small.
3.5.3 Operating Costs
Yitai Group provided operating cost projections for the period 2012—2014. These operating costprojections are reasonable based on our experience, historical performance, and the advanced stage of minecapitalization at the Yitai Group operations. Yitai Group operating cost projections developed by BOYD in thisvaluation are summarized below and reflect FM LW mining only.
ProjectedOperating Costs
(RMB/ROM tonne)
Mine 2012 2013 2014
Dadijing . . . . . . . . . . . . . . . . . . . . . . . . . . . . . . . . . . . . . . . . . . . . . . . . . . . . . 105 109 112Baoshan . . . . . . . . . . . . . . . . . . . . . . . . . . . . . . . . . . . . . . . . . . . . . . . . . . . . . 86 87 89Dingjiaqu . . . . . . . . . . . . . . . . . . . . . . . . . . . . . . . . . . . . . . . . . . . . . . . . . . . . 68 70 72Chengyi . . . . . . . . . . . . . . . . . . . . . . . . . . . . . . . . . . . . . . . . . . . . . . . . . . . . . 126 127 130Baijialiang . . . . . . . . . . . . . . . . . . . . . . . . . . . . . . . . . . . . . . . . . . . . . . . . . . . 76 — —
Composite . . . . . . . . . . . . . . . . . . . . . . . . . . . . . . . . . . . . . . . . . . . . . . . 91 96 100
VI-26

8/12/2019 Valuation Report of Coal Mining
http://slidepdf.com/reader/full/valuation-report-of-coal-mining 27/71
APPENDIX VI VALUATION REPORT
Based on Yitai Group’s projections, we extended the operating cost projections through the projectedLOM plan for the four mines operating from 2015 onward (Baijialiang closes in 2012). We developedoperating cost projections for post-2012 based on assumed production levels, staffing, fixed and variable costassumptions, selling price, taxes, and fees. Operating cost projections reflect our judgment and modificationsfor anticipated operating circumstances and reflect FM LW mining only. A breakdown of operating costprojections can be found in Tables 3.1 through 3.6, following this text. Yitai Group operating cost projections
by category are as follows:Projected
Operating Costs(RMB/ROM tonne)(1)
Category 2012 2013 2014
CashMaterials/Supplies . . . . . . . . . . . . . . . . . . . . . . . . . . . . . . . . . . . . . . . . . . . . . . . . . . 5 5 5Maintenance/Repairs . . . . . . . . . . . . . . . . . . . . . . . . . . . . . . . . . . . . . . . . . . . . . . . . 2 2 2Power/Fuel . . . . . . . . . . . . . . . . . . . . . . . . . . . . . . . . . . . . . . . . . . . . . . . . . . . . . . . 3 3 3Salary & Welfare . . . . . . . . . . . . . . . . . . . . . . . . . . . . . . . . . . . . . . . . . . . . . . . . . . . 10 10 10Production Fees . . . . . . . . . . . . . . . . . . . . . . . . . . . . . . . . . . . . . . . . . . . . . . . . . . . . 62 65 68
Subtotal — Cash . . . . . . . . . . . . . . . . . . . . . . . . . . . . . . . . . . . . . . . . . . . . . . . . . 82 86 89
Non-CashDepreciation . . . . . . . . . . . . . . . . . . . . . . . . . . . . . . . . . . . . . . . . . . . . . . . . . . . . . . 9 10 11
Subtotal — Non-Cash . . . . . . . . . . . . . . . . . . . . . . . . . . . . . . . . . . . . . . . . . . . . . 9 10 11
Total . . . . . . . . . . . . . . . . . . . . . . . . . . . . . . . . . . . . . . . . . . . . . . . . . . . . . . . . . 91 96 100
(1) Figures may not add due to rounding.
Operating cost projections include the following line items:
Cash Costs Non-Cash Costs
Materials/Supplies DepreciationRepairsPower/Fuel
Salary & WelfareProduction Fees:
Compensation for Subsidence & Village MoveFM LW RelocationMine Engineering FeeContract Mining FeeCoal Management FeeCoal Price Adjustment FundEnvironmental Recovery Compensation FundOther ExpensesSafety Fund FeeProduction Maintenance Fee
Operating cost projections follow Yitai Group’s cost reporting format that is typically utilized in Chinesecost reporting format. Several cost categories are specific to Yitai Group costing procedures. Comments onspecific line items are:
• Salary and welfare costs reference only third-party provider labor costs at the mine site. Yitai Groupsalary and welfare costs are included in General and Administrative costs (see Chapter 4).
• Compensation for village move costs are included in the Yitai Group projections. Our understanding isthat the local government will be responsible for village move costs after 2012. The extent of villagemoves post-2012 is anticipated to be minor. We have projected monies for subsidence repairs basedon Yitai projections.
• FM LW relocation costs are projected in RMB terms according to Yitai Group projections withadjustment for years where three or more face moves occur. Costs in this category relate to
outsourcing of services for LW face moving and also include repair and rebuild of face components.
VI-27
8/12/2019 Valuation Report of Coal Mining
http://slidepdf.com/reader/full/valuation-report-of-coal-mining 28/71
APPENDIX VI VALUATION REPORT
• The Contract Mining fee is paid to the third-party service providers for conducting mine operations.
• The Mine Engineering fee includes payments for services rendered at the mine site by third partiesnot related to labor services for mine operations.
• Other Expenses include minor cost categories.
• Limited room-and-pillar mining may be conducted at the Yitai Group mines during the LOM planperiod, but the impact of these activities on financial performance is not evaluated in this analysis.
• The Environmental Recovery Compensation Fund fee is paid to local governments for mine-relatedenvironmental remediation issues and other projects.
• The Coal Price Adjustment Fund fee, RMB15 per ROM tonne, is paid to the Inner MongoliaAutonomous Region government as a general industry tax levy.
• The Coal Management fee in BOYD’s projections includes the Coal Resource Compensation fee (1% ofsales revenue).
• Depreciation projections are based on Yitai Group asset listings as of 1 January 2012. We extendedthe book depreciation as scheduled through the respective mine service lives.
• Amortization projections have been excluded from our analysis as directed by Yitai Group.
• The Safety Fund and Production Maintenance fees, RMB6 and RMB10.5 per ROM tonnerespectively, have been included as cash costs as directed by Yitai Group.
• Financial expenses have been excluded from our analysis as directed by Yitai Group.
3.6 Environmental Overview
Based on observations during our site visits and our review of source data, BOYD concludes that YitaiGroup has implemented appropriate environmental protection measures in response to nationalenvironmental protection laws. Generally, the company’s environmental protection work is comparable to
similar mining enterprises elsewhere in the PRC. Based on our site visits, BOYD opines that environmentalprotection practices at Yitai Group’s mining operations function adequately. While the particulars of currentenvironmental practices may need to be upgraded at some mines, there do not appear to be environmentalconstraints to future coal mining operations in meeting the relevant requirements as required by national laws.In our opinion, the environmental protection practices of Yitai Group comply with the PRC and World Bank’srequirements for environmental protection related to coal mining activities.
Following this page are:
Tables
Estimated Operating Costs
3.1: Dadijing Mine
3.2: Baoshan Mine
3.3: Dingjiaqu Mine
3.4: Chengyi Mine
3.5: Baijialiang Mine
3.6: Yitai Group Composite
3.7: Projected Operating Performance, Yitai Group Mines
VI-28
8/12/2019 Valuation Report of Coal Mining
http://slidepdf.com/reader/full/valuation-report-of-coal-mining 29/71
APPENDIX VI VALUATION REPORT
Figures
LOM Plans
3.1: Dadijing Mine No. 3-2 Seam
3.2: Dadijing Mine, No. 4-2 Seam
3.3: Dadijing Mine, No. 5-1 Seam
3.4: Dadijing Mine, No. 5-2 Seam
3.5: Baoshan Mine, No. 6 Seam
3.6: Dingjiaqu Mine, No. 4-2 Seam
3.7: Dingjiaqu Mine, No. 5-2 Seam
3.8: Chengyi Mine, No. 5 Seam
3.9: Chengyi Mine, No. 6 Seam
3.10: Baijialiang Mine, No. 4-2 Seam
VI-29

8/12/2019 Valuation Report of Coal Mining
http://slidepdf.com/reader/full/valuation-report-of-coal-mining 30/71
APPENDIX VI VALUATION REPORT
TABLE 3.1
ESTIMATED OPERATING COSTSDADIJING MINE
Inner Mongolia Autonomous Region, People’s Republic of ChinaPrepared For
INNER MONGOLIA YITAI COAL CO., LTD.By
John T. Boyd CompanyMining and Geological Consultants
March 2012
2012 2013 2014 2015 2016 2017 2018 2019 2020 2021 2022
Production Tonnes (millions) . . . . . . . . 3.30 3.50 3.50 3.27 3.27 3.27 3.23 3.13 2.76 1.92 1.92
Constant (RMB — millions)
Cash Costs
Materials / Supplies . . . . . . . . . . . . . 23.5 20.6 20.6 20.5 20.5 20.5 20.5 20.5 18.0 15.0 15.0
Maintenance/Repairs . . . . . . . . . . . . 9.6 9.2 9.6 9.8 9.8 9.8 9.7 9.4 8.3 5.8 5.8
Power / Fuel . . . . . . . . . . . . . . . . . . . 10.4 11.0 11.0 10.6 10.6 10.6 10.6 10.5 10.4 7.6 7.6
Salary & Welfare . . . . . . . . . . . . . . . . 24.4 34.7 34.7 35.0 35.0 35.0 35.0 35.0 30.0 25.0 25.0
Production Fees . . . . . . . . . . . . . . . . 240.4 261.9 275.1 247.0 250.0 247.0 244.2 243.1 219.8 157.0 154.0
Subtotal — Cash Costs . . . . . . . . 308.2 337.4 351.1 322.9 325.9 322.9 320.0 318.5 286.5 210.4 207.4
Non-Cash Costs
Depreciation . . . . . . . . . . . . . . . . . . . 38.3 44.3 39.9 32.1 46.5 48.8 45.5 37.9 48.9 50.1 51.2
Production Fees . . . . . . . . . . . . . . . . — — — — — — — — — — —
Subtotal — Non-Cash Costs . . . . 38.3 44.3 39.9 32.1 46.5 48.8 45.5 37.9 48.9 50.1 51.2
TOTAL . . . . . . . . . . . . . . . . . . . . 346.5 381.8 391.0 355.1 372.4 371.8 365.4 356.5 335.3 260.6 258.6
2023 2024 2025 2026 2027 2028 2029 2030 2031 2032 2033
Production Tonnes (millions) . . . . . . . . 1.92 1.92 1.92 1.74 1.81 1.84 1.84 1.84 1.82 1.81 0.25
Constant (RMB — millions)
Cash Costs
Materials / Supplies . . . . . . . . . . . . . 15.0 15.0 15.0 13.0 13.0 13.0 13.0 13.0 13.0 13.0 2.5
Maintenance/Repairs . . . . . . . . . . . . 5.8 5.8 5.8 5.2 5.4 5.5 5.5 5.5 5.5 5.4 0.8Power / Fuel . . . . . . . . . . . . . . . . . . . 7.6 7.6 7.6 7.6 7.6 7.6 7.6 7.6 7.6 7.6 1.1
Salary & Welfare . . . . . . . . . . . . . . . . 25.0 25.0 25.0 25.0 25.0 25.0 25.0 25.0 25.0 25.0 5.0
Production Fees . . . . . . . . . . . . . . . . 151.0 157.0 160.0 147.2 146.2 148.3 151.3 148.3 146.9 146.2 20.3
Subtotal — Cash Costs . . . . . . . . 204.4 210.4 213.4 198.0 197.2 199.5 202.5 199.5 198.0 197.2 29.6
Non-Cash Costs
Depreciation . . . . . . . . . . . . . . . . . . . 46.2 32.9 31.6 30.3 29.3 27.4 26.3 25.1 25.2 25.3 3.8
Production Fees . . . . . . . . . . . . . . . . — — — — — — — — — — —
Subtotal — Non-Cash Costs . . . . 46.2 32.9 31.6 30.3 29.3 27.4 26.3 25.1 25.2 25.3 3.8
TOTAL . . . . . . . . . . . . . . . . . . . . 250.7 243.3 245.0 228.3 226.5 226.9 228.8 224.6 223.2 222.5 33.4
2012 2013 2014 2015 2016 2017 2018 2019 2020 2021 2022
Constant (RMB/tonne)
Cash CostsMaterials / Supplies . . . . . . . . . . . . . 7.13 5.89 5.89 6.27 6.27 6.27 6.35 6.55 6.52 7.81 7.81
Maintenance/Repairs . . . . . . . . . . . . 2.91 2.63 2.74 3.00 3.00 3.00 3.00 3.00 3.00 3.00 3.00
Power / Fuel . . . . . . . . . . . . . . . . . . . 3.15 3.15 3.15 3.24 3.24 3.24 3.27 3.37 3.77 3.98 3.98
Salary & Welfare . . . . . . . . . . . . . . . . 7.39 9.92 9.92 10.70 10.70 10.70 10.84 11.18 10.87 13.02 13.02
Production Fees . . . . . . . . . . . . . . . . 72.83 74.82 78.61 75.55 76.46 75.55 75.60 77.66 79.63 81.79 80.23
Subtotal — Cash Costs . . . . . . . . 93.40 96.41 100.31 98.75 99.67 98.75 99.06 101.76 103.79 109.60 108.03
Non-Cash Costs
Depreciation . . . . . . . . . . . . . . . . . . . 11.61 12.66 11.40 9.82 14.22 14.94 14.08 12.12 17.70 26.11 26.68
Production Fees . . . . . . . . . . . . . . . . — — — — — — — — — — —
Subtotal — Non-Cash Costs . . . . 11.61 12.66 11.40 9.82 14.22 14.94 14.08 12.12 17.70 26.11 26.68
TOTAL . . . . . . . . . . . . . . . . . . . . 105.01 109.07 111.71 108.58 113.90 113.69 113.14 113.88 121.49 135.71 134.71
VI-30

8/12/2019 Valuation Report of Coal Mining
http://slidepdf.com/reader/full/valuation-report-of-coal-mining 31/71
APPENDIX VI VALUATION REPORT
TABLE 3.1 — Continued
2023 2024 2025 2026 2027 2028 2029 2030 2031 2032 2033
Constant (RMB/tonne)
Cash Costs
Materials / Supplies . . . . . . . . . . . . . 7.81 7.81 7.81 7.47 7.18 7.07 7.07 7.07 7.14 7.18 10.00
Maintenance/Repairs . . . . . . . . . . . . 3.00 3.00 3.00 3.00 3.00 3.00 3.00 3.00 3.00 3.00 3.00Power / Fuel . . . . . . . . . . . . . . . . . . . 3.98 3.98 3.98 4.35 4.20 4.13 4.13 4.13 4.18 4.20 4.33
Salary & Welfare . . . . . . . . . . . . . . . . 13.02 13.02 13.02 14.37 13.81 13.59 13.59 13.59 13.74 13.81 20.00
Production Fees . . . . . . . . . . . . . . . . 78.66 81.79 83.35 84.62 80.78 80.62 82.25 80.62 80.73 80.78 81.10
Subtotal — Cash Costs . . . . . . . . 106.47 109.60 111.16 113.81 108.97 108.41 110.04 108.41 108.78 108.97 118.43
Non-cash Costs
Depreciation . . . . . . . . . . . . . . . . . . . 24.09 17.12 16.44 17.39 16.18 14.89 14.31 13.64 13.84 13.96 15.21
Production Fees . . . . . . . . . . . . . . . . — — — — — — — — — — —
Subtotal — Non-cash Costs . . . . . 24.09 17.12 16.44 17.39 16.18 14.89 14.31 13.64 13.84 13.96 15.21
TOTAL . . . . . . . . . . . . . . . . . . . . 130.56 126.72 127.60 131.20 125.15 123.30 124.35 122.05 122.62 122.93 133.63
VI-31

8/12/2019 Valuation Report of Coal Mining
http://slidepdf.com/reader/full/valuation-report-of-coal-mining 32/71
APPENDIX VI VALUATION REPORT
TABLE 3.2
ESTIMATED OPERATING COSTSBAOSHAN MINE
Inner Mongolia Autonomous Region, People’s Republic of ChinaPrepared For
INNER MONGOLIA YITAI COAL CO., LTD.By
John T. Boyd CompanyMining and Geological Consultants
March 2012
2012 2013 2014 2015 2016 2017 2018
Production Tonnes (millions) . . . . . . . . . . . . . . . . . . . . . . . . . 2.20 2.20 2.20 2.20 2.20 2.00 1.55
Constant (RMB — millions)
Cash CostsMaterials / Supplies . . . . . . . . . . . . . . . . . . . . . . . . . . . . . . 15.2 15.2 15.2 15.0 15.0 15.0 12.0Maintenance/Repairs . . . . . . . . . . . . . . . . . . . . . . . . . . . . . 2.5 4.7 3.5 5.0 5.0 4.5 3.5
Power / Fuel . . . . . . . . . . . . . . . . . . . . . . . . . . . . . . . . . . . . 6.5 6.5 6.5 6.5 6.5 6.4 5.9
Salary & Welfare . . . . . . . . . . . . . . . . . . . . . . . . . . . . . . . . 22.9 22.9 22.9 23.0 23.0 23.0 18.0Production Fees . . . . . . . . . . . . . . . . . . . . . . . . . . . . . . . . . 121.0 121.0 125.3 117.7 123.7 119.9 97.9
Subtotal — Cash Costs . . . . . . . . . . . . . . . . . . . . . . . . . 168.1 170.4 173.5 167.2 173.2 168.8 137.3
Non-Cash CostsDepreciation . . . . . . . . . . . . . . . . . . . . . . . . . . . . . . . . . . . . 20.2 21.7 23.2 18.1 18.9 19.5 13.5Production Fees . . . . . . . . . . . . . . . . . . . . . . . . . . . . . . . . . — — — — — — —
Subtotal — Non-Cash Costs . . . . . . . . . . . . . . . . . . . . . 20.2 21.7 23.2 18.1 18.9 19.5 13.5TOTAL . . . . . . . . . . . . . . . . . . . . . . . . . . . . . . . . . . . . . 188.3 192.1 196.7 185.3 192.1 188.3 150.8
Constant (RMB/tonne)
Cash CostsMaterials / Supplies . . . . . . . . . . . . . . . . . . . . . . . . . . . . . . 6.92 6.92 6.92 6.82 6.82 7.50 7.74
Maintenance/Repairs . . . . . . . . . . . . . . . . . . . . . . . . . . . . . 1.13 2.13 1.58 2.25 2.25 2.25 2.25
Power / Fuel . . . . . . . . . . . . . . . . . . . . . . . . . . . . . . . . . . . . 2.97 2.97 2.97 2.98 2.98 3.18 3.83Salary & Welfare . . . . . . . . . . . . . . . . . . . . . . . . . . . . . . . . 10.42 10.42 10.42 10.45 10.45 11.50 11.61
Production Fees . . . . . . . . . . . . . . . . . . . . . . . . . . . . . . . . . 54.98 55.01 56.98 53.50 56.22 59.95 63.14
Subtotal — Cash Costs . . . . . . . . . . . . . . . . . . . . . . . . . 76.42 77.45 78.87 75.99 78.72 84.38 88.58Non-Cash Costs
Depreciation . . . . . . . . . . . . . . . . . . . . . . . . . . . . . . . . . . . . 9.19 9.87 10.55 8.24 8.59 9.77 8.70
Production Fees . . . . . . . . . . . . . . . . . . . . . . . . . . . . . . . . . — — — — — — —
Subtotal — Non-Cash Costs . . . . . . . . . . . . . . . . . . . . . 9.19 9.87 10.55 8.24 8.59 9.77 8.70
TOTAL . . . . . . . . . . . . . . . . . . . . . . . . . . . . . . . . . . . . . 85.61 87.32 89.42 84.23 87.31 94.14 97.28
VI-32

8/12/2019 Valuation Report of Coal Mining
http://slidepdf.com/reader/full/valuation-report-of-coal-mining 33/71
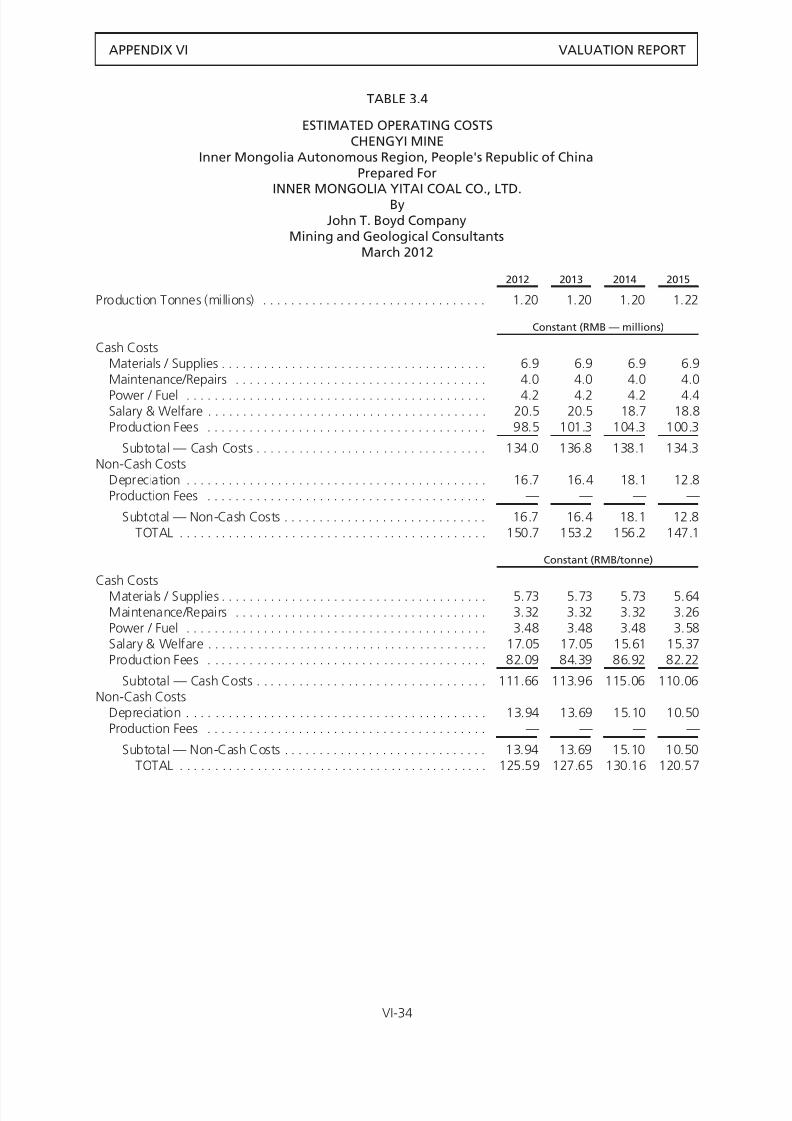
8/12/2019 Valuation Report of Coal Mining
http://slidepdf.com/reader/full/valuation-report-of-coal-mining 34/71
APPENDIX VI VALUATION REPORT
TABLE 3.4
ESTIMATED OPERATING COSTSCHENGYI MINE
Inner Mongolia Autonomous Region, People's Republic of ChinaPrepared For
INNER MONGOLIA YITAI COAL CO., LTD.By
John T. Boyd CompanyMining and Geological Consultants
March 2012
2012 2013 2014 2015
Production Tonnes (millions) . . . . . . . . . . . . . . . . . . . . . . . . . . . . . . . . 1.20 1.20 1.20 1.22
Constant (RMB — millions)
Cash CostsMaterials / Supplies . . . . . . . . . . . . . . . . . . . . . . . . . . . . . . . . . . . . . . 6.9 6.9 6.9 6.9Maintenance/Repairs . . . . . . . . . . . . . . . . . . . . . . . . . . . . . . . . . . . . 4.0 4.0 4.0 4.0
Power / Fuel . . . . . . . . . . . . . . . . . . . . . . . . . . . . . . . . . . . . . . . . . . . 4.2 4.2 4.2 4.4Salary & Welfare . . . . . . . . . . . . . . . . . . . . . . . . . . . . . . . . . . . . . . . . 20.5 20.5 18.7 18.8Production Fees . . . . . . . . . . . . . . . . . . . . . . . . . . . . . . . . . . . . . . . . 98.5 101.3 104.3 100.3
Subtotal — Cash Costs . . . . . . . . . . . . . . . . . . . . . . . . . . . . . . . . . 134.0 136.8 138.1 134.3Non-Cash Costs
Depreciation . . . . . . . . . . . . . . . . . . . . . . . . . . . . . . . . . . . . . . . . . . . 16.7 16.4 18.1 12.8Production Fees . . . . . . . . . . . . . . . . . . . . . . . . . . . . . . . . . . . . . . . . — — — —
Subtotal — Non-Cash Costs . . . . . . . . . . . . . . . . . . . . . . . . . . . . . 16.7 16.4 18.1 12.8TOTAL . . . . . . . . . . . . . . . . . . . . . . . . . . . . . . . . . . . . . . . . . . . . 150.7 153.2 156.2 147.1
Constant (RMB/tonne)
Cash CostsMaterials / Supplies . . . . . . . . . . . . . . . . . . . . . . . . . . . . . . . . . . . . . . 5.73 5.73 5.73 5.64Maintenance/Repairs . . . . . . . . . . . . . . . . . . . . . . . . . . . . . . . . . . . . 3.32 3.32 3.32 3.26Power / Fuel . . . . . . . . . . . . . . . . . . . . . . . . . . . . . . . . . . . . . . . . . . . 3.48 3.48 3.48 3.58Salary & Welfare . . . . . . . . . . . . . . . . . . . . . . . . . . . . . . . . . . . . . . . . 17.05 17.05 15.61 15.37Production Fees . . . . . . . . . . . . . . . . . . . . . . . . . . . . . . . . . . . . . . . . 82.09 84.39 86.92 82.22
Subtotal — Cash Costs . . . . . . . . . . . . . . . . . . . . . . . . . . . . . . . . . 111.66 113.96 115.06 110.06Non-Cash Costs
Depreciation . . . . . . . . . . . . . . . . . . . . . . . . . . . . . . . . . . . . . . . . . . . 13.94 13.69 15.10 10.50Production Fees . . . . . . . . . . . . . . . . . . . . . . . . . . . . . . . . . . . . . . . . — — — —
Subtotal — Non-Cash Costs . . . . . . . . . . . . . . . . . . . . . . . . . . . . . 13.94 13.69 15.10 10.50TOTAL . . . . . . . . . . . . . . . . . . . . . . . . . . . . . . . . . . . . . . . . . . . . 125.59 127.65 130.16 120.57
VI-34

8/12/2019 Valuation Report of Coal Mining
http://slidepdf.com/reader/full/valuation-report-of-coal-mining 35/71
APPENDIX VI VALUATION REPORT
TABLE 3.5
ESTIMATED OPERATING COSTSBAIJIALIANG MINE
Inner Mongolia Autonomous Region, People's Republic of ChinaPrepared For
INNER MONGOLIA YITAI COAL CO., LTD.By
John T. Boyd CompanyMining and Geological Consultants
March 2012
2012
Production Tonnes (millions) . . . . . . . . . . . . . . . . . . . . . . . . . . . . . . . . . . . . . . . . . . 0.49
Constant (RMB — millions)
Cash CostsMaterials / Supplies . . . . . . . . . . . . . . . . . . . . . . . . . . . . . . . . . . . . . . . . . . . . . . . 1.6Maintenance/Repairs . . . . . . . . . . . . . . . . . . . . . . . . . . . . . . . . . . . . . . . . . . . . . . 0.3
Power / Fuel . . . . . . . . . . . . . . . . . . . . . . . . . . . . . . . . . . . . . . . . . . . . . . . . . . . . . 1.0Salary & Welfare . . . . . . . . . . . . . . . . . . . . . . . . . . . . . . . . . . . . . . . . . . . . . . . . . . 6.6Production Fees . . . . . . . . . . . . . . . . . . . . . . . . . . . . . . . . . . . . . . . . . . . . . . . . . . 24.6
Subtotal — Cash Costs . . . . . . . . . . . . . . . . . . . . . . . . . . . . . . . . . . . . . . . . . . . 34.1Non-Cash Costs
Depreciation . . . . . . . . . . . . . . . . . . . . . . . . . . . . . . . . . . . . . . . . . . . . . . . . . . . . . 2.4Production Fees . . . . . . . . . . . . . . . . . . . . . . . . . . . . . . . . . . . . . . . . . . . . . . . . . . —
Subtotal — Non-Cash Costs . . . . . . . . . . . . . . . . . . . . . . . . . . . . . . . . . . . . . . . 2.4TOTAL . . . . . . . . . . . . . . . . . . . . . . . . . . . . . . . . . . . . . . . . . . . . . . . . . . . . . . 36.5
Constant (RMB/tonne)
Cash CostsMaterials / Supplies . . . . . . . . . . . . . . . . . . . . . . . . . . . . . . . . . . . . . . . . . . . . . . . 3.39Maintenance/Repairs . . . . . . . . . . . . . . . . . . . . . . . . . . . . . . . . . . . . . . . . . . . . . . 0.68Power / Fuel . . . . . . . . . . . . . . . . . . . . . . . . . . . . . . . . . . . . . . . . . . . . . . . . . . . . . 2.08Salary & Welfare . . . . . . . . . . . . . . . . . . . . . . . . . . . . . . . . . . . . . . . . . . . . . . . . . . 13.79Production Fees . . . . . . . . . . . . . . . . . . . . . . . . . . . . . . . . . . . . . . . . . . . . . . . . . . 51.42
Subtotal — Cash Costs . . . . . . . . . . . . . . . . . . . . . . . . . . . . . . . . . . . . . . . . . . . 71.35Non-Cash Costs
Depreciation . . . . . . . . . . . . . . . . . . . . . . . . . . . . . . . . . . . . . . . . . . . . . . . . . . . . . 4.93Production Fees . . . . . . . . . . . . . . . . . . . . . . . . . . . . . . . . . . . . . . . . . . . . . . . . . . —
Subtotal — Non-Cash Costs . . . . . . . . . . . . . . . . . . . . . . . . . . . . . . . . . . . . . . . 4.93TOTAL . . . . . . . . . . . . . . . . . . . . . . . . . . . . . . . . . . . . . . . . . . . . . . . . . . . . . . 76.28
VI-35
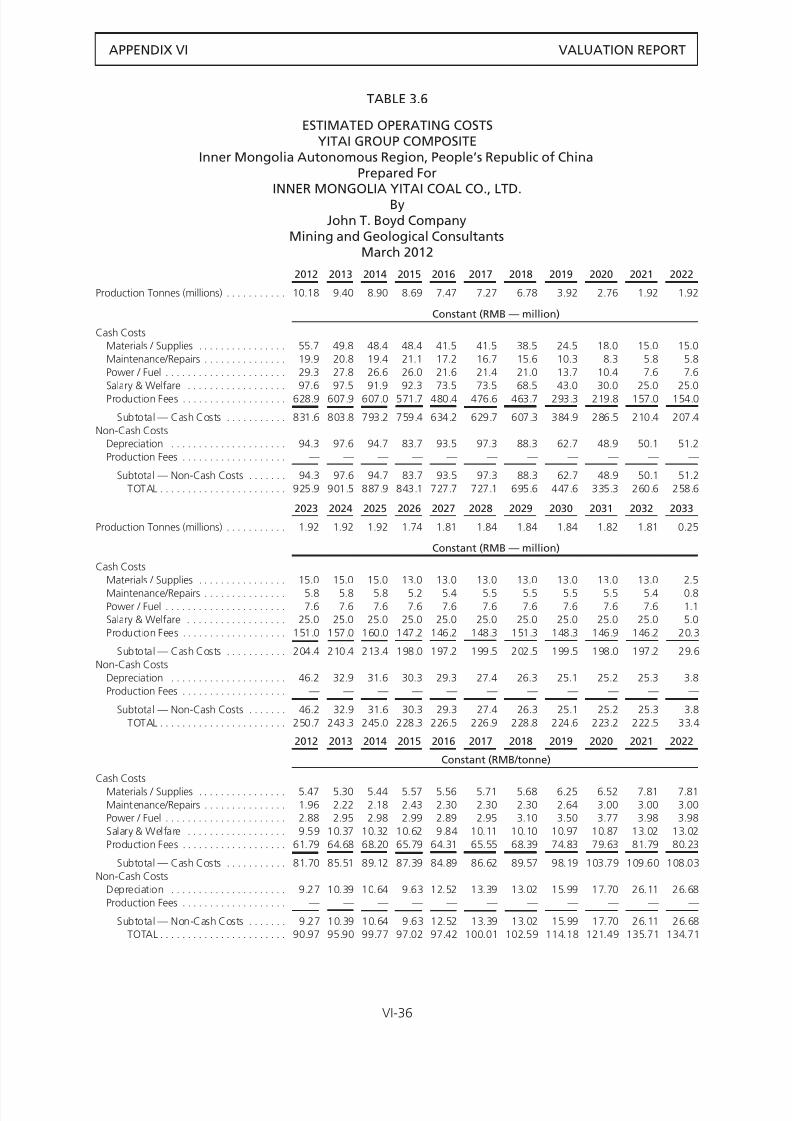
8/12/2019 Valuation Report of Coal Mining
http://slidepdf.com/reader/full/valuation-report-of-coal-mining 36/71
APPENDIX VI VALUATION REPORT
TABLE 3.6
ESTIMATED OPERATING COSTSYITAI GROUP COMPOSITE
Inner Mongolia Autonomous Region, People’s Republic of ChinaPrepared For
INNER MONGOLIA YITAI COAL CO., LTD.By
John T. Boyd CompanyMining and Geological Consultants
March 2012
2012 2013 2014 2015 2016 2017 2018 2019 2020 2021 2022
Production Tonnes (millions) . . . . . . . . . . . 10.18 9.40 8.90 8.69 7.47 7.27 6.78 3.92 2.76 1.92 1.92
Constant (RMB — million)
Cash Costs
Materials / Supplies . . . . . . . . . . . . . . . . 55.7 49.8 48.4 48.4 41.5 41.5 38.5 24.5 18.0 15.0 15.0
Maintenance/Repairs . . . . . . . . . . . . . . . 19.9 20.8 19.4 21.1 17.2 16.7 15.6 10.3 8.3 5.8 5.8
Power / Fuel . . . . . . . . . . . . . . . . . . . . . . 29.3 27.8 26.6 26.0 21.6 21.4 21.0 13.7 10.4 7.6 7.6
Salary & Welfare . . . . . . . . . . . . . . . . . . 97.6 97.5 91.9 92.3 73.5 73.5 68.5 43.0 30.0 25.0 25.0
Production Fees . . . . . . . . . . . . . . . . . . . 628.9 607.9 607.0 571.7 480.4 476.6 463.7 293.3 219.8 157.0 154.0
Subtotal — Cash Costs . . . . . . . . . . . 831.6 803.8 793.2 759.4 634.2 629.7 607.3 384.9 286.5 210.4 207.4
Non-Cash Costs
Depreciation . . . . . . . . . . . . . . . . . . . . . 94.3 97.6 94.7 83.7 93.5 97.3 88.3 62.7 48.9 50.1 51.2
Production Fees . . . . . . . . . . . . . . . . . . . — — — — — — — — — — —
Subtotal — Non-Cash Costs . . . . . . . 94.3 97.6 94.7 83.7 93.5 97.3 88.3 62.7 48.9 50.1 51.2
TOTAL . . . . . . . . . . . . . . . . . . . . . . . 925.9 901.5 887.9 843.1 727.7 727.1 695.6 447.6 335.3 260.6 258.6
2023 2024 2025 2026 2027 2028 2029 2030 2031 2032 2033
Production Tonnes (millions) . . . . . . . . . . . 1.92 1.92 1.92 1.74 1.81 1.84 1.84 1.84 1.82 1.81 0.25
Constant (RMB — million)
Cash Costs
Materials / Supplies . . . . . . . . . . . . . . . . 15.0 15.0 15.0 13.0 13.0 13.0 13.0 13.0 13.0 13.0 2.5
Maintenance/Repairs . . . . . . . . . . . . . . . 5.8 5.8 5.8 5.2 5.4 5.5 5.5 5.5 5.5 5.4 0.8Power / Fuel . . . . . . . . . . . . . . . . . . . . . . 7.6 7.6 7.6 7.6 7.6 7.6 7.6 7.6 7.6 7.6 1.1
Salary & Welfare . . . . . . . . . . . . . . . . . . 25.0 25.0 25.0 25.0 25.0 25.0 25.0 25.0 25.0 25.0 5.0
Production Fees . . . . . . . . . . . . . . . . . . . 151.0 157.0 160.0 147.2 146.2 148.3 151.3 148.3 146.9 146.2 20.3
Subtotal — Cash Costs . . . . . . . . . . . 204.4 210.4 213.4 198.0 197.2 199.5 202.5 199.5 198.0 197.2 29.6
Non-Cash Costs
Depreciation . . . . . . . . . . . . . . . . . . . . . 46.2 32.9 31.6 30.3 29.3 27.4 26.3 25.1 25.2 25.3 3.8
Production Fees . . . . . . . . . . . . . . . . . . . — — — — — — — — — — —
Subtotal — Non-Cash Costs . . . . . . . 46.2 32.9 31.6 30.3 29.3 27.4 26.3 25.1 25.2 25.3 3.8
TOTAL . . . . . . . . . . . . . . . . . . . . . . . 250.7 243.3 245.0 228.3 226.5 226.9 228.8 224.6 223.2 222.5 33.4
2012 2013 2014 2015 2016 2017 2018 2019 2020 2021 2022
Constant (RMB/tonne)
Cash Costs
Materials / Supplies . . . . . . . . . . . . . . . . 5.47 5.30 5.44 5.57 5.56 5.71 5.68 6.25 6.52 7.81 7.81
Maintenance/Repairs . . . . . . . . . . . . . . . 1.96 2.22 2.18 2.43 2.30 2.30 2.30 2.64 3.00 3.00 3.00
Power / Fuel . . . . . . . . . . . . . . . . . . . . . . 2.88 2.95 2.98 2.99 2.89 2.95 3.10 3.50 3.77 3.98 3.98
Salary & Welfare . . . . . . . . . . . . . . . . . . 9.59 10.37 10.32 10.62 9.84 10.11 10.10 10.97 10.87 13.02 13.02
Production Fees . . . . . . . . . . . . . . . . . . . 61.79 64.68 68.20 65.79 64.31 65.55 68.39 74.83 79.63 81.79 80.23
Subtotal — Cash Costs . . . . . . . . . . . 81.70 85.51 89.12 87.39 84.89 86.62 89.57 98.19 103.79 109.60 108.03
Non-Cash Costs
Depreciation . . . . . . . . . . . . . . . . . . . . . 9.27 10.39 10.64 9.63 12.52 13.39 13.02 15.99 17.70 26.11 26.68
Production Fees . . . . . . . . . . . . . . . . . . . — — — — — — — — — — —
Subtotal — Non-Cash Costs . . . . . . . 9.27 10.39 10.64 9.63 12.52 13.39 13.02 15.99 17.70 26.11 26.68
TOTAL . . . . . . . . . . . . . . . . . . . . . . . 90.97 95.90 99.77 97.02 97.42 100.01 102.59 114.18 121.49 135.71 134.71
VI-36
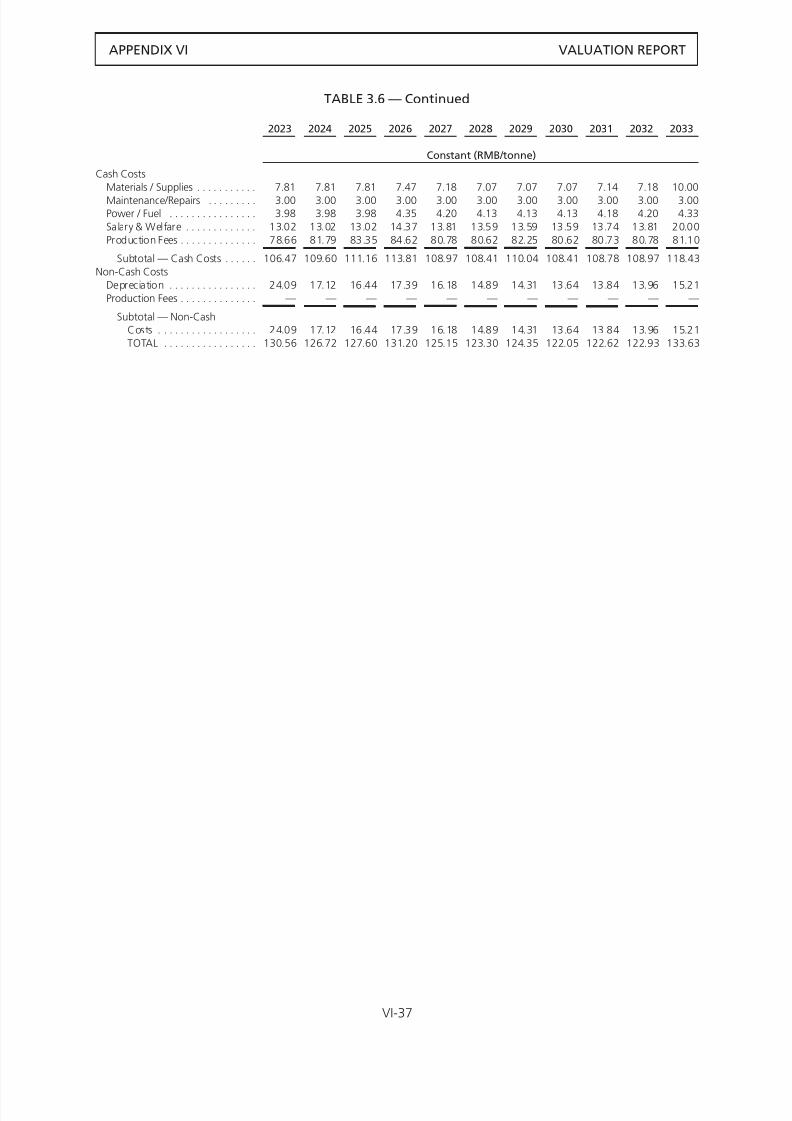
8/12/2019 Valuation Report of Coal Mining
http://slidepdf.com/reader/full/valuation-report-of-coal-mining 37/71
APPENDIX VI VALUATION REPORT
TABLE 3.6 — Continued
2023 2024 2025 2026 2027 2028 2029 2030 2031 2032 2033
Constant (RMB/tonne)
Cash Costs
Materials / Supplies . . . . . . . . . . . 7.81 7.81 7.81 7.47 7.18 7.07 7.07 7.07 7.14 7.18 10.00
Maintenance/Repairs . . . . . . . . . 3.00 3.00 3.00 3.00 3.00 3.00 3.00 3.00 3.00 3.00 3.00Power / Fuel . . . . . . . . . . . . . . . . 3.98 3.98 3.98 4.35 4.20 4.13 4.13 4.13 4.18 4.20 4.33
Salary & Welfare . . . . . . . . . . . . . 13.02 13.02 13.02 14.37 13.81 13.59 13.59 13.59 13.74 13.81 20.00
Production Fees . . . . . . . . . . . . . . 78.66 81.79 83.35 84.62 80.78 80.62 82.25 80.62 80.73 80.78 81.10
Subtotal — Cash Costs . . . . . . 106.47 109.60 111.16 113.81 108.97 108.41 110.04 108.41 108.78 108.97 118.43
Non-Cash Costs
Depreciation . . . . . . . . . . . . . . . . 24.09 17.12 16.44 17.39 16.18 14.89 14.31 13.64 13.84 13.96 15.21
Production Fees . . . . . . . . . . . . . . — — — — — — — — — — —
Subtotal — Non-Cash
Costs . . . . . . . . . . . . . . . . . . 24.09 17.12 16.44 17.39 16.18 14.89 14.31 13.64 13.84 13.96 15.21
TOTAL . . . . . . . . . . . . . . . . . 130.56 126.72 127.60 131.20 125.15 123.30 124.35 122.05 122.62 122.93 133.63
VI-37
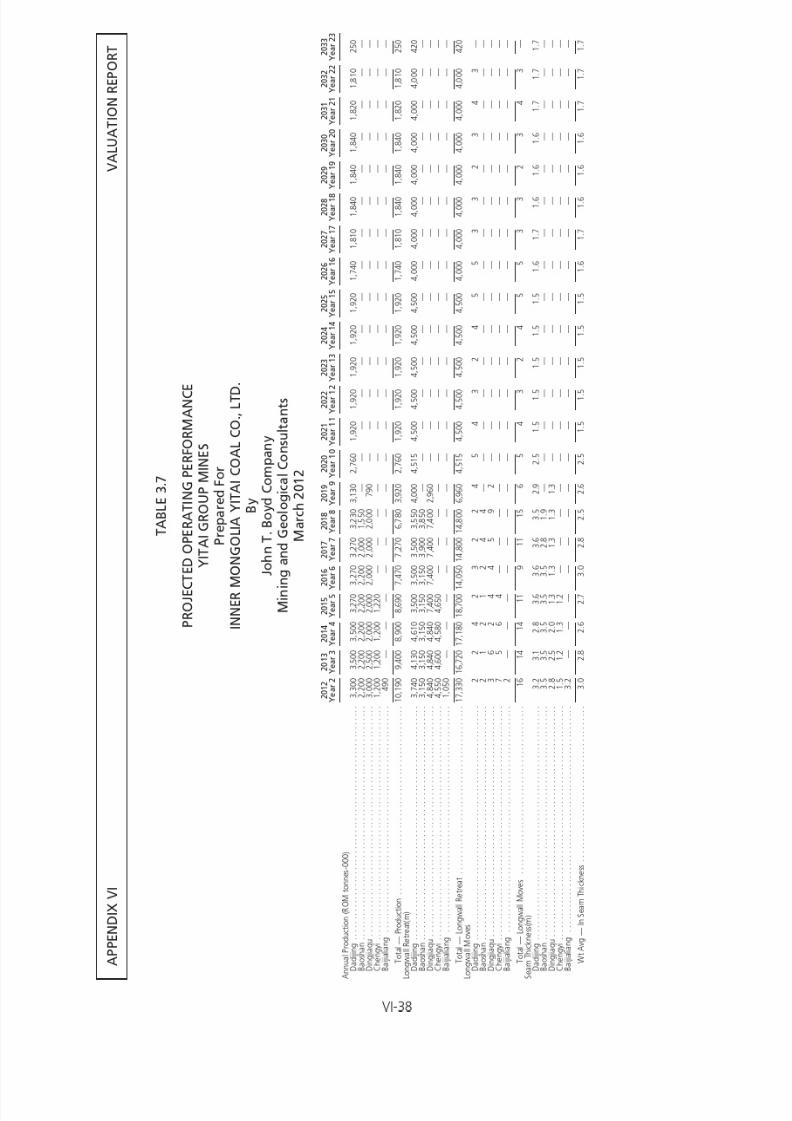
8/12/2019 Valuation Report of Coal Mining
http://slidepdf.com/reader/full/valuation-report-of-coal-mining 38/71

8/12/2019 Valuation Report of Coal Mining
http://slidepdf.com/reader/full/valuation-report-of-coal-mining 39/71
APPENDIX VI VALUATION REPORT
VI-39

8/12/2019 Valuation Report of Coal Mining
http://slidepdf.com/reader/full/valuation-report-of-coal-mining 40/71
APPENDIX VI VALUATION REPORT
VI-40

8/12/2019 Valuation Report of Coal Mining
http://slidepdf.com/reader/full/valuation-report-of-coal-mining 41/71
APPENDIX VI VALUATION REPORT
VI-41

8/12/2019 Valuation Report of Coal Mining
http://slidepdf.com/reader/full/valuation-report-of-coal-mining 42/71
APPENDIX VI VALUATION REPORT
VI-42

8/12/2019 Valuation Report of Coal Mining
http://slidepdf.com/reader/full/valuation-report-of-coal-mining 43/71
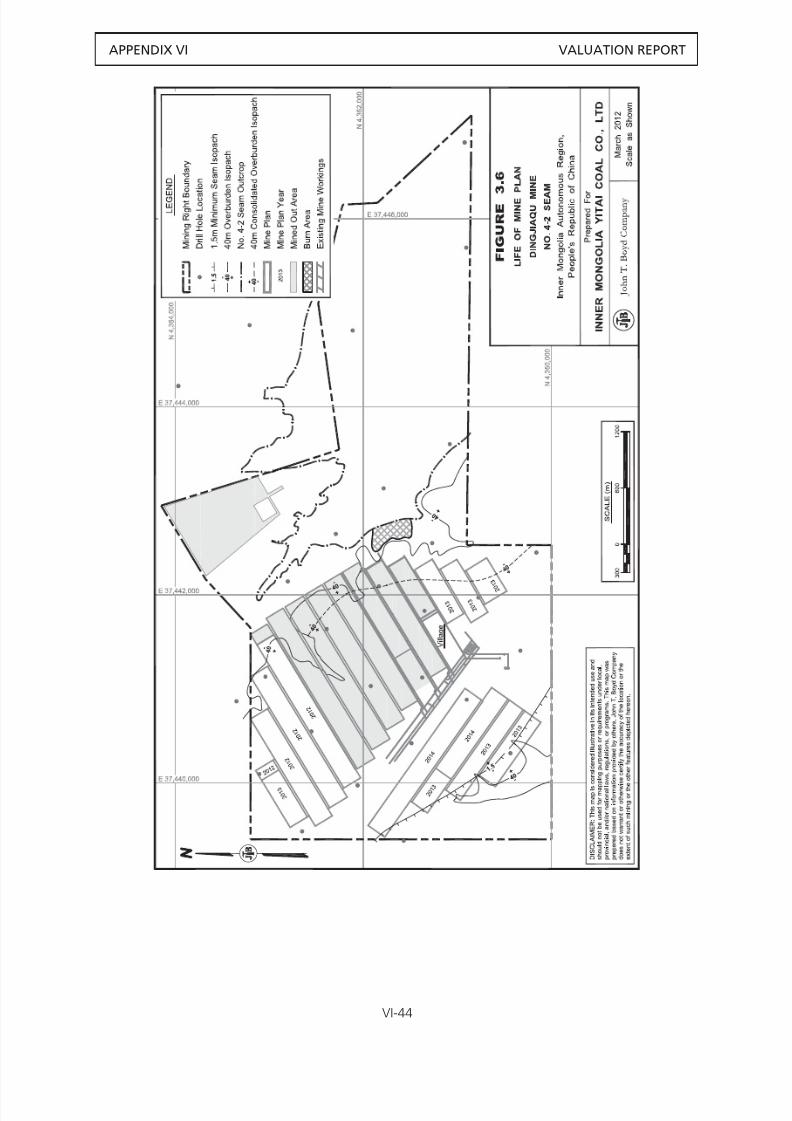
8/12/2019 Valuation Report of Coal Mining
http://slidepdf.com/reader/full/valuation-report-of-coal-mining 44/71
APPENDIX VI VALUATION REPORT
VI-44

8/12/2019 Valuation Report of Coal Mining
http://slidepdf.com/reader/full/valuation-report-of-coal-mining 45/71
APPENDIX VI VALUATION REPORT
VI-45

8/12/2019 Valuation Report of Coal Mining
http://slidepdf.com/reader/full/valuation-report-of-coal-mining 46/71
APPENDIX VI VALUATION REPORT
VI-46

8/12/2019 Valuation Report of Coal Mining
http://slidepdf.com/reader/full/valuation-report-of-coal-mining 47/71
APPENDIX VI VALUATION REPORT
VI-47

8/12/2019 Valuation Report of Coal Mining
http://slidepdf.com/reader/full/valuation-report-of-coal-mining 48/71
APPENDIX VI VALUATION REPORT
VI-48

8/12/2019 Valuation Report of Coal Mining
http://slidepdf.com/reader/full/valuation-report-of-coal-mining 49/71
APPENDIX VI VALUATION REPORT
4.0 VALUATION
4.1 Introduction
The assignment of this report is to opine on the FMV of the five Yitai Group underground coal mines, as of1 January 2012. Following are the three generally accepted methods for valuing mineral and mineral-producingassets.
Replacement Cost determines the value of the mineral asset by first calculating the new cost to replicate theasset to its condition on the Valuation Date, then adjusting plant and equipment to a depreciated replacementvalue basis. In the case of undeveloped mineral holdings, the new cost would include exploration and mining rightfees, exploration, technical studies, and other site development work. Although the Replacement Cost methodhas application in some situations (i.e., normally when valuing fixed assets and/or undeveloped mineral holdings), itseldom is appropriate when valuing developed or operating mineral properties.
Market Transaction/Comparable Sales method involves a comparison of the coal or mineral lands understudy with transactions involving similar property interests that were sold in the open market. Theknown comparable sale(s) are, ideally, contemporaneous and include reserves having similar geologic andquality characteristics and are located in the general vicinity of the property being valued. The comparable
sales approach, where comparisons are reasonably direct, is an acceptable method of appraisal. If directcomparable sales are not available, data from other mineral property sales can still be valuable to the appraiser.A general review, even though direct comparisons may not be possible, still provides insight into marketactivity, the number and nature of potential buyers and sellers, the level of market activity, range of prices paid,etc. This information is important in considering how a potential buyer would evaluate a property. The abilityto use the Market Transaction method relies on both the availability of recent comparable transactions and anin-depth knowledge of the details of each transaction (e.g., assets conveyed, associated debt and liabilities,structure of payment, etc.).
Income method uses a discounted cash flow (DCF) operational analysis to estimate the net present value(NPV) of projected cash flow of the existing or planned mining operation. It is important to identify what assetis being valued. In the case of an operating mining business, the annual revenues and expenses are estimatedfor the mine over its remaining operating life, given realistic assumptions regarding mining plans, markets, etc.The revenues, less capital expenditures, operating costs, and taxes, derive the net cash flow from the property,which, when discounted at an appropriate rate, yield the NPV amount a willing buyer would pay for thebusiness, including reserves, equipment and facilities, sales agreements, and other assets incorporated intothe cash flow model.
4.2 Risk Assessment
4.2.1 Introduction
Coal mining operations are unlike other industrial facilities in that mines can be engineered or planned toa precise design capacity or cost structure, but there are inherent uncontrollable natural and external factorsthat can prevent the attainment of precise production, cost, and revenue targets. Mining operations are
conducted in the earth’s strata rather than within a homogeneous and controlled work environment.
There is inherent geologic risk, and mine operators must therefore contend with periodic adverse orvariable geological conditions that cannot be fully anticipated in advance of actual mining activity. While theoccurrences of these physical conditions are beyond the control of site management, it should not beinterpreted that coal mining is inherently risky. On the contrary, there are established measures that mineoperators utilize to minimize the operational and financial impacts associated with such encounters. Coalmining operations in the region have a demonstrated track record in sustaining consistent and predictablelevels of performance.
VI-49
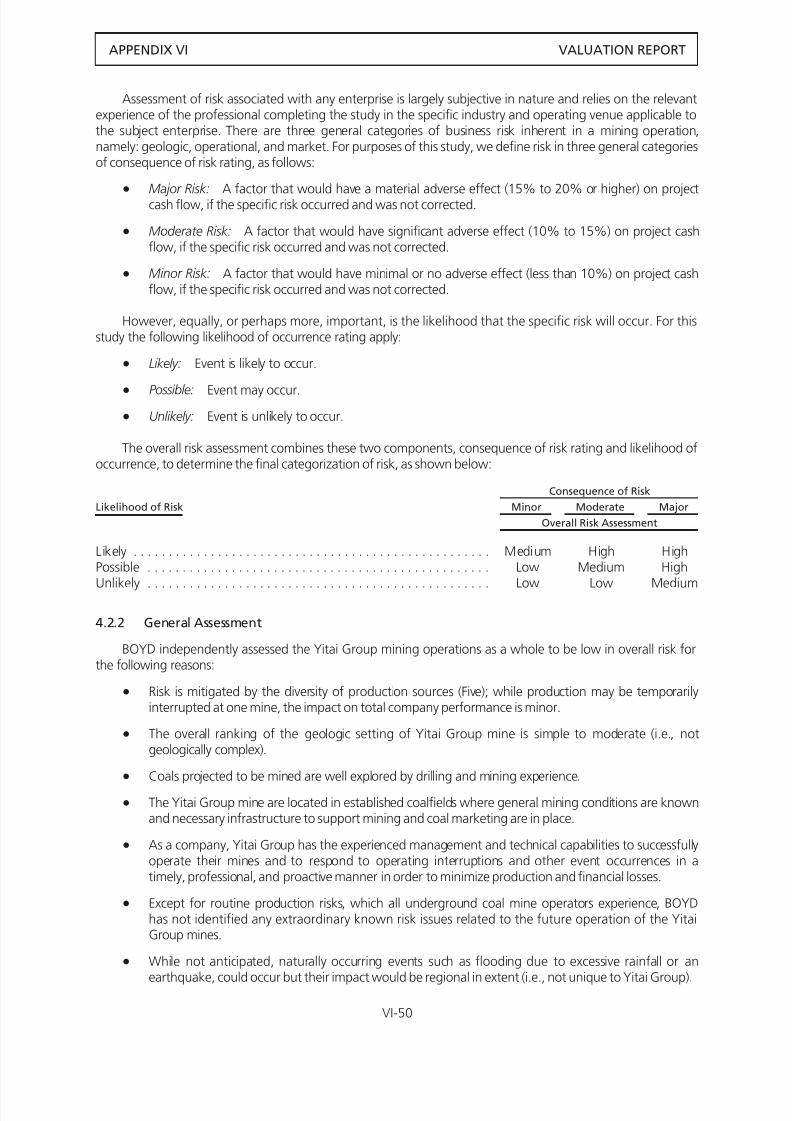
8/12/2019 Valuation Report of Coal Mining
http://slidepdf.com/reader/full/valuation-report-of-coal-mining 50/71

8/12/2019 Valuation Report of Coal Mining
http://slidepdf.com/reader/full/valuation-report-of-coal-mining 51/71
APPENDIX VI VALUATION REPORT
• Yitai Group mines generally produce low sulfur content coals, classified principally as “long flame”(CY41) according to the Chinese coal classification system. The company has established markets forits coals, and risk of future sales (even with Yitai Group’s projected growth in output) is consideredlow based on the robust nature of the Chinese economy and the competitive cost structure of theYitai Group mines.
The following text provides an expanded discussion of mining-related risks and BOYD’s assessment of theYitai Group risk profile.
The risks identified by BOYD in this report apply to all Yitai Group mines generally in equal measure. Thatis, no mine stands out as having a significantly higher risk profile than the Yitai Group mines taken as a whole.There are no risks identified that appeared to apply to one mine more than other Yitai Group mines. We havenot identified significant geological or mining-related issues during our review that would prevent Yitai Groupmines from achieving raw coal output levels projected in our life-of-mine plans.
4.2.3 Geologic Risk
General Geologic Risk
The Yitai Group portfolio of mining properties includes 5 mines, with all mines located in the establishedproducing Dongsheng coalfield. On a global basis, the geologic setting of the coal deposits controlled by YitaiGroup are judged to be simple to moderate (i.e., not geologically complex). The mines are well defined byexploratory drilling and/or mining experience.
Unforeseen Geologic Anomalies
Unforeseen geological anomalies that extend over large areas could disrupt underground mineoperations and require alterations of mining plans. Such an event can result in the cessation of productionactivities for an undefined but extended period of time (measured in months, and perhaps years) and acorresponding drop in revenue. Likewise, efforts to resume mining operations may result in cash losses duringthe period in which recovery and redevelopment activity is underway. Yitai Group mines, are reasonably definedby both drilling and mining experience. This minimizes the risk of unforeseen geologic anomalies.
Risk Assessment
ConsequenceRating: Low
Likelihood: Unlikely to PossibleOverall: Low
4.2.4 Operational Risks — Naturally Occurring Events
Weather
Extraordinary weather occurrences (e.g., excessive rainfall) can result in disruption to the miningoperations caused by power outages, loss of access into the mine site (movement of mine personnel, receiptof necessary operating supplies, etc.) and from the mine site (inability to load trucks or trains to dispatch coalto market, etc.).
Earthquakes
Available geologic background data report the general location of the Yitai Group mines are not known tobe highly seismic active and there is little history of serious earthquake activity.
Assessment
Any naturally occurring events would affect the broader region where the Yitai Group mines operate andthe impact would be industry-wide.
ConsequenceRating: Minor to Major
Likelihood: Unlikely
Overall: Low
VI-51

8/12/2019 Valuation Report of Coal Mining
http://slidepdf.com/reader/full/valuation-report-of-coal-mining 52/71
APPENDIX VI VALUATION REPORT
4.2.5 Operational Production Risks
There are two primary types of operational risks associated with underground coal mining: productionand event.
4.2.5.1 Production Risks
The first category of risk includes those variations in physical mining conditions, mechanical failures, andoperational activities that can temporarily disrupt production activities. The most common of these are asfollows:
• Roof control issues and roof falls.
• Poor mining conditions (poor roof, floor, ribs).
• Water accumulations/soft floor conditions.
• Ventilation disruptions and concentrations of methane gas.
• Variations in seam consistency, thickness, and structure.
• Failures or breakdowns of operating equipment and supporting infrastructure.
The preceding conditions and circumstances can adversely affect production in the short term, but arenot regarded as significant to the long-term operation of the mining operations. Mine-level management isexperienced and capable in dealing with these risks. BOYD does not regard the issues listed above as beingmaterial to Yitai Group mining operations or otherwise significantly compromising projected financialperformance over the long term, although some short-term variance to projected output and financialperformance should be anticipated.
Forward mine planning uses productivity parameters and cost experience which incorporate historicexperience (including routine interruptions to the mining process).
Assessment
ConsequenceRating: Minor
Likelihood: Likely
Overall: Low
Longwall Subsidence
Yitai Group mines utilize longwall (LW) mining practices which by their design cause subsidence of theoverlying strata. The damage caused by LW subsidence is an issue in many countries and regions where LWmining techniques are utilized, and mining companies are sometimes restricted as to where LW miningoperations can be performed. Generally the surface lands above the LW mines are devoid of denselypopulated residential areas, or large commercial or industrial structures. These tend to be sited near thelower elevations or shallower cover areas near major drainages. Consequently, undermining of structures isnot a significant issue in the case of Yitai, Group and the company is in the position of remediating damages tothe occasional structure that may be undermined. Minor surface drainages are likewise undermined aftermeasures are taken to either relocate the course of the drainage or lining for the stream floor. In our view,Yitai Group is essentially unrestricted in its LW planning except for the aquifer zones, which, when and wherepresent, require special planning.
Based on Chinese geotechnical practice, LW mining in areas and coal seams where the depth of cover isless than 40 m is likely to be problematic. LW face operation may be compromised because of the instabilitycaused by excessive water infiltration and incompetent roof (extensive strata fracturing) likely to occur undershallow depths of cover. Pressure on the LW shields can be abnormally high because the shields are supportingthe entire overburden load rather than the immediate roof below the main roof. Where warranted, weadjusted the Yitai Group mine plan projections and reserve estimates to exclude areas with less than 40 m of
overburden depth, unless there was an established history of successful mining.
VI-52

8/12/2019 Valuation Report of Coal Mining
http://slidepdf.com/reader/full/valuation-report-of-coal-mining 53/71
APPENDIX VI VALUATION REPORT
Proper mine design and planning can either avoid or minimize the damages from subsidence in protectedsurface areas. While subsidence is a by-product of LW mining, it can be controlled and mitigation actionstaken by the mine operator to remediate surface damages.
Assessment
ConsequenceRating: Minor
Likelihood: Unlikely for Surface Land Restrictions
Possible for Shallow Cover Restrictions
Overall: Low
4.2.5.2 Event Risks
The second type of risk is categorized as event risk. Items in this category are rare, but significantoccurrences are confined to an individual mine and ultimately have a pronounced impact on productionactivities and corresponding financial outcomes for that mine. Following such events, all mines are subject toincreased inspection/examinations and subsequent penalties and/or actions imposed by the PRC regulatory
authorities. Examples of production-related event risks are:
• Major underground fires.
• Explosions.
• Flooding of the Underground Workings.
4.2.5.3 Major Underground Fires
The potential for major underground fires is significant in any underground coal mining operation due tothe combustible nature of the material being mined and the industrial setting with machinery usingcombustible diesel fuel and lubrications. Fires generally occur from explosions (see below), equipment fires,
belt conveyor system fires, or spontaneous combustion. Equipment fires rarely result in major mine fires due toon-board extinguisher systems and in-mine firefighting gear. A major event due to an out-of-controlequipment fire is a potential but small risk.
Belt conveyor fires pose a higher order risk due to their extended and generally untended expanse. Beltconveyors by definition have moving parts which can be prone to friction. Monitoring systems and effectivebelt patrol and maintenance programs are critical to avoiding major events. These practices also result inimproved belt availability and performance. Because of the potential for fires, belt conveyors are monitored forproducts of combustion, and potential event-prone areas such as transfer points have water spray installationsdesigned to engage if a high temperature is detected. Generally these measures are adequate to avoid beltfires, but the potential is always present if the systems are not managed properly.
The last major source of mine fires is spontaneous combustion, which is a common occurrence
throughout the world mining industry. Spontaneous combustion typically occurs in areas that are notwell-ventilated, where the combination of self-heating and oxygen is adequate to support a sustainedheating until a fire breaks out. In well-ventilated areas, the heat is carried away; in tightly sealed areas theoxygen supply does not support sustained combustion. LW gob areas are especially susceptible tospontaneous combustion incidents. If not controlled, the combustion can inflame the surrounding workingsand also ignite methane, if present.
Typical of lower rank coals, the coal seams in the Yitai Group mines are rated as having significantpotential for spontaneous combustion. This is well-recognized by the company and mine plans take this intoaccount. Proper sealing of gob areas and appropriate ventilation designs may reduce the oxidation process andprevent spontaneous combustion. Alternately, measures for rendering sealed areas inert, such as nitrogeninjection and mud injection, are planned by Yitai Group. Eliminating gob ventilation also serves to minimize the
potential for gob fires due to spontaneous combustion.
VI-53

8/12/2019 Valuation Report of Coal Mining
http://slidepdf.com/reader/full/valuation-report-of-coal-mining 54/71

8/12/2019 Valuation Report of Coal Mining
http://slidepdf.com/reader/full/valuation-report-of-coal-mining 55/71
APPENDIX VI VALUATION REPORT
4.2.5.5 Floods
Risk from floods occurring in the underground mine workings can take two forms. One possibility isintercepting unmapped flooded workings. These incidents have periodically occurred in every major coalmining country, including the United States. Due to the relatively recent history of mining in the Yitai Groupmines, past mining is relatively well charted and mining activity can leave protective barriers aboutabandoned mines with confidence. An accidental flooding from uncharted works has a low likelihood ofoccurring in the Yitai Group mines.
A second risk arises from the potential inflow of ground water contained in faults and fissures and fromsurface and ground water entering the mine as a result of LW subsidence. Yitai Group is highly cognizant of thepotential disruption to mining activities and takes appropriate precautions to avoid significant inrushes ofwater from these sources. Standard precautions typically include:
• Barriers left adjacent to known high displacement faults.
• Protection barriers maintained under large bodies of surface water and known high volume aquifers.
• Dewatering of aquifers through surface drilling or advance drilling underground if the potential forhigh water flow is significant.
Due to the concerns evident in discussions with engineering and geologic personnel, we would rate thepotential for disruption to mining operations from inrushes of water as minor. Water inflows experienced atthe Yitai Group mines are typical of the region and are within the capabilities of well-designed pumpingstations. The underground mines have sufficient water-handling systems. All mines have designed effectivepumping systems with redundant primary sump pumps that control water inflows from the coal seam andoverlying/ underlying strata.
Assessment
ConsequenceRating: Minor to Major
Likelihood: UnlikelyOverall: Low
4.2.6 External Risk — Regulation
Various levels of government are involved in the promulgation and enforcement of regulations underwhich the Yitai Group mines must operate. These include operating standards and requirements, and thepayment of fees and taxes. While governmental regulation policies are industry-wide, and beyond the controlof Yitai Group, the company is responsible for operating their mines and facilities in compliance with allgovernmental regulations now in effect (or any future regulations).
The Yitai 2012–2014 projections for coal output significantly exceed current mining right and
production certificate output authorizations at a majority of the Yitai and Yitai Group mines. Yitai and YitaiGroup mines in some instances have exceeded output authorizations recently, although no regulatoryintervention has been reported to BOYD. The practice of exceeding output authorization, which is widespreadin China, receives widely varying treatment from local, provincial and regional regulatory bodies. There isuncertainty whether overproduction will be permitted over the long-term, Yitai’s applications for higheroutput levels will be approved, or higher authorizations will equate to output projections.
To our knowledge, Yitai has paid required resource fees to obtain mining rights, and governmental taxesand fees.
Passage of more restrictive or onerous government regulations could have adverse effects on future YitaiGroup operations, but such a risk would be industry-wide and is unquantifiable at this time.
VI-55

8/12/2019 Valuation Report of Coal Mining
http://slidepdf.com/reader/full/valuation-report-of-coal-mining 56/71
APPENDIX VI VALUATION REPORT
Assessment
ConsequenceRating: Minor to Moderate
Likelihood: UnlikelyOverall: Low
4.2.7 Market Risk
Achieving Yitai Group cash flow projections depends on sustaining coal sales at prices specified in the cashflow analysis. A substantial reduction in market prices would have a material effect on financial performance.Such an event would occur if there were surplus alternative coals from other suppliers, or a reduction indemand from Yitai Group’s customer base. It is BOYD’s opinion that new competitors are unlikely to generatesurplus production capacity. There are high barriers to entry, as new mine development requires significantcapital investment and government approvals. However, such an event would directly impact (lower) totalcompany revenues and could negatively impact the fixed cost structure and sustaining capital investments atindividual mines.
Market risk is mitigated by the established nature of Yitai Group mines and customer base, and thesustained growth of the Chinese economy, which is expected to continue over the seven-year risk assessment
study period.
Assessment
ConsequenceRating: Minor to Moderate
Likelihood: UnlikelyOverall: Low
4.3 Valuation Method Selected
The Income Method of mineral valuation is used in this report based on:
• Nature of the valuation.
• Development status of the coal assets being valued.• Extent and reliability of available source data.
Yitai has entered into an Assets Transfer Agreement with Yitai Group under which Yitai Group agrees totransfer the subject mineral assets to Yitai after completion of the Yitai Global Offering and listing on theHKEx. This Valuation Report provides our independent opinion of the FMV of the Yitai Group miningoperations on a debt-free basis, in support of the two pending transactions. The Fair Market Value representsboth the Technical Value and the Market Value. The DCF-NPV used to develop BOYD’s opinion of MarketValue is by VALMIN definition, also the Technical Value. In completing the forward mining projections usedas the foundation of the cash flow, the BOYD Competent Evaluator reviewed all primary components forreasonableness and adjusted projected output, capital costs, operating costs and coal prices were warrantedin our expert opinion. The resulting cash flow projection is intended to be reasonable and achievable, andfurther adjustments (i.e., changes to the Technical Value for “market strategic or other considerations”
(VALMIN Code D43)) are therefore not considered appropriate in the judgment of the Competent Evaluator.The Income Approach is accepted as an appropriate valuation method, and the preferred method whenvaluing an established mining company.
Income Method (or an operational analysis) is the preferred approach in the case of Yitai Group becauseall five mines are fully developed as coal (income) producing assets. Our valuation opinion is based on a site(mine) specific analysis of each operation’s projected income (net cash flow) over its remaining mine life. OnlyJORC qualified reserves are included under mine plan and cash flow projections used in this report.
As required by HKEx Chapter 18 rules, all reported reserves are sufficiently explored to be classified aseither Proved Reserve or Probable Reserve. In addition, each Yitai Group mine has an established productionrecord. The transition process, to consolidate prior smaller mines into a larger operation (to improve economyof scale — output reliability and lower costs), and to implement modern LW technology, is completed.
Reliability of forward mine plans (production and economics) is considered low to moderate risk.
VI-56

8/12/2019 Valuation Report of Coal Mining
http://slidepdf.com/reader/full/valuation-report-of-coal-mining 57/71
APPENDIX VI VALUATION REPORT
BOYD/Competent Evaluator assigned the 10% discount rate based on our expert judgment andexperience considering:
• Yitai Group is a fully developed and operating coal mining and sales business.
• International standards (i.e., guidelines specified by the US federal government when valuing federallyowned coals) specify the use of a 10% discount rate. Though situated in the Chinese coal fields
(Dongsheng), the Yitai Group mines face risks similar to those found in all major underground coalproducing regions in the world. The Yitai Group mining-related risks are not unique to Yitai Groupbut are generally experienced to an extent by all underground coal mining operations worldwide.Accordingly, in the opinion of the Competent Evaluator, Yitai Group mines can be appropriatelyevaluated in light of international experience.
• Currently, the Chinese coal mining industry utilizes the Minimum Attractive Rate of Return (MARR) todetermine the economic viability of projects. The MARR functions as a Discount Rate. The economicevaluation of all FSR, PDR, and project proposals are based on this discounting factor. Presently, a10% discount rate for all coal-related mining projects is mandated by the PRC State Council’sDecisions of Investment Mechanism Reformation, the Economic Valuation and Parameters of CoalMine Construction Projects (third edition), as compiled in Implementing Regulations of EconomicValuation and Parameters, which was executed as National Energy Coal Policy (2011), 380th
Pronouncement.• Under Chapter 18 and Appendix 25 of Hong Kong Listing Rules, the alternative of using a fixed
discount rate of 10% is permitted when valuing (proven and probable) petroleum reserves. While thisrate is specified for petroleum reserves, Yitai Group’s coal reserves are similarly defined to the samelevel of reliability in our opinion.
• In our view, the elements of risk associated with Yitai Group mining operations are incorporated intothe Company’s forward projections through 2015 including annual coal production and estimatedmining costs. In addition, the baseline we consider is the historical experience of Yitai Group (andother proprietary industry knowledge) while operating under mining conditions with similar sitespecific geological and operating risks.
• Research of discount rates used by analysts in several research reports valuing mining concernsoperating in a large coal production region (i.e. western Canadian coal producers) indicates discountrates ranging from 8% to 10%. To our knowledge similar analyst research reports are not availablefor the various Chinese coal producing regions including the region where the Yitai Group mines aresituated. Nevertheless, we believe the example cited from a large coal production region supports the10% discount factor selection.
• Competent Evaluator’s coal industry valuation experience developed over 40 years confirms that a10% discount factor is appropriate for operating companies comparable to Yitai Group.
Additionally, the HKEx has previously accepted (precedent) the use of a fixed 10% discount rate whencompleting DCF-NPV determinations of Chinese mining companies.
While Yitai Group has five (5) mines, each with specific risks, our valuation is completed on a compositebasis (i.e., total company value). Sourcing production from five mines mitigates risk and provides assurances of
coal supply with the ability of any possible shortfall in one mine being offset by the remaining mines.
4.4 Major Assumptions
BOYD’s valuation analysis is based upon the following major assumptions:
• No material changes in government policies and regulations will occur.
• Geological conditions over the mine service lives will be comparable to recent operating experience(BOYD has made adjustments for seam thickness variations).
• Mining operations will not be interrupted by external factors, such as mine accidents that result inmandated mine idle periods.
• Operating costs will not experience material fluctuations other than fluctuations occurring as aconsequence of output variations resulting from anticipated variations in seam thickness or transitions
to lower lying seams.
VI-57
8/12/2019 Valuation Report of Coal Mining
http://slidepdf.com/reader/full/valuation-report-of-coal-mining 58/71
APPENDIX VI VALUATION REPORT
• Imposition of government taxes, fees or other charges will not increase or deviate substantially fromcurrent levels.
• The company’s capital expenditure program will be implemented as scheduled.
• Company management are competent, responsible and capable to execute work plans asdemonstrated by their recent performance.
• Force majeure events such as war, natural disasters, etc. do not occur during the mine service lives.
4.5 Valuation Procedure
As shown in Chapter 3 of this report (and detailed in the separate Competent Person’s Report alsoprepared by BOYD), we have developed LOM plans for each mine that provide the foundation of the cash flowprojections. Level of study of the LOM plans is considered to be Prefeasibility. All plans are limited to definedJORC Code qualified Proved and Probable Reserves (as developed by BOYD in the Competent Person’s Report).
The following valuation parameters and assumptions are used to develop our base FMV:
1. Annual coal production, operating cost, and capital expenditures are derived from the LOM plan(developed by BOYD) for each mine. A summary of BOYD’s LOM plan is shown in Table 3.7. SingleLW face operation is projected through depletion at the mines.
2. All costs and prices are expressed in constant RMB values.
3. Annual cash flow projections are calculated on an after-tax basis, with annual capital expendituresdeducted in the year incurred. Yitai provided Chinese tax rates for individual mines, that variedbetween 15%-25%, which recognize preferred tax rates for Inner Mongolia A.R. industrialdevelopment.
4. Discounting is completed using a fixed rate of 10% with mid-year discounting when assigning theperiod applicable to each year.
5. VAT is 17% of revenue with a credit for purchases of materials, supplies, power, and equipment.
6. Corporate general and administrative costs are based on Yitai projections and projected forward onan RMB per tonne of ROM output on a mine specific basis.
7. The Coal Resource Fee is RMB3.2 per tonne of ROM output.
8. Other sales taxes are 4% of the VAT.
9. Working capital/parts/inventory projected in 2012 are estimated at 25% of revenue; a credit istaken in the last year of mine operation. BOYD believes our assignment of 100% working capitalrequirements in Year 1 of the valuation is appropriate for an arms-length sale between a willing buyerand willing seller on the date of valuation. Credit for existing company working capital would need tobe specified since the seller would now be agreeing to transferring this cash amount to the new buyeras part of the sale.
10. Equipment purchases reflect Yitai Group projections for 2012—2014 and BOYD estimates ofrequirements post-2014.
11. Sustaining capital spending is projected on an approximate RMB6 per tonne of ROM output basis.
12. Decommissioning (reclamation/environmental) costs are projected in the last year of mine
operation.
13. Production Maintenance Fee and Safety Fund Fee, RMB9.0 and RMB3 per tonne of ROM output,respectively, have been included as cash costs as directed by Yitai Group.
14. Financial expenses and amortization have been excluded from our analysis as directed by Yitai Group.
Occurrences of Proved Reserve and Probable Reserve are comingled, and it is not technically possible todevelop mine plans based solely on Proved Reserves.
4.6 Coal Pricing
Yitai Group sells its coal production at a variety of locations, including: mine-gate, loading station, directrail and ports (Qinghuangdao, Caofeidian and Jingtanggang). With the exception of mine-gate sales, coalsales at the remaining locations are to customers where rail transport is necessary and as such, price of coal at
those locations are higher than mine-gate prices. In order to reflect the value premium of coal sales at those
VI-58

8/12/2019 Valuation Report of Coal Mining
http://slidepdf.com/reader/full/valuation-report-of-coal-mining 59/71
APPENDIX VI VALUATION REPORT
locations beyond the mine-gate and transportation advantages gained from the Yitai Group transportationdivisions, we requested data reflecting market pricing for coal sold at each location. To incorporate the off-mine-site coal sale prices but to adjust such prices to the equivalent netback FOB coal prices at the mine gate,“off-mine-site selling costs” per tonne of coal are deducted.
Netback FOB mine-gate coal price = off-mine-site coal sale price – off-mine-site selling cost
“Off-mine-site selling costs” are intended to include all transportation and sales components necessary toreach final point of dispatch (truck to rail dispatch, dispatch to port, port fees, rail fees, G&A, sales,commissions, taxes and/or miscellaneous fees). We have been provided composite data for all non minegate sales in order to derive the average historical market-based “off-mine-site selling costs” data for coal soldat dispatch locations.
Off-mine-site coal sales prices and tonnages for Yitai No. 3 and No. 4 port sale coal were provided for the12-month period from January 2011 to December 2011. Mine-gate coal sale prices for the same period wereprovided. “Off-mine-site selling costs” were then deducted from the average monthly off-mine-site coal saleprices to reach the monthly netback FOB mine-gate coal price.
The 12-month netback prices were then averaged to arrive at a composite price for each mine. Inaccordance with HKEx18.33(4), the historical composite pricing was then utilized within the valuation modelas future pricing for each mining operation. The off mine gate sales provided a significant premium in pricingas compared to similar quality coals sold at the minegate.
The 12-month netback composite pricing (12 months prior to evaluation: January 2011 - December 2011)is summarized as follows from Table 4.7:
Year
Sales1
Tonnes(Mt)
Price2
RMB/ Tonne
Prior 12 Months (January 2011 - December 2011)Dadijing . . . . . . . . . . . . . . . . . . . . . . . . . . . . . . . . . . . . . . . . . . . . . . . . . . . . . . . . 4.68 429Baoshan . . . . . . . . . . . . . . . . . . . . . . . . . . . . . . . . . . . . . . . . . . . . . . . . . . . . . . . . 2.16 477Dingjiaqu . . . . . . . . . . . . . . . . . . . . . . . . . . . . . . . . . . . . . . . . . . . . . . . . . . . . . . . 5.55 424Chengyi . . . . . . . . . . . . . . . . . . . . . . . . . . . . . . . . . . . . . . . . . . . . . . . . . . . . . . . . 4.21 400Baijialiang . . . . . . . . . . . . . . . . . . . . . . . . . . . . . . . . . . . . . . . . . . . . . . . . . . . . . . . 2.07 478
Total/Composite . . . . . . . . . . . . . . . . . . . . . . . . . . . . . . . . . . . . . . . . . . . . . . . . 18.69 432
(1) Total Sales tonnes include all mine-gate and off-site sales. These may differ slightly from historical production output as a result of
coal purchased from third parties.
(2) FOB Mine-gate (VAT inclusive): Composite of mine-gate and off-site sales less total “off-mine-site selling cost.”*
* “Off Mine Site Selling Cost”: includes all transportation necessary to reach final points of dispatch (truck to rail dispatch, dispatch to
port, port fees, rail fees, G&A, sales, commissions, taxes and/or misc. fees)
4.7 Base Case FMV
As shown on Tables 4.1 through 4.5: Independent Valuation, Discounted Cash Flow Analysis, Yitai GroupMining Operations (by mine), the total Base FMV of the five mining operations on the Yitai Group interest basis
is RMB8,726 million.
Mine
Full InterestValuation
FMV (DCF-NPV)(1),(2)
Yitai GroupOwnership
(%)
Yitai GroupOwnership
Valuation(1),(2),(3)
Dadijing . . . . . . . . . . . . . . . . . . . . . . . . . . . . . . 4,349 100.0 4,349Baoshan . . . . . . . . . . . . . . . . . . . . . . . . . . . . . . 2,559 73.0 1,868Dingjiaqu . . . . . . . . . . . . . . . . . . . . . . . . . . . . . 2,495 73.0 1,821Chengyi . . . . . . . . . . . . . . . . . . . . . . . . . . . . . . 594 100.0 594Baijialiang . . . . . . . . . . . . . . . . . . . . . . . . . . . . . 94 100.0 94
Total . . . . . . . . . . . . . . . . . . . . . . . . . . . . . . . 10,090 8,726
(1) RMB millions (1 January 2012).
(2) Figures may not add due to rounding.
(3) Yitai Group interest basis.
VI-59
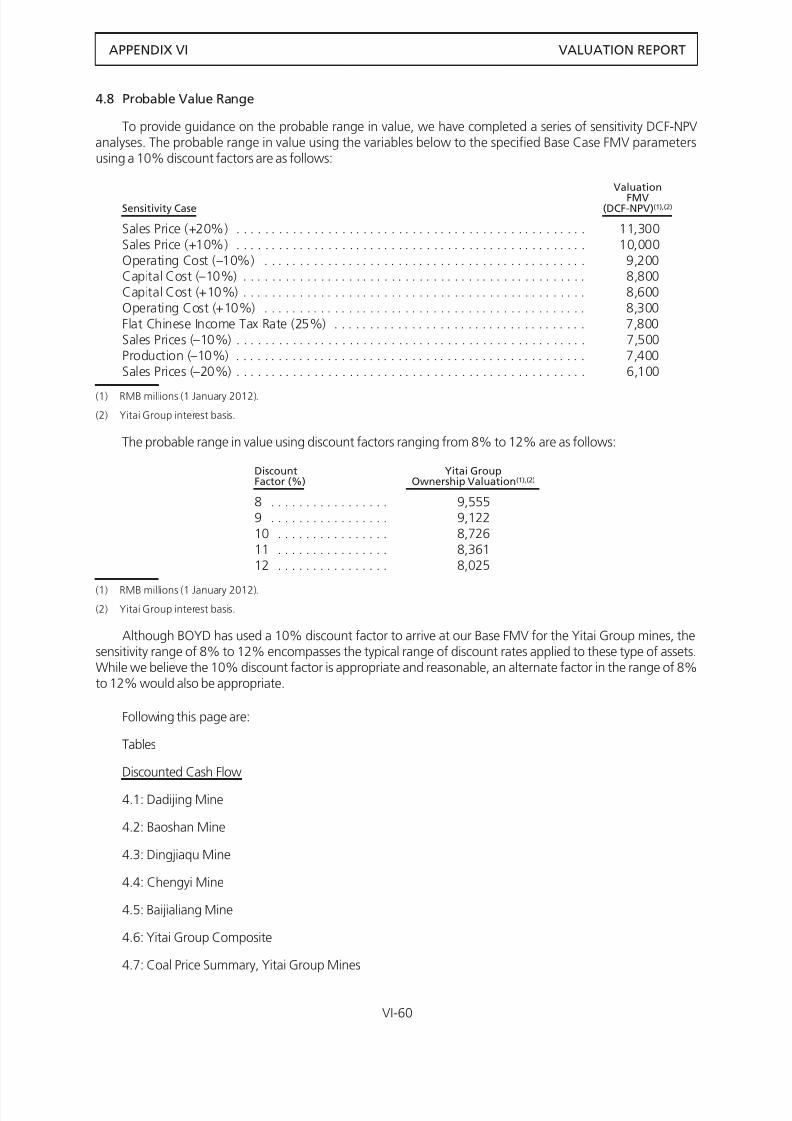
8/12/2019 Valuation Report of Coal Mining
http://slidepdf.com/reader/full/valuation-report-of-coal-mining 60/71
APPENDIX VI VALUATION REPORT
4.8 Probable Value Range
To provide guidance on the probable range in value, we have completed a series of sensitivity DCF-NPVanalyses. The probable range in value using the variables below to the specified Base Case FMV parametersusing a 10% discount factors are as follows:
Sensitivity Case
Valuation
FMV(DCF-NPV)(1),(2)
Sales Price (+20%) . . . . . . . . . . . . . . . . . . . . . . . . . . . . . . . . . . . . . . . . . . . . . . . . . . 11,300Sales Price (+10%) . . . . . . . . . . . . . . . . . . . . . . . . . . . . . . . . . . . . . . . . . . . . . . . . . . 10,000Operating Cost (–10%) . . . . . . . . . . . . . . . . . . . . . . . . . . . . . . . . . . . . . . . . . . . . . . 9,200Capital Cost (–10%) . . . . . . . . . . . . . . . . . . . . . . . . . . . . . . . . . . . . . . . . . . . . . . . . . 8,800Capital Cost (+10%) . . . . . . . . . . . . . . . . . . . . . . . . . . . . . . . . . . . . . . . . . . . . . . . . . 8,600Operating Cost (+10%) . . . . . . . . . . . . . . . . . . . . . . . . . . . . . . . . . . . . . . . . . . . . . . 8,300Flat Chinese Income Tax Rate (25%) . . . . . . . . . . . . . . . . . . . . . . . . . . . . . . . . . . . . 7,800Sales Prices (–10%) . . . . . . . . . . . . . . . . . . . . . . . . . . . . . . . . . . . . . . . . . . . . . . . . . . 7,500Production (–10%) . . . . . . . . . . . . . . . . . . . . . . . . . . . . . . . . . . . . . . . . . . . . . . . . . . 7,400Sales Prices (–20%) . . . . . . . . . . . . . . . . . . . . . . . . . . . . . . . . . . . . . . . . . . . . . . . . . . 6,100
(1) RMB millions (1 January 2012).
(2) Yitai Group interest basis.
The probable range in value using discount factors ranging from 8% to 12% are as follows:
DiscountFactor (%)
Yitai GroupOwnership Valuation(1),(2)
8 . . . . . . . . . . . . . . . . . 9,5559 . . . . . . . . . . . . . . . . . 9,12210 . . . . . . . . . . . . . . . . 8,72611 . . . . . . . . . . . . . . . . 8,36112 . . . . . . . . . . . . . . . . 8,025
(1) RMB millions (1 January 2012).
(2) Yitai Group interest basis.
Although BOYD has used a 10% discount factor to arrive at our Base FMV for the Yitai Group mines, thesensitivity range of 8% to 12% encompasses the typical range of discount rates applied to these type of assets.While we believe the 10% discount factor is appropriate and reasonable, an alternate factor in the range of 8%to 12% would also be appropriate.
Following this page are:
Tables
Discounted Cash Flow
4.1: Dadijing Mine
4.2: Baoshan Mine
4.3: Dingjiaqu Mine
4.4: Chengyi Mine
4.5: Baijialiang Mine
4.6: Yitai Group Composite
4.7: Coal Price Summary, Yitai Group Mines
VI-60

8/12/2019 Valuation Report of Coal Mining
http://slidepdf.com/reader/full/valuation-report-of-coal-mining 61/71
APPENDIX VI VALUATION REPORT
TABLE 4.1
DISCOUNTED CASH FLOWDADIJING MINE
Inner Mongolia Autonomous Region, People’s Republic of ChinaPrepared For
INNER MONGOLIA YITAI COAL CO., LTD.By
John T. Boyd CompanyMining and Geological Consultants
March 2012
2012 2013 2014 2015 2016 2017 2018 2019 2020 2021 2022
Production Tonnes (millions) . . . . . . . . . . . . . . . . . . . . 3.30 3.50 3.50 3.27 3.27 3.27 3.23 3.13 2.76 1.92 1.92
Sales price (RMB/tonne) . . . . . . . . . . . . . . . . . . . . . . . 429 429 429 429 429 429 429 429 429 429 429
Revenue RMB (millions) . . . . . . . . . . . . . . . . . . . . . . . . 1,417 1,503 1,503 1,404 1,404 1,404 1,387 1,344 1,185 824 824
Total Operating Cost (RMB/tonne) . . . . . . . . . . . . . . . 105.0 109.1 111.7 108.6 113.9 113.7 113.1 113.9 121.5 135.7 134.7
RMB (millions)
Total Operating Costs . . . . . . . . . . . . . . . . . . . . . . . . . 347 382 391 355 372 372 365 356 335 261 259
Value Added Tax . . . . . . . . . . . . . . . . . . . . . . . . . . . . . 227 247 248 227 215 232 229 222 180 135 135
Corporate G&A . . . . . . . . . . . . . . . . . . . . . . . . . . . . . . 35 35 36 37 42 42 41 40 35 25 35
Coal Resource Fee . . . . . . . . . . . . . . . . . . . . . . . . . . . . 11 11 11 10 10 10 10 10 9 6 6
Other Taxes . . . . . . . . . . . . . . . . . . . . . . . . . . . . . . . . . 20 22 22 20 19 21 21 20 16 12 12
Total Cost of Sales . . . . . . . . . . . . . . . . . . . . . . 639 697 708 649 660 677 667 648 576 439 447
Taxable Income . . . . . . . . . . . . . . . . . . . . . . 778 806 795 755 744 727 720 696 609 385 377
Income Tax . . . . . . . . . . . . . . . . . . . . . . . . . . . . . . . . . 194 121 119 113 112 109 108 104 91 96 94
Net After-Tax Income . . . . . . . . . . . . . . . . . . . . . 583 685 676 641 633 618 612 591 518 289 283
Working Capital/Parts/Inventory . . . . . . . . . . . . . . . 354 — — — — — — — — — —
Equipment . . . . . . . . . . . . . . . . . . . . . . . . . . . . . . . . 46 20 15 39 106 10 10 8 98 5 4
Sustaining Capital . . . . . . . . . . . . . . . . . . . . . . . . . . 2 2 2 9 10 10 10 8 23 20 4
Decommissioning . . . . . . . . . . . . . . . . . . . . . . . . . . — — — — — — — — — — —
Deductions to Income . . . . . . . . . . . . . . . . . . . . . 402 21 16 48 116 19 19 16 121 25 9
Depreciation . . . . . . . . . . . . . . . . . . . . . . . . . . . . . . 29 29 27 32 47 49 45 38 49 50 51
Amortization . . . . . . . . . . . . . . . . . . . . . . . . . . . . . . — — — — — — — — — — —Safety Fund Fee . . . . . . . . . . . . . . . . . . . . . . . . . . . . — — — — — — — — — — —
Financial Expenses . . . . . . . . . . . . . . . . . . . . . . . . . . — — — — — — — — — — —
Production Maintenance Fee . . . . . . . . . . . . . . . . . . — — — — — — — — — — —
Additions to Income . . . . . . . . . . . . . . . . . . . . . . 29 29 27 32 47 49 45 38 49 50 51
Net Cash Flow After-Tax (RMB — millions) . . . . . . . . . . 211 693 687 625 564 648 639 613 446 314 325
Discounted Cash Flow at 10% . . . . . . . . . . . . . . . . . . 201 601 541 448 367 384 344 300 198 127 120
Cumulative Discounted Cash Flow . . . . . . . . . . . . . . . 201 801 1,343 1,790 2,157 2,541 2,885 3,185 3,383 3,510 3,629
2023 2024 2025 2026 2027 2028 2029 2030 2031 2032 2033
Production Tonnes (millions) . . . . . . . . . . . . . . . . . . . . 1.92 1.92 1.92 1.74 1.81 1.84 1.84 1.84 1.82 1.81 0.25
Sales price (RMB/tonne) . . . . . . . . . . . . . . . . . . . . . . . 429 429 429 429 429 429 429 429 429 429 429
Revenue RMB (millions) . . . . . . . . . . . . . . . . . . . . . . . . 824 824 824 747 777 790 790 790 781 777 107
Total Operating Cost (RMB/tonne) . . . . . . . . . . . . . . . 130.6 126.7 127.6 131.2 125.2 123.3 124.3 122.1 122.6 122.9 133.6
VI-61
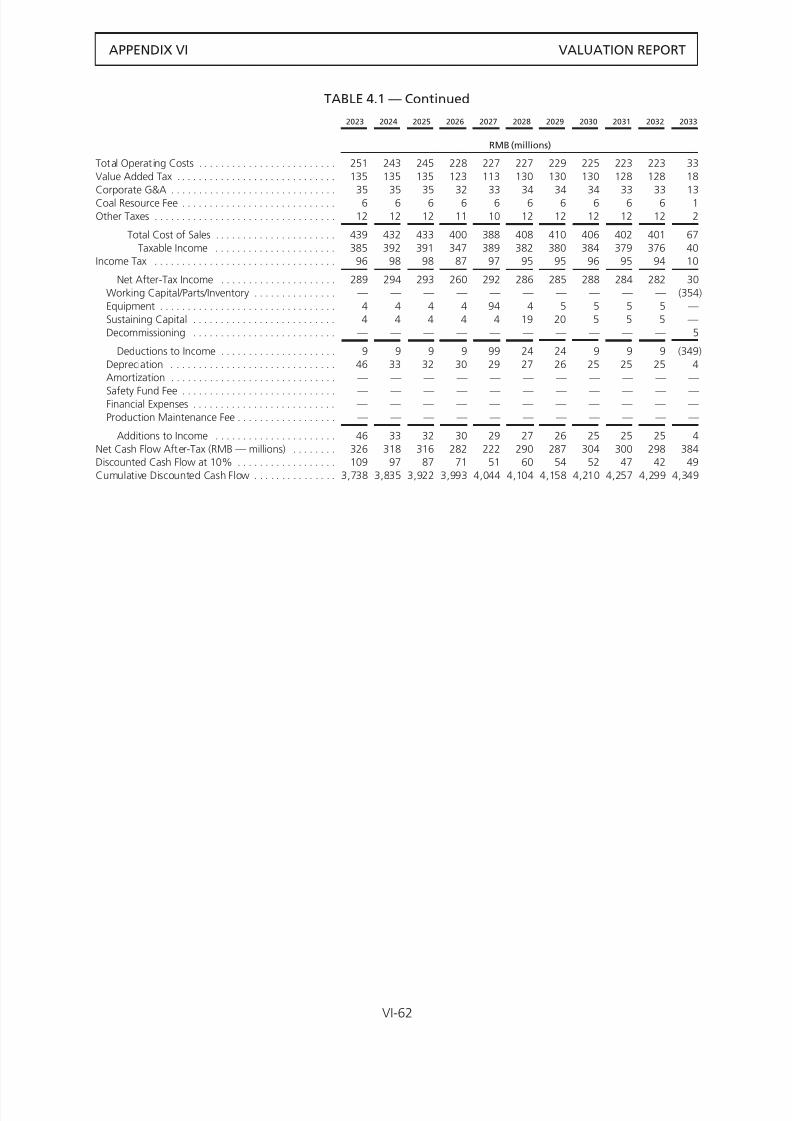
8/12/2019 Valuation Report of Coal Mining
http://slidepdf.com/reader/full/valuation-report-of-coal-mining 62/71
APPENDIX VI VALUATION REPORT
TABLE 4.1 — Continued
2023 2024 2025 2026 2027 2028 2029 2030 2031 2032 2033
RMB (millions)
Total Operating Costs . . . . . . . . . . . . . . . . . . . . . . . . . 251 243 245 228 227 227 229 225 223 223 33
Value Added Tax . . . . . . . . . . . . . . . . . . . . . . . . . . . . . 135 135 135 123 113 130 130 130 128 128 18
Corporate G&A . . . . . . . . . . . . . . . . . . . . . . . . . . . . . . 35 35 35 32 33 34 34 34 33 33 13
Coal Resource Fee . . . . . . . . . . . . . . . . . . . . . . . . . . . . 6 6 6 6 6 6 6 6 6 6 1
Other Taxes . . . . . . . . . . . . . . . . . . . . . . . . . . . . . . . . . 12 12 12 11 10 12 12 12 12 12 2
Total Cost of Sales . . . . . . . . . . . . . . . . . . . . . . 439 432 433 400 388 408 410 406 402 401 67
Taxable Income . . . . . . . . . . . . . . . . . . . . . . 385 392 391 347 389 382 380 384 379 376 40
Income Tax . . . . . . . . . . . . . . . . . . . . . . . . . . . . . . . . . 96 98 98 87 97 95 95 96 95 94 10
Net After-Tax Income . . . . . . . . . . . . . . . . . . . . . 289 294 293 260 292 286 285 288 284 282 30
Working Capital/Parts/Inventory . . . . . . . . . . . . . . . — — — — — — — — — — (354)
Equipment . . . . . . . . . . . . . . . . . . . . . . . . . . . . . . . . 4 4 4 4 94 4 5 5 5 5 —
Sustaining Capital . . . . . . . . . . . . . . . . . . . . . . . . . . 4 4 4 4 4 19 20 5 5 5 —
Decommissioning . . . . . . . . . . . . . . . . . . . . . . . . . . — — — — — — — — — — 5
Deductions to Income . . . . . . . . . . . . . . . . . . . . . 9 9 9 9 99 24 24 9 9 9 (349)
Depreciation . . . . . . . . . . . . . . . . . . . . . . . . . . . . . . 46 33 32 30 29 27 26 25 25 25 4
Amortization . . . . . . . . . . . . . . . . . . . . . . . . . . . . . . — — — — — — — — — — —
Safety Fund Fee . . . . . . . . . . . . . . . . . . . . . . . . . . . . — — — — — — — — — — —Financial Expenses . . . . . . . . . . . . . . . . . . . . . . . . . . — — — — — — — — — — —
Production Maintenance Fee . . . . . . . . . . . . . . . . . . — — — — — — — — — — —
Additions to Income . . . . . . . . . . . . . . . . . . . . . . 46 33 32 30 29 27 26 25 25 25 4
Net Cash Flow After-Tax (RMB — millions) . . . . . . . . 326 318 316 282 222 290 287 304 300 298 384
Discounted Cash Flow at 10% . . . . . . . . . . . . . . . . . . 109 97 87 71 51 60 54 52 47 42 49
Cumulative Discounted Cash Flow . . . . . . . . . . . . . . . 3,738 3,835 3,922 3,993 4,044 4,104 4,158 4,210 4,257 4,299 4,349
VI-62

8/12/2019 Valuation Report of Coal Mining
http://slidepdf.com/reader/full/valuation-report-of-coal-mining 63/71
APPENDIX VI VALUATION REPORT
TABLE 4.2
DISCOUNTED CASH FLOWBAOSHAN MINE
Inner Mongolia Autonomous Region, People’s Republic of ChinaPrepared For
INNER MONGOLIA YITAI COAL CO., LTD.By
John T. Boyd CompanyMining and Geological Consultants
March 2012
2012 2013 2014 2015 2016 2017 2018
Production Tonnes (mil lions) . . . . . . . . . . . . . . . . . . . . . . . . . . . . 2.20 2.20 2.20 2.20 2.20 2.00 1.55
Sales price (RMB/tonne) . . . . . . . . . . . . . . . . . . . . . . . . . . . . . . . . 477 477 477 477 477 477 477
Revenue RMB (millions) . . . . . . . . . . . . . . . . . . . . . . . . . . . . . . . . 1,050 1,050 1,050 1,050 1,050 954 739
Total Operating Cost (RMB/tonne) . . . . . . . . . . . . . . . . . . . . . . . . 85.6 87.3 89.4 84.2 87.3 94.1 97.3
RMB (millions)
Total Operating Costs . . . . . . . . . . . . . . . . . . . . . . . . . . . . . . . . . . 188 192 197 185 192 188 151
Value Added Tax . . . . . . . . . . . . . . . . . . . . . . . . . . . . . . . . . . . . . 170 172 172 174 174 157 122Corporate G&A . . . . . . . . . . . . . . . . . . . . . . . . . . . . . . . . . . . . . . 17 18 18 19 21 19 15
Coal Resource Fee . . . . . . . . . . . . . . . . . . . . . . . . . . . . . . . . . . . . 7 7 7 7 7 6 5
Other Taxes . . . . . . . . . . . . . . . . . . . . . . . . . . . . . . . . . . . . . . . . . . 15 16 15 16 16 14 11
Total Cost of Sales . . . . . . . . . . . . . . . . . . . . . . . . . . . . . . . 399 405 410 400 409 385 303
Taxable Income . . . . . . . . . . . . . . . . . . . . . . . . . . . . . . . 651 645 640 650 641 569 436
Income Tax . . . . . . . . . . . . . . . . . . . . . . . . . . . . . . . . . . . . . . . . . . 98 97 96 97 96 85 65
Net After-Tax Income . . . . . . . . . . . . . . . . . . . . . . . . . . . . . . 554 548 544 552 544 483 370
Working Capital/Parts/Inventory . . . . . . . . . . . . . . . . . . . . . . . . 263 — — — — — (263)
Equipment . . . . . . . . . . . . . . . . . . . . . . . . . . . . . . . . . . . . . . . . 26 14 15 6 6 6 4
Sustaining Capital . . . . . . . . . . . . . . . . . . . . . . . . . . . . . . . . . . . — — — 6 6 6 4
Decommissioning . . . . . . . . . . . . . . . . . . . . . . . . . . . . . . . . . . . — — — — — — 13
Deductions to Income . . . . . . . . . . . . . . . . . . . . . . . . . . . . . . 288 14 15 13 13 13 (240)
Depreciation . . . . . . . . . . . . . . . . . . . . . . . . . . . . . . . . . . . . . . . 19 14 14 18 19 20 13Amortization . . . . . . . . . . . . . . . . . . . . . . . . . . . . . . . . . . . . . . . — — — — — — —
Safety Fund Fee . . . . . . . . . . . . . . . . . . . . . . . . . . . . . . . . . . . . . — — — — — — —
Financial Expenses . . . . . . . . . . . . . . . . . . . . . . . . . . . . . . . . . . . — — — — — — —
Production Maintenance Fee . . . . . . . . . . . . . . . . . . . . . . . . . . — — — — — — —
Additions to Income . . . . . . . . . . . . . . . . . . . . . . . . . . . . . . . 19 14 14 18 19 20 13
Net Cash Flow After-Tax (RMB — millions) . . . . . . . . . . . . . . . . . 285 548 543 558 551 490 624
Discounted Cash Flow at 10% . . . . . . . . . . . . . . . . . . . . . . . . . . . 272 475 428 400 359 290 336
Cumulative Discounted Cash Flow . . . . . . . . . . . . . . . . . . . . . . . . 272 747 1,175 1,574 1,933 2,223 2,559
VI-63

8/12/2019 Valuation Report of Coal Mining
http://slidepdf.com/reader/full/valuation-report-of-coal-mining 64/71

8/12/2019 Valuation Report of Coal Mining
http://slidepdf.com/reader/full/valuation-report-of-coal-mining 65/71
APPENDIX VI VALUATION REPORT
TABLE 4.4
DISCOUNTED CASH FLOWCHENGYI MINE
Inner Mongolia Autonomous Region, People’s Republic of ChinaPrepared For
INNER MONGOLIA YITAI COAL CO., LTD.By
John T. Boyd CompanyMining and Geological Consultants
March 2012
2012 2013 2014 2015
Production Tonnes (millions) . . . . . . . . . . . . . . . . . . . . . . . . . . . . . . . . . . . . 1.20 1.20 1.20 1.22Sales price (RMB/tonne) . . . . . . . . . . . . . . . . . . . . . . . . . . . . . . . . . . . . . . . . 400 400 400 400Revenue RMB (millions) . . . . . . . . . . . . . . . . . . . . . . . . . . . . . . . . . . . . . . . . 480 480 480 488Total Operating Cost (RMB/tonne) . . . . . . . . . . . . . . . . . . . . . . . . . . . . . . . . 125.6 127.7 130.2 120.6
RMB (millions)
Total Operating Costs . . . . . . . . . . . . . . . . . . . . . . . . . . . . . . . . . . . . . . . . . . 151 153 156 147Value Added Tax . . . . . . . . . . . . . . . . . . . . . . . . . . . . . . . . . . . . . . . . . . . . . . 78 79 79 81Corporate G&A . . . . . . . . . . . . . . . . . . . . . . . . . . . . . . . . . . . . . . . . . . . . . . . 21 22 22 22Coal Resource Fee . . . . . . . . . . . . . . . . . . . . . . . . . . . . . . . . . . . . . . . . . . . . 4 4 4 4Other Taxes . . . . . . . . . . . . . . . . . . . . . . . . . . . . . . . . . . . . . . . . . . . . . . . . . . 7 7 7 7
Total Cost of Sales . . . . . . . . . . . . . . . . . . . . . . . . . . . . . . . . . . . . . . . 261 264 268 262Taxable Income . . . . . . . . . . . . . . . . . . . . . . . . . . . . . . . . . . . . . . . 219 216 212 226
Income Tax . . . . . . . . . . . . . . . . . . . . . . . . . . . . . . . . . . . . . . . . . . . . . . . . . . 55 32 32 34
Net After-Tax Income . . . . . . . . . . . . . . . . . . . . . . . . . . . . . . . . . . . . . . 165 183 180 192Working Capital/Parts/Inventory . . . . . . . . . . . . . . . . . . . . . . . . . . . . . . . . 120 — — (120)Equipment . . . . . . . . . . . . . . . . . . . . . . . . . . . . . . . . . . . . . . . . . . . . . . . . . 10 6 5 —Sustaining Capital . . . . . . . . . . . . . . . . . . . . . . . . . . . . . . . . . . . . . . . . . . . — 3 3 —
Decommissioning . . . . . . . . . . . . . . . . . . . . . . . . . . . . . . . . . . . . . . . . . . . — — — 4Deductions to Income . . . . . . . . . . . . . . . . . . . . . . . . . . . . . . . . . . . . . . 130 9 8 (116)
Depreciation . . . . . . . . . . . . . . . . . . . . . . . . . . . . . . . . . . . . . . . . . . . . . . . 19 17 15 13Amortization . . . . . . . . . . . . . . . . . . . . . . . . . . . . . . . . . . . . . . . . . . . . . . . — — — —Safety Fund Fee . . . . . . . . . . . . . . . . . . . . . . . . . . . . . . . . . . . . . . . . . . . . . — — — —Financial Expenses . . . . . . . . . . . . . . . . . . . . . . . . . . . . . . . . . . . . . . . . . . . — — — —Production Maintenance Fee . . . . . . . . . . . . . . . . . . . . . . . . . . . . . . . . . . — — — —
Additions to Income . . . . . . . . . . . . . . . . . . . . . . . . . . . . . . . . . . . . . 19 17 15 13Net Cash Flow After-Tax (RMB — millions) . . . . . . . . . . . . . . . . . . . . . . . . . 53 191 187 322Discounted Cash Flow at 10% . . . . . . . . . . . . . . . . . . . . . . . . . . . . . . . . . . . 51 166 147 230Cumulative Discounted Cash Flow . . . . . . . . . . . . . . . . . . . . . . . . . . . . . . . . 51 216 363 594
VI-65
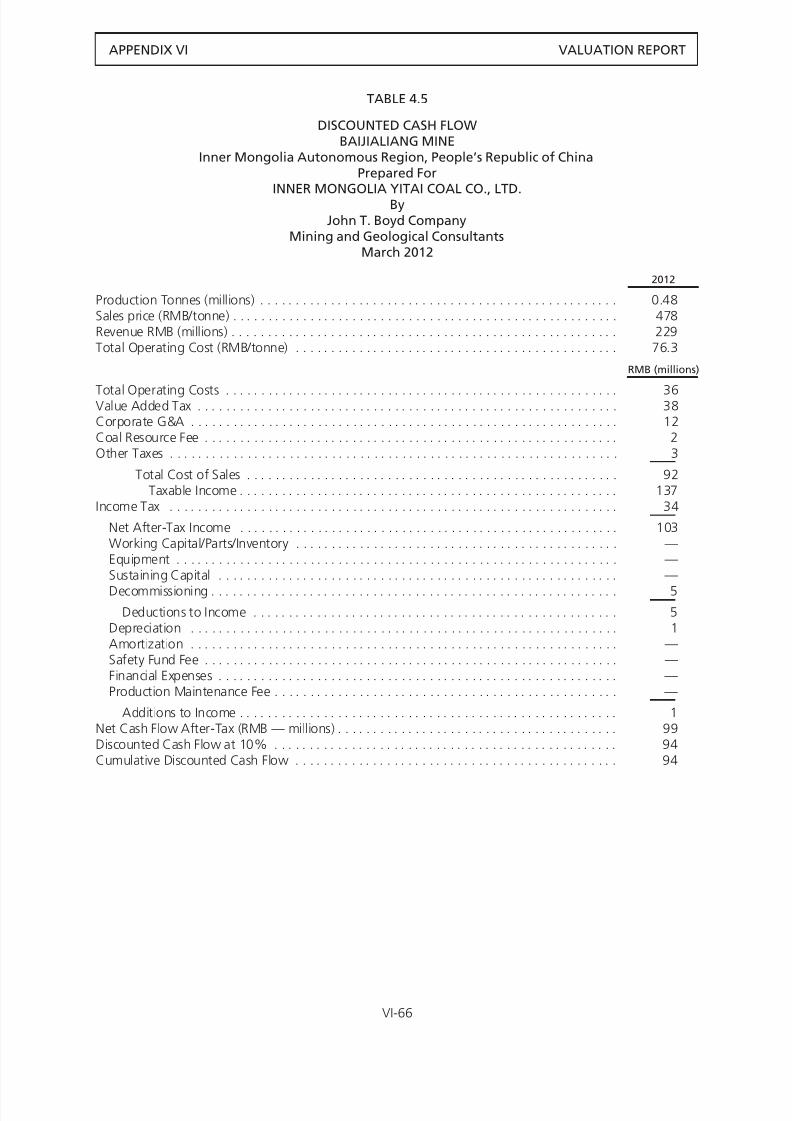
8/12/2019 Valuation Report of Coal Mining
http://slidepdf.com/reader/full/valuation-report-of-coal-mining 66/71

8/12/2019 Valuation Report of Coal Mining
http://slidepdf.com/reader/full/valuation-report-of-coal-mining 67/71
APPENDIX VI VALUATION REPORT
TABLE 4.6
DISCOUNTED CASH FLOWYITAI GROUP COMPOSITE
Inner Mongolia Autonomous Region, People’s Republic of ChinaPrepared For
INNER MONGOLIA YITAI COAL CO., LTD.By
John T. Boyd CompanyMining and Geological Consultants
March 2012
2012 2013 2014 2015 2016 2017 2018 2019 2020 2021 2022
Production Tonnes (millions) . . . . . . . . . . . . . . . . . . . . 10.18 9.40 8.90 8.69 7.47 7.27 6.78 3.92 2.76 1.92 1.92
Sales price (RMB/tonne) . . . . . . . . . . . . . . . . . . . . . . . 437 435 436 436 442 441 439 428 429 429 429
Revenue RMB (millions) . . . . . . . . . . . . . . . . . . . . . . . . 4,448 4,093 3,881 3,790 3,302 3,206 2,974 1,679 1,185 824 824
Total Operating Cost (RMB/tonne) . . . . . . . . . . . . . . . 91.0 95.9 99.8 97.0 97.4 100.0 102.6 114.2 121.5 135.7 134.7
RMB (millions)
Total Operating Costs . . . . . . . . . . . . . . . . . . . . . . . . . 926 901 888 843 728 727 696 448 335 261 259
Value Added Tax . . . . . . . . . . . . . . . . . . . . . . . . . . . . . 724 675 640 617 531 531 493 277 180 135 135Corporate G&A . . . . . . . . . . . . . . . . . . . . . . . . . . . . . . 103 92 94 96 89 87 82 54 35 25 35
Coal Resource Fee . . . . . . . . . . . . . . . . . . . . . . . . . . . . 33 30 28 28 24 23 22 13 9 6 6
Other Taxes . . . . . . . . . . . . . . . . . . . . . . . . . . . . . . . . . 65 61 58 55 48 48 44 25 16 12 12
Total Cost of Sales . . . . . . . . . . . . . . . . . . . . . . 1,851 1,760 1,709 1,639 1,419 1,416 1,337 816 576 439 447
Taxable Income . . . . . . . . . . . . . . . . . . . . . . 2,597 2,333 2,172 2,151 1,883 1,790 1,637 863 609 385 377
Income Tax . . . . . . . . . . . . . . . . . . . . . . . . . . . . . . . . . 503 350 326 323 282 268 246 130 91 96 94
Net After-Tax Income . . . . . . . . . . . . . . . . . . . . . 2,094 1,983 1,846 1,828 1,600 1,521 1,392 734 518 289 283
Working Capital/Parts/Inventory . . . . . . . . . . . . . . . 1,055 — — (120) — — (263) (318) — — —
Equipment . . . . . . . . . . . . . . . . . . . . . . . . . . . . . . . . 104 45 39 88 116 19 17 11 98 5 4
Sustaining Capital . . . . . . . . . . . . . . . . . . . . . . . . . . 4 22 22 19 19 19 17 11 23 20 4
Decommissioning . . . . . . . . . . . . . . . . . . . . . . . . . . 5 — — 4 — — 13 8 — — —
Deductions to Income . . . . . . . . . . . . . . . . . . . . . 1 ,167 67 61 (9) 135 38 (215) (287) 121 25 9
Depreciation . . . . . . . . . . . . . . . . . . . . . . . . . . . . . . 84 77 74 84 94 97 88 63 49 50 51
Amortization . . . . . . . . . . . . . . . . . . . . . . . . . . . . . . — — — — — — — — — — —Safety Fund Fee . . . . . . . . . . . . . . . . . . . . . . . . . . . . — — — — — — — — — — —
Financial Expenses . . . . . . . . . . . . . . . . . . . . . . . . . . — — — — — — — — — — —
Production Maintenance Fee . . . . . . . . . . . . . . . . . . — — — — — — — — — — —
Additions to Income . . . . . . . . . . . . . . . . . . . . . . 84 77 74 84 94 97 88 63 49 50 51
Net Cash Flow After-Tax (RMB — millions) . . . . . . . . 1,012 1,993 1,859 1,921 1,559 1,580 1,695 1,083 446 314 325
Discounted Cash Flow at 10% . . . . . . . . . . . . . . . . . . 965 1,727 1,465 1,376 1,015 935 912 530 198 127 120
Cumulative Discounted Cash Flow . . . . . . . . . . . . . . . 965 2,692 4,157 5,533 6,548 7,484 8,396 8,926 9,124 9,251 9,371
VI-67

8/12/2019 Valuation Report of Coal Mining
http://slidepdf.com/reader/full/valuation-report-of-coal-mining 68/71
APPENDIX VI VALUATION REPORT
TABLE 4.6 — Continued
2023 2024 2025 2026 2027 2028 2029 2030 2031 2032 2033
Production Tonnes (millions) . . . . . . . . . . . . . . . . . . 1.92 1.92 1.92 1.74 1.81 1.84 1.84 1.84 1.82 1.81 0.25
Sales price (RMB/tonne) . . . . . . . . . . . . . . . . . . . . . 429 429 429 429 429 429 429 429 429 429 428
Revenue RMB (millions) . . . . . . . . . . . . . . . . . . . . . . 824 824 824 747 777 790 790 790 781 777 107
Total Operating Cost (RMB/tonne) . . . . . . . . . . . . . 130.6 126.7 127.6 131.2 125.2 123.3 124.3 122.1 122.6 122.9 133.6
RMB (millions)
Total Operating Costs . . . . . . . . . . . . . . . . . . . . . . . 251 243 245 228 227 227 229 225 223 223 33
Value Added Tax . . . . . . . . . . . . . . . . . . . . . . . . . . . 135 135 135 123 113 130 130 130 128 128 18
Corporate G&A . . . . . . . . . . . . . . . . . . . . . . . . . . . . 35 35 35 32 33 34 34 34 33 33 13
Coal Resource Fee . . . . . . . . . . . . . . . . . . . . . . . . . . 6 6 6 6 6 6 6 6 6 6 1
Other Taxes . . . . . . . . . . . . . . . . . . . . . . . . . . . . . . . 12 12 12 11 10 12 12 12 12 12 2
Total Cost of Sales . . . . . . . . . . . . . . . . . . . . 439 432 433 400 388 408 410 406 402 401 67
Taxable Income . . . . . . . . . . . . . . . . . . . . 385 392 391 347 389 382 380 384 379 376 40
Income Tax . . . . . . . . . . . . . . . . . . . . . . . . . . . . . . . 96 98 98 87 97 95 95 96 95 94 10
Net After-Tax Income . . . . . . . . . . . . . . . . . . . 289 294 293 260 292 286 285 288 284 282 30
Working Capital/Parts/Inventory . . . . . . . . . . . . . — — — — — — — — — — (354)
Equipment . . . . . . . . . . . . . . . . . . . . . . . . . . . . . . 4 4 4 4 94 4 5 5 5 5 —
Sustaining Capital . . . . . . . . . . . . . . . . . . . . . . . . 4 4 4 4 4 19 20 5 5 5 —
Decommissioning . . . . . . . . . . . . . . . . . . . . . . . . — — — — — — — — — — 5Deductions to Income . . . . . . . . . . . . . . . . . . . 9 9 9 9 99 24 24 9 9 9 (349)
Depreciation . . . . . . . . . . . . . . . . . . . . . . . . . . . . 46 33 32 30 29 27 26 25 25 25 4
Amortization . . . . . . . . . . . . . . . . . . . . . . . . . . . . — — — — — — — — — — —
Safety Fund Fee . . . . . . . . . . . . . . . . . . . . . . . . . . — — — — — — — — — — —
Financial Expenses . . . . . . . . . . . . . . . . . . . . . . . . — — — — — — — — — — —
Production Maintenance Fee . . . . . . . . . . . . . . . — — — — — — — — — — —
Additions to Income . . . . . . . . . . . . . . . . . . . . 46 33 32 30 29 27 26 25 25 25 4
Net Cash Flow After-Tax (RMB — millions) . . . . . . 326 318 316 282 222 290 287 304 300 298 384
Discounted Cash Flow at 10% . . . . . . . . . . . . . . . . 109 97 87 71 51 60 54 52 47 42 49
Cumulative Discounted Cash Flow . . . . . . . . . . . . . 9,480 9,576 9,664 9,734 9,785 9,845 9,900 9,952 9,998 10,041 10,090
VI-68

8/12/2019 Valuation Report of Coal Mining
http://slidepdf.com/reader/full/valuation-report-of-coal-mining 69/71
8/12/2019 Valuation Report of Coal Mining
http://slidepdf.com/reader/full/valuation-report-of-coal-mining 70/71
APPENDIX VI VALUATION REPORT
APPENDIX A 27 July 2010 Letter to John T. Boyd Company
27 July 2010
John T. Boyd Company4000 Town Center Boulevard, Suite 300
Canonsburg, PA 15317USA
Attention: Mr. John T. Boyd IIPresident and CEO
Subject: Valuation ReportInner Mongolia Yitai Coal Co., Ltd.Inner Mongolia Autonomous RegionPeople’s Republic of China
Dear Sirs:
Inner Mongolia Yitai Coal Co., Ltd. (Yitai) engaged John T. Boyd Company (BOYD) in June 2010 tocomplete a Valuation Study of the Inner Mongolia Yitai Group Company Limited (Yitai Group) mines. Thegeneral locations of the Yitai Group’s mines are in Junggar (Zhunge’er) Banner, and Ejin Horo Banner in InnerMongolian Autonomous Region, People’s Republic of China (PRC). Yitai Group’s 5 mines are to be included inthe Yitai Global Offering and listing on The Stock Exchange of Hong Kong (SEHK). The results of your review ofthe Yitai Group mines are discussed in the Competent Person’s Report prepared by BOYD for Yitai’s use in theGlobal Offering.
Yitai has entered into an Assets Transfer Agreement with Yitai Group. Pursuant to this agreement, YitaiGroup agrees to transfer the assets and interests of the Group relating to coal production after completion ofthe Global Offering.
The BOYD Valuation Report must be prepared in accordance with SEHK Chapter 18 rules. Accordingly, asrequired by Chapter 18, this letter is intended to provide written confirmation to BOYD that Yitai Group hasprovided the following to BOYD for use in preparing the Valuation Report:
1. Full, accurate and true disclosure of all Material Information.
2. All necessary access to our Company’s personnel and records.
Yitai Group also confirms with this letter that it has respected the independence of John T. Boyd Companyduring the preparation of the Valuation Report.
Best Regards,
INNER MONGOLIA YITAI COAL CO. LTD.
By: Donghai Zhang
VI-70

8/12/2019 Valuation Report of Coal Mining
http://slidepdf.com/reader/full/valuation-report-of-coal-mining 71/71
APPENDIX VI VALUATION REPORT
APPENDIX B 1 March 2012 Letter to John T. Boyd Company
1 March 2012
John T. Boyd Company4000 Town Center Boulevard, Suite 300
Canonsburg, PA 15317USA
Attention: Mr. John T. Boyd IIPresident and CEO
Subject: Valuation ReportInner Mongolia Yitai Coal Co., Ltd.Inner Mongolia Autonomous RegionPeople’s Republic of China
Dear Sirs:
Inner Mongolia Yitai Coal Co., Ltd. (Yitai) engaged John T. Boyd Company (BOYD) in June 2010 tocomplete a Valuation Study of the Inner Mongolia Yitai Group Company Limited (Yitai Group) mines. Thegeneral locations of the Yitai Group’s mines are in Junggar (Zhunge’er) Banner and Ejin Horo Banner in InnerMongolian Autonomous Region, People’s Republic of China (PRC). Yitai Group’s five mines are to be includedin the Yitai Global Offering and listing on The Stock Exchange of Hong Kong (SEHK). The results of your reviewof the Yitai Group mines are discussed in the Competent Person’s Report prepared by BOYD for Yitai’s use inthe Global Offering.
Yitai has entered into an Assets Transfer Agreement with Yitai Group. Pursuant to this agreement, YitaiGroup agrees to transfer the assets and interests of the Group relating to coal production after completion ofthe Global Offering.
We confirm that Yitai has been provided a draft copy of the BOYD Valuation Report and the managementof Yitai has reviewed the subject draft report and hereby verifies that:
• BOYD has accurately stated the material source data provided by Yitai.
• All information of an historical and/or factual nature is properly and accurately recorded.
• There is not any material omission of critical information in the BOYD valuation report.
Respectfully Submitted,
INNER MONGOLIA YITAI COAL CO. LTD
By: Donghai Zhang