valuation of proved vs. probable oil and gas reserves · valuation of proved vs. probable oil and...
TRANSCRIPT
Misund & Osmundsen, Cogent Economics & Finance (2017), 5: 1385443https://doi.org/10.1080/23322039.2017.1385443
FINANCIAL ECONOMICS | RESEARCH ARTICLE
Valuation of proved vs. probable oil and gas reservesBård Misund1* and Petter Osmundsen2
Abstract: Oil and gas reserves are the most important assets of oil and gas compa-nies. A source of confusion for investors in oil companies, is that reserves quantities and values are uncertain estimates. Reserves are typically classified according to probabilities of recovery from underground reservoirs. All US-listed companies are required to disclose proved reserves but not probable reserves, thus leaving out potentially important information for investors and financial analysts. This study addresses the impact on market valuation of various classifications of reserves amounts. Using a data sample of 94 companies that do disclose information on probable reserves, we compare the relation between three classifications of reserves and oil company returns. While we find that information on probable reserves do not have an impact on stock returns measured over the entire time period, this is not the case since 2009, coinciding with the onset of the shale gas revolution.
Subjects: Energy & Fuels; Mining, Mineral & Petroleum Engineering; Corporate Finance; Financial Accounting; Financial Statement Analysis
Keywords: oil and gas reserves; proved reserves; probable reserves; value relevance; oil company valuation; stock returns; valuation; Shell; Exxon; Chevron
*Corresponding author: Bård Misund, UiS Business School, University of Stavanger, N-4036, Stavanger, NorwayE-mail: [email protected]
Reviewing editor:David McMillan, University of Stirling, UK
Additional information is available at the end of the article
ABOUT THE AUTHORSBård Misund is an associate professor of Accounting and Finance at the University of Stavanger Business School. He has 10 years of industry experience from commodities companies. Before joining academia, he worked as an economic analyst and an advisor to the Norwegian oil and gas company Statoil ASA. His research includes commodity price behavior, the spot-forward relationship in futures markets, determinants of commodity firm stock returns, financial statement analysis and valuation of oil and gas firms.
Petter Osmundsen is a professor of Petroleum Economics at the University of Stavanger, where he is the head of the Section of Petroleum Economics. He has a PhD from the Norwegian School of Economics (NHH). In 1992/1993, he was a research fellow at the Massachusetts Institute of Technology. He has previously held a position as an associate professor at NHH. Homepage: WWW.UiS.no/Osmundsen.
PUBLIC INTEREST STATEMENTThis paper investigates the relationship between oil and gas reserves and market valuation of oil and gas companies, a topic that is of interest to investors and analysts. It is well known that financial markets can react considerably to substantial changes in oil and gas companies’ reserves. Oil and gas reserves are typically classified according to probabilities of recovery from underground reservoirs, such as proved (highest), probable and possible (lowest) reserves. The US Securities and Exchange Commission require that oil and gas companies only disclose one of these, proved reserves. We conjecture that information on also other reserves measures, such as probable and possible oil and gas reserves, could have an impact on oil company stock returns. Our results suggest that proved developed reserves are the main type of reserves used by investors to forecast future cash flows. However, we find that investors react differently to changes in probable oil and gas reserves, and especially after 2009, coinciding with the shale gas revolution.
Received: 11 May 2017Accepted: 30 August 2017First Published: 28 September 2017
© 2017 The Author(s). This open access article is distributed under a Creative Commons Attribution (CC-BY) 4.0 license.
Page 1 of 17
Page 2 of 17
Misund & Osmundsen, Cogent Economics & Finance (2017), 5: 1385443https://doi.org/10.1080/23322039.2017.1385443
1. IntroductionThis paper investigates the relationship between oil and gas reserves and market valuation of oil and gas companies. This is a topic that concerns both investors and analysts. Financial markets can react considerably to substantial changes in oil and gas companies’ reserves. For instance, the discovery of the large Johan Sverdrup field on the Norwegian continental shelf in 2011 led to a 30% apprecia-tion in Lundin’s share price on the day it was announced. Recently, Scholtens and Wagenaar (2011), find that the revisions of energy reserves significantly impact market values of oil and gas firms.
Although oil and gas reserves are the most important assets for oil and gas companies,1 it can be quite challenging for analysts and investors to value the booked reserves that the companies dis-close. As Osmundsen (2010) points out, the information value of booked reserves (proved reserves) suffers from a number of weaknesses. First, reserves are recognized as a function of average oil and gas price levels during the year.2 Second, booked reserves are affected by contractual issues.3 Finally, the most commonly referred to type of reserves, namely proved reserves, do not contain complete information on the future growth of the company since the proved reserves concept excludes less mature reserves. The Society of Petroleum Engineers (SPE, 2011) classifies reserves into three groups based on the uncertainty associated with their recoverability; proved, probable, and possible oil and gas reserves.4 While oil companies calculate internal estimates for all three reserves types, they are only required to disclose one of these, proved reserves, to the financial markets. Thus, vital informa-tion relating to oil and gas assets, which investors and financial analysts require to forecast future cash flows, are not disclosed to the market place. The result is a systematic understatement of the true resource base for oil companies. However, in some countries, such as Canada, disclosures of proved and probable reserves are mandatory (Canadian Securities Administrators, 2002a, 2002b). Moreover, the legislation also permits the disclosure of contingent reserves. During 2008–2010, the U.S. Securities and Exchange Commission (SEC) and FASB (FASB) updated US disclosure rules allow-ing for disclosure of less mature reserves (FASB, 2009, 2010; SEC, 2008). Furthermore, several private consultancies such as Wood Mackenzie gather information on oil and gas fields for oil and gas com-panies and provide their own estimate of reserves, including reserve categorizations other than proved reserves. Hence, information on probable reserves is available to investors for a fee, suggest-ing that market valuations of oil and gas companies can be affected by information on probable re-serves held by a part of the investor community. However, our knowledge of the impact of less mature reserves on market valuation is limited. Studies on the impact of changes in reserves on shareholder returns use either proved reserves amounts (Boyer & Filion, 2007; Clinch & Magliolo, 1992; Misund, 2015a; Misund, Asche, & Osmundsen, 2008; Misund, Osmundsen, & Sikveland, 2015; Spear, 1994) or proved reserves values (Alciatore, 1993; Bryant, 2003; Doran, Collins, & Dhaliwal, 1988; Spear, 1996; Teall, 1992). Very few studies focus on the relative importance of different types of reserves classifications or reserve maturity. The aim of our study is to fill this knowledge gap and examine the impact of changes in different types of reserves classifications on oil company valua-tion. Although this topic has not been addressed rigorously in the academic literature, circumstantial evidence suggests that investors evaluate probable and proved reserves differently. In 2004, the oil major Royal Dutch Shell disclosed a re-classification of 28% of their oil and gas reserves, from proved to probable reserves, an announcement which had a significant negative impact on their share price.
To test the research question of how changes in different types of oil and gas reserves relates to returns to shareholders, we regress total shareholder returns on different reserves classifications and a set of control variables such as profitability, market and extra market risks, and commodity price changes. We collect three types of reserves classifications that are associated with different probabilities of recoverability; proved developed, proved undeveloped, and probable. Proved devel-oped reserves are the most mature and are associated with the highest probability of recovering the underground reserves, while probable reserves are associated with the lowest recoverability probability. Although recent updates in US regulation allows US-listed oil and gas firms to disclose probable reserves (FASB, 2010; SEC, 2008), few actually do. We have therefore collected data for a sample of non-US firms which provide information on probable reserve estimates. Our sample con-sists of 94 Canadian and International oil companies, for the years 1993–2013 (455 firm years).
Page 3 of 17
Misund & Osmundsen, Cogent Economics & Finance (2017), 5: 1385443https://doi.org/10.1080/23322039.2017.1385443
We address an additional research question. Recently, Misund (2015a) found that the relationship between returns and proved reserves varied across energy type (gas vs. oil), and that there had been a structural shift post-2008, coinciding with the onset of the shale gas revolution in North America. The shale gas revolution is by many commentators considered a game changer. As a sensitivity analysis, we examine how this event has affected the relative impact of different reserves classifica-tions on returns. The expectation is that only gas reserves have changed their impact on total share-holder returns since the shale gas revolution resulted in a sustained lower level of natural gas prices in North America.
We find a significant positive relation between changes in proved developed reserves and oil com-pany returns. The evidence for less mature reserves, however, is unconvincing. Proved undeveloped reserves are only significant at the 10% level. Moreover, we are unable to uncover a significant as-sociation between oil company returns and probable reserves. This suggests that investors view changes in less mature oil and reserves as very uncertain, and they are unable to efficiently price this type of assets. The picture seems to be different when considering structural events such as the shale gas revolution, and taking into account hydrocarbon type (oil vs. gas). We find that the impact of the shale gas revolution has significantly affected the relationship between returns and gas re-serves, but not with changes in oil reserves.
The results from our study improves our understanding of how different types of reserves impact oil company returns. In particular, we are able to identify the differential impact of different reserves classifications. Moreover, the results also suggest that an important defining event in the industry, exemplified by the shale gas revolution, can lead to structural breaks in the valuation of reserves. This result is relevant for evaluating the valuation of oil reserves in the current oil market downturn.
The remainder of the paper is organized as follows. Section 2 provides background information on oil and gas reserves in terms of reserves classification practices, disclosure rules, and accounting standards, and a review on the literature on the association between reserves and oil company shareholder returns. Section 3 describes the methodology and develops the hypotheses. Thereafter, Section 4 describes the data, followed by Section 5 presenting and discussing the empirical results. Section 6 concludes.
2. Background and literature
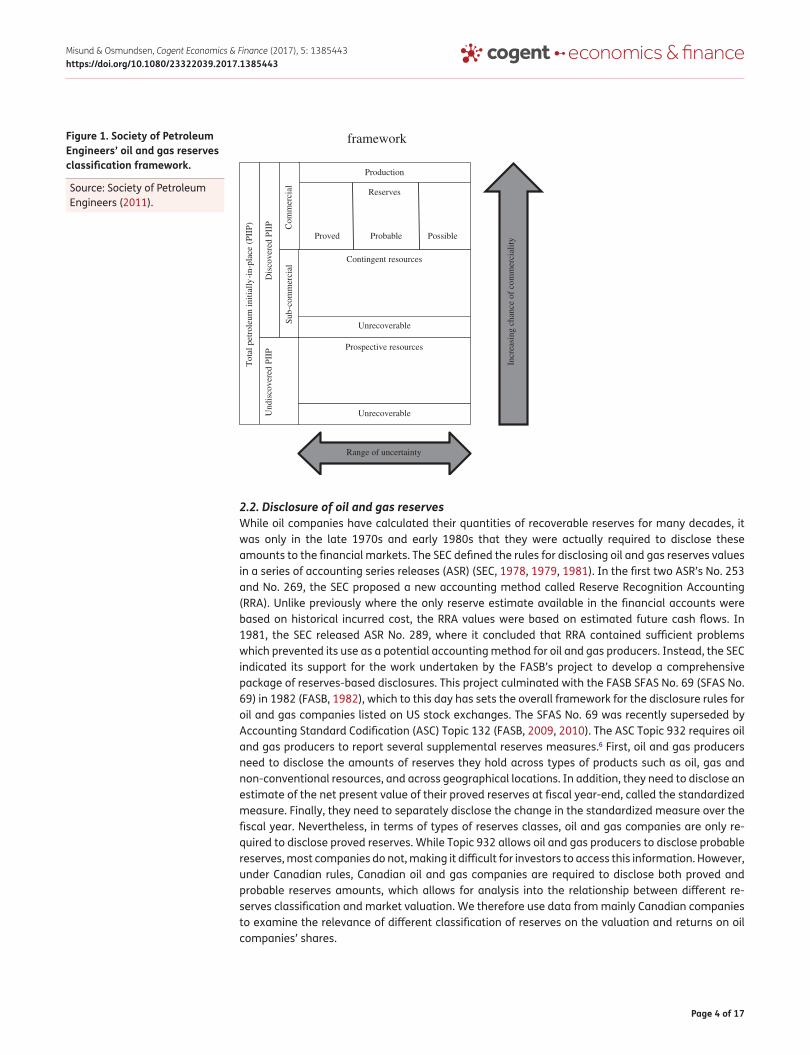
2.1. Oil and gas reservesThe companies’ petroleum resources in underground reservoirs cannot fully be counted as an asset. Only the recoverable amounts can be monetized to future cash flows and therefore considered as inventory. The recoverability of reserves is a function of several variables including feasible technol-ogy, geology, and economics, and is associated with uncertainty.5 In fact, the SPE classifies reserves into several groups according to both the uncertainty and maturity of the recoverable volumes (Figure 1).
The total recoverable volumes are not certain, but rather estimate of future production under certain conditions (Mitchell, 2004). These conditions include economic conditions such as commod-ity prices, knowledge of the projects’ ability in development completion and extracting the resourc-es, as well as geological information. Recently, both Exxon and Chevron downward revised their reserves amounts due to the low oil prices. Furthermore, the above-mentioned conditions are not always well defined. Since the estimation of reserve amounts cannot be done with complete objec-tivity, it is possible to arrive at different estimates for the same field. An example of this is Shell’s 28% re-classification of their proved to probable reserves in 2004.
Page 4 of 17
Misund & Osmundsen, Cogent Economics & Finance (2017), 5: 1385443https://doi.org/10.1080/23322039.2017.1385443
2.2. Disclosure of oil and gas reservesWhile oil companies have calculated their quantities of recoverable reserves for many decades, it was only in the late 1970s and early 1980s that they were actually required to disclose these amounts to the financial markets. The SEC defined the rules for disclosing oil and gas reserves values in a series of accounting series releases (ASR) (SEC, 1978, 1979, 1981). In the first two ASR’s No. 253 and No. 269, the SEC proposed a new accounting method called Reserve Recognition Accounting (RRA). Unlike previously where the only reserve estimate available in the financial accounts were based on historical incurred cost, the RRA values were based on estimated future cash flows. In 1981, the SEC released ASR No. 289, where it concluded that RRA contained sufficient problems which prevented its use as a potential accounting method for oil and gas producers. Instead, the SEC indicated its support for the work undertaken by the FASB’s project to develop a comprehensive package of reserves-based disclosures. This project culminated with the FASB SFAS No. 69 (SFAS No. 69) in 1982 (FASB, 1982), which to this day has sets the overall framework for the disclosure rules for oil and gas companies listed on US stock exchanges. The SFAS No. 69 was recently superseded by Accounting Standard Codification (ASC) Topic 132 (FASB, 2009, 2010). The ASC Topic 932 requires oil and gas producers to report several supplemental reserves measures.6 First, oil and gas producers need to disclose the amounts of reserves they hold across types of products such as oil, gas and non-conventional resources, and across geographical locations. In addition, they need to disclose an estimate of the net present value of their proved reserves at fiscal year-end, called the standardized measure. Finally, they need to separately disclose the change in the standardized measure over the fiscal year. Nevertheless, in terms of types of reserves classes, oil and gas companies are only re-quired to disclose proved reserves. While Topic 932 allows oil and gas producers to disclose probable reserves, most companies do not, making it difficult for investors to access this information. However, under Canadian rules, Canadian oil and gas companies are required to disclose both proved and probable reserves amounts, which allows for analysis into the relationship between different re-serves classification and market valuation. We therefore use data from mainly Canadian companies to examine the relevance of different classification of reserves on the valuation and returns on oil companies’ shares.
Figure 1. Society of Petroleum Engineers’ oil and gas reserves classification framework.
Source: Society of Petroleum Engineers (2011).
framework
Production
Reserves
Tot
alpe
trol
eum
initi
ally
-in-
plac
e(P
IIP)
Dis
cove
red
PIIP C
omm
erci
alSu
b-co
mm
erci
al
Und
isco
vere
d PI
IPContingent resources
Unrecoverable
Prospective resources
Unrecoverable
Proved Probable Possible
Incr
easi
ng c
hanc
e of
com
mer
cial
ity
Range of uncertainty
Page 5 of 17
Misund & Osmundsen, Cogent Economics & Finance (2017), 5: 1385443https://doi.org/10.1080/23322039.2017.1385443
2.3. Previous studies on the importance of oil and gas reserves for investorsSeveral studies have examined the association between reserves and security returns in the first years following the release of the new regulation in the late 1970s and early 1980s. Some of the earliest studies address the impact of the now discontinued RRA measure and returns (Basu & Lynn, 1984; Dharan, 1984; Ghicas & Pastena, 1989; Magliolo, 1986). Other studies address the information content of the supplementary information oil and gas companies are required to disclose. This strand of the literature examines the relationship between market returns and disclosure of changes in both reserves amounts (Clinch & Magliolo, 1992; Harris & Ohlson, 1987; Spear, 1994) and reserves values (Alciatore, 1993; Doran et al., 1988; Kennedy & Hyon, 1992; Spear, 1996).7 However, the re-sults are mixed. Harris and Ohlson (1987) and Doran et al. (1988) found no support for the impact of changes in reserve values on security returns. Later studies suggest that separation of reserves into its individual components drastically improved the information content of the standardized meas-ure (Alciatore, 1993; Spear, 1996). Furthermore, Boone (2002) argues that the apparent lack of a significant relationship between reserve value changes and security returns can be due to model misspecification (e.g. omitted variable bias).
A few studies have also examined the association of reserve quantities with oil company returns. Clinch and Magliolo (1992) found that changes in reserves due to production dominated all other reserve information. Moreover, Spear (1994) found that the individual components of reserve amounts changes (such as discoveries, production, purchases) improved the relationship with re-turns. Contrary to Clinch and Magliolo (1992), Spear (1994) and later Cormier and Magnan (2002), find that discoveries are more important than production. In fact, a recent study finds a negative relationship between changes in production and returns (Boyer & Filion, 2007). Furthermore, Osmundsen, Asche, Misund, and Mohn (2006), Osmundsen, Misund, and Asche (2007) and Quirin, Berry, and O’Bryan (2000) fail to find a significant relationship between market valuation ratios and the reserves replacement ratio, which is calculated as the ratio of new reserve additions divided by production. Hence, the empirical literature has not uncovered a robust relationship between re-serves changes and market valuations.
Perhaps as a result of the focus on proved reserves by the regulators and the accounting standard setters, coupled with the lack of information released by oil companies, very few studies have ad-dressed the relevance of different resource classifications. The aim of our paper is provide insight into the impact on less mature reserves on security returns.
3. Methodology
3.1. Theoretical and empirical modeling of the relationship between reserves and stock returnsStock price returns can be affected by a multitude of factors, including profitability and systematic risk factors. Returns may also be influenced by elements specific to the industry to which the com-panies belong. For instance, oil and gas company returns may be affected by changes in the prices of oil and gas through the impact on revenues, changes in reserves as a result of successful explora-tion activities. The empirical literature investigating the determinants of stock returns broadly follow two threads. The first examines stock returns in the framework of standard asset prices models, such as the capital asset pricing model (CAPM) (Lintner, 1965; Mossin, 1966; Sharpe, 1964) or multi-factor models such as the Fama–French–Carhart four factor model (Carhart, 1997; Fama & French, 1993, 1996). The limitation of this approach is that key elements such as profitability or other risk factors such as the oil price are not directly captured by standard asset pricing models.
To incorporate company profitability measures, industry-specific information or commodity price risk factors, the empirical literature suggest an alternative approach, such as the multifactor model applied by Sadorsky (2001) and Boyer and Filion (2007). This latter approach uses the standard mar-ket model as a starting point and includes additional risk factors which are believed to affect stock prices. The foundation for the additional variables is not necessarily dictated by theoretical models.
Page 6 of 17
Misund & Osmundsen, Cogent Economics & Finance (2017), 5: 1385443https://doi.org/10.1080/23322039.2017.1385443
By contrast, our approach is to use a theoretical model for the relationship between stock returns and profitability. We use Ohlson’s (1995) theoretical framework relating stock returns to profitability, both current and proxies for future profitability, in addition to the cost of capital. The Ohlson model is derived from, and therefore consistent with, the dividend discount model. The benefit of using the Ohlson model is that we can incorporate fundamentals such as profitability into the empirical mod-el. Recent studies, such as Bhaskaran and Sukumaran (2016), and Asche and Misund (2016), high-light the importance of financial performance on the valuation of oil and gas companies.
Using the Ohlson model as a starting point, we include additional risk factors identified in other studies such as the Fama–French risk factors as well as changes in oil and gas prices. In this way, our empirical models build on both the previous works on asset pricing models, as well as the time series work by Sadorsky (2001) and others. We also include a measure of oil and gas reserves since this is the focus of our study. We use the following empirical representation of the Ohlson model:
where rit is the total shareholder return for company i at time t. The profitability and shocks in profit-ability from t − 1 to t, are captured by Eit and ∆Eit, respectively. The market risk premium (CAPM) is represented by MRPt, while SMBt and HMLt are the returns on the Fama–French (1993, 1996) Small-minus-big and high-minus-low factors, respectively. The Carhart (1997) momentum factor is de-noted by MOMt. We also include a set of commodity risk factors, ∆OPt and ∆GPt, representing changes in oil and gas prices, respectively. RFt is the risk free rate at time t, and εit is the error term.
The last variable, OGR, denotes a vector of oil and gas reserves variables. Ideally, we would like to compare proved to probable and possible reserves. However, we need to select among the types of reserves that are readily available for investors. Since possible reserves are not disclosed, we there-fore select the following three types of reserves; proved developed, proved undeveloped and prob-able reserves. There is a distinction between proved developed and proved undeveloped. The former are reserves which can be extracted from existing wells, while the latter are classified as reserves from new wells on undrilled acreage or existing wells where a relatively major expenditure is re-quired for completion. We expect that the market will distinguish between the two types of proved reserves, and together with probable reserves the model will provide insight into the relationship between different reserves types and oil company shareholder returns. This resulting model, which examines the relationship between stock returns and the three types of reserves classification, is referred to as “the total reserves model.” We propose the following null hypotheses:
H10: The coefficients on proved developed and proved undeveloped reserves are equal.
Formally, this is a F-test of coefficient equality, �provdev − �provundev = 0. If the null hypothesis is rejected then the results provide evidence that investors value proved developed reserves differently than proved undeveloped reserves.
H20: The coefficients on proved developed and probable reserves are equal. Formally, this is
a F-test of coefficient equality, �provdev − �prob = 0. If the null hypothesis is rejected then the results provide evidence that investors value proved developed reserves differently than probable reserves.
H30: The coefficients on proved undeveloped and probable reserves are equal. Formally, this is
a F-test of coefficient equality, �provundev − �prob = 0. If the null hypothesis is rejected then the results provide evidence that investors value proved undeveloped reserves differently than probable reserves.
Despite our best efforts, the empirical model may still be misspecified. For instance, if we incorrectly fail to include one or more important explanatory variables in the empirical model, this can result in the “omitted variables bias,” which is where the regression estimator becomes biased and
(1)rit − RFt = �
0+ �
1Eit∕pit−1 + �
2ΔEit∕pit−1 + �
1MRPt + �
2SMBt + �
3HMLt + �
4MOMt + �
5ΔOPt
+ �6ΔGPt + �OGRit + �it
Page 7 of 17
Misund & Osmundsen, Cogent Economics & Finance (2017), 5: 1385443https://doi.org/10.1080/23322039.2017.1385443
inconsistent. To mitigate the adverse affects of the omitted variables bias, we apply panel data tech-niques. Specifically, we use a fixed effects model.
3.2. Sensitivity analysis: The impact of the shale gas revolutionWhile the previous section addresses the differential impact of oil versus gas reserves on oil com-pany returns, this relationship might not be constant over time. Certain aspects might affect the relationship between changes in reserves and returns. In fact, early studies found a negative effect of investment in exploration activities on security returns. McConnell and Muscarella (1985), Picchi (1985) and Jensen (1986, 1988) examined the impact on valuation of investments in exploration and development (E&D) activities during a time period characterized by declining commodity prices, excessive spending on E&D and excessive levels of reserves. The results suggested that the market reacted negatively to E&D spending. An analogy can be found in recent years. During the late ,2000s, a structural change in the US natural gas market occurred in the form of a shale gas boom that has increased domestic natural gas production to the degree that only minimal LNG imports might be required to meet domestic demand in the future. After George P. Michell’s pioneering work for one-and-a-half decade, the use of hydraulic fracking had a commercial breakthrough in the late 1990s in the Barnet Shale. Devon Energy took this breakthrough further when they combined the use of hydraulic fracking with horizontal drilling in 2003 (Yergin, 2011). This combined development al-lowed the recovery of shale gas at significantly reduced costs. This has led to an influx of so-called unconventional gas on the domestic market. In lack of sufficient export capacity this additional sup-ply has depressed US natural gas prices substantially relative to pre shale gas levels. The so-called “shale revolution” is commonly dated to around 2009 (see e.g. Oglend, Lindbäck, & Osmundsen, 2016), mostly for natural gas, but also for oil at a later stage, and may have impacted on the impor-tance of gas reserves. The onset of the shale gas revolution has coincided with a substantial drop in gas prices, while oil prices have increased.8 Erdõs (2012), using a vector error correction model, dates the decoupling of oil and gas prices to 2009, the same year as the onset of the shale gas revolution. Although the shale gas revolution happened mostly in the US, it has also affected the revenue of Canadian oil and gas companies in our sample. Directly, as Canadian oil and gas companies own assets in the US shale gas play, and indirectly though the fact that the Canadian and the US markets for natural gas are integrated, see Bachmeier and Griffin (2006). Hence, an interesting research question emerges: has there been a structural shift in the relationship between oil company share-holder returns and gas reserves in 2009? If there has been a differential impact from gas or oil re-serve changes on returns, then it is possible to examine this using a structural shift methodology.
Following Misund et al. (2008) and Misund (2015a), we apply the Gujarati’s (1970a, 1970b) version of the Chow test (Chow, 1960). We include a dummy variable that takes the value 1 for observations in the year 2009 onward, and 0 otherwise. The dummy variable is interacted with the changes in reserves variables, OGR × YR2009, and formally tests for a structural shift using a Wald test on the coefficients on the interaction terms, both for gas and oil reserves. The hypotheses can be formu-lated as follows:
H40: No structural shift in the coefficients of the interaction terms between a shale gas
dummy variable and gas reserves.
H50: No structural shift in the coefficients of the interaction terms between shale gas dummy
variable and oil reserves.
If we fail to reject H40 and reject H5
0, this provides evidence that the coefficient on gas reserves has
changed, but not that of oil reserves. This will provide evidence that there has been a change in the gas reserves–returns relationship coinciding with the onset of the shale gas revolution. In order to be able to differentiate between the impacts relating to gas or oil reserves, we do the analysis in two
Page 8 of 17
Misund & Osmundsen, Cogent Economics & Finance (2017), 5: 1385443https://doi.org/10.1080/23322039.2017.1385443
steps. We estimate Equation (1) with total reserves disaggregated in to both gas and oil proved de-veloped, proved undeveloped and probable reserves. For ease of presentation to readers, we apply a stepwise approach. The dummy variable is interacted only with the gas reserves variables in the first step, and only with oil reserves variables in the second step. These two models are referred to as “Shale gas model: gas” and “Shale gas model: oil,” respectively.
4. Data
4.1. Data sources and descriptive statisticsWe collect data from the IHS Herold database (www.ihs.com/herold). This database contains finan-cial and operational data for more than 800 energy companies. From this universe, we select those companies that have data on both proved developed, proved undeveloped and probable reserves. This gives us a total of 94 Canadian and international oil and gas companies. We use annual data for the years 1993–2013, resulting in 455 firm year observations.
We collect three types of reserves; proved developed, proved undeveloped and probable reserves both oil and gas reserves. The following definitions are taken from Exxon Mobil’s 2013 10-K filing supplemental information on oil and gas exploration and production activities and SPE (1997):
SPE (1997) defines “Proved oil and gas reserves” as “those quantities of oil and gas, which, by analysis of geoscience and engineering data, can be estimated with reasonable certainty to be eco-nomically recoverable, from a given date forward, from known reservoirs, and under current eco-nomic conditions, operating methods and government regulations. Proved reserves can be categorized as developed or undeveloped.”
Exxon Mobil Annual Report 2013 defines “Proved developed reserves” as “those volumes that are expected to be recovered through existing wells with existing equipment and operating methods or in which the cost of the required equipment is relatively minor compared to the cost of a new well.”
Exxon Mobil (2013) defines “Proved undeveloped reserves” as “those volumes that are expected to be recovered from new wells on undrilled acreage, or from existing wells where a relatively major expenditure is required for recompletion.”
SPE (1997) defines “Probable oil and gas reserves” as those unproven reserves which analysis of geological and engineering data suggest are more likely than not to be recoverable. In this context, when probabilistic methods are used, there should be at least a 50% probability that the quantities actually recovered will equal or exceed the sum of estimated proved plus probable reserves.
The total shareholder returns are calculated over the fiscal year and are the sum of capital gains and dividend yields. The annual risk-free rates and annual equity risk factors are taken from Ken French’s database. The commodity price risk factors are calculated as the return over the fiscal year of the front month West Texas intermediate crude oil futures and Henry Hub natural gas futures contracts, listed at the New York Mercantile Exchange.
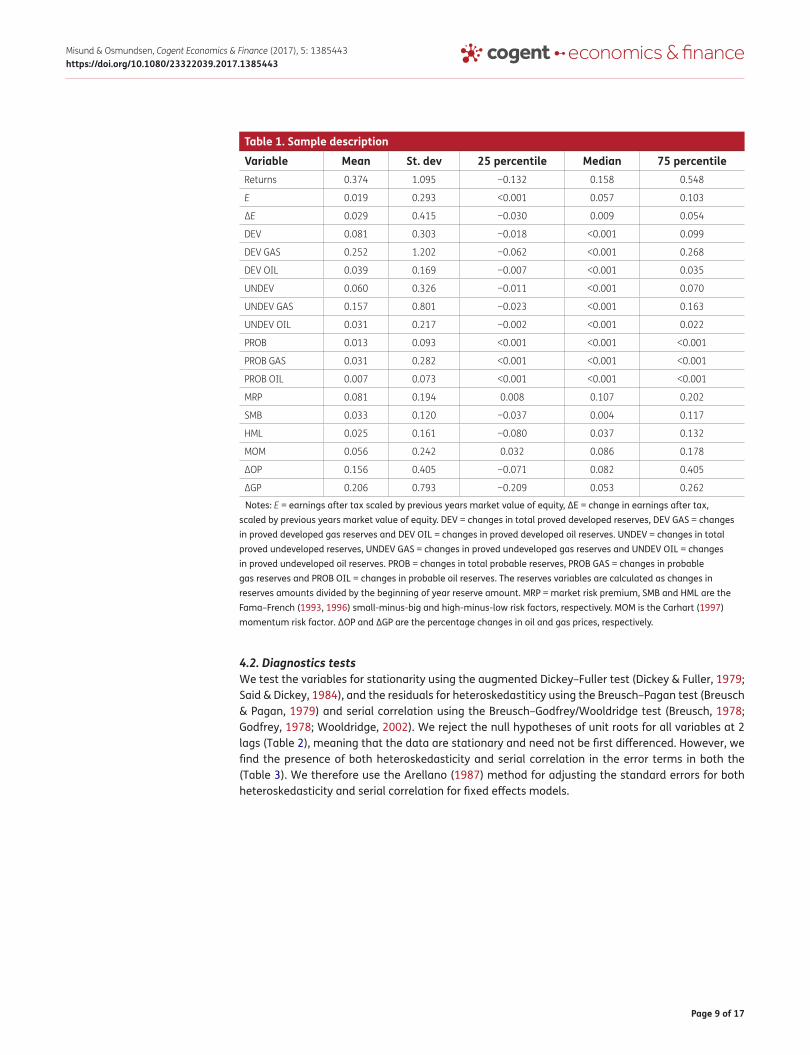
Table 1 provides descriptive statistics for the sample. All classifications of reserves have on aver-age been growing over the time period examined in our analysis. The data also show that gas re-serves seem to have grown more than oil reserves for the companies in the sample. Furthermore, the increase in proved developed reserves has been 8.1% annually, compared to 6.0 and 1.3% for proved undeveloped and probable reserves, respectively. The average profitability has been positive, but very volatile. The data also show that the oil and gas prices have increased over the time period studied, even despite the gas price fall since 2008.
Page 9 of 17
Misund & Osmundsen, Cogent Economics & Finance (2017), 5: 1385443https://doi.org/10.1080/23322039.2017.1385443
4.2. Diagnostics testsWe test the variables for stationarity using the augmented Dickey–Fuller test (Dickey & Fuller, 1979; Said & Dickey, 1984), and the residuals for heteroskedastiticy using the Breusch–Pagan test (Breusch & Pagan, 1979) and serial correlation using the Breusch–Godfrey/Wooldridge test (Breusch, 1978; Godfrey, 1978; Wooldridge, 2002). We reject the null hypotheses of unit roots for all variables at 2 lags (Table 2), meaning that the data are stationary and need not be first differenced. However, we find the presence of both heteroskedasticity and serial correlation in the error terms in both the (Table 3). We therefore use the Arellano (1987) method for adjusting the standard errors for both heteroskedasticity and serial correlation for fixed effects models.
Table 1. Sample description
Notes: E = earnings after tax scaled by previous years market value of equity, ΔE = change in earnings after tax, scaled by previous years market value of equity. DEV = changes in total proved developed reserves, DEV GAS = changes in proved developed gas reserves and DEV OIL = changes in proved developed oil reserves. UNDEV = changes in total proved undeveloped reserves, UNDEV GAS = changes in proved undeveloped gas reserves and UNDEV OIL = changes in proved undeveloped oil reserves. PROB = changes in total probable reserves, PROB GAS = changes in probable gas reserves and PROB OIL = changes in probable oil reserves. The reserves variables are calculated as changes in reserves amounts divided by the beginning of year reserve amount. MRP = market risk premium, SMB and HML are the Fama–French (1993, 1996) small-minus-big and high-minus-low risk factors, respectively. MOM is the Carhart (1997) momentum risk factor. ΔOP and ΔGP are the percentage changes in oil and gas prices, respectively.
Variable Mean St. dev 25 percentile Median 75 percentileReturns 0.374 1.095 −0.132 0.158 0.548
E 0.019 0.293 <0.001 0.057 0.103
ΔE 0.029 0.415 −0.030 0.009 0.054
DEV 0.081 0.303 −0.018 <0.001 0.099
DEV GAS 0.252 1.202 −0.062 <0.001 0.268
DEV OIL 0.039 0.169 −0.007 <0.001 0.035
UNDEV 0.060 0.326 −0.011 <0.001 0.070
UNDEV GAS 0.157 0.801 −0.023 <0.001 0.163
UNDEV OIL 0.031 0.217 −0.002 <0.001 0.022
PROB 0.013 0.093 <0.001 <0.001 <0.001
PROB GAS 0.031 0.282 <0.001 <0.001 <0.001
PROB OIL 0.007 0.073 <0.001 <0.001 <0.001
MRP 0.081 0.194 0.008 0.107 0.202
SMB 0.033 0.120 −0.037 0.004 0.117
HML 0.025 0.161 −0.080 0.037 0.132
MOM 0.056 0.242 0.032 0.086 0.178
ΔOP 0.156 0.405 −0.071 0.082 0.405
ΔGP 0.206 0.793 −0.209 0.053 0.262

Page 10 of 17
Misund & Osmundsen, Cogent Economics & Finance (2017), 5: 1385443https://doi.org/10.1080/23322039.2017.1385443
Table 3. Tests for heteroscedasticity and serial correlation
Notes: Heteroskedasticity is tested using the Breusch–Pagan test (H0: homoskedasticity) and serial correlation is tested using Breusch–Godfrey/Wooldridge (H0: no serial correlation). Values are BP-statistic (Breusch–Pagan), χ2-statistic (Breusch–Godfrey/Wooldridge test).
***Statistical significance value is p < 0.01.
Heteroskedasticity Serial correlationTotal reserves model 459.212*** 11.268***
Shale gas model: Gas 810.989*** 16.883***
Shale gas model: Oil 767.215*** 11.410***
Table 2. Unit root test
Notes: The variables are tested for the presence of unit root using the augmented Dickey-Fuller test with a null hypothesis of a unit root (the alternative hypothesis is that the variables are stationary). E = earnings after tax scaled by previous years market value of equity, ΔE = change in earnings after tax, scaled by previous years market value of equity. DEV = changes in total proved developed reserves, DEV GAS = changes in proved developed gas reserves and DEV OIL = changes in proved developed oil reserves. UNDEV = changes in total proved undeveloped reserves, UNDEV GAS = changes in proved undeveloped gas reserves and UNDEV OIL = changes in proved undeveloped oil reserves. PROB = changes in total probable reserves, PROB GAS = changes in probable gas reserves and PROB OIL = changes in probable oil reserves. The reserves variables are calculated as changes in reserves amounts divided by the beginning of year reserve amount. MRP = market risk premium, SMB and HML are the Fama–French (1993, 1996) small-minus-big and high-minus-low risk factors, respectively. MOM is the Carhart (1997) momentum risk factor. ΔOP and ΔGP are the percentage changes in oil and gas prices, respectively.
Variable ADF test p-valueReturns −13.208 <0.001
E −11.385 <0.001
ΔE −14.576 <0.001
DEV −11.498 <0.001
DEV GAS −11.427 <0.001
DEV OIL −10.469 <0.001
UNDEV −10.697 <0.001
UNDEV GAS −8.911 <0.001
UNDEV OIL −11.992 <0.001
PROB −10.419 <0.001
PROB GAS −9.227 <0.001
PROB OIL −10.893 <0.001
MRP −13.373 <0.001
SMB −15.258 <0.001
HML −15.640 <0.001
MOM −15.419 <0.001
ΔOP −16.035 <0.001
ΔGP −11.958 <0.001
Page 11 of 17
Misund & Osmundsen, Cogent Economics & Finance (2017), 5: 1385443https://doi.org/10.1080/23322039.2017.1385443
5. Results and discussion
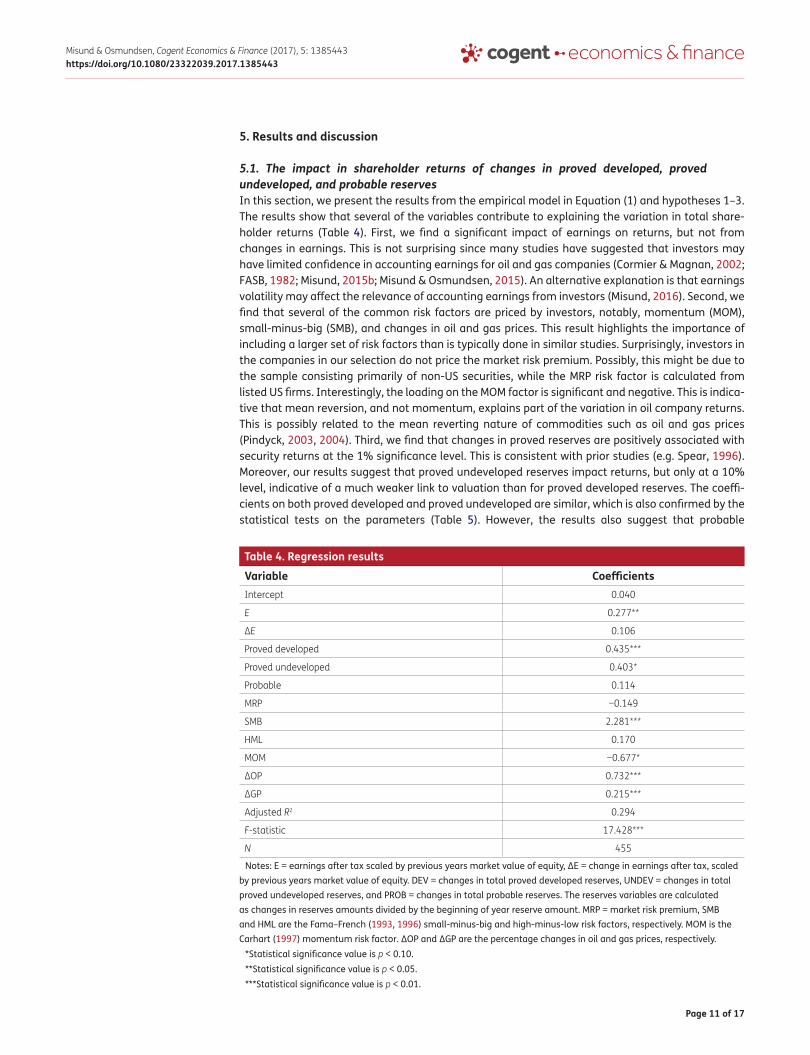
5.1. The impact in shareholder returns of changes in proved developed, proved undeveloped, and probable reservesIn this section, we present the results from the empirical model in Equation (1) and hypotheses 1–3. The results show that several of the variables contribute to explaining the variation in total share-holder returns (Table 4). First, we find a significant impact of earnings on returns, but not from changes in earnings. This is not surprising since many studies have suggested that investors may have limited confidence in accounting earnings for oil and gas companies (Cormier & Magnan, 2002; FASB, 1982; Misund, 2015b; Misund & Osmundsen, 2015). An alternative explanation is that earnings volatility may affect the relevance of accounting earnings from investors (Misund, 2016). Second, we find that several of the common risk factors are priced by investors, notably, momentum (MOM), small-minus-big (SMB), and changes in oil and gas prices. This result highlights the importance of including a larger set of risk factors than is typically done in similar studies. Surprisingly, investors in the companies in our selection do not price the market risk premium. Possibly, this might be due to the sample consisting primarily of non-US securities, while the MRP risk factor is calculated from listed US firms. Interestingly, the loading on the MOM factor is significant and negative. This is indica-tive that mean reversion, and not momentum, explains part of the variation in oil company returns. This is possibly related to the mean reverting nature of commodities such as oil and gas prices (Pindyck, 2003, 2004). Third, we find that changes in proved reserves are positively associated with security returns at the 1% significance level. This is consistent with prior studies (e.g. Spear, 1996). Moreover, our results suggest that proved undeveloped reserves impact returns, but only at a 10% level, indicative of a much weaker link to valuation than for proved developed reserves. The coeffi-cients on both proved developed and proved undeveloped are similar, which is also confirmed by the statistical tests on the parameters (Table 5). However, the results also suggest that probable
Table 4. Regression results
Notes: E = earnings after tax scaled by previous years market value of equity, ΔE = change in earnings after tax, scaled by previous years market value of equity. DEV = changes in total proved developed reserves, UNDEV = changes in total proved undeveloped reserves, and PROB = changes in total probable reserves. The reserves variables are calculated as changes in reserves amounts divided by the beginning of year reserve amount. MRP = market risk premium, SMB and HML are the Fama–French (1993, 1996) small-minus-big and high-minus-low risk factors, respectively. MOM is the Carhart (1997) momentum risk factor. ΔOP and ΔGP are the percentage changes in oil and gas prices, respectively.
*Statistical significance value is p < 0.10.**Statistical significance value is p < 0.05.***Statistical significance value is p < 0.01.
Variable Coefficients Intercept 0.040
E 0.277**
ΔE 0.106
Proved developed 0.435***
Proved undeveloped 0.403*
Probable 0.114
MRP −0.149
SMB 2.281***
HML 0.170
MOM −0.677*
ΔOP 0.732***
ΔGP 0.215***
Adjusted R2 0.294
F-statistic 17.428***
N 455

Page 12 of 17
Misund & Osmundsen, Cogent Economics & Finance (2017), 5: 1385443https://doi.org/10.1080/23322039.2017.1385443
reserves do not impact returns of oil and gas companies. A possible explanation is that investors do not consider that information about this type of reserves conveys information that is useful to fore-casting future cash flows. It seems that investors primarily use information on proved developed reserves to forecast futures cash flows and secondarily use proved undeveloped reserves.
The model in Equation (1) might be too simple, and may suffer from two shortcomings. First, the model does not differentiate between oil and gas reserves. Investors might place different values on gas versus oil reserves. Second, changes in the relationship between reserves and valuation over time as suggested by prior research (Jensen,1986, 1988; McConnell & Muscarella, 1985; Picchi, 1985; Spear, 1996). We conjecture that a major event such as the Shale gas revolution might have affected the relationship between reserves and returns. The impacts of oil versus gas reserves, and of struc-ture events, are addressed in the next section.
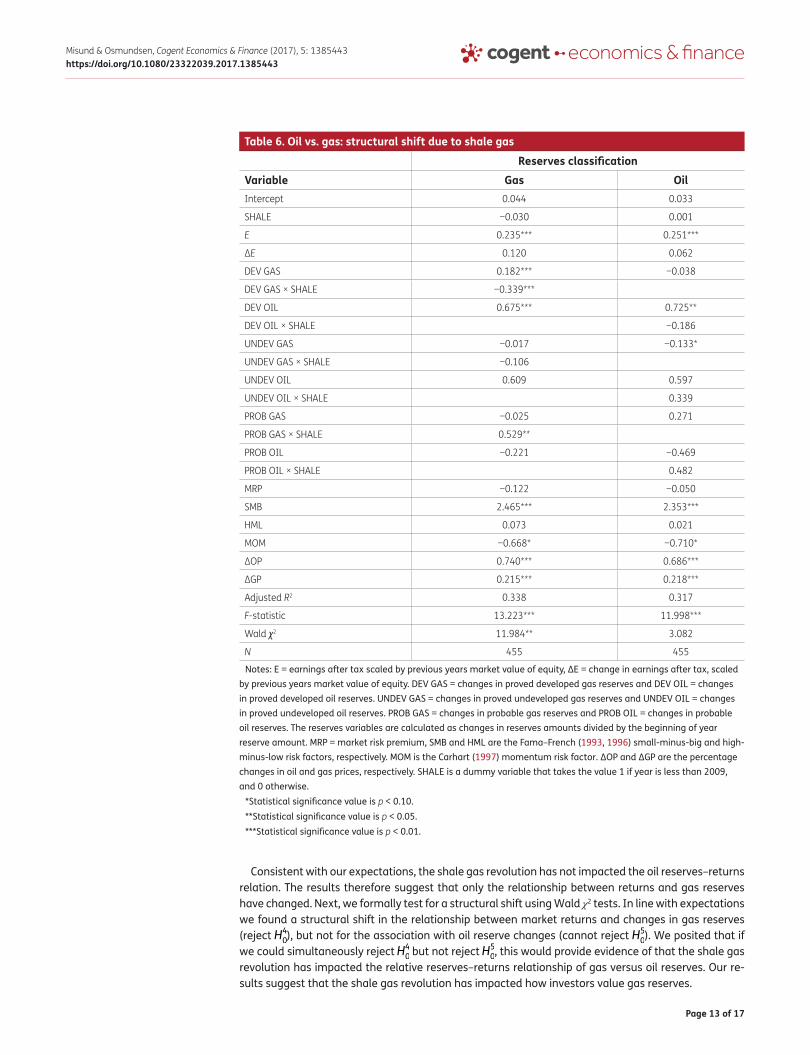
5.2. The impact of Shale gas revolution on the reserve–return relationIn the following section, we examine the impact of the industry event surrounding the shale gas revolution. Many commentators have attributed the start of the shale gas revolution to year 2009, and this date serves as the break point in our analysis. In particular, we examine whether the coef-ficients on gas reserves have changed after 2009. The analysis is done in two steps. First, the shale gas dummy variables are interacted with only the gas reserve variables (Table 6, Column 2). Next, the analysis is repeated with an interaction between the dummy variables and only the oil reserve variables (Table 6, Column 3).
The results suggest that the relationship between gas reserves changes before and after the onset of the shale gas revolution. The coefficient on the developed gas reserves prior to 2009 is 0.182, and is significant at the 1% level. This is also the case for the interaction between the dummy variable for the shale gas revolution (which takes the value 1 for years 2009–2013, and 0 for the years 1993–2008), resulting in a parameter of −0.157 (0.182–0.339) for the post-shale gas period. This means that increases in proved developed gas reserves after 2008 have had a negative impact on oil and gas shareholder returns, ceteris paribus. A plausible explanation is that there was a substantial and prolonged fall in gas prices after the financial crisis, possibly to a level where the investors believe to be unprofitable. Investors might value gas reserves lower than earlier if they believe that the sub-dued prices will last for a substantial time period. Hence, expected future cash flows from the pro-duction of gas reserves appear to have dropped.9 This explanation is consistent with findings from studies of oil reserves in the 1980s (Jensen, 1986, 1988; McConnell & Muscarella, 1985; Picchi, 1985).
A characteristic of shale gas reserves is that the technology allows a much more rapid development and production than conventional gas plays. This suggests that investors might be of the opinion that the lower cash flows come earlier when produced from shale gas formations, than from other conven-tional reserves, and hence are discounted less and have a larger impact on shareholder values. This may also explain why the coefficient on probable gas reserves post-2008 is not negative, but in fact positive and significant at the 5% level. The probable reserves are less mature, and can generate cash flows further into the future, possibly when the gas prices might be higher. Casual observations of the New York Mercantile Exchange forward curves for Henry Hub Natural gas futures contracts indicate that the curves seemed to be in contango during this time period, suggesting an expected increase in prices.10
Table 5. Hypothesis testing (H10, H2
0, and H3
0)
Note: DEV, UNDEV and PROB represent the coefficients on changes in developed, undeveloped, and probable reserves (total), respectively.
F p-valueH1
0: DEV = UNDEV 0.0122 0.9122
H2
0: DEV = PROB 1.1223 0.2489
H3
0: UNDEV = PROB 0.6657 0.4150
Page 13 of 17
Misund & Osmundsen, Cogent Economics & Finance (2017), 5: 1385443https://doi.org/10.1080/23322039.2017.1385443
Consistent with our expectations, the shale gas revolution has not impacted the oil reserves–returns relation. The results therefore suggest that only the relationship between returns and gas reserves have changed. Next, we formally test for a structural shift using Wald χ2 tests. In line with expectations we found a structural shift in the relationship between market returns and changes in gas reserves (reject H4
0), but not for the association with oil reserve changes (cannot reject H5
0). We posited that if
we could simultaneously reject H40 but not reject H5
0, this would provide evidence of that the shale gas
revolution has impacted the relative reserves–returns relationship of gas versus oil reserves. Our re-sults suggest that the shale gas revolution has impacted how investors value gas reserves.
Table 6. Oil vs. gas: structural shift due to shale gas
Notes: E = earnings after tax scaled by previous years market value of equity, ΔE = change in earnings after tax, scaled by previous years market value of equity. DEV GAS = changes in proved developed gas reserves and DEV OIL = changes in proved developed oil reserves. UNDEV GAS = changes in proved undeveloped gas reserves and UNDEV OIL = changes in proved undeveloped oil reserves. PROB GAS = changes in probable gas reserves and PROB OIL = changes in probable oil reserves. The reserves variables are calculated as changes in reserves amounts divided by the beginning of year reserve amount. MRP = market risk premium, SMB and HML are the Fama–French (1993, 1996) small-minus-big and high-minus-low risk factors, respectively. MOM is the Carhart (1997) momentum risk factor. ΔOP and ΔGP are the percentage changes in oil and gas prices, respectively. SHALE is a dummy variable that takes the value 1 if year is less than 2009, and 0 otherwise.
*Statistical significance value is p < 0.10.**Statistical significance value is p < 0.05.***Statistical significance value is p < 0.01.
Reserves classificationVariable Gas Oil Intercept 0.044 0.033
SHALE −0.030 0.001
E 0.235*** 0.251***
ΔE 0.120 0.062
DEV GAS 0.182*** −0.038
DEV GAS × SHALE −0.339***
DEV OIL 0.675*** 0.725**
DEV OIL × SHALE −0.186
UNDEV GAS −0.017 −0.133*
UNDEV GAS × SHALE −0.106
UNDEV OIL 0.609 0.597
UNDEV OIL × SHALE 0.339
PROB GAS −0.025 0.271
PROB GAS × SHALE 0.529**
PROB OIL −0.221 −0.469
PROB OIL × SHALE 0.482
MRP −0.122 −0.050
SMB 2.465*** 2.353***
HML 0.073 0.021
MOM −0.668* −0.710*
ΔOP 0.740*** 0.686***
ΔGP 0.215*** 0.218***
Adjusted R2 0.338 0.317
F-statistic 13.223*** 11.998***
Wald χ2 11.984** 3.082
N 455 455
Page 14 of 17
Misund & Osmundsen, Cogent Economics & Finance (2017), 5: 1385443https://doi.org/10.1080/23322039.2017.1385443
6. ConclusionThis paper studies the relationship between total shareholder returns and three types of reserves classifications. Oil companies under US accounting rules and regulation are only required to disclose proved oil and gas reserves. This is also the reason why prior studies examining the impact of re-serves on returns have focused on proved reserves. However, as suggested by Osmundsen (2010), a major weakness of the proved reserves concept is the exclusion of more immature reserves. In fact, the SPE classifies oil and gas reserve according to probability of recoverability from petroleum reser-voirs. Hence, this information can provide information for investors wanting to forecast future cash flows. Since oil companies are not required to disclose it, the information is not readily available for investors. However, in some countries outside the US, disclosure of other reserves classifications is mandatory. Using a sample of firms, mainly Canadian, which disclose information on immature re-serves, we address three issues. First, we examine if other reserves classifications other than proved developed reserves are valuation relevant. Second, we test if gas and oil reserves are valued differ-ently across reserves classifications. Last, we test whether the impact of an industry event with wide ranging effects has impacted the reserves–returns relationship differently for oil and gas reserves, and across the three reserves classifications.
Our results suggest that proved developed reserves are the main type of reserves used by inves-tors to forecast future cash flows. However, we do find that there is a difference between oil and gas reserves, and especially after 2009, coinciding with the shale gas revolution. The effect can be ex-plained by the impact of shale gas on the natural gas prices in North America.
From late 2014 to mid-2015, the crude oil prices fell from above 100 USD/barrel to less than 50 USD/barrel. Many commentators suggested that the recent US onshore shale oil boom was the cul-prit, flooding the markets with oil. In many ways the shale oil boom resembles the shale gas boom, but the effects will only reveal themselves in the years to come. Our results can therefore also be relevant for understanding the recent shale oil boom, the resulting prolonged oil price slump, and the how it may have affected the valuation of oil and gas companies.
Our results also have some policy implications. For many years, geologists have been using a much wider definition of oil and gas reserves than the SEC has. The results suggest that information on probable reserves bears only a limited relevance for investors in Canadian and other non-US oil and gas firms. The attention to the amount of and changes in probable reserves by investors and analysts in general might improve if mandatory disclosure was introduced also by all oil and gas companies. This is especially the case for companies listed in the US, which is the primary capital market for oil and gas equities.
AcknowledgmentsWe wish to thank the participants at the IAEE International Conference in Bergen in 2016, as well as an anonymous reviewer for constructive comments. We believe their input have greatly improved our initial manuscript.
FundingThis work was supported by Norges forskningsråd [grant number 237674].
Author detailsBård Misund1
E-mail: [email protected] ID: http://orcid.org/0000-0001-7069-5707Petter Osmundsen2
E-mail: [email protected] UiS Business School, University of Stavanger, N-4036,
Stavanger, Norway.2 Department of Industrial Economics, University of Stavanger,
N-4036 Stavanger, Norway.
Citation informationCite this article as: Valuation of proved vs. probable oil and gas reserves, Bård Misund & Petter Osmundsen, Cogent Economics & Finance (2017), 5: 1385443.
Notes1. Reserves in the US can also effect wealth of individu-
als owning oil and gas assets directly, not only through stock exchange listed companies (Fitzgerald & Rucker, 2016).
2. Under the Financial Accounting Standards Board’s (FASB) Statement of Financial Accounting Standards (SFAS) No. 69 (FASB, 1982), the amount of reserves was estimated using oil and gas prices at the fiscal year-end; while under the current rules of FASB Accounting Standards Codification Topic 932 (FASB, 2010), the annual average of the monthly average oil and gas prices are used.
3. See also Bindemann (1999) and Kretzschmar, Misund, and Hatherly (2007) for a discussion on the impact of production sharing agreements on accounting disclo-sures.
Page 15 of 17
Misund & Osmundsen, Cogent Economics & Finance (2017), 5: 1385443https://doi.org/10.1080/23322039.2017.1385443
4. SPE combines the reserves into 1P (proved), 2P (proved plus probable) and 3P (proved plus probable plus pos-sible) and define probabilities of 90, 50, and 10% of final recovered reserves exceeding the 1P, 2P, and 3P amounts, respectively.
5. Reserve amounts can be increased by enhanced oil recovery techniques (EOR) (Sevin & Ortega, 2016).
6. Early on there were inconsistencies between the 1981 SPE and 1978 SEC definitions. This led to efforts to align the definitions which culminated in the 1997 SPE reserves definitions for proved, probable, and pos-sible categories (Harrell & Gardner, 2005). While 1997 SPE and 1978 SEC proved reserves definitions are very similar, the SEC regulations were generally considered to be more restrictive. In 2008, the SEC rules were updated and are now consistent with SPE’s (SEC, 2008).
7. A strand of the literature also examine the value rel-evance of reserve amounts and net present values, i.e. regression of market values on reserves in levels form (see e.g. Berry, Hasan, & O’Bryan, 1998; Bryant, 2003; Cormier & Magnan, 2002; Misund et al., 2008).
8. Academic studies have addressed the divergence of oil and gas prices during this period (see e.g. Asche, Oglend, & Osmundsen, 2012; Erdõs, 2012).
9. Shale gas economics is also affected by costs, including drilling costs, completion, and productivity (see Ikon-nikova, Gülen, Browning, and Tinker (2015)) for a study on shale gas economics and the well level.
10. Assuming that the Rational Expectations Hypothesis holds.
ReferencesAlciatore, M. L. (1993). New evidence on SFAS No. 69 and the
components of the change in reserve value. The Accounting Review, 68(3), 639–656.
Arellano, M. (1987). Computing robust standard errors for within-groups estimators. Oxford Bulletin of Economics and Statistics, 49(4), 431–434.
Asche, F., & Misund, B. (2016). Who’s a major? A novel approach to peer group selection: Empirical evidence from oil and gas companies. Cogent Economics & Finance, 4(1), 1–12.
Asche, F., Oglend, A., & Osmundsen, P. (2012). Gas versus oil prices the impact of shale gas. Energy Policy, 47, 117–124. https://doi.org/10.1016/j.enpol.2012.04.033
Bachmeier, L. J., & Griffin, J. M. (2006). Testing for market integration crude oil, coal, and natural gas. The Energy Journal, 27, 55–71.
Basu, S., & Lynn, B.E. (1984). Discounted cash-flow requirements in the oil and gas industry. Cost & Management, (November–December), 15–25.
Berry, K. T., Hasan, T., & O’Bryan, D. (1998). Relative information content of proved reserves: The BOEs-revenue vs BOEs-energy. Journal of Energy Finance and Development, 3(1), 1–11. https://doi.org/10.1016/S1085-7443(99)80064-7
Bhaskaran, R. K., & Sukumaran, S. K. (2016). An empirical study on the valuation of oil companies. OPEC Energy Review, 40(1), 91–108. https://doi.org/10.1111/opec.2016.40.issue-1
Bindemann, K. (1999). Production-sharing agreements: An economic analysis. WPM 25. Oxford: Oxford Institute for Energy Studies.
Boone, J. (2002). Revisiting the reportedly weak value relevance of oil and gas asset present values: The roles of measurement error, model misspecification, and time‐period idiosyncrasy. The Accounting Review, 77(1), 73–106. https://doi.org/10.2308/accr.2002.77.1.73
Boyer, M. M., & Filion, D. (2007). Common and fundamental factors in stock returns of Canadian oil and gas companies. Energy Economics, 29, 428–453. https://doi.org/10.1016/j.eneco.2005.12.003
Breusch, T. S. (1978). Testing for autocorrelation in dynamic linear models. Australian Economic Papers, 17, 334–355. https://doi.org/10.1111/j.1467-8454.1978.tb00635.x
Breusch, T. S., & Pagan, A. R. (1979). A simple test for heteroskedasticity and random coefficient variation. Econometrica, 47(5), 1287–1294. https://doi.org/10.2307/1911963
Bryant, L. (2003). Relative value relevance of the success efforts and full cost accounting methods in the oil and gas industry. Review of Accounting Studies, 8(1), 5–28. https://doi.org/10.1023/A:1022645521775
Canadian Securities Administrators. (2002a). National instrument 51–101: Standards of disclosure for oil and gas activities. Alberta: CSA.
Canadian Securities Administrators. (2002b). Companion policy 51–101: Standards of disclosure for oil and gas activities. Alberta: CSA.
Carhart, M. M. (1997). On persistence in mutual fund performance. The Journal of Finance, 52(1), 57–82. https://doi.org/10.1111/j.1540-6261.1997.tb03808.x
Chow, G. C. (1960). Tests of equality between sets of coefficients in two linear regressions. Econometrica, 28(3), 591–605. https://doi.org/10.2307/1910133
Clinch, G., & Magliolo, J. (1992). Market perceptions of reserve disclosures under SFAS No. 69. The Accounting Review, 67(October), 843–861.
Cormier, D., & Magnan, M. (2002). Performance reporting by oil and gas firms: Contractual and value implications. Journal of International Accounting, Auditing and Taxation, 11(2), 131–153. https://doi.org/10.1016/S1061-9518(02)00071-X
Dharan, B. G. (1984). Expectation models and potential information content of oil and gas reserve disclosures. The Accounting Review, 59(2), 199–217.
Dickey, D. A., & Fuller, W. A. (1979). Distribution of the estimators for autoregressive time series with a unit root. Journal of the American Statistical Association, 74(366), 427–431.
Doran, B. M., Collins, D., & Dhaliwal, D. (1988). The information of historical cost earnings relative to supplemental reserve-based accounting data in the extractive petroleum industry. The Accounting Review, 63(3), 389–413.
Exxon, M. (2013). Exxon Mobil Annual Report 2013.Erdõs, P. (2012). Have oil and gas prices got separated? Energy
Policy, 49, 707–718. https://doi.org/10.1016/j.enpol.2012.07.022
Fama, E. F., & French, K. R. (1993). Common risk factors in the returns on stocks and bonds. Journal of Financial Economics, 33(1), 3–56. https://doi.org/10.1016/0304-405X(93)90023-5
Fama, E. F., & French, K. R. (1996). Multifactor explanations of asset anomalies. The Journal of Finance, 51(1), 55–84. https://doi.org/10.1111/j.1540-6261.1996.tb05202.x
Financial Accounting Standards Board. (1982). Statement of financial accounting standards No. 69: Disclosures about oil and gas producing activities. Stamford, CT: FASB.
Financial Accounting Standards Board. (2009). Financial accounting codification topic 932: Extractive activities – oil and gas. Stamford, CT: FASB.
Financial Accounting Standards Board. (2010). Financial accounting series. accounting standards update. Extractive activities – oil and gas (Topic 932): Oil and gas reserves estimation and disclosures. An amendment of the FAB accounting standards codification. Stamford, CT: FASB.
Fitzgerald, T., & Rucker, R. R. (2016). US private oil and natural gas royalties: Estimates and policy relevance. OPEC Energy Review, 40(1), 3–25. https://doi.org/10.1111/opec.2016.40.issue-1
Ghicas, D., & Pastena, V. (1989). The acquisition value of oil and gas firms: The role of historical costs, reserve recognition accounting, and analysts’ appraisals. Contemporary Accounting Research, 6(1), 125–142. https://doi.org/10.1111/care.1989.6.issue-1
Page 16 of 17
Misund & Osmundsen, Cogent Economics & Finance (2017), 5: 1385443https://doi.org/10.1080/23322039.2017.1385443
Godfrey, L. G. (1978). Testing against general autoregressive and moving average error models when the regressors include lagged dependent variables. Econometrica, 46(6), 1293–1302. https://doi.org/10.2307/1913829
Gujarati, D. (1970a). Use of dummy variables in testing for equality between sets of coefficients in two linear regression: A note. American Statistician, 24(1), 50–52.
Gujarati, D. (1970b). Use of dummy variables in testing for equality between sets of coefficients in two linear regression: A generalization. American Statistician, 24(5), 18–21.
Harrell, D. R., & Gardner, T.L. (2005). Significant differences in proved reserves estimates using SPE/WPC definitions compared to United States Securities and Exchange Commission definitions. SPE Reservoir Evaluation & Engineering, December, 520–527. https://doi.org/10.2118/84145-PA
Harris, T. S., & Ohlson, J. A. (1987). Accounting disclosures and the market’s valuation of oil and gas properties. The Accounting Review, 62(4), 651–670.
Ikonnikova, S., Gülen, G., Browning, J., & Tinker, S. W. (2015). Profitability of shale gas drilling: A case study of the Fayetteville shale play. Energy, 81, 382–393. https://doi.org/10.1016/j.energy.2014.12.051
Jensen, M. C. (1986). Agency costs of free cash flow, corporate finance and takeovers. The American Economic Review, 76(2), 323–329.
Jensen, M. C. (1988). The takeover controversy: Analysis and evidence. In J. Coffee, L. Lowenstein, & S. Rose-Ackerman (Eds.), Knights, Raiders and Targets: The Impact of the Hostile Takeover (pp. 314–354). Oxford: Oxford University Press.
Kennedy, D., & Hyon, Y. (1992). Do RRA earnings improve the usefulness of reported earnings in reflecting the performance of oil and gas producing firms. Journal of Accounting, Auditing and Finance, 7, 335–356. https://doi.org/10.1177/0148558X9200700307
Kretzschmar, G. L., Misund, B., & Hatherly, D. (2007). Market risks and oilfield ownership—Refining oil and gas disclosures. Energy Policy, 35(11), 5909–5917. https://doi.org/10.1016/j.enpol.2007.06.007
Lintner, J. (1965). The valuation of risk assets and the selection of risky investments in stock portfolios and capital budgets. The Review of Economics and Statistics, 47(1), 13–37. https://doi.org/10.2307/1924119
Magliolo, J. (1986). Capital market analysis of reserve recognition accounting. Journal of Accounting Research, 24(Supplement), 69–108. https://doi.org/10.2307/2490730
McConnell, J., & Muscarella, C. (1985). Corporate capital expenditure decisions and the market value of the firm. Journal of Financial Economics, 14(3), 399–422. https://doi.org/10.1016/0304-405X(85)90006-6
Misund, B. (2015a). Reserves replacement and oil and gas company shareholder returns (Working Paper). Stavanger: University of Stavanger Business School.
Misund, B. (2015b). Accounting for oil and gas exploration activities: A triumph of economics over politics (Working Paper). Stavanger: University of Stavanger Business School.
Misund, B. (2016). Vertical integration and value-relevance: Empirical evidence from oil and gas producers. Cogent Economics & Finance, 4(1), 1–14.
Misund, B., Osmundsen, P., & Sikveland, M. (2015). International oil company valuation: The effect of accounting method and vertical integration. Petroleum Accounting and Financial Management Journal, 34(1), 1–20.
Misund, B., Asche, F., & Osmundsen, P. (2008). Industry upheaval and valuation: Empirical evidence from the international oil and gas industry. The International
Journal of Accounting, 43(4), 398–424. https://doi.org/10.1016/j.intacc.2008.09.007
Misund, B., & Osmundsen, P. (2015). The value-relevance of accounting figures in the oil and gas industry: Cash flows or accruals. Petroleum Accounting and Financial Management Journal, 34(2), 90–110.
Mitchell, J. (2004). Petroleum reserves in question. Oxford: Oxford Institute for Energy Studies.
Mossin, J. (1966). Equilibrium in a capital asset market. Econometrica, 34(4), 768–783. https://doi.org/10.2307/1910098
Oglend, A., Lindbäck, M., & Osmundsen, P. (2016). Shale gas boom affecting the relationship between LPG and oil prices. The Energy Journal, 37(1), 211–232.
Ohlson, J. A. (1995). Earnings, book values, and dividends in equity valuation. Contemporary Accounting Research, 11(2), 661–687. https://doi.org/10.1111/care.1995.11.issue-2
Osmundsen, K. M., Misund, B., & Asche, F. (2007). Is oil supply choked by financial market pressures? Energy Policy, 35(1), 467–474. https://doi.org/10.1016/j.enpol.2005.12.010
Osmundsen, P. (2010). Chasing reserves – incentives and ownership. In E. Bjørndal, M. Bjørndal, P.M. Pardalos, & M. Rönnqvist (Eds.), Energy, Natural Resource and Environmental Economics (pp. 19–39). Heidelberg: Springer-Verlag.
Osmundsen, P., Asche, F., Misund, B., & Mohn, K. (2006). Valuation of international oil companies. The Energy Journal, 27(3), 49–64.
Picchi, B. (1985). Structure of the U.S. oil industry: Past and future. New York, NY: Salomon Brothers (July).
Pindyck, R. S. (2003). Volatility in natural gas markets (Working Paper Center for Energy and Environmental Policy Research) MIT. Retrieved from http://hdl.handle.net/1721.1/45005
Pindyck, R. S. (2004). Volatility and commodity price dynamics. Journal of Futures Markets, 24, 1029–1047. https://doi.org/10.1002/(ISSN)1096-9934
Quirin, J. J., Berry, K. T., & O’Bryan, D. (2000). A fundamental analysis approach to oil and gas firm valuation. Journal of Business Finance & Accounting, 27(7&8), 785–820. https://doi.org/10.1111/jbfa.2000.27.issue-7&8
Sadorsky, P. (2001). Risk factors in stock returns of Canadian oil and gas companies. Energy Economics, 23, 17–28. https://doi.org/10.1016/S0140-9883(00)00072-4
Said, S. E., & Dickey, D. A. (1984). Testing for unit roots in autoregressive-moving average models of unknown order. Biometrika, 71, 599–607. https://doi.org/10.1093/biomet/71.3.599
Scholtens, B., & Wagenaar, R. (2011). Revisions of international firms’ energy reserves and the reaction of the stock market. Energy, 36(5), 3541–3546. https://doi.org/10.1016/j.energy.2011.03.060
Securities and Exchange Commission. (1978). Accounting series release no. 253. Washington, DC: SEC.
Securities and Exchange Commission. (1979). Accounting series release no. 269: Oil and gas producers – supplemental disclosures on the basis of reserve recognition accounting. Washington, DC: SEC.
Securities and Exchange Commission. (1981). Accounting series release no. 289. Washington, DC: SEC.
Securities and Exchange Commission. (2008). Modernization of oil and gas reporting requirements: The final rule. Washington: SEC.
Sevin, J., & Ortega, E. V. (2016). Realising EOR’s actual potential. OPEC Energy Review, 40(1), 26–35. https://doi.org/10.1111/opec.2016.40.issue-1
Sharpe, W. F. (1964). Capital asset prices: A theory of market equilibrium under conditions of risk. The Journal of Finance, 19(3), 425–442.

Page 17 of 17
Misund & Osmundsen, Cogent Economics & Finance (2017), 5: 1385443https://doi.org/10.1080/23322039.2017.1385443
© 2017 The Author(s). This open access article is distributed under a Creative Commons Attribution (CC-BY) 4.0 license.You are free to: Share — copy and redistribute the material in any medium or format Adapt — remix, transform, and build upon the material for any purpose, even commercially.The licensor cannot revoke these freedoms as long as you follow the license terms.
Under the following terms:Attribution — You must give appropriate credit, provide a link to the license, and indicate if changes were made. You may do so in any reasonable manner, but not in any way that suggests the licensor endorses you or your use. No additional restrictions You may not apply legal terms or technological measures that legally restrict others from doing anything the license permits.
Cogent Economics & Finance (ISSN: 2332-2039) is published by Cogent OA, part of Taylor & Francis Group. Publishing with Cogent OA ensures:• Immediate, universal access to your article on publication• High visibility and discoverability via the Cogent OA website as well as Taylor & Francis Online• Download and citation statistics for your article• Rapid online publication• Input from, and dialog with, expert editors and editorial boards• Retention of full copyright of your article• Guaranteed legacy preservation of your article• Discounts and waivers for authors in developing regionsSubmit your manuscript to a Cogent OA journal at www.CogentOA.com
Society of Petroleum Engineers (1997). Petroleum reserves definitions. Richardson, TX: SPE.
Society of Petroleum Engineers. (2011, November). Guidelines for application of the petroleum management system. Richardson, TX: SPE. Retrieved from http://www.spe.org/industry/docs/PRMS_Guidelines_Nov2011.pdf
Spear, N. A. (1994). The stock market reaction to the reserve quantity disclosures of U.S. oil and gas producers. Contemporary Accounting Research, 11(1), 381–404. https://doi.org/10.1111/care.1994.11.issue-1
Spear, N. A. (1996). The stock market reaction to the reserve-based value replacement measures of oil and gas
producers. Journal of Business, Finance and Accounting, 23(7), 953–974. https://doi.org/10.1111/jbfa.1996.23.issue-7
Teall, H. D. (1992). Information content of Canadian oil and gas companies' historic cost earnings and reserves disclosures. Contemporary Accounting Research, 8(2), 561–579. https://doi.org/10.1111/care.1992.8.issue-2
Wooldridge, J. M. (2002). Econometric analysis of cross-section and panel data. MIT Press.
Yergin, D. (2011, April 2). Stepping on the gas. The Wall Street Journal, The Saturday Essay.