valuation of minor international public company …
TRANSCRIPT

VALUATION OF MINOR INTERNATIONAL PUBLIC
COMPANY LIMITED
NATTAPON JEAMTHAVORN
A THEMATIC PAPER SUBMITTED IN PARTIAL
FULFILLMENT OF THE REQUIREMENTS FOR
THE DEGREE OF MASTER OF MANAGEMENT
COLLEGE OF MANAGEMENT
MAHIDOL UNIVERSITY
2015
COPYRIGHT OF MAHIDOL UNIVERSITY
Thematic paper
entitled
VALUATION OF MINOR INTERNATIONAL PUBLIC
COMPANY LIMITED
was submitted to the College of Management, Mahidol University
for the degree of Master of Management
on
January 24, 2015
………………………..…...………......
Mr. Nattapon Jeamthavorn
Candidate
....................................................... ..............................................................
Asst. Prof. Piyapas Tharavanij, Asst. Prof. Nareerat Taechapiroontong,
Ph.D. Ph.D.
Advisor Chairperson
....................................................... ..............................................................
Duangporn Arbhasil, Vasan Siraprapasiri,
Ph.D. M.Sc.
Dean Committee member
College of Management
Mahidol University

ii
ACKNOWLEDGEMENTS
I would like to take this opportunity to express my deep gratitude to Asst. Prof.
Dr. Nareerat Taechapiroontong, my research advisor, for her valuable advice and support
academically and morally. I would also like to thank Asst. Prof. Dr. Piyapas Tharavanij
for his insight and knowledge. My grateful appreciation is also extended to Ajarn Vasan
Siraprapasiri for providing knowledge and guidance in keeping my progress on schedule.
I respect Dr. Nareerat, Dr. Piyapas and Ajarn Vasan for their knowledge, dedication
and kindness for students. I am truly thankful from my heart.
Most importantly, I would like to thank my family and all family members
for their life-long support and encouragement in making this journey a success. I wish
to dedicate my profound recognition to my mother, Mrs. Udomluck Jeamthavorn for
her unconditional love, inspiration and guidance.
Nattapon Jeamthavorn

iii
VALUATION OF MINOR INTERNATIONAL PUBLIC COMPANY LIMITED
NATTAPON JEAMTHAVORN 5549223
M.M. (ENTREPRENEURSHIP MANAGEMENT)
THEMATIC PAPER ADVISORY COMMITTEE: ASST. PROF. PIYAPAS
THARAVANIJ, Ph.D., ASST. PROF. NAREERAT TAECHAPIROONTONG, Ph.D.,
VASAN SIRAPRAPASIRI, M.SC.
ABSTRACT
This paper provides a perspective on valuation studies by a Master Degree
student. Based on impressions from the Valuation and Investment class, I was inspired
by the example of successful and failure mergers and acquisition to debate how we see,
understand, and are inspired by the field of valuation studies. Using the classroom
experience as a springboard, I argue that the domain of valuation studies still relies
heavily on influences from the study of economics, with a strong emphasis on processes of
quantification and calculation. With apparent pragmatism within the field, the discounted
cash flow method is used to value the company, including other valuation method to
derived at the most appropriate result. Financial and economic reports also used to
develop assumptions together with consensus research to evaluate economics trend.
KEY WORDS: Valuation/ WACC/ Discounted Cash Flow/ FCFF
40 pages
iv
CONTENTS
Page
ACKNOWLEDGEMENTS ii
ABSTRACT iii
LIST OF TABLES vi
LIST OF FIGURES vii
CHAPTER I VALUATION 1
1.1 Company Highlight 1
1.2 Business Description 3
1.2.1 Hotel 3
1.2.2 Restaurant Chain 5
1.2.3 Retail Chain 5
1.3 Industry Overview and Competitive Positioning 6
1.3.1 Macro-Economic Analysis : Weak Domestic
Performance… but improving 6
1.3.2 Competitive Analysis 7
1.3.3 Power of diversification 9
1.4 Investment Summary 10
1.4.1 Cyclical Stock depending on economic trend and
holiday seasons 10
1.5 Valuation 12
1.5.1 Assumption for MINT Projected Cash Flow: 12
1.5.2 Expansion of new hotels and outlets: 12
1.5.3 Revenue Growth and Net Profit: 13
1.5.4 Terminal Value Assumption: 13
1.5.5 Capital Expenditure (CAPX): 14
1.5.6 Weight Average Cost of Capital (WACC): 14
1.5.7 Valuation Method Conclusion 14

v
CONTENTS (cont.)
Page
1.6 Downside Possibility 15
1.7 Investment Risks 15
CHAPTER II DATA 17
2.1 Company’s Information 17
2.2 SWOT Analysis 19
2.2.1 S (Strengths) 19
2.2.2 W (Weaknesses) 19
2.2.3 O (Opportunities) 20
2.2.4 T (Threats) 20
2.3 Porter’s 5 Forces 20
2.3.1 Competition in the Industry 20
2.3.2 Threat of New Entry 20
2.3.3 Threat of Substitution 21
2.3.4 Buyer Bargaining Power 21
2.3.5 Supplier Bargaining Power 21
2.4 Income Statement 22
2.5 Statement of Financial Position 23
2.6 Statement of Cash Flow 24
2.7 Key Financial Ratio 25
2.8 Free Cash Flow to Firm Model and Assumption 26
REFERENCES 28
BIOGRAPHY 29

vi
LIST OF TABLES
Table Page
1.1 Quarterly EPS and P/E Ratio 1
2.1 5-year Income Statement and Forecast 22
2.2 5-year Statement of Financial Position and Forecast 23
2.3 5-year Statement of Cash Flow and Forecast 24
2.4 Key Financial Ratio 25
2.5 Free Cash Flow to Firm Calculation 26
2.6 WACC Assumption 26
2.7 P/E Commerce 27
vii
LIST OF FIGURES
Figure Page
1.1 Hotel Improving Trend 2
1.2 MINT Revenue Contribution 4
1.3 Logo Companies 4
2.1 Business Structure 17
2.2 MINT Major Shareholders & Free float 17
2.3 Shareholding Structure & Return 18
2.4 Management Team 19
2.5 TRIS Company Rating 27

1
CHAPTER I
VALUATION
1.1 Company Highlight
Table 1.1 Quarterly EPS and P/E Ratio
Earnings per share Mar Jun Sep Year P/E Ratio
2010A 0.18 0.02 0.04 0.38 27.01
2011A 0.25 0.08 0.40 0.88 12.91
2012A 0.35 0.10 0.16 0.92 26.80
2013A 0.37 0.11 0.18 1.04 22.21
2014E 0.35 0.15 0.10 0.92 27.87*
Source: Stock Exchange of Thailand, Company, and Valuation Calculation (*trailing P/E)
Hotel in improving trend: In 3Q2014 system-wide revenue per available
room was flat due to the domestic political events and the renovations of three hotels
(Anantara Riverside, Anantara HuaHin and Avani Quy Nhon in Vietnam). As a result
of the martial law and coup in 3Q2014, Thailand major destinations, especially Bangkok
were most affected. However, oversea hotels, which the majority are Anantara hotels,
saw an increase in revenue per available room of 14% y-o-y. Having said that, Thai
hotels are still experiencing an improving trend in revenue growth month by month
throughout 3Q2014.

2
Figure 1.1 Hotel Improving Trend
Source: Company data
Expanding Real Estate Business: Revenue contribution of real estate business
account for 17% of total revenue from real estate and hotels. Part of the real estate business,
Anantara Vacation Club, which leverage on the renowned Anantara brand, is growing
to become another significant factor contributing to hotel and mixed-use business. On
the other hand, two residential projects expected to be launched at the end of 2014, and
one service suits to be completed in 2016. Additional residential club in Phuket soon
be announced and more in the pipeline will be added over the years.
Robust Restaurant Outlet Expansion: Revenue of restaurant business increased
by 11% y-o-y, primarily from the outlet expansion of 13%, as result net profit grew by
3%. MINT operates four main restaurants hubs, includes Thailand, Singapore, Australia
and China. The restaurant presence is now in 21 countries across the region, operating
owned, franchised and a combination of both business models. Company is continuously
looking for opportunities to expand, especially in the existing market which company
is currently operated.
Growth with Diversification: Q32014 net profit of thb 2.8 billion, an increase
of 9% y-o-y, largely contribute to the company’s diversification and international
expansion strategy, as strong performance of international operations soften the impact
of the slowdown in tourist arrival and domestic consumption in Thailand. Growth was
attributable to both hospitality and restaurant business.

3
1.2 Business Description
1.2.1 Hotel
The business was first established in 1978 under the name of Royal Garden
Resorts (RGR). The hotel is located in Pattaya and hotel now currently operates under
the name of Pattaya Marriott Resort & Spa. RGR was listed in the Stock Exchange of
Thailand (SET) in 1988 and three years later Minor Corporation (MINOR) was listed
in SET.
RGR entered into a joint venture to operate Mandara Spa (Thailand), which
was later acquired 100% by RGR and renamed M Spa International. In 2000 RGR
acquired the Regent, Bangkok, which was later rebranded to Four Season Bangkok in
2005.
In 2001, RGR took a leap in pursuit for a higher standard by rebranding its
exiting hotels with renowned international hotel chain and by introducing a new brand
“Anantara” to the market. The Royal Garden Village Hua Hin became The Anantara
Resort and Spa, the first hotel under RGR’s own 5-star hotel brand, Anantara. Royal
Garden Resort in Hua Hin and Pattaya were rebranded to Marriott Resort and Spa to
expand its relationship with Marriott International. JW Marriott Phuket Resort and Spa
was introduced during the same year. MFG launched The Pizza Company, as its own
Pizza brand. The following year, RGR together with Marriott International, opened the
Mariott Phuket Vacation Village. Couple years later, company launched The Extate
Samui, its first real estate development project in Samui.
The pursuit to expand of the luxury hotels portfolio continues. MINT
expansion oversea continued in 2007 to 2008, after company invested in 20% stake of
Serendib Hotel Limited in Sri Lanka, part of Hermas Group. Hermas is an operator of
four hotels in Sri Lanka, which including Serendib Hotel, Club Dolphin Hotel, Miami
Hotel and Sigiriya Hotel. Anantara also launched Anatara Saminyak, Bali Indonesia,
and the first hotel that under Anantara’s management contract. Acquisition continued
into Africa, after company acquired 50% of Elewana Afrika, a collection of luxury
lodges in Africa and soon rebranded to Elewana Collection.
4
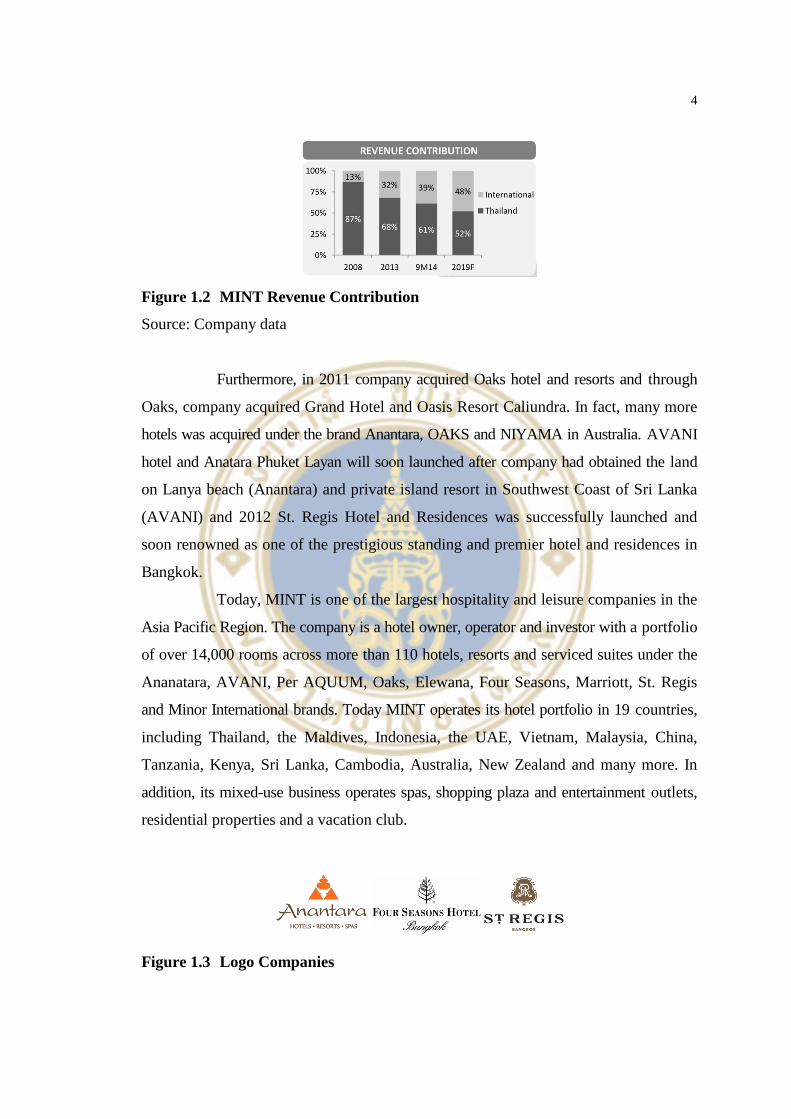
Figure 1.2 MINT Revenue Contribution
Source: Company data
Furthermore, in 2011 company acquired Oaks hotel and resorts and through
Oaks, company acquired Grand Hotel and Oasis Resort Caliundra. In fact, many more
hotels was acquired under the brand Anantara, OAKS and NIYAMA in Australia. AVANI
hotel and Anatara Phuket Layan will soon launched after company had obtained the land
on Lanya beach (Anantara) and private island resort in Southwest Coast of Sri Lanka
(AVANI) and 2012 St. Regis Hotel and Residences was successfully launched and
soon renowned as one of the prestigious standing and premier hotel and residences in
Bangkok.
Today, MINT is one of the largest hospitality and leisure companies in the
Asia Pacific Region. The company is a hotel owner, operator and investor with a portfolio
of over 14,000 rooms across more than 110 hotels, resorts and serviced suites under the
Ananatara, AVANI, Per AQUUM, Oaks, Elewana, Four Seasons, Marriott, St. Regis
and Minor International brands. Today MINT operates its hotel portfolio in 19 countries,
including Thailand, the Maldives, Indonesia, the UAE, Vietnam, Malaysia, China,
Tanzania, Kenya, Sri Lanka, Cambodia, Australia, New Zealand and many more. In
addition, its mixed-use business operates spas, shopping plaza and entertainment outlets,
residential properties and a vacation club.
Figure 1.3 Logo Companies
5
1.2.2 Restaurant Chain
Royal Food Group (MFG) was separately found in 1980, with the first Pizza
Hut restaurant in Thailand. Six years later MFG franchised Swensen’s from company
headquarter in San Francisco and developed into Thailand’s largest premium ice cream
brand. MFG soon launched restaurant under Sizzler brand and ice cream brand Dairy
Queen in 1992 and 1996 respectively., 2005 during the same year MFG was introduced
Burger King in Thailand.
RGR consolidated MFG operations into the company and open the first
international Pizza Company franchised restaurant in Kuwait in 2003. Couple years
later, RGR changed the name of the company to Minor International Pcl. (MINT), and
soon MFG was delisted from the Stock Exchange of Thailand. MINT expanded its
restaurant business into China through the opening of restaurant under two brands, The
Pizza Company and Sizzler, a year time it invested heavily to expand its food business,
by investing in S&P Syndicate, which company holds 31% stake in S&P.
More acquisitions was made in 2008 after company acquired 50% stakes
of The Coffee Club, the Australia’s largest homegrown café group and soon acquired
of Ribs and Rumps through Coffee Club in 2011. The acquisition continues in 2008 as
Thai Express was the next restaurant chain that company acquired after it bought 70% stakes
in the company. Today, MINT holds 100% stake in Thai Express. Beijing Riverside &
Courtyard was added into restaurant chain portfolio in 2012.
Today, MINT is one of Asia’s largest casual dining and quick-service
restaurant companies, operating over 1,500 outlets in 20 countries under well know
brans such as The Pizza Company, Thai Express, The Coffee Club, Ribs and Rumps,
Riverside, Swensen’s, Sizzler, Dairy Queen and Burger King.
1.2.3 Retail Chain
In 2009, MINT completed group business restructuring through consolidation
of Minor Corporate into the retail trading business. Today, company is one of Thailand’s
largest distributors of lifestyle brands with over 250 points of sale focusing primarily
on fashion and cosmetics. Brands on hand such as GAP, Esprit, Bossini, Charles & Keith,
Pedro, Tumi and many more.

6
1.3 Industry Overview and Competitive Positioning
1.3.1 Macro-Economic Analysis : Weak Domestic Performance… but
improving
In 2013, tourism in Thailand had hit the record-breaking in number of
international visitors, increased 20% to 27 million visitors, despite on going political
concerns in 4Q2014. International tourist arrivals brought in Bht 1.2 trillion in tourism
income, and increase of 19% over the prior year. However, number of visitors has decrease
dramatically over the last 6 months. Numbers of visitor in Thailand have been declined
due to two main reasons i) Politic uncertainty and ii) low traveling seasonal. There are
limited impact from coup and martial law in 2Q2014. Number of tourist is still expected
to increase over the next few years. The latest data from AOT suggested that international
passenger traffic growth in the first three weeks of October turned positive for the first
time in eight months (+2.3% y-o-y). An increase number of tourism based on the
assumption that this is the beginning of high season for tourism and benefits from the
regulation such as granting visa-free travel to Chinese and Taiwanese tourist, further
implementation on plans to attract tourist are also likely to be implement by the government.
Consumer confidence had been decreased since the end of 2013 caused by
political unrest in Thailand, but has been improved since the National Council for Peace
and Order (NCPO) took control. This affect how consumer feel about their spending
activities, MINT has seen the affect from the lost of consumer confidence through a
slowdown in domestic consumption in 2013. However, consumer confident has recovered
in 2Q2014 and 3Q2104, and it is likely to be stable in 4Q2014.
Domestic tourism also has a brighter future as tax cut on travel expenses
had been approved by government, hoping to boost tourism and consumption. Local
expenses for tour packages and hotels can be deducted from annual personal income to
a maximum amount of Bht 15,000 per person. In addition, travel expenses for training
and seminars for juristic persons can be deducted at no more than two times the actual
expenses incurred without a ceiling. This deduction will be effective from mid-Oct 2014
until at the end of 2015.
Government is expected to generate Bht 3bn of income from tourism operators.
This would be a positive effect for businesses in the tourism sector including MINT, as
7
the proposal should raise hotel occupancy from tourism, business training and seminar
event, as well as high consumption on food will likely to happen as consequence.
1.3.2 Competitive Analysis
Direct competitors for hotel industry are Central Plaza Hotel and Dusit Thani
group.
Hotel chains are expanding at a rapid rate in both domestic and around the
globe. Domestic expansion is due to an increase in number of tourist in Thailand and a
recovery from affect from the financial crisis that impacted tourism industry internationally.
MINT is likely to face high level of competition throughout prime location of Thailand
namely Bangkok, Chiang Mai, Phuket and Samui. Hotel chains such as Centara, Dusit
Thani and MINT had been well established all around Thailand, many hotels are owned
or managed by these hotel chains. A loosen in regulation and tax exemption for tourist,
will surely improve number of tourist. Tourism industry is expected to expand and to
find a quick recovery from the damage caused by political turmoil. Damage from political
unrest in Thailand forced hotels to be more aggressive in promotional campaign to stay
competitive. However, MINT had a very limited impact from this turmoil as company’s
hotel portfolio is well diversified in over many countries. Minor may also be facing
competition from a smaller or standalone hotel from a well-known hotel chain from
foreign countries, however, this has not been a real concern for MINT, as company
still believe that there is still a lot of demand to be fulfill and room in the market for
company to expand.
The Food Chain Industry (FCI) is expanding continuously due to the fact
that the majority of consumers have to work in the office far away from home. The
current ‘rush’ society and heavy traffic has left consumers with small amount of time
to cook at home. As a result people are more likely to eat out. Correspondingly, the
quick service food (QSF) has been made convenient to get, quick to cook and hygienic
at reasonable price, matching the demand and lifestyle of city people. Consumers’
behavior has helped increase the growth of the FCI. It covers the youngsters but also
families, children and working people. As a result, food chain restaurants have become
increasingly popular and mushroomed all over Thailand. As FCI has been continuously
growing, the competition is higher and higher. There are more players in the market,

8
invested by entrepreneurs in the food industry and non-food industries such as real estate,
logistics and consumer products based locally and internationally. Both local brand and
international brand are entering into this market. MINT currently held more than 26%
share of the Thai western casual dining restaurant market. Among our total outlets in
Thailand, 668 are company-owned while the remaining 342 outlets are franchised. Company
adopt an aggressive marketing and promotional campaign in efforts to increase traffic
and average spending per head, by capitalized on our ability to identify strategic locations
for expansion, both stand-alone outlets and within shopping malls, which in turn witnessed
sustained expansion by major retail mall operators and modern trades during the year.
1.3.3.1 Competition in Hotel Business
Currently MINT is operating in 3 main categories of business,
hotel, restaurant, and retail. Hotel business is accountable for roughly 50% of total revenue
generated, roughly 40% contributed by restaurant business and the remaining 10% through
a restaurant chain. Competitors in hotel business are classified by their hotel operation,
domestically and internationally. Each competitor both owned and managed hotel in
both domestic and in foreign countries. Hotel business rival in Thailand are Centara
(CENTEL)and Dusit Thani (DTC). Each company has started from operating a hotel in
Thailand, then expanded through owned hotel, managing, joint venture and acquisition
to become a renowned hotel operator internationally.
Dusit Thani is occupied in hospitality services, which include the operations
of owned hotels, hotel management services and franchise services. Dusit Thani provided
related business services through companies within the group. Flagship hotel of Dusit
Thani in Thailand is located in Bangkok, it is a first Dusit Thani hotel, a 5 star hotel
with 517 keys. In Thailand, Dusit Thani hotels are located Pattaya, Hua-Hin, Chiang
Mai Phuket and Korat. Today, Dusit Thani manages its hotel portfolio in 8 countries,
including China, Egypt, India, Kenya, Maldives, Philippines, U.A.E, and U.S.A.
Central Plaza Hotel was established by Chirathivat family. Centara is an
extension of a family business, a business that has been well established under the name
of Central department store. Today Centara manage and own upscale hotels around
Thailand and around the globe, including Vietnam, Indonesia, Sri Lanka, Maldives,
China, Manutius and Qatar. The company owns more than 15 hotels and resorts or

9
3,825 keys and managing more than 51 hotels and resorts or 9396 keys, both domestically
and internationally.
1.3.3.2 Competition in Restaurant Business
Main competitor in Quick Service Restaurant would be CENTEL.
Central Restaurants Group (CRG) operates and manages restaurant chains under CENTEL,
company owned and manage some of the renowned restaurant brands in the market.
Brand that are currently under the management of CENTEL such as, Mister Donut,
KFC, Cold Stone Creamery, Auntie Anne’s, OOTOYA, The Terrace and many more.
Restaurants are located throughout Bangkok and metropolitan area around Thailand.
MINT has been dominated in both restaurant and hotel business
for extensive period of time. Company’s restaurant chains business has been well
established in Thailand since 1980, brand like such as Four Season, St. Regis, Anantara,
and Marriot are renowned internationally. The company’s expansion strategy oversea
helps strengthening the company and adding competitive advantage on company’s network.
These factors have reflected on company’s performance, the measure of performance
shows in comparison with others companies through ROA, ROE and Net Profit Margin.
Pizza Hut (The Pizza Company), Sizzlers, Swensen’s, Berger
King and DairyQueen, have been well recognized in Thailand for more than a decade.
The company is considerably possitioned as one of the market leader in hotel business
in Thailand. Company’s portfolio of hotel chains in Thailand Company currently have
the largest revenue among competitors in the market, with an outstanding profit margin
and both returning on equity and returning on assets at 11.10%, 18.98% and 10.61%
respectively. MINT has considerably high solvency risk (debt ratio = 66% or D/E = 1.32
times). However, it’s liquidity ratio quite in an acceptable range (current ration = 0.97
times) and best among competitors. All the companies have negative Cash Conversion
Cycle (CCC), where Dusit (DTC) has the lowest CCC, follow by Centel and MINT (-5.29
days). Therefore, MINT shows a great performance among competitors, and a solid financial
condition.
1.3.3 Power of diversification
As of end of 3Q2014, MINT owns 38 and manages 70 hotels in 14 countries
with 13,128 rooms. Number of rooms in Thailand accounted for 28% of total rooms,

10
while the remaining 72% are located in every corner of the globe. In addition, MINT
had 1,568 restaurants, consisting of 52% from equity-owned outlets, which 65% of the
outlets are in Thailand, with the rest located in 20 different countries. Therefore, MINT
has implemented a solid diversification strategy in order to capture growth in the new
markets and more importantly a cushion against extraordinary events in one country or
in one city as in the case of Bangkok demonstration in 2013/2014. This strategy gave
company a more stable operating performance and smooth earning growth. International
hotel revenue accountable for 40% of total hotel revenue, whereas only 6% back in 2008,
and as at 3Q2014 contributed for 51%, which expected to increase to 56% by 2019F.
Thailand is still remain the main market for MINT restaurant chain, which mainly driven
by domestic consumption, the contribution to total revenue declined from 81% in 2008
to 70% in 2013, still only 30% contribution from international restaurant chain in 2013
and increased to 33% in 3Q2014, but it is projected to increase to 49% by 2019. This
will definitely added more cushion for restaurant business performance through company’s
diversification strategy.
1.4 Investment Summary
1.4.1 Cyclical Stock depending on economic trend and holiday seasons
The hotel business in Thailand is expected to fully recover in 4Q2014, domestic
political unrest in Thailand especially in Bangkok has seemed to be improving. Reservation
Per Available Room (RevPAR) of owned hotels in Thailand (in particular Bangkok hotels),
were impacted by the martial law and coup in the last few quarters, still Bangkok hotels
account for only 10% of total hotel & mixed-use revenues (5% of total MINT revenues).
The first three quarters Bangkok hotels RevPAR have dropped -40%, -36% and -27%
respectively, where hotels in Thailand provinces see a marginally year on year growth
in 1Q2014 and 2Q2014 at +3% and +1%, but declined by -4% in 3Q2014. Nevertheless,
Thai hotels are seeing improving trend in RevPAR growth month-by-month throughout
3Q2014. However, overseas hotels performed exceptionally well in 1Q2014 and 2Q2014
with +6% and +12% year on year growth, but -5% decreased in 3Q2014 due to the
11
introduction of new properties with lower RevPAR, which pull down the RevPAR average,
together with the renovation of Avani Quy Nhon in Vietnam.
Hotel expansion is expected to continue in 2015 through the implementation
of “Asset Right” strategy, which is a combination of “Asset Heavy” (owned and joint
venture) and “Asset Light” (management contracts), depending on circumstances and
opportunities. Owned hotels are projected to expand by 13% in 2015 and 2016, to total
of 3,537 rooms in 2016. Joint Venture projects are expected to expand up to 90% in
2015 from 1,263 rooms to 2,397 rooms but likely to be stable in 2016. Managed hotels
are expected to expand by 27% in 2015 (4,334 rooms) and 38% in 2016 (5,969 rooms).
These figures are projects that have been signed. The finalizations of on going due
diligence and new opportunities that come along the future have not been included.
Tourism market is likely to expand in normal economic situation. However, it
had suffered as a result of a strong economic slowdown in 2008-2009 and the outbreak
of H1N1 influenza virus. The tourism industry has fully recovered in 2012, with number
of international traveller brake the milestone of one billion tourists globally for the first
time in history. In 2013-2014 Europe and emerging market economies slowdown has
minimal impact on tourism market, as number of tourism still expanding, despite having
some regional interruption.
Revenue from restaurant business in the first 9 months of 2014 increased
11% year on year, mainly due to the 13% of the outlet expansion and net profit increased
by 3%. A smaller percentage increases of EBITDA and net profit margin mainly due
to a slowdown in domestic consumption, which lead to lower operation leverage resulting
from negative same-store-sales growth in 1Q2014 in Thailand and 3Q2104 in Singapore.
However, Restaurant in Thailand saw a turnaround in same-store-sales growth since
2Q2014 despite a weak operation environment in 1Q2014.
Currently, MINT operates four restaurant hubs: Thailand, Singapore, Australia
and China. MINT’s restaurant presence is now in 21 countries across the region. Restaurants
are operating owned, franchised and combination of both business models. The company
has been continuously expanding in the last five years, total revenue contribution from
international operation has grown from 19% in 2008 to 33% in 9M2014. MINT is
continuing its international expansion and increase the forecast of international revenue
contribute to 49% of total revenue by the end of 2019.
12
In 2015, domestic tourism is likely to be improved, as V shape recovery in
Thai economy is expected from it’s low in the first two quarters of 2014 and consumer
confidence should also be improved in 2015 as a result. Numbers show that restaurants
same-store-sales growth started to pick up since the 2Q2014, this shows that domestic
consumption and consumer confidence has recovered.
1.5 Valuation
1.5.1 Assumption for MINT Projected Cash Flow:
Revenue of hotel business grows with RevPAR growth and total number
of hotel rooms. Based on the assumption, MINT’s hotel business is expecting to see an
increase on revenue from an increase in total number of hotel rooms and an increase in
overall RevPAR (oversea and Thailand).
Revenue of restaurant business grows with total number of outlet and sales
growth. Sales growth can be separated into two scopes, Same-Store-Sales-Growth (SSSG)
and Total-System-Sales-Growth (TSSG). Higher the SSSG give business more operation
leverage and higher profit margin. Higher TSSS drives revenue to increase. MINT’s
restaurant business sees both increase in TSSS from an expansion in total number of
outlets and SSSG.
1.5.2 Expansion of new hotels and outlets:
3Q2014 total number of hotel rooms has increase 15% year-on-year, with
estimation of total room increase of 742 rooms will be added before the end of 2014, which
brings total number of room to 14,207 rooms. Hotel rooms system-wide expansion for
2015 and 2016 is estimated to increase by 35% and 14% respectively, the expansion
will be mainly through managed hotel and joint venture. This pipeline expansion figures
are based on the current singed deal only. Restaurant outlets has expanded 13% year-
on-year in 3Q2013 to total of 1,648 outlets and it is estimated to expand to 3,365 outlets
by 2019 or an annual growth rate of 15.35%, which will be mainly focus on an oversea
expansion.

13
According to the latest company data 9M2013, Revenue from Hotel & Mixed
Used is account for 48% of total revenue, Restaurant and Retail is account for 43% and
9% respectively. However, from the trend of the pipeline expansion, the forecast would
be that hotel & mixed used revenue contribution will likely to increase to approximately
51% of total revenue, or 45% from owned and manage hotel and 6% from real estate.
Where revenue generated by Restaurant and Retail accounts for 49% of total revenue,
or breakdown to 43% and 6% respectively.
1.5.3 Revenue Growth and Net Profit:
Revenue from hotel business is expected to pickup in the last quarter of
2014, as RevPAR in Thailand has shown a positive trend in the third quarter. International
expansion in 2014 will increase revenue from oversea and its contribution to total
revenue. The expansion of OAKS’ in Australia is expecting to bring a high revenue
for MINT in 2014 and 2015, with a consistent 70%+ occupancy rate, expectation of
the last quarter to generate a substantial revenue growth through a higher occupancy
rate and peak in average daily price (ADR). Projected revenues for 2014 and 2015 are
in line with exponential growth in both domestic and oversea market.
Restaurant business is expecting to recover in domestic market and will
show a positive SSSG again in the last quarter of 2014, 9M2014 revenue increased by
11% year-on-year despite the slowdown in domestic consumption which lead to lower
operating leverage and as a result a lower net profit margin. Projection for restaurant
business in the next two year will be a steady growth at 15% and 12% until 2018, primarily
from the outlet expansion and a turnaround of domestic consumption. Australia hub
performed extraordinarily well in 2013, although it contributes only 1% to MINT restaurant
business’s revenues but accounting for 13% to the total restaurant’s net profit. Coffee
Club (including Ribs and Rumps) achieving a 34% increases in net profit and account
for 9% of restaurant business’s net profit.
1.5.4 Terminal Value Assumption:
Assumption needed to be made in order to calculate the terminal value of
the company. Assumption made on perpetual growth at 3.5%, which might be lower than
the forecasts of the nominal GDP expected from many sources. I am being pessimistic

14
about the world economy, I believe that world economy will soon be facing another
dramatic economic slowdown, or in the other word, we are on the verge of another
financial crisis. Therefore, it would be safer approach to take a more conservative approach
to the perpetual growth.
1.5.5 Capital Expenditure (CAPX):
The expansion of both hotel and restaurant business, can be leverage through
restaurant franchising or hotel management contracts. Capital Expenditure is mainly
being use for the expansion of owned hotel, restaurant and joint venture. However, MINT
expected expansion would be mainly through management contracts and franchises.
1.5.6 Weight Average Cost of Capital (WACC):
CAPM model is being used to calculate cost of equity by using 10 year-
government bonds at the rate of 3.41% as at 08 Octorber 2014 from ThaiBMA. The
expected risk premium of 7.40% from Professor Aswath Damodaran website and the
adjusted beta of 1.181 from Bloomberg. Therefore, cost of equity for the company is
at 12.15%.
Cost of debt calculated by using Financial Cost in year 2013 divide by the
summation of 2012 and 2013, Short Term debt, Current Long Term Debt and Long
Term Debt, divided by 2. From the calculation of under this method, the cost of debt is
equal to 4.34%. WACC is equal to 7.12%
1.5.7 Valuation Method Conclusion
Forecasted free cash flow for the firm (FFCF) is being used for a valuation
as the model shows an intrinsic value of the firm and the model is suitable for long-term
investment and value orient investor. Value of the company will be increase from an
income that will be generated through the future expansion of hotel and restaurant chains,
therefore future cash flow will determine the actual value of the firm. Applying DCF
model to evaluate the firm (MINT), and we recommend “BUY” with a target price as
40.00 baht with the upside gain of 14.0% (current price at 35 baht, 23 January 2015).

15
1.6 Downside Possibility
Expansion falls short of the estimation: Uncertainty is the only certainty.
The following possibilities can be treated as the downside risk of the forecasted earning.
First, if MINT missed the estimation of the expansion of either restaurant or hotel
business. Second, an impact of slowdown in sales from decrease in RevPAR or SSSG
that affects operating leverage, which drive down the net profit. The second possibility
could be a result of a strong growth of existing competitor and new competitor entry
into the market or an uncertainty on political, breakout of a virus or natural disaster.
Note: Breakout of Ebora virus in Africa countries could get worsen and could
affect on number of tourist visiting MINT’s Africa hotels. This could have a directly
impact on RevPAR for hotel which could be in the area.
1.7 Investment Risks
Economic uncertainty domestically and internationally: There are many
uncertainties on current global politic situation and economy outlook in many regions,
conflict between Russia and U.S caused fluctuation on currencies. Europe may experiences
a flat growth for many years to come, as European economic situation has yet see the
sign of recovery if not worsen. However, a new round of Quantitative Easing is expected
to be implement by European Central Bank to fight a deflation.
Global crisis event cycle, global economy has enjoyed a growth and a recovery
stage for the last 4-6 years, from 2008 the financial crisis in U.S and 2010 in Europe.
The question would be, where is the next inflated bubble, when will it popped and
how it will impact the business?
Federal Reserve had tapered the latest round of Quantitative Easing and
considering for an interest rate hike. Fed adjusted its language about whether when it
will increase an interest rate, from “considerable time” to it will be “patient” in the latest
Federal Open Market Committee meeting. This might be a signal that, an increase in
interest rate may come sooner than what the market expected. Increase in an interest
rate will cause a change in the direction of fund flow, which is likely to be flowing
back U.S.

16
The volatility of currency is crucial to MINT’s earning, as MINT had
established nearly half of its business oversea and invested in foreign companies. An
appreciation or depreciation of Thai baht could affect MINT’s earning. However, businesses
that are established in foreign country, profit and loss will be determined in foreign
currency. Income and cash flow from foreign entity will then be translated into group
report currency at the weight average exchange rate.

17
CHAPTER II
DATA
2.1 Company’s Information
Figure 2.1 Business Structure
Source: Company data
Figure 2.2 MINT Major Shareholders & Free float
Source: SetSmart.

18
Figure 2.3 Shareholding Structure & Return

19
Figure 2.4 Management Team
Source: Company data
2.2 SWOT Analysis
2.2.1 S (Strengths)
Strong expertise in hotel management and restaurant chain business, in
both Thailand and internationally.
Well established restaurant and hotel brands in portfolio.
2.2.2 W (Weaknesses)
More than half of the revenue still from one country (Thailand).
The core businesses relied heavily on human resource.
Uncertainty on the new oversea acquisitions and its managements.

20
2.2.3 O (Opportunities)
Recovery in Thailand’s tourism industry.
Increasing in number of tourist in Thailand.
Hotel expansion oversea, both owns and managing.
2.2.4 T (Threats)
Political uncertainties and Natural disasters.
Slower growth in domestic consumption.
Extreme fluctuation in currency exchange market.
2.3 Porter’s 5 Forces
2.3.1 Competition in the Industry
Hotel and restaurant chain can be considered as a very highly competitive
industry. However, company with established brand can be consider as competitive
advantage within the industry. MINT’s brands are well established within Thailand
and oversea, Anatara(hotel), Swensen’s and Pizza Company(restaurant) in South East
Asia region and OAKS(hotel) and COFFEE CLUB(restaurant) in Australia, are few
examples of well established brands. Newly introduced brands are benefiting from the
knowhow of the management team in both domestic and oversea markets.
2.3.2 Threat of New Entry
Establishing a new hotel chains can be very difficult as it required a significant
amount of money and it would take a long period of time to be able to establish a brand
in the market. A new hotel chain entering into the market will not be significantly
affecting the current market shares of the company, as there are many hotel categories
and consumer segments in the market. Location wise can give each hotel a unique
advantage and limiting the effect of new competitors entering into the market.
Restaurant business can be extremely competitive and the cost of entry in
considerably low. However, it is not an easy task to establish a restaurant chain in the
market, especially the segments which company currently operating.

21
2.3.3 Threat of Substitution
In an era of technology company replacing many of traditional businesses.
Hotel market has been threaten by a newly established technology company called
AirBnB. It is the closest substitute that could be replacing a hotel. As mentioned, hotel
market can be separated into many segments and this new business model can only be
replacing partly of a certain segment of the market. Experience and services is still a
crucial factor in hotel business, it is not an easy element which can be easily duplicated.
2.3.4 Buyer Bargaining Power
Level of buyer bargaining power of hotels can be seasonal. In high season
buyer’s bargaining power tend to be lower than in low season, as there are higher demands
for hotel during the high season and rooms are likely to be short of supply. However,
buyer/customer still has considerably high bargaining power, because the switching
cost (to competitor) is low. Buyer bargaining power in restaurant business has a similarity
to hotel business, as bargaining power is varying depends on level of demand, with
low switching cost.
2.3.5 Supplier Bargaining Power
Minor owns a large hotel and restaurant chains, resulting in an economy of
scale. Which gives the company higher bargaining power over its supplier.

22
2.4 Income Statement
Table 2.1 5-year Income Statement and Forecast
Income Statement 2009 2010 2011 2012 2013 2014F 2015F 2016F 2017F 2018FREVENUES FROM SALE OF GOODS AND
RENDERING OF SERVICES 16,460.01 18,139.90 26,136.79 31,310.16 34,668.72 39,915.90 46,485.09 52,058.81 58,304.69 65,304.12
REVENUES FROM SALES (Restaurant + Retails) 10,575.48 12,270.40 13,633.45 15,135.30 17,391.43 19,461.85 22,021.83 24,706.87 27,719.30 31,099.02
REVENUES FROM SALES OF REAL ESTATE 00.00 00.00 2,820.83 2,898.52 3,319.88 2,656.00 3,187.20 3,462.69 3,761.99 4,087.16
REVENUES FROM RENDERING OF SERVICES 5,884.52 5,869.50 9,682.52 13,276.33 13,957.41 17,798.05 21,276.06 23,889.25 26,823.40 30,117.93
OTHER INCOME 662.13 732.80 1,931.25 1,237.05 1,737.61 1,929.44 2,142.44 2,378.95 2,641.58 2,933.20
INTEREST INCOME - - - 80.77 228.94
DIVIDEND INCOME 47.76 82.56 83.79 00.32 08.78
OTHER INCOMES - OTHERS 614.37 650.25 1,847.46 1,155.96 1,499.90
SHARES OF PROFITS FROM INVESTMENTS 168.65 216.54 263.81 446.30 529.90 493.49 574.71 643.61 720.83 807.37
TOTAL REVENUES 17,290.79 19,089.25 28,331.86 32,993.51 36,936.24 42,338.83 49,202.23 55,081.38 61,667.10 69,044.68COST OF SALE OF GOODS AND RENDERING OF
SERVICES 6,612.73 7,704.15 11,267.32 13,790.23 14,548.65 17,160.88 20,037.39 22,445.32 25,144.13 28,169.11
COST OF GOODS SOLD 3,946.59 4,835.10 5,351.75 5,995.54 6,638.74 7,541.97 8,534.02 9,574.55 10,741.94 12,051.67
COST OF SALES OF PROPERTY 00.00 00.00 1,332.39 1,195.00 968.44 1,041.44 1,249.73 1,357.75 1,475.11 1,602.62
COST OF RENDERING OF SERVICES 2,666.15 2,869.05 4,583.17 6,599.70 6,941.47 8,577.46 10,253.63 11,513.01 12,927.08 14,514.82
SELLING AND ADMINISTRATIVE EXPENSES 8,346.26 9,201.38 12,843.78 14,315.27 16,503.81 19,470.71 22,675.11 25,393.94 28,440.63 31,854.90
SELLING EXPENSES 6,741.91 6,988.44 9,501.03 10,394.83 12,051.52
ADMINISTRATIVE EXPENSES 1,604.35 2,212.94 3,342.75 3,920.44 4,452.30
OTHER EXPENSES 00.00 00.00 00.00 00.00 00.00
LOSS ON FOREIGN CURRENCY EXCHANGE 00.00 00.00 00.00 00.00 00.00
MANAGEMENT AND DIRECTORS' REMUNERATION 101.52 117.73 00.00 00.00 00.00
TOTAL EXPENSES 15,060.52 17,023.26 24,111.10 28,105.50 31,052.47 36,631.58 42,712.50 47,839.25 53,584.77 60,024.01
EBIT 2,230.27 2,065.99 4,220.76 4,888.01 5,883.77 5,707.25 6,489.73 7,242.13 8,082.34 9,020.67
FINANCE COSTS 428.71 458.08 879.40 1,085.38 1,027.10 1,025.54 1,025.54 1,025.54 1,025.54 1,025.54
EBT 1,801.56 1,607.91 3,341.36 3,802.63 4,856.67 4,681.71 5,464.19 6,216.59 7,056.80 7,995.13
INCOME TAX EXPENSES 305.77 291.07 414.53 392.57 675.09 936.34 1,092.84 1,243.32 1,411.36 1,599.03
NET PROFIT (LOSS) 1,495.79 1,316.84 2,926.83 3,410.05 4,181.58 3,745.36 4,371.35 4,973.27 5,645.44 6,396.10PROFIT (LOSS) ATTRIBUTABLE TO MINORITY
INTEREST 95.47 75.74 46.69 01.50 80.20 71.83 83.84 95.38 108.27 122.67NET PROFIT (LOSS) ATTRIBUTABLE TO EQUITY
HOLDERS OF THE PARENT 1,400.32 1,241.10 2,880.14 3,408.55 4,101.38 3,673.53 4,287.52 4,877.89 5,537.17 6,273.43
EBITDA 3,710.00 3,595.50 6,197.29 7,117.59 8,301.86 8,521.01 9,256.22 9,995.53 10,721.84 11,548.35
BASIC EARNINGS PER SHARE (UNIT : BAHT) 00.00 00.00 00.00 00.00 00.00
Dividend per share 00.00 00.00 00.00 00.00 00.00
00.00 00.00 00.00 00.00 00.00
DILUTED EARNINGS PER SHARE (UNIT : BAHT) 00.00 00.00 00.00 00.00 00.00 00.00 00.00 00.00 00.00 00.00
DIVIDEND PAID -1,053.63 -581.12 -502.80 -498.87 -1,191.90 -1,260.95 -1,471.71 -1,674.35 -1,900.65 -2,153.38

23
2.5 Statement of Financial Position
Table 2.2 5-year Statement of Financial Position and Forecast
2009 2010 2011 2012 2013 2014F 2015F 2016F 2017F 2018F
CASH AND CASH EQUIVALENTS 968.82 1,156.28 1,145.78 3,702.39 3,370.48 5,146.34 3,835.22 4,677.37 7,768.78 11,174.64
Account Receivables (Debtors) 1,000.23 1,047.37 2,739.26 2,954.82 3,331.51 3,303.27 3,846.91 4,308.16 4,825.05 5,404.29
INVENTORIES 1,239.80 3,488.13 3,061.77 2,662.68 3,114.34 3,802.50 4,302.68 4,827.29 5,415.87 6,076.20
OTHER SHORT-TERM ACCOUNT RECEIVABLES - NET 65.27 00.00 00.00 00.00 00.00
OTHER CURRENT ASSETS 1,642.64 1,155.36 659.87 941.06 815.84 763.14 713.85 667.74 624.61 584.27
TOTAL CURRENT ASSETS 4,916.75 6,847.14 7,606.68 10,260.96 10,632.17 13,015.25 12,698.65 14,480.56 18,634.30 23,239.40
INVESTMENT IN ASSOCIATES JOINT VENTURES 1,353.10 1,535.86 3,925.13 4,211.04 4,998.70 6,570.61 8,636.82 11,352.78 11,352.78 11,352.78
PROPERTY, PLANT AND EQUIPMENTS - NET 14,064.36 10,838.78 17,137.37 18,189.03 21,744.64 22,831.88 23,973.47 25,172.14 26,430.75 27,752.29
Other Non-Current (LT) Assets 7,936.62 13,564.40 12,196.02 18,313.95 22,560.75 22,560.75 22,560.75 22,560.75 22,560.75 22,560.75
TOTAL NON-CURRENT ASSETS 23,354.07 25,939.03 33,258.52 40,714.03 49,304.09 51,963.23 55,171.04 59,085.68 60,344.28 61,665.82
TOTAL ASSETS 28,270.82 32,786.17 40,865.20 50,974.98 59,936.27 64,978.49 67,869.69 73,566.24 78,978.58 84,905.22
ST Debt 683.34 576.81 1,097.35 910.38 970.96 970.96 970.96 970.96 970.96 970.96
Account Payables (Creditor) 1,201.37 1,114.49 3,992.36 4,639.86 4,997.77 4,669.98 5,452.77 6,108.04 6,842.46 7,665.65
TOTAL OTHER CURRENT LIABILITIES 4,792.72 4,367.34 3,497.02 3,389.08 4,989.74 4,989.74 4,989.74 4,989.74 4,989.74 4,989.74
OTHER SHORT-TERM ACCOUNT PAYABLES - NET 29.17 00.00 00.00 00.00 00.00
CURRENT PORTION OF LONG-TERM LIABILITIES 1,810.02 1,555.02 2,363.40 2,360.18 3,624.27 3,624.27 3,624.27 3,624.27 3,624.27 3,624.27
LONG-TERM BORROWINGS FROM FINANCIAL INSTITUTIONS 535.02 555.02 382.16 295.31 00.00
LONG-TERM BORROWINGS FROM OTHER PARTIES - - - - 1,539.83
FINANCE LEASE LIABILITIES - - 141.24 64.87 24.44
DEBENTURES AND DEBT CERTIFICATES 1,275.00 1,000.00 1,840.00 2,000.00 2,060.00
OTHER LONG-TERM LIABILITIES - - - - -
CURRENT PORTION OF DEFERRED INCOME 32.18 27.50 42.67 68.80 72.11 72.11 72.11 72.11 72.11 72.11
OTHER CURRENT LIABILITIES 2,921.34 2,784.81 1,090.94 960.11 1,293.36 1,293.36 1,293.36 1,293.36 1,293.36 1,293.36
CORPORATE INCOME TAX PAYABLE 198.62 156.61 210.16 183.34 384.46
ACCRUED EXPENSE 858.15 957.16 - - -
OTHER CURRENT LIABILITIES - OTHERS 1,864.58 1,671.04 880.78 776.77 908.89
TOTAL CURRENT LIABILITIES 6,677.42 6,058.64 8,586.73 8,939.33 10,958.46 10,630.68 11,413.46 12,068.73 12,803.16 13,626.35
LT Debt 9,036.55 12,235.86 16,363.36 20,892.24 18,602.40 18,602.40 18,602.40 18,602.40 18,602.40 18,602.40
LONG-TERM BORROWINGS FROM FINANCIAL INSTITUTIONS 2,136.55 2,335.86 5,923.30 6,497.32 00.00
LONG-TERM BORROWINGS FROM OTHER PARTIES - - - - 6,290.98
FINANCE LEASE LIABILITIES - - 80.06 34.91 11.42
DEBENTURES AND DEBT CERTIFICATES 6,900.00 9,900.00 10,360.00 14,360.00 12,300.00
Other LT Liability 502.61 685.77 980.61 1,796.89 3,500.73 3,500.73 3,500.73 3,500.73 3,500.73 3,500.73NET OF CURRENT PORTION OF POST EMPLOYEE BENEFIT
OBLIGATIONS 167.07 117.34 151.39 179.78 200.73
DEFERRED TAX LIABILITIES - - - - 2,100.14
OTHER NON-CURRENT LIABILITIES 335.54 568.43 829.22 1,617.11 1,199.86 00.00 00.00 00.00 00.00 00.00
TOTAL NON-CURRENT LIABILITIES 9,539.16 12,921.63 17,343.97 22,689.13 22,103.13 22,103.13 22,103.13 22,103.13 22,103.13 22,103.13
TOTAL LIABILITIES 16,216.58 18,980.27 25,930.70 31,628.45 33,061.60 32,733.81 33,516.60 34,171.87 34,906.29 35,729.48
ISSUED AND FULLY PAID-UP SHARE CAPITAL 3,246.42 3,262.34 3,275.22 3,686.77 4,001.36 4,001.36 4,001.36 4,001.36 4,001.36 4,001.36
PREMIUM (DISCOUNT) ON SHARE CAPITAL 3,065.86 3,133.79 3,215.33 3,995.90 7,331.86 7,331.86 7,331.86 7,331.86 7,331.86 7,331.86
RETAINED EARNINGS (DEFICIT) 5,635.34 6,388.29 8,728.17 11,314.66 13,964.22 16,376.80 19,192.61 22,396.15 26,032.66 30,152.71TREASURY SHARES / SHARES OF THE COMPANY HELD BY
SUBSIDIARIES - - - - -
OTHER COMPONENTS OF EQUITY -795.59 139.65 -851.37 -863.93 -207.03
Shareholder's Equity 11,152.03 12,924.08 14,367.35 18,133.39 25,090.41 27,710.02 30,525.83 33,729.36 37,365.88 41,485.93
Minority Interest 902.22 881.82 567.16 1,213.13 1,784.26 1,784.26 1,784.26 1,784.26 1,784.26 1,784.26
TOTAL EQUITY 12,054.24 13,805.90 14,934.51 19,346.53 26,874.67 32,263.43 34,393.08 39,458.17 44,162.81 49,296.24
Total Liability and Equity 28,270.82 32,786.17 40,865.20 50,974.98 59,936.27 64,997.25 67,909.68 73,630.04 79,069.10 85,025.72

24
2.6 Statement of Cash Flow
Table 2.3 5-year Statement of Cash Flow and Forecast
2009 2010 2011 2012 2013 2014F 2015F 2016F 2017F 2018F
PROFIT (LOSS) BEFORE FINANCIAL COSTS AND/OR INCOME TAX EXPENSES 1,801.56 1,607.91 3,341.36 3,802.63 4,856.67 4,681.71 5,464.19 6,216.59 7,056.80 7,995.13
DEPRECIATION AND AMORTISATION 1,575.20 1,605.25 2,023.22 2,231.09 2,498.29 2,885.59 2,850.32 2,848.78 2,747.77 2,650.35
Change in NOWC 247.51 148.43 -207.55 794.03 606.80 -987.70 -261.03 -330.60 -371.03 -416.40
FINANCE COSTS 428.71 458.08 879.40 1,085.38 1,027.10 1,025.54 1,025.54 1,025.54 1,025.54 1,025.54
OTHER RECONCILIATION ITEMS -137.34 -96.64 -202.80 -116.67 -446.03
CASH FLOWS FROM (USED IN) OPERATIONS 3,606.01 3,339.90 4,837.80 6,563.25 7,437.56 8,592.84 9,340.06 10,090.91 10,830.11 11,671.02
(INCREASE) DECREASE IN OPERATING ASSETS -192.01 -197.38 -08.42 -1,347.78 -1,846.70 -607.22 -994.52 -939.76 -1,062.33 -1,199.24
(INCREASE) DECREASE IN Receivables -175.48 28.56 -596.44 -573.86 -165.20 28.25 -543.64 -461.26 -516.88 -579.24
(INCREASE) DECREASE IN INVENTORIES 84.62 -212.97 626.77 646.86 200.70 -688.16 -500.17 -524.61 -588.58 -660.34
(INCREASE) DECREASE IN OTHER CURRENT ASSETS -101.15 -12.98 -38.75 -179.44 -153.49 52.70 49.29 46.11 43.13 40.34
(INCREASE) DECREASE IN OTHER NON-CURRENT ASSETS - - - -1,241.34 -1,728.71 00.00 00.00 00.00 00.00 00.00
INCREASE (DECREASE) IN OPERATING LIABILITIES 205.99 203.09 419.85 417.52 900.88 -327.78 782.78 655.27 734.43 823.19
INCREASE (DECREASE) IN Account Payables 114.39 -19.35 416.22 476.85 444.13 -327.78 782.78 655.27 734.43 823.19
INCREASE (DECREASE) IN OTHER CURRENT LIABILITIES 95.88 238.42 -88.57 -105.91 198.06 00.00 00.00 00.00 00.00 00.00
INCREASE (DECREASE) IN OTHER NON-CURRENT LIABILITIES -04.28 -15.98 92.20 46.58 258.69 00.00 00.00 00.00 00.00 00.00
CASH GENERATED FROM OPERATIONS 3,619.99 3,345.61 5,249.23 5,632.99 6,491.74 7,657.84 9,128.32 9,806.42 10,502.21 11,294.97
INTEREST PAID -366.69 -448.12 -827.61 -1,077.37 -1,030.06 -1,025.54 -1,025.54 -1,025.54 -1,025.54 -1,025.54
INCOME TAX PAID -458.16 -357.31 -608.22 -509.78 -280.73 -936.34 -1,092.84 -1,243.32 -1,411.36 -1,599.03
NET CASH PROVIDED BY (USED IN) OPERATING ACTIVITIES 2,795.14 2,540.18 3,813.40 4,045.83 5,180.95 5,695.95 7,009.94 7,537.56 8,065.31 8,670.40
CAPEX -2,528.01 -4,309.39 -2,796.07 -4,355.99 -4,452.47 -1,087.23 -4,783.14 -2,305.10 -3,073.25 -3,111.15
(INCREASE) DECREASE IN PROPERTY, PLANT AND EQUIPMENTS -2,463.06 -4,236.39 -2,768.58 -4,055.43 -4,110.18 -1,087.23 -1,141.59 -1,198.67 -1,258.61 -1,321.54
(INCREASE) DECREASE IN LONG0TERM INVESTMENTS -64.95 -73.01 -27.48 -300.56 -342.29 -3,641.55 -1,106.42 -1,814.64 -1,789.61
(INCREASE) DECREASE IN INVESTMENT IN SUBSIDIARIES AND ASSOCIATES -299.91 -1,007.52 -3,439.21 -1,387.13 -1,708.28 -1,571.91 -2,066.21 -2,715.96 00.00 00.00
NET CASH PROVIDED BY (USED IN) INVESTING ACTIVITIES -3,010.52 -4,752.77 -6,538.56 -6,329.05 -6,973.60 -2,659.14 -6,849.36 -5,021.06 -3,073.25 -3,111.15
DIVIDEND PAID -1,053.63 -581.12 -502.80 -498.87 -1,191.90 -1,260.95 -1,471.71 -1,674.35 -1,900.65 -2,153.38
OTHER ITEMS - - - 09.67 35.44
NET CASH PROVIDED BY (USED IN) FINANCING ACTIVITIES -160.47 2,412.63 2,669.79 4,834.11 1,444.91 -1,260.95 -1,471.71 -1,674.35 -1,900.65 -2,153.38
OTHER ITEMS - - - - -
NET INCREASE (DECREASE) IN CASH AND CASH EQUIVALENT -375.85 200.05 -55.37 2,550.89 -347.74 1,775.86 -1,311.12 842.15 3,091.41 3,405.87
EFFECT OF EXCHANGE RATE CHANGES ON CASH AND CASH EQUIVALENTS -04.04 -14.63 39.79 01.22 18.37
CASH AND CASH EQUIVALENTS, BEGINNING BALANCE 1,349.17 968.82 1,156.28 1,145.78 3,702.39 3,370.48 5,146.34 3,835.22 4,677.37 7,768.78
CASH AND CASH EQUIVALENTS, ENDING BALANCE 968.82 1,156.28 1,145.78 3,702.39 3,370.48 5,146.34 3,835.22 4,677.37 7,768.78 11,174.64

25
2.7 Key Financial Ratio
Table 2.4 Key Financial Ratio
Key Financial Ratio 2009A 2010A 2011A 2012A 2013A 2014F 2015F 2016F 2017F 2018F
Liquidity Ratio
Current Ratio (x) 0.736 1.130 0.886 1.148 0.970 1.224 1.113 1.200 1.455 1.705
Quick Ratio (x) 0.295 0.364 0.452 0.745 0.612 0.795 0.673 0.745 0.984 1.217
Cash Ratio (x) 0.145 0.191 0.133 0.414 0.308 0.484 0.336 0.388 0.607 0.820
Efficiency Ratio
Total Asset Turnover (x) 0.62 0.59 0.71 0.68 0.63 0.64 0.70 0.74 0.76 0.80
Fixed Asset Turnover (x) 1.23 1.46 1.87 1.77 1.74 1.79 1.99 2.12 2.26 2.41
Acc Receivable Turnover (x) 22.15 17.72 13.80 11.00 11.03 12.03 13.00 12.77 12.77 12.77
Collection Period (days) 16.48 20.60 26.44 33.19 33.09 30.33 28.07 28.59 28.59 28.59
Inventory Turnover (x) 5.93 3.26 3.44 4.82 5.04 4.96 4.94 4.92 4.91 4.90
Days in Inventory (days) 61.51 112.00 106.09 75.76 72.47 73.56 73.82 74.23 74.35 74.45
Payables Turnover (x) 6.69 8.60 4.25 3.10 3.11 3.69 4.06 3.97 3.97 3.97
Payables Period (days) 54.53 42.47 85.97 117.64 117.26 98.85 89.95 91.85 91.85 91.84
Cash Coversion Cycle (days) 23.46 90.13 46.56 (8.70) (11.70) 5.04 11.94 10.97 11.09 11.20
Profitability Ratio
Gross Profit Margin (%) 62% 60% 60% 58% 61% 59% 59% 59% 59% 59%
EBIT Margin (%) 13% 11% 15% 15% 16% 13% 13% 13% 13% 13%
EBITDA Margin (%) 22% 19% 22% 22% 23% 20% 19% 18% 18% 17%
Net Profit Margin (%) 9% 7% 10% 10% 11% 9% 9% 9% 9% 9%
ROA (%) 6% 4% 8% 7% 8% 6% 7% 7% 7% 8%
ROE (%) 12% 10% 20% 18% 16% 12% 13% 13% 13% 13%
SG&A/Sale 51% 51% 49% 46% 48% 49% 49% 49% 49% 49%
Solvency Ratio
Debt Ratio (%) 57% 58% 63% 62% 55% 50% 49% 46% 44% 42%
Debt to Equity Ratio (x) 1.35 1.37 1.74 1.63 1.23 1.01 0.97 0.87 0.79 0.72
Equity Multiply (x) 2.35 2.37 2.74 2.63 2.23 2.01 1.97 1.86 1.79 1.72
Long Term Debt Ratio (%) 0.34 0.39 0.42 0.45 0.37 0.34 0.33 0.30 0.28 0.26
Interest Coverage Ratio (x) 5.20 4.51 4.80 4.50 5.73 5.57 6.33 7.06 7.88 8.80

26
2.8 Free Cash Flow to Firm Model and Assumption
Table 2.5 Free Cash Flow to Firm Calculation
Table 2.6 WACC Assumption
Equity risk premium based on Professor Aswath Damadoran’s estimation
because we believe that the market risk premium of 7.10% applied by Bloomberg is
quite low for Thai Equity Market during the uncertainty economic situation. However,
Professor Aswath’s estimation has much stronger mathematical proved and more valid
in our point of view.
Free Cash Flow to Firm 2013 2014F 2015F 2016F 2017F 2018F
EBIT Total expenses 5,707,247 6,489,733 7,242,129 8,082,340 9,020,671
Tax on EBIT (1,141,449) (1,297,947) (1,448,426) (1,616,468) (1,804,134)
NOPAT (Net operation profit after taxes) 4,565,797 5,191,787 5,793,703 6,465,872 7,216,537
Add: Depreciation 2,885,595 2,850,323 2,848,784 2,747,774 2,650,346
+/- Change in net working capital (987,702) (261,028) (330,600) (371,030) (416,395)
+/- Investment in gross fixed asset (1,087,232) (1,141,594) (1,198,674) (1,258,607) (1,321,538)
Free cash flow to firm 5,376,458 6,639,488 7,113,214 7,584,009 8,128,950
Terminal value of firm 232,625,199
Net cash flow 5,376,458 6,639,488 7,113,214 7,584,009 240,754,149
Enterprise value 193,074,949
Value of debt 32,733,813
Value of equity 160,341,137
Share price (THB) 40.07
Net working capital (987,702) (261,028) (330,600) (371,030) (416,395)
Discount rate 7.12%
Growth 3.50% Based on assumption made
Weight Average Cost of Capital
Risk-free rate (Rf) 3.41% 10-year Government Bond (Source: Thai BMA) (8/10/2014)
Risk premium (Rm - Rf) 7.40% Based on Moody's rating and adjusted by the relative equity market volatility (Source: Damodaran)
Adjusted Beta (b) 1.181 Based on Bloomberg adjusted BETA
CAPM (Ks) 12.15%
Cost of debt (Kd) 4.34%
Risk-free rate (Rf) 3.41% 10-year Government Bond (Source: Thai BMA) (8/10/2014)
Country default spread 1.60% Based on Moody's rating and adjusted by the relative equity market volatility (Source: Damodaran)
Company Default spread (A+) 2.38% Tris rating and Thai BMA for 4 years bond (Debenture term of the Company is normally 3-4 years)
Cost of debt (Kd) 7.39%
Value of debt (Million Baht) 32,733,813 Long-term debt as of December 31, 2013
Value of equity (Million Baht) 32,263,433 Equity as of December 31, 2013
Weight of Debt (Wd) 57.98% Market value of long-term debt
Weight of Equity (We) 42.02% Market value of the equity
WACC 7.12%

27
Table 2.7 P/E Commerce
Figure 2.5 TRIS Company Rating
P/E Ratio
Price as of 27 Oct 2014 (Baht) a 34.50
EPS of last 4 quarter Q3'13 - Q2'14 (Baht) b 1.24
P/E MINT as of 27 Oct 2014 (time) c = a / b 27.87
P/E food and beverage index (time) d 22.23
P/E tourism and leisure index (time) d 44.13
Share price F&B (Baht) e = b x d 27.52
Share Price T&L (Baht) e = b x d 54.63
Earning Q2'14 Earning Q1'14 Earning Q4'13 Earning Q3'13 12-mth Earnings
Net Profit (Million Baht) 618,346 1,702,336 1,905,576 727,394
No. of share (share) 4,001,360 4,001,360 4,001,360 4,001,360
Earnings per share 0.15 0.43 0.48 0.18 1.24

28
REFERENCES
Bank of Thailand. (n.d.). Homepage on the internet. Retrieved from: www.bot.or.th/
English/Pages/default.aspx.
Bloomberg Analysis. (n.d.). Retrieved from www.bloomberg.com/asia.
E-Finance Thai Analysis and Reporting Tool. (n.d.). Retrieved from: www.e-financethai.
com.
MINOR INTERNATIONAL PCL. (n.d.). Homepage on the internet. Retrieved from:
www.minorinternational.com.
Reuters Financial Analysis. (n.d.). Minor International PCL (MINT.BK). Retrieved
from www.reuters.com/finance/stocks/financialHighlights?symbol=MINT.BK.
SET. (n.d.). Retrieved from: www.set.or.th/set/mainpage.do?language=th&country=TH.
SETSMART -SET Market Analysis and Reporting Tool. (n.d.). Homepage on the internet.
Retrieved from: www.setsmart.com/ism/login.jsp.
Thai Bond Market Association. (n.d.). Homepage on the internet. Retrieved from:
www.thaibma.or.th/.
The Securities and Exchange Commission. (n.d.). Homepage on the internet. Retrieved
from: www.sec.or.th/EN/Pages/Home.aspx.
World Bank. (n.d.). Homepage on the internet. Retrieved from: www.worldbank.org.
29
BIOGRAPHY
NAME Mr. Nattapon Jeamthavorn
DATE OF BIRTH 18/11/1987
PLACE OF BIRTH Bangkok, Thailand
INSTITUTE ATTENDED Australia Bachelor of Marketing
University of Technology Sydney, 2012
Master of Management,
Mahidol University, 2017
RESEARCH GRANT -
HOME ADDRESS 504/231 Evergreen city Bangkhae
Bangkok 10160
Tel. +66 8 00656555
Email: [email protected]
EMPLOYMENT ADDRESS -
PUBLICATION/ PRESENTATION -