validation of hv electrical systems
TRANSCRIPT
01
The ChallengeThe validation of the HV on-board network puts very high requirements on the sampling rate, HV safety and scalabil-ity of the measurement system used. To ensure that all HV components operate in their specified voltage range in all conceivable driving situations, the entire HV electrical sys-tem is instrumented and measured at numerous points. To detect and quantify effects such as voltage spikes due to line inductances, abrupt load changes or coupling capac-itances of the fast switching processes in the power elec-tronics, these measurements require a very high sampling rate. For an analysis of the cause of the error, all measure-ments must be time-synchronized and cannot come from different, uncoupled measurement systems. In addition to the different vehicle buses, the control units in the vehicle also provide relevant and important information for valida-tion, which is why they also need to be measured synchro-nously and included in the evaluation of overall perfor-mance.
The overall system consists of components that are devel-oped in parallel by different suppliers or development de-partments. Such components for the HV electrical system include electric motor, battery, inverter, on-board charger, electric heater, coolant pump and DC / DC converter. Both the components themselves as well as the entire system must be verified and validated. This happens in the early stages of development through simulation and at the test bench. The final release, however, can only be tested in the real environment of the component or system under test.
The electrical system of an electric vehicle is much more complex than that of a conventional vehicle due to the two DC grids and the associated DC / DC converter. The design and characteristic of the powertrain, the charging components and the HV consumers have completely differ-ent requirements, which vary from vehicle to vehicle. Here, on-board network topology, voltage levels on the LV side and HV side (up to 800 V), as well as requirements for load and dynamics vary from vehicle to vehicle.
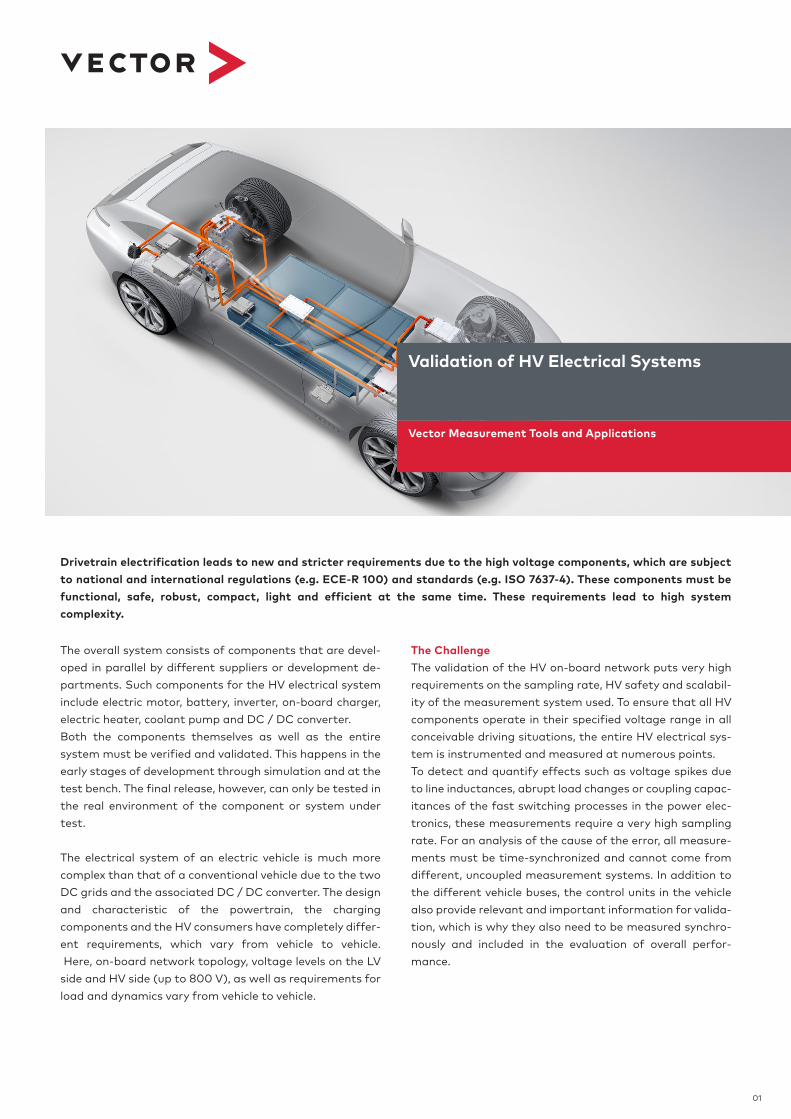
Drivetrain electrification leads to new and stricter requirements due to the high voltage components, which are subject to national and international regulations (e.g. ECE-R 100) and standards (e.g. ISO 7637-4). These components must be functional, safe, robust, compact, light and efficient at the same time. These requirements lead to high system complexity.
Vector Measurement Tools and Applications
Validation of HV Electrical Systems
02
Of course, the measuring technology used must be suitable for HV to exclude any danger to the user both in the work-shop and in the vehicle. Validation in extreme driving sce-narios or operating conditions ensures that the specific design of the HV on-board network provides sufficient reserves for reliable and safe operation of the vehicle. In the road tests carried out for this purpose, it is also possible to check the effects of two electric motors whose interfer-ence is superimposed.
Voltage peaks are a very fast and sporadic effect, but the tester still needs this information while driving. The mea-surement software must meet a special requirement: it must be able to evaluate and calculate signals live during the measurement. One example are triggers for recording. The trigger condition can be based on the derivative of the voltage signal to detect whether a maximum value for rap-
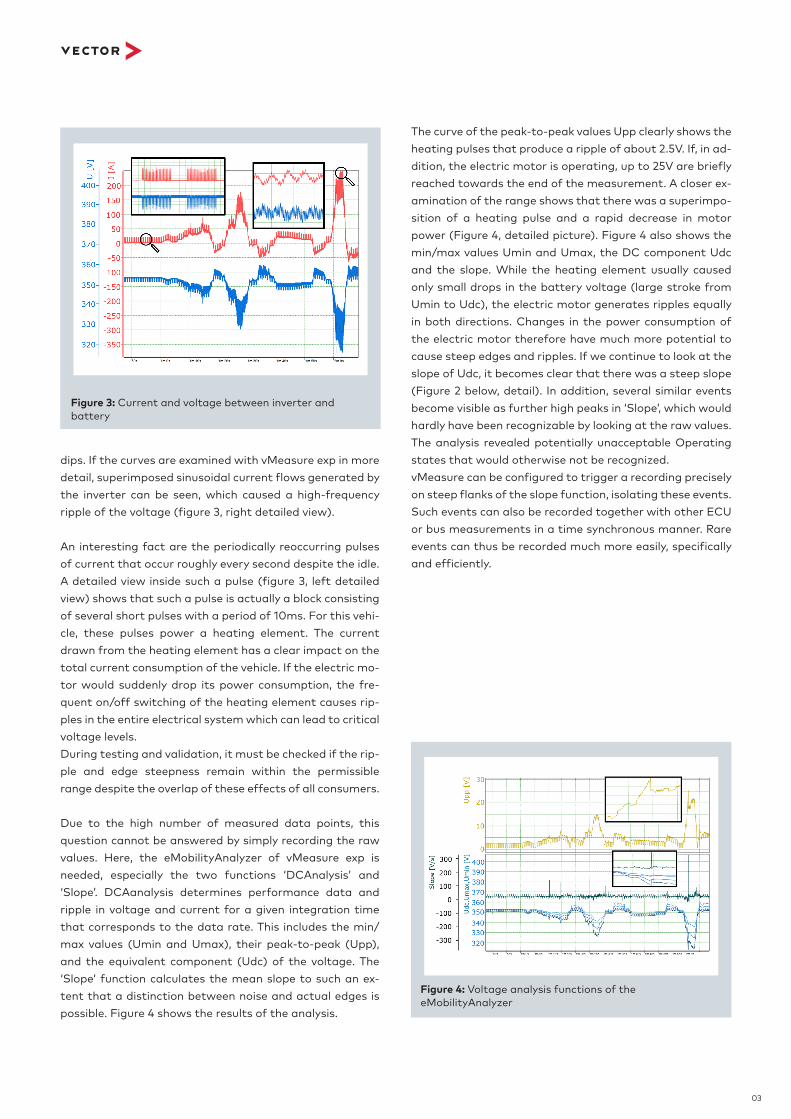
Figure 2: HV BM Module
id voltage changes has been exceeded. Of course, for a de-tailed analysis or for documentation, the measuring sys-tem must be able to record all data (HV measured signals, ECU signals and calculated signals).
The SolutionThe solution is the Vector CSM E-Mobility measurement system: A perfectly tuned toolchain consisting of HV-safe measurement modules, ECU measurement technology and a software tool for synchronized online data acquisition and data analysis during the road test.
The HV Breakout Modules (HV BM) from CSM have been specially designed for decentralized and safe measurement applications on high-voltage cables. The selectable HV BM shunt modules are permanently installed and have a rated current range of 50 A to 800 A with a rate of 1 MS/s.With the measurement software tool, vMeasure exp, the numerous 1MS/s signals are acquired, visualized and ana-lyzed online. The eMobilityAnalyzer feature in vMeasure exp calculates ripples, peak-to-peak values and much more in real-time.
If the voltage of a HV battery is measured on the dyna-mometer during a test drive of an electric vehicle, a dynam-ic response is shown as a function of the current intensity (figure 3). In this case, the battery voltage dropped by about 30V at currents of up to 250A. The voltage drop is about 10% of the open circuit voltage (OCV), although the required effective power was only 60% of the nominal power of the electric motor (45 kW of 80 kW). The graph in figure 3 doesn’t show a detailed analysis, but already a clear ripple can be seen independent of voltage
❷
❹
❺
❻❼
❽❾
❶❷
❸
❽
❾
❺
❸
❻ ❻❼
❹ ❹ ❶❶ ❶
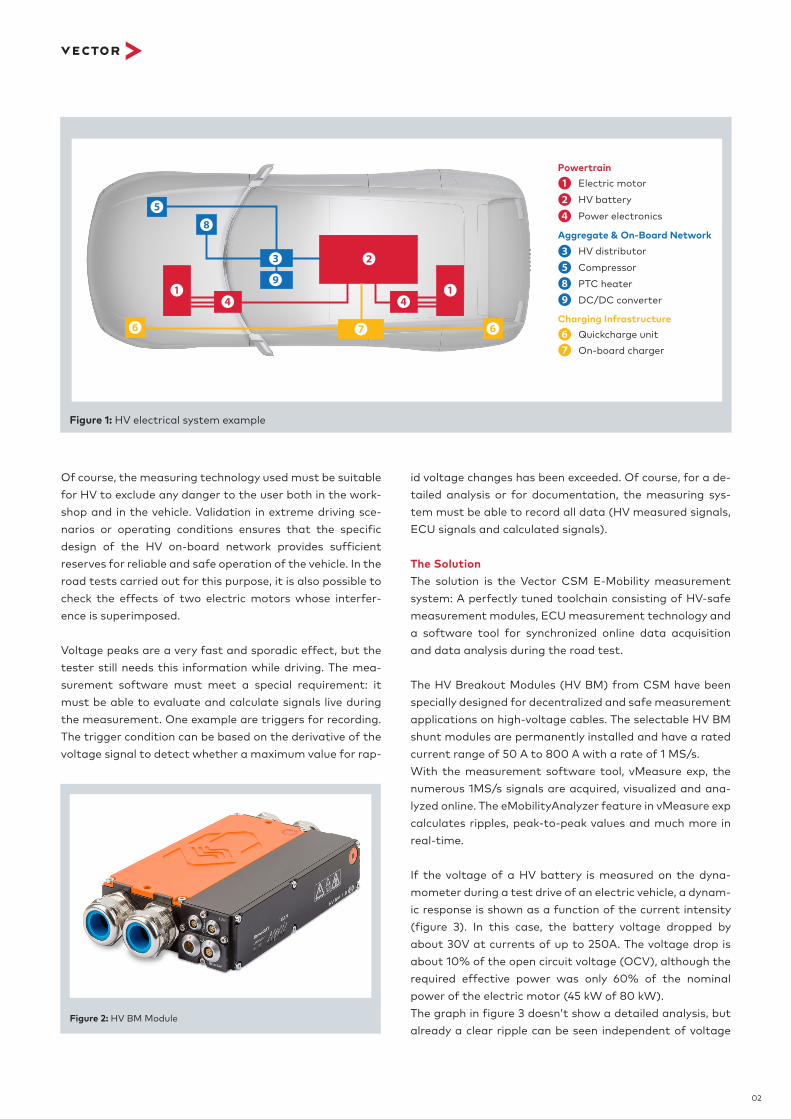
Electric motorHV battery
Powertrain
Aggregate & On-Board Network
Charging Infrastructure
On-board charger
PTC heaterDC/DC converter
Power electronics
Compressor
Quickcharge unit
HV distributor
Figure 1: HV electrical system example
03
dips. If the curves are examined with vMeasure exp in more detail, superimposed sinusoidal current flows generated by the inverter can be seen, which caused a high-frequency ripple of the voltage (figure 3, right detailed view).
An interesting fact are the periodically reoccurring pulses of current that occur roughly every second despite the idle. A detailed view inside such a pulse (figure 3, left detailed view) shows that such a pulse is actually a block consisting of several short pulses with a period of 10ms. For this vehi-cle, these pulses power a heating element. The current drawn from the heating element has a clear impact on the total current consumption of the vehicle. If the electric mo-tor would suddenly drop its power consumption, the fre-quent on/off switching of the heating element causes rip-ples in the entire electrical system which can lead to critical voltage levels. During testing and validation, it must be checked if the rip-ple and edge steepness remain within the permissible range despite the overlap of these effects of all consumers. Due to the high number of measured data points, this question cannot be answered by simply recording the raw values. Here, the eMobilityAnalyzer of vMeasure exp is needed, especially the two functions ‘DCAnalysis’ and ‘Slope’. DCAanalysis determines performance data and ripple in voltage and current for a given integration time that corresponds to the data rate. This includes the min/max values (Umin and Umax), their peak-to-peak (Upp), and the equivalent component (Udc) of the voltage. The ‘Slope’ function calculates the mean slope to such an ex-tent that a distinction between noise and actual edges is possible. Figure 4 shows the results of the analysis.
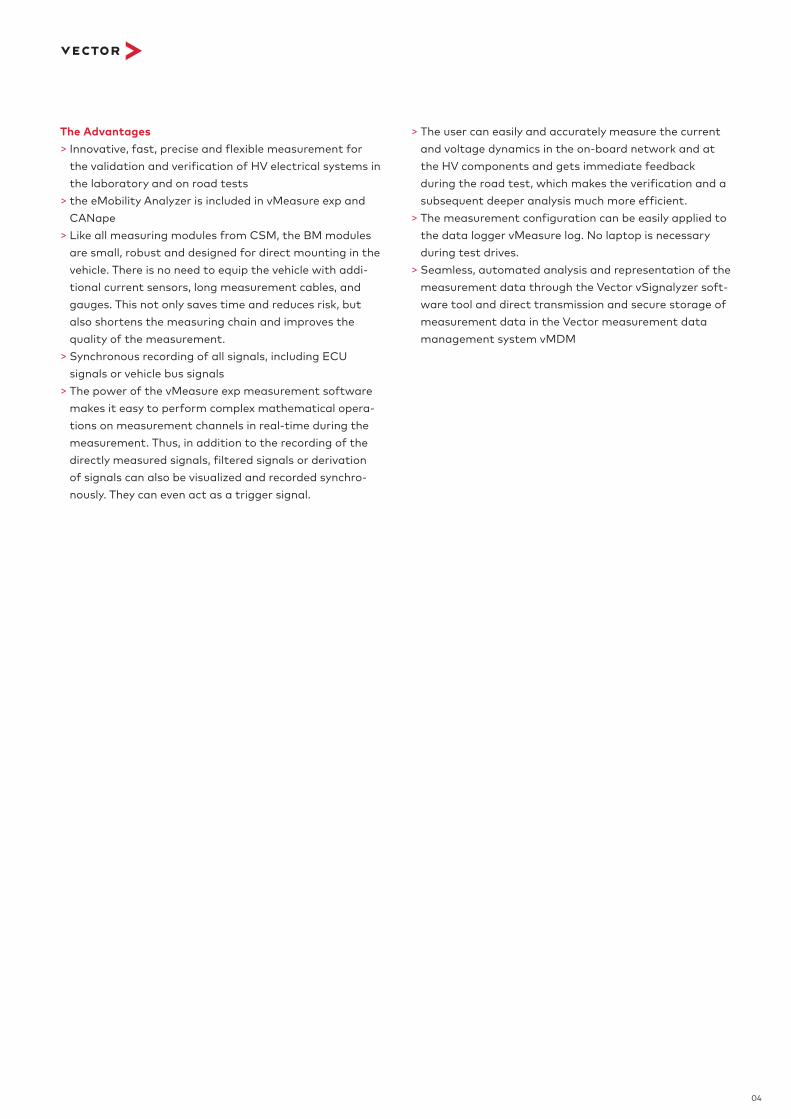
The curve of the peak-to-peak values Upp clearly shows the heating pulses that produce a ripple of about 2.5V. If, in ad-dition, the electric motor is operating, up to 25V are briefly reached towards the end of the measurement. A closer ex-amination of the range shows that there was a superimpo-sition of a heating pulse and a rapid decrease in motor power (Figure 4, detailed picture). Figure 4 also shows the min/max values Umin and Umax, the DC component Udc and the slope. While the heating element usually caused only small drops in the battery voltage (large stroke from Umin to Udc), the electric motor generates ripples equally in both directions. Changes in the power consumption of the electric motor therefore have much more potential to cause steep edges and ripples. If we continue to look at the slope of Udc, it becomes clear that there was a steep slope (Figure 2 below, detail). In addition, several similar events become visible as further high peaks in ‘Slope’, which would hardly have been recognizable by looking at the raw values. The analysis revealed potentially unacceptable Operating states that would otherwise not be recognized.vMeasure can be configured to trigger a recording precisely on steep flanks of the slope function, isolating these events.Such events can also be recorded together with other ECU or bus measurements in a time synchronous manner. Rare events can thus be recorded much more easily, specifically and efficiently.
Figure 3: Current and voltage between inverter and battery
Figure 4: Voltage analysis functions of the eMobilityAnalyzer
04
The Advantages > Innovative, fast, precise and flexible measurement for the validation and verification of HV electrical systems in the laboratory and on road tests > the eMobility Analyzer is included in vMeasure exp and CANape > Like all measuring modules from CSM, the BM modules are small, robust and designed for direct mounting in the vehicle. There is no need to equip the vehicle with addi-tional current sensors, long measurement cables, and gauges. This not only saves time and reduces risk, but also shortens the measuring chain and improves the quality of the measurement. > Synchronous recording of all signals, including ECU signals or vehicle bus signals > The power of the vMeasure exp measurement software makes it easy to perform complex mathematical opera-tions on measurement channels in real-time during the measurement. Thus, in addition to the recording of the directly measured signals, filtered signals or derivation of signals can also be visualized and recorded synchro-nously. They can even act as a trigger signal.
> The user can easily and accurately measure the current and voltage dynamics in the on-board network and at the HV components and gets immediate feedback during the road test, which makes the verification and a subsequent deeper analysis much more efficient. > The measurement configuration can be easily applied to the data logger vMeasure log. No laptop is necessary during test drives. > Seamless, automated analysis and representation of the measurement data through the Vector vSignalyzer soft-ware tool and direct transmission and secure storage of measurement data in the Vector measurement data management system vMDM