validation of cross sections for monte carlo …1 validation of cross sections for monte carlo...
TRANSCRIPT

1
Validation of cross sections for Monte Carlosimulation of the photoelectric effect
Min Cheol Han, Han Sung Kim, Maria Grazia Pia, Tullio Basaglia, Matej Batic, Gabriela Hoff,Chan Hyeong Kim, and Paolo Saracco
Abstract— Several total and partial photoionization cross sec-tion calculations, based on both theoretical and empirical ap-proaches, are quantitatively evaluated with statistical analysesusing a large collection of experimental data retrieved from theliterature to identify the state of the art for modeling the pho-toelectric effect in Monte Carlo particle transport. Some of theexamined cross section models are available in general purposeMonte Carlo systems, while others have been implemented andsubjected to validation tests for the first time to estimate whetherthey could improve the accuracy of particle transport codes.The validation process identifies Scofield’s 1973 non-relativisticcalculations, tabulated in the Evaluated Photon Data Library(EPDL), as the one best reproducing experimental measurementsof total cross sections. Specialized total cross section models, someof which derive from more recent calculations, do not providesignificant improvements. Scofield’s non-relativistic calculationsare not surpassed regarding the compatibility with experiment ofK and L shell photoionization cross sections either, although ina few test cases Ebel’s parameterization produces more accurateresults close to absorption edges. Modifications to Biggs andLighthill’s parameterization implemented in Geant4 significantlyreduce the accuracy of total cross sections at low energieswith respect to its original formulation. The scarcity of suitableexperimental data hinders a similar extensive analysis for thesimulation of the photoelectron angular distribution, which islimited to a qualitative appraisal.
Index Terms— Monte Carlo, simulation, Geant4, X-rays
I. INTRODUCTION
PHOTOIONIZATION is important in various experimentaldomains, such as material analysis applications, astro-
physics, photon science and bio-medical physics. As one ofthe interactions photons undergo in matter, it is relevant inexperimental methods concerned with the energy depositionresulting from photons as primary or secondary particles. Pho-toionization is also experimentally relevant for the secondaryatomic processes that it induces, X-ray fluorescence and Augerelectron emission, which play a role in many physics researchareas and technological applications. Extensive reviews, which
Manuscript received 14 September 2015.This work has been partly funded by CAPES BEX6460/10-0 and PVE-
71/2013 grants, Brazil.T. Basaglia is with CERN, CH-1211, Geneva, Switzerland (e-mail: Tul-
[email protected]).M. Batic was with INFN Sezione di Genova, Genova, Italy (e-mail:
[email protected]); he is now with Sinergise, 1000 Ljubljana, Slovenia.M. C. Han, C. H. Kim and H. S. Kim are with are with the Department
of Nuclear Engineering, Hanyang University, Seoul 133-791, Korea (e-mail:[email protected], [email protected], [email protected]).
G. Hoff is with CAPES, Brasilia, Brazil (e-mail:[email protected]).M. G. Pia and P. Saracco are with INFN Sezione di Genova, Via Dode-
caneso 33, I-16146 Genova, Italy (phone: +39 010 3536328, fax: +39 010313358, e-mail: [email protected], [email protected]).
cover both the theoretical and experimental aspects of thisprocess, can be found in the literature: [1]–[8] are somenotable examples among them.
This paper is concerned with modeling the physics ofphotoionization in a pragmatic way: the simulation of thisprocess in general purpose Monte Carlo codes for particletransport.
Calculations for the simulation of the photoelectric effect areimplemented in these codes [9], nevertheless a comprehensive,quantitative appraisal of their validity is not yet documented inthe literature. Assessments previously reported in the literatureconcern comparisons of cross sections with NIST referencevalues, such as [10], [11], or comparisons of cross sectionlibraries used in Monte Carlo codes [12], or involve complexobservables resulting from several physics processes in the fullsimulation of an experimental set-up, such as [13]. Compar-isons with experimental data of basic modeling features ofphotoionization in Monte Carlo codes, such as those shown in[14], are usually limited to qualitative visual appraisal and to arestricted sample of photon energies and target materials. It isworthwhile to note that the validation of simulation modelsimplies their comparison with experimental measurements[15]; comparisons with tabulations of theoretical calculationsor analytical parameterizations, such as those reported in [16]as validation of Geant4 photon interaction cross sections, donot constitute a validation of the simulation software.
The analysis documented here evaluates the methodsadopted in widely known Monte Carlo systems for the cal-culation of photoelectric cross sections for the elements of theperiodic table, as well as other modeling approaches not yetimplemented in these codes. This investigation aims to assessthe capabilities of Monte Carlo codes for particle transport inthis respect, and identify the state of the art for the simulationof the photoelectric effect.
Special emphasis is devoted to the validation and possibleimprovement of photoionization simulation in Geant4 [17],[18]; nevertheless, the results documented in this paper provideinformation relevant to other Monte Carlo systems as well.
The simulation of the atomic relaxation following the ion-ization of an atom has been treated in previous publications[19]–[22], therefore it is not addressed in this paper.
II. STRATEGY OF THIS STUDY
This study concerns an extensive set of models for thesimulation of photoionization, which are representative of thevariety of theoretical and empirical methods documented in
arX
iv:1
601.
0651
4v1
[ph
ysic
s.co
mp-
ph]
25
Jan
2016

2
the literature. The validation test concerns single ionisation ofneutral atoms by non-polarized photons, as this is the contexthandled by general purpose Monte Carlo codes.
Computational performance imposes constraints on thecomplexity of physics calculations to be performed in thecourse of simulation; hence the analysis in this paper is limitedto theoretical cross sections for which tabulations of pre-calculated values are available and to empirical models thatare expressed by means of simple analytical formulations. Tobe relevant for general purpose Monte Carlo systems, tabulateddata should cover the whole periodic table of elements and anextended energy range.
The evaluation mainly concerns total and partial photo-electric cross sections: in particle transport, the former arerelevant to determine the occurrence of the photoionizationprocess, while the latter determine which shell is ionized.Calculated cross sections are quantitatively compared with awide set of experimental data collected from the literature.The compatibility with experiment for each model, and thedifferences in compatibility with experiment across the variousmodels, are quantified by means of statistical methods.
In addition, methods for the determination of the photo-electron angular distribution are examined; nevertheless, dueto the scarcity of pertinent experimental data, their analysis islimited to qualitative considerations.
Computational algorithms pertaining to how basic physicsmodeling features are used in the transport environment, suchas methods for dealing with the macroscopic cross sectionsfor compounds or mixtures [23], [24], are outside the scopeof this paper.
III. PHYSICS OVERVIEW
Photoionization has been the object of theoretical and ex-perimental interest for several decades; only a brief overviewof the physics relevant to the simulation of the photoelectriceffect in general purpose Monte Carlo codes is included hereto facilitate the understanding of the validation tests reportedin this paper.
In the photoelectric effect a photon disappears and anelectron is ejected from an atom. The energy of the photo-electron corresponds to the difference between the energy ofthe absorbed photon and the energy binding the electron tothe atom.
General purpose Monte Carlo codes for particle transportconsider single photon interactions with isolated atoms intheir ground state; they neglect interactions with ions andexcited states, and multiple ionizations. Photon interactionsare treated regardless of the environment of the target medium;this assumption neglects solid state effects and other featuresrelated to the molecular structure of the medium. The environ-ment can have a significant effect on the cross sections nearthe photoionization thresholds of both inner and outer shellelectrons; due to the limitations of their underlying physicsassumptions, current general purpose Monte Carlo codes arenot usually exploited for the simulation of experimental sce-narios involving EXAFS (Extended X-ray Absorption FineStructure), XANES (X-ray Absorption Near Edge Structure)
and other techniques for which detailed accounting of materialstructure is required.
A. Total and Partial Cross Sections
The photoelectric cross section as a function of energyexhibits a characteristic sawtooth behavior corresponding toabsorption edges, as the binding energy of each electron sub-shell is attained and corresponding photoionization is allowedto occur.
Early theoretical calculations of photoionization cross sec-tions were limited to the K shell; they are represented bythe papers of Pratt [25], providing the asymptotic behaviorfor arbitrarily high energies, and Pratt et al. [26], reportingcalculations in the energy range between 200 keV and 2 MeV.More extensive calculations became available only at a laterstage: Rakavy and Ron [27] calculated cross sections for allsubshells of five elements over the energy range 1 keV to2 MeV, and Schmickley and Pratt [28] reported cross sectionsfor K to M shells for three elements from 412 to 1332 keV.
Scofield’s non-relativistic calculations [29] in a Hartree-Slater framework represented a major advancement in thefield, as they covered systematically all subshells over thewhole periodic table of the elements. More recent calculationswere performed by Chantler [30], [31] in a self-consistentrelativistic Dirac-Hartree-Fock framework.
These theoretical calculations provide the basis for thetabulated data libraries listed in section IV.
Various empirical formulations of photoionization crosssections are reported in the literature, e.g. in [32]. Theyderive from fits to experimental data, parameterizations oftheoretical calculations and semi-empirical methods involvingboth measured data and theoretical considerations.
B. Photoelectron Angular Distribution
Fischer’s non-relativistic theory [33] addresses the calcula-tion of differential cross sections in the low energy region. Thefirst relativistic treatment of the photoelectric effect was givenby Sauter [34], [35], who calculated the K-shell cross sectionin the Born approximation; it concerns the lowest order inZα/β (where Z is the atomic number of the target, α is thefine structure constant and β is v/c). A comparison of thesetheories is discussed in [36], which showed that Sauter’s theoryapplies even in the non-relativistic realm, despite being derivedfor relativistic electrons.
Gavrila [37] and Nagel [38] extended Sauter’s results tothe next order in Zα/β. Further calculations by Gavrila areavailable for the L shell [39].
Monte Carlo codes generate the photoelectron angular dis-tribution based on these differential cross section calculations;their respective approaches are documented in section V.
IV. PHOTOIONIZATION CROSS SECTION COMPILATIONS
The photoelectric cross section compilations considered inthis study are listed in Table I, which reports the label by whichthey are identified in the validation analysis, the correspondingreferences and their coverage in energy, atomic number and

3
atomic shells. A brief overview of their features is summarizedin the following subsections, where the compilations appear inchronological order of publication; more details can be foundthe related references.
TABLE ICOMPILATIONS OF PHOTOIONIZATION CROSS SECTIONS CONSIDERED IN
THIS STUDY
Identifier Energy range Z range Shell
Biggs [50] 10 eV 100 GeV 1 100 noBiggsG4 [50], [53] 10 eV 100 GeV 1 100 noBrennan [60] 30 eV 700 keV 3 92 noChantler [30], [31] 10 eV 433 keV 1 92 KEbel [71] 1 keV 300 keV 1 92 allElam [67] 100 eV 1 MeV 1 98 noEPDL97 [62] 10 eV 100 GeV 1 100 allHenke [54] 10 eV 30 keV 1 92 noMcMaster [40], [42] 1 keV 700 keV 1 94 noPHOTX [55] 1 keV 100 MeV 1 100 noRTAB [66] 10 eV 300 keV 1 99 allScofield [29] 1 keV 1.5 MeV 1 100 allStormIsrael [43] 1 keV 100 MeV 1 100 noVeigele [45] 100 eV 1 MeV 1 94 noXCOM-DB [58] 1 keV 500 keV 1 100 noXCOM [58] 1 keV 100 GeV 1 100 no
A. McMaster’s Tables
The compilation by McMaster et al. [40], [41] reportscoherent and incoherent photon scattering cross sections, pho-toelectric and total cross sections between 1 keV and 1 MeV.The data concern elements with atomic numbers 1 to 99,with the exception of atomic numbers 84, 85, 87, 88, 89,91, and 93. The photoelectric cross sections were obtainedby a combination of methods: by least-squares fitting of semi-empirical data, when they were available, by theoretical calcu-lations from theory in regions where the data were insufficientor were considered unreliable, and by interpolation betweensemi-empirical and theoretical values, where no data of eitherkind were available. The semi-empirical photoelectric crosssections were derived by subtracting theoretical scatteringcross sections from experimental total photon attenuation data.The theoretical cross sections are based on Schmickley andPratt’s [28] calculations.
The original compilation was updated in 2006 [42].
B. Storm and Israel’s Tables
Storm and Israel’s tables [43] encompass photon interactioncross sections for atoms with atomic numbers between 1 and100 and photon energy from 1 keV to 100 MeV. The pho-toelectric cross sections are derived from several theoreticalreferences: calculations by Brysk and Zerby [44], Rakavy andRon [27], and Schmickley and Pratt [28].
C. Veigele’s Tables
The photoelectric cross sections reported in Veigele’s com-pilation [45] are of theoretical origin in the lower energy range(from 100 eV to energies varying between 1 and 10 keV,
depending on the element) and were calculated with semi-empirical methods at higher energies (up to 1 MeV).
The low energy cross sections derive from non-relativistic,self-consistent field calculations, which are based on inde-pendent particle approximation. At higher energies, theoret-ical scattering cross sections, calculated by relativistic self-consistent field methods, were subtracted from experimentaltotal attenuation data; the resulting calculated photoelectriccross sections and available photoelectric cross section mea-surements from 1 keV to 1 MeV were then fitted by a least-squares procedure to produce recommended values.
Veigele’s compilation concerns elements with atomic num-bers from 1 to 94.
D. Scofield’s Calculations
Scofield’s 1973 [29] compilation reports photoeffect crosssections for all subshells, for all elements with atomic numbersfrom 1 to 101, over the photon energy range between 1 keVand 1.5 MeV. The calculations were later extended down to100 eV [46].
These cross sections derive from non-relativistic calcula-tions based on a solution of the Dirac equation for the orbitalelectrons moving in a static Hartree-Slater central potential.In this approximation the electron-electron interaction term isreplaced with an average value, thus making the calculationless computationally intensive, but in principle also less ac-curate, than the full Hartree-Fock model, which requires thecalculation of the self-consistent field for each term. In thesame reference [29] Scofield reports renormalization factorsfor atomic numbers 2 to 54 to convert the cross sectionscalculated in the Dirac-Hartree-Slater approximation to valuesexpected from a relativistic Hartree-Fock model.
Comparisons with experimental photon mass attenuationcoefficients [46], [47] tend to favour Scofield’s unrenormalizedvalues over the renormalized ones. Nevertheless, it is worthnoting that these evaluations of Scofield’s photoeffect crosssections do not compare the two sets of calculations with directphotoelectric cross sections measurements: the reference datain these comparisons involve the subtraction of theoreticallycalculated photon scattering contributions from measured pho-ton attenuation coefficients. It is also unclear whether theseevaluations rest on a qualitative appraisal only or are based onobjective statistical methods.
E. Biggs and Lighthill’s Parameterisation
Biggs and Lighthill [48]–[50] expressed the total photoelec-tric cross sections as an empirical parameterization of dataderiving from various semi-empirical and theoretical sources,which include, among others, Henke’s 1982 compilation [51]and the 1978 version of EPDL [52], the latter in turn basedon Storm and Israel’s, McMaster’s, Scofield’s and Veigele’scompilations.
For element i and energy range j the cross section isrepresented by the formula:
σij =Aij1
E+Aij2
E2+Aij3
E3+Aij4
E4(1)

4
The tabulations in [50] list the most recent compilation ofthe Aij coefficients of equation 1 assembled by the originalauthors of the parameterization.
Modified Aij coefficients for some gases are documentedin [53].
F. Henke’s Compilation
The compilation of photoabsorption cross sections by Henkeet al. [54] covers the energy range from 10 eV to 30 keV, forelements with atomic numbers up to 92.
Photoabsorption cross sections for energies below 10 keVare based on both theoretical calculations and experimentaldata, interpolating across the atomic number Z for elementswhere experimental data were scarce. Above 10 keV pho-toabsorption cross sections derive from the semi-empiricalparameterizations by Biggs and Lighthill [50].
An earlier compilation by Henke [51], concerning a nar-rower energy range (from 30 eV to 10 keV), is based on similarcriteria; cross sections from 1.5 to 10 keV are taken from [49].
G. PHOTX and XCOM
The PHOTX [55], [56] data library was developed as abasis for the photon cross section file of ENDF/B-VI [57]. Itprovides cross sections for coherent and incoherent scattering,photoelectric absorption, and pair production in the field ofthe nucleus and in the field of the atomic electrons. The dataconcern elements with atomic numbers between 1 and 100,and photon energies from 1 keV to 100 MeV.
XCOM [58] is a photon cross section database compiledby the NIST (National Institute of Standards and Technologyof the United States of America). It concerns elements withatomic numbers up to 100 and photon energies from 1 keVto 100 GeV. Two sets of tabulations, identified as XCOM andXCOM-DB, are evaluated in this paper. XCOM correspondsto the standard energy grid available from the XCOM web sitemanaged by NIST. XCOM-DB is encompassed in the DABAXdatabase, which is part of the X-ray Optics Software Toolkit(XOP) [59]; it is mainly addressed to the photon scienceexperimental community and is limited to photon energies upto 509.5 keV.
Regarding the photoelectric effect, both PHOTX andXCOM include Scofield’s 1973 unrenormalized cross sections[29] up to 1.5 MeV. At higher energies a semi-empiricalformula from [32] connects Scofield’s values at 1.5 MeV tothe asymptotic high energy limit calculated by Pratt [25].
H. Brennan and Cowan’s Calculations
Brennan and Cowan developed a collection of softwareprograms [60] for the calculation of photoabsorption crosssections, atomic scattering factors and other quantities relevantto photon science. The photoelectric cross sections are basedon Cromer and Liberman’s [61] theory.
Tabulations of photoelectric cross sections derived fromBrennan and Cowan’s calculations are included in the XOPsoftware system [59].
I. EPDL
The EPDL (Evaluated Photon Data Library) includes photoninteraction data concerning photoionization, photoexcitation,coherent and incoherent scattering, and pair and triplet pro-duction. The latest version at the time of writing this paperwas released in 1997, and is commonly identified as EPDL97[62]. It is part of the ENDF/B-VII.1 [63] evaluated nucleardata file.
EPDL97 includes total and partial cross sections for ele-ments with atomic numbers between 1 and 100, and for photonenergies from 1 eV to 100 GeV. Partial cross sections aretabulated for all subshells.
From the edge to 1 MeV, subshell ionization cross sectionsare based on Scofield’s data as in [46]; total photoionizationcross sections are summed over all subshells. From 1 MeVto 100 GeV the total cross sections are based on Hubbell’sdata reported in [64]. Scofield’s subshell cross sections havebeen extended up to 100 GeV by ensuring that the sum ofthe subshell cross sections is equal to HubbeIl’s total, andmaintaining the same ratio between subshell cross sectionsover the entire energy range from 1 MeV to 100 GeV. At1 MeV the total photoionization cross section is identical fromboth sources, therefore the two sets of calculations could becombined in a consistent manner.
EPDL97 documentation reports rough estimates and quali-tative comments about the accuracy of the tabulated data, butit does not document how these estimates were produced. Tothe best of our knowledge systematic, quantitative validationof EPDL97 photoionization data is not documented in theliterature.
EPDL97 is extensively used in Monte Carlo simulation;details are given in section V.
J. Chantler’s Calculations
Chantler calculated photoelectric cross sections in a self-consistent relativistic Dirac-Hartree-Fock framework [30],[31]. The exchange potential of Chantler’s approach followsthat of Cromer and Liberman [61], [65] and Brennan andCowan [60], and is different from the approach used byScofield [29].
The calculations are carried out in isolated atom and in-dependent particle approximations: each atom is treated as astandalone system, not influenced by other atoms or particles,and each electron is considered to move in an effectivepotential of the nucleus with the average repulsive force of theelectrons. This effective screening neglects some correlation;it also neglects the fact that the potential for one electron isnot identical to that of a different electron.
Chantler’s published tabulations report total and K-shellcross sections for elements with atomic number from 1 to92; they cover an energy range comprised between 1-10 eVand 0.4-1 MeV (the lower and upper bounds vary with theatomic number).
K. RTAB
The RTAB [66] database encompasses three sets of pho-toionization cross sections along with an extensive set of

5
tabulations concerning photon elastic scattering: a set oforiginal calculations (identified in the following as RTABcross sections), an extension of these cross sections basedon EPDL97 (identified as RTABX) and Scofield’s 1973 crosssections. They are listed for atomic numbers from 1 to 100.
All the data in the RTAB database (apart from those reportedfrom other sources) have been consistently computed in thesame Dirac-Slater potential. Scofield’s 1973 [29] cross sectionswere also computed in a Dirac-Slater potential, althoughdifferently from those included in the RTAB database. Ac-cording to [66], subshell cross sections are calculated in theDirac-Slater potential to obtain total atom cross sections fromthreshold up to several hundred keV. For higher energies, thesevalues are smoothly joined to the total-atom values in theEPDL97, thus extending the cross sections in the RTABXcollection up to 100 GeV. RTAB photoelectric cross sectionsare tabulated for energies up to 300 keV.
The RTAB photoelectric database has not been exploitedyet in general purpose Monte Carlo systems.
L. Elam’s Database
Elam’s database [67] provides photon cross section datafor elements with atomic numbers between 1 and 98, and forphoton energy from 100 eV to 1 MeV.
Above 1 keV the photoabsorption cross sections derive fromthe XCOM ones of [68], which were parameterized with acubic spline algorithm. Below 1 keV they are based on the1981 version of EPDL [69]. Appropriate algorithms wereapplied to the data to ensure a smooth connection between thetwo sets of cross sections. Edge discontinuities were adjustedto be consistent with Williams’ atomic binding energies [70].
M. Ebel’s Parameterizations
Ebel et al. [71] developed parameterizations of total pho-toelectric absorption coefficients and of subshell absorptioncoefficients in the energy range from 1 keV to 300 keV,for elements with atomic number up to 92. They are basedon fitting fifth order polynomials in the logarithm of thephoton energy to Scofield’s 1973 [29] cross section data. Thecoefficients for the parameterization are tabulated for eachenergy interval identified by the absorption edges of a givenelement. Photoelectric cross sections can be calculated usingthe tabulations.
This compilation was developed especially for applicationin fundamental parameter programs for quantitative X-rayanalysis.
V. PHOTOIONIZATION IN MONTE CARLO CODES
General purpose Monte Carlo codes for particle transportinclude algorithms for the simulation of the photoelectriceffect.
The original version of EGS4 [72] calculated photoelectrictotal cross sections based on Storm and Israel’s tables [43] andgenerated the photoelectron with the same direction as the in-cident photon. Later evolutions introduced the use of PHOTXcross sections [73] and the generation of the photoelectron
angular distribution [74] based on Sauter’s theory [34]. Thesefeatures are currently implemented in EGS5 [14]. EGSnrc [75]provides the option of calculating total photoelectric crosssections based on Storm and Israel’s tables as originally inEGS4 or on a fit to XCOM [58] cross sections, while it usessubshell cross sections based on EPDL [62]. It samples thephotoelectron angular distribution according to the methoddescribed in [74] based on Sauter’s theory.
ETRAN [76] uses Scofield’s 1973 [29] cross sections forenergies from 1 keV to 1.5 MeV and extends them to higherenergies by exploiting Hubbell’s method [32] to connectthe values at 1.5 MeV to the asymptotic high energy limitcalculated by Pratt [25]. It samples the direction of the photo-electron from Fischer’s [33] distribution for electron energiesbelow 50 keV and from Sauter’s [34] distribution for higherenergies.
FLUKA [77], [78] calculates photoelectric cross sectionsbased on EPDL97 and samples the photoelectron directionaccording to Sauter’s theory [34].
ITS [79] calculates photoelectric cross sections based onScofield’s 1973 non-renormalized values. The angle of thephotoelectron with respect to the parent photon is describedby Fischer’s distribution [33] at lower energies and by Sauter’s[34] formula at higher energies.
MCNP5 [80] and MCNPX [81] provided different optionsof data libraries for the calculation of photoelectric crosssections: two version of EPDL (EPDL97 [62] and EPDL89[82]), and ENDF/B-IV [84] data complemented by Stormand Israel’s tables [43] for atomic numbers greater than 83.MCNP6 [83] has extended the minimum energy cut-off forphoton transport down to 1 eV; the necessary photo-atomiccross sections derive from ENDF/B-VI version 8, which inturn is based on EPDL97 regarding photon interactions.
In the first version of Penelope including photon trans-port [85] photoelectric cross sections were interpolated fromXCOM; in more recent versions [86], [87] they are inter-polated from EPDL97 tabulations. The photoelectron angulardistribution is sampled from Sauter’s differential cross sectionfor the K shell [34].
GEANT 3 [88] calculated total photoionization cross sec-tions based on Biggs and Lighthill’s [50] parameterizations;the probability of ionization of the K shell and L subshellswas estimated by parameterizations of the jump ratios derivingfrom Veigele’s [45] tables. The angular distribution of thephotoelectron was sampled for the K shell and for the L1, L2
and L3 subshells based on Sauter’s [34], [35] and Gavrila’s[37], [39] calculations.
The Geant4 toolkit encompasses various implementationsof the photoelectric effect. The overview summarized hereconcerns the latest version at the time of writing this paper:Geant4 10.1, complemented by two correction patches.
The model implemented in Geant4 standard electromag-netic package calculates cross sections based on the analyticalformula of Biggs and Lighthill, but it uses modified coeffi-cients deriving from a fit to experimental data. The relatedreference cited in Geant4 Physics Reference Manual [89] asthe source of these modifications does not appear to be consis-tent, presumably due to a mismatch between the Russian and

6
English versions of the periodical where it was published. Themodifications appear to derive from [53], which reports fits toexperimental data concerning noble gases, hydrogen, carbon,fluorine, oxygen and silicon; they concern cross sections atlow energies. The atomic cross section calculation accordingto Biggs-Lighthill parameterization is implemented in theG4SandiaTable and G4StaticSandiaData classes of Geant4materials package. The same calculation of photoelectric crosssections is also used by the PAI (PhotoAbsorption-Ionisation)model [90]. The energy of the emitted photoelectron is deter-mined as the difference between the energy of the interactingphoton and the binding energy of the ionized shell defined inthe G4AtomicShells class [22], and the photoelectron angle iscalculated according to the Sauter-Gavrila distribution for Kshell [34], [37].
Geant4 low energy electromagnetic package [91], [92] en-compasses two implementations of the photoelectric effect,one identified as “Livermore” [93] and one reengineered fromthe 2008 version of the Penelope code [86]; both modelscalculate total and partial cross sections based on EPDL97.The so-called “Livermore” model provides three options ofcomputing the angular distribution of the emitted photoelec-tron: in the same direction as the incident photon, based onGavrila’s distribution of the polar angle [37] for the K shelland the L1 subshell, and based on a double differential crosssection derived from Gavrila’s [37], [39] calculations, whichcan also handle polarized photons.
In addition, the Geant4 toolkit encompasses two models forthe simulation of the photoelectric effect concerning polarizedphotons: one for circularly polarised photons in the polar-isation package and one in the low energy electromagneticpackage, identified as “Livermore polarized”. Their evaluationis outside the scope of this paper.
VI. THE VALIDATION PROCESS
The validation process adopts the same methodology usedin [94] for the validation of photon elastic scattering. The mainconcepts and most relevant features of the validation methodare summarized below to facilitate understanding of the resultsreported in sections VII and VIII.
A. Simulation Models
The validation process concerns the methods for the calcu-lation of total and subshell cross sections summarized in TableI. Some of these simulation models represent novel approacheswith respect to those so far available in Geant4 and in othergeneral purpose Monte Carlo codes.
All the physics models subject to evaluation have beenimplemented in a consistent software design, compatible withthe Geant4 toolkit, which minimizes external dependencies toensure unbiased appraisal of their intrinsic behaviour. The soft-ware adopts a policy-based class design [95], which supportsthe provision of a wide variety of physics models withoutimposing the burden of inheritance from a predefined interface.
A single policy class calculates cross sections that exploittabulations; alternative tabulations, corresponding to differ-ent physics models, are managed through the file system.
Dedicated policy classes implement cross section calculationsbased on analytical formulae. The same scheme is adopted fortotal and partial cross section calculation; the latter is involvedin the algorithm that creates a vacancy, which drives thesubsequent atomic relaxation process. Alternative modelingof photoelectron angular distributions is handled through aStrategy pattern [100].
A photoionization process, derived from theG4VDiscreteProcess class of Geant4 kernel, which in turn isderived from G4VProcess, acts as a host class for the policyclasses; they can be interchanged [96]–[98] to determineits behaviour. The simulation of photoionization accordingto this software design is consistent with Geant4 kernel,since Geant4 tracking handles all processes polymorphicallythrough the G4VProcess base class.
Since policy classes are characterized by a single respon-sibility and have minimal dependencies on other parts ofthe software, the adopted programming paradigm enablesindependent modeling and test of all physics options. Theirvalidation can be performed through simple unit tests. Thisstrategy ensures greater modeling flexibility and testing agilitythan the one adopted in the Geant4 electromagnetic package,where total cross section, vacancy creation and final stategeneration are bundled into one object: that software designchoice requires full-scale simulation applications to test basicphysics entities, due to extensive dependencies imposed by theG4VEmModel base class, from which all photoelectric modelsderive.
Existing physics models in Geant4 have been refactored[101] consistently with this software design; other models notyet available in Geant4 have been implemented for the firsttime. The correctness of the implementation has been verifiedprior to the validation process to ensure that the softwarereproduces the physical features of each model consistently.
B. Experimental data
Experimental data [102] - [181] for the validation of thesimulation models were collected from a survey of the litera-ture. The sample of experimental total cross sections consistsof approximately 3000 measurements, which concern 61 targetatoms and span energies approximately from 5 eV to 1.2 MeV.It includes measurements at energies below 100 eV, mostlyconcerning gaseous targets: these data are relevant to evaluatethe accuracy of calculations performed in independent particleapproximation at very low energies, e.g. the EPDL97 datalibrary, which extend down to 1 eV.
The sample of subshell cross sections encompasses approxi-mately 600 measurements, which concern 52 target atoms andspan energies approximately from 1 eV to 2.75 MeV.
An overview of the experimental data sample is summarizedin Tables II-III.
The photoionization cross sections reported in the literatureas experimentally measured often derive from measurementsof total photon attenuation, from which theoretically calculatedcontributions from photon scattering were subtracted. Thesesemi-empirical values are not appropriate to an epistemologi-cally correct validation process, which requires the comparison

7
TABLE IISUMMARY OF THE EXPERIMENTAL TOTAL CROSS SECTION DATA USED IN THE VALIDATION ANALYSIS
Atomic Number Element Energy range (keV) Sample size References
1 H 0.0136 - 0.020 27 [102]–[104]2 He 0.025 - 0.277 320 [105]–[112]3 Li 0.046 - 0.400 93 [113]–[116]7 N 0.015 - 0.4 73 [117], [118]8 O 0.013 - 0.28 215 [103], [119]–[121]10 Ne 0.022 - 2.952 448 [108], [110]–[112], [117], [122]11 Na 0.046 - 0.246 17 [123]13 Al 145.4 1 [124]17 Cl 0.016 - 0.078 25 [125]18 Ar 0.016 - 6 487 [105], [110]–[112], [117], [126]–[130]19 K 0.004 - 0.005 12 [131]22 Ti 59.54 1 [132]23 V 59.54 1 [132]24 Cr 59.54 1 [132]25 Mn 59.54 1 [132]26 Fe 0.008 - 59.54 25 [132]–[134]27 Co 59.54 1 [132]28 Ni 1.487 - 59.54 17 [132], [133]29 Cu 59.54 - 661.6 9 [124], [132], [135]–[138]30 Zn 59.54 1 [132]33 As 59.54 1 [132]34 Se 59.54 1 [132]36 Kr 0.015 - 1.626 357 [105], [110], [112], [139], [140]37 Rb 0.004 - 0.010 4 [141]38 Sr 59.54 1 [132]39 Y 279.2 - 661.6 2 [142]40 Zr 59.54 - 661.6 7 [124], [135]–[137], [143]41 Nb 59.54 2 [143]42 Mo 59.54 - 661.6 7 [132], [138], [143]43 Tc 59.54 1 [143]44 Ru 59.54 1 [143]45 Rh 59.54 1 [143]46 Pd 59.54 1 [143]47 Ag 1.487 - 661.6 13 [124], [?], [135]–[137], [143]–[146]48 Cd 59.54 2 [132], [143]49 In 59.54 2 [143]50 Sn 1 - 661.6 31 [124], [133], [135]–[137], [143], [144], [146]51 Sb 59.54 1 [143]52 Te 59.54 2 [143]54 Xe 0.013 - 6 657 [110], [122], [128], [130], [147]55 Cs 0.004 - 59.54 14 [132], [141], [148]57 La 59.54 1 [149]58 Ce 59.54 - 661.6 6 [142], [149]–[152]59 Pr 59.54 - 661.6 3 [150]–[152]60 Nd 59.54 - 661.6 2 [150], [152]61 Pm 59.54 1 [152]62 Sm 59.54 - 145.4 4 [149], [151], [152]63 Eu 59.54 2 [149], [152]64 Gd 59.54 - 661.6 5 [150]–[153]65 Tb 59.54 3 [149], [152], [153]66 Dy 59.54 - 661.6 8 [142], [149]–[153]67 Ho 59.54 1 [152]68 Er 59.54 3 [149], [152], [153]70 Yb 279.2 - 661.6 2 [142]72 Hf 65.839-68.547 25 [154]73 Ta 1.487 - 661.6 31 [124], [133], [135]–[138], [144]78 Pt 1 - 40 25 [133]79 Au 0.93 - 661.6 33 [133], [135]–[137], [145]80 Hg 1173 1 [155]82 Pb 1.487 - 1173 36 [124], [133], [135]–[137], [144]–[146], [155], [156]92 U 1.487 - 3 4 [133]

8
TABLE IIISUMMARY OF THE EXPERIMENTAL SUBSHELL CROSS SECTION DATA USED IN THE VALIDATION ANALYSIS
Z Element Shell Energy range (keV) Sample size References
3 Li K 0.069-1.487 10 [115]10 Ne L1 0.006-0.127 14 [158]18 Ar M1 0.001-0.1 147 [159]–[162]20 Ca M1, N1 0.038-0.121 24 [157]25 Mn M1 0.113-0.27 7 [163]26 Fe K 59.54 1 [164]28 Ni K 59.54 1 [164]29 Cu K 59.54-441.8 3 [164], [165]30 Zn K 59.54 1 [164]33 As K 59.54 1 [164]34 Se K 59.54 1 [164]35 Br K 59.54 1 [164]36 Kr N1 0.028-0.041 5 [162]40 Zr K, L1-L3 59.54-441.8 15 [124], [164]–[166]41 Nb K, L, L1-L3 59.54 6 [164], [166]42 Mo K, L, L1-L3 5.96-74.4 6 [164], [166]43 Tc K, L1-L3 59.54 4 [166]44 Ru K, L1-L3 59.54 4 [166]45 Rh K, L1-L3 59.54 4 [166]46 Pd K, L1-L3 59.54 4 [166]47 Ag K, L, L1-L3 59.54-441.8 8 [124], [164]–[166]48 Cd K, L, L1-L3 59.54 4 [166]49 In K, L, L1-L3 59.54 6 [164], [166]50 Sn K, L, L1-L3 59.54-1330 19 [124], [164]–[166], [167], [168], [169]51 Sb K, L1-L3 59.54 4 [166]52 Te K, L1-L3 59.54 4 [166]53 I K 59.54 2 [164]54 Xe M4, M5, O1 0.0236-1 66 [162], [170], [171]56 Ba O1 0.069-0.119 28 [172]58 Ce K, L, L1-L3 59.54 4 [166]59 Pr K, L1-L3 59.54 4 [166]60 Nd K, L1-L3 59.54 4 [166]61 Pm K, L1-L3 59.54 4 [166]62 Sm K, L, L1-L3 59.54 4 [166]63 Eu K, L, L1-L3 59.54 4 [166]64 Gd K, L1-L3 50.3-59.54 5 [166], [173]65 Tb K, L, L1-L3 59.54 4 [166]66 Dy K, L, L1-L3 53.8-59.54 5 [166], [174]67 Ho K, L1-L3 59.54 4 [166]68 Er K, L, L1-L3 59.54 4 [166]70 Yb K 61.34 1 [174]72 Hf K 65.29-65.44 2 [173], [175]73 Ta K 67.36-1330 15 [124], [165], [167]–[169], [173], [175]74 W K 59.57-69.64 2 [174], [176]78 Pt K 1330 1 [155]79 Au K, N6-N7, O1-O3, P1 5-1330 60 [26], [165], [167], [169], [173], [175], [177]80 Hg K, L, 59.54-1250 2 [155], [176]81 Tl L 59.54-74.4 3 [176], [178]82 Pb K, L, L3 13.6-2750 28 [26], [124], [155], [165], [167]–[169], [173], [175], [176], [178]–[180]83 Bi K, L, 59.54-1330 4 [155], [176], [178]90 Th K, L3 16.9-1330 9 [167], [169], [179]92 U K, L, L3 17.8-1330 10 [155], [176], [178], [179], [181]
of simulation models with truly experimental data. An evalua-tion of the possible systematic effects induced by using semi-empirical data [182] - [245] as a reference for testing crosssection calculations is reported in Section VII-A; it concernsa sample of approximately 1500 total cross sections, spanningenergies between approximately 50 eV and 6 MeV.
Some experimental measurements have been published onlyin graphical form; numerical values were extracted from theplots by means of the PlotDigitizer [246] digitizing software.The error introduced by the digitization process was estimatedby digitizing a few experimental data samples, which arereported in the related publications both in graphical andnumerical format. The reliability of the digitized values is
hindered by the difficulty of appraising the experimental pointsand their error bars in figures that may span several orders ofmagnitude in logarithmic scale, or that appear of questionablegraphical quality in the original publication. Caution was ex-ercised in using these digitized data in the validation analysis;they were discarded, if incompatible with other measurementsreported in the literature in numerical form.
Large discrepancies are evident in some of the experi-mental data; systematic effects are probably present in somecases, where sequences of positive or negative differencesbetween data samples originating from different experimentalgroups are qualitiatively visible, and confirmed by the Wald-Wolfowitz test [247] to be incompatible with randomness.

9
Experimental data exhibiting large discrepancies with respectto other measurements in similar configurations, which hintat the presence of systematic effects, are excluded from thevalidation tests.
The validation process is hindered by physical effects re-lated to the structure of the target material. Accuracy of edgeposition is limited by chemical shifts and the detailed structureof the experimental material observed. Usually an accuracy ofabsolute energies below 1-3 eV is unattainable for this reason.At low energies (less than 200-500 eV) the occurrence ofcollective valence effects and dipole resonances can lead tomuch larger deviations (e.g. up to 50 eV or 10%). Generalpurpose Monte Carlo codes do not take into account suchmaterial structure effects; the cross sections they use for thesimulation of the photoionization process, briefly outlined insection IV, are not intended to model these features. Thislimitation should be taken into account in the evaluation ofthe results of the validation process.
Correct estimate of experimental errors is a concern inthe validation of physics models, since unrealistic estimationof the experimental errors may lead to incorrect conclusionsregarding the rejection of the null hypothesis in tests whosestatistic takes experimental uncertainties explicitly into ac-count. Although technological developments have contributedto improved precision of measurement, some estimates ofexperimental uncertainties reported in the literature may be ex-cessively optimistic, especially when they appear inconsistentwith other measurements exploiting similar experimental tech-niques. Experimental measurements claiming much smalleruncertainties than similar ones have been critically evaluatedin the analysis process.
C. Data analysisThe evaluation of the simulation models performed in this
study has two objectives: to validate them quantitatively, andto compare their relative capabilities.
The scope of the software validation process is definedaccording to the guidelines of the IEEE Standard devoted tosoftware verification and validation [248], which conforms tothe life cycle process standard defined in ISO/IEC Standard12207 [249]. For the problem domain considered in this paper,the validation process provides evidence that the softwaremodels photoionization consistently with experiment.
A quantitative analysis, based on statistical methods, ispractically possible only for the validation of cross sections,for which a large sample of experimental data is available. Thescarcity of angular distribution data in the literature hindersthe validation of simulation models through similar statisticalanalysis methods: only qualitative general considerations canbe made.
The statistical analysis of photoionization cross sections isarticulated over two stages: the first determines the compati-bility between the cross sections calculated by each simulationmodel and experimental data, while the second determineswhether the various models exhibit any significant differencein compatibility with experiment. The Statistical Toolkit [250],[251] and R [252] are used in the statistical analysis. The levelof significance of the tests is 0.01, unless stated otherwise.
The first stage of the analysis encompasses a number of testcases, each one corresponding to a configuration (characterizedby photon energy, target element, experimental source and,if appropriate, subshell) for which experimental data areavailable. The inclusion of the experimental source in thedefinition of a test case facilitates the identification of possiblesystematic effects related to the experimental environment ofthe measurements. For each test case, cross sections calcu-lated by the software are compared with measured ones bymeans of goodness-of-fit tests. The null hypothesis is definedas the equivalence of the simulated and experimental datadistributions subject to comparison, as being drawn fromthe same parent distribution. The goodness-of-fit analysis isprimarily based on the χ2 test [253]. Among goodness-of-fit tests, this test has the property of taking experimentaluncertainties explicitly into account; consequently, the teststatistic is sensitive to their correct appraisal.
The “efficiency” of a physics model is defined as thefraction of test cases in which the χ2 test does not rejectthe null hypothesis. This variable quantifies the capability ofthat simulation model to produce results statistically consistentwith experiment over the whole set of test cases, which inphysical terms means over the whole range of photon energiesand target elements involved in the validation process. Twomethods were applied to calculate the uncertainties on theefficiencies: the conventional method involving the binomialdistribution, described in many introductory statistics text-books (e.g. [254]), and a method based on Bayes’ theorem[255]. The two methods deliver identical results within thenumber of significant digits reported in the following tables;the method based on Bayes’ theorem delivers meaningfulresults, which are reported in the following sections, also inlimiting cases, i.e. for efficiencies very close to 0 or to 1, wherethe conventional method based on the binomial distributionproduces unreasonable values.
The second stage of the statistical analysis quantifies thedifferences of the simulation models in compatibility withexperiment. It consists of a categorical analysis based oncontingency tables, which derive from the results of the χ2
test: the outcome of this test is classified as “fail” or “pass”,according to whether the null hypothesis is rejected or not,respectively. The simulation model exhibiting the largest effi-ciency is considered as a reference in the categorical analysis;the other models are compared to it, to determine whether theirdifference in compatibility with measurements is statisticallysignificant.
The null hypothesis in the analysis of a contingency tableassumes equivalent compatibility with experiment of the crosssection models it compares.
A variety of tests is applied to determine the statisticalsignificance of the difference between the data categories(i.e. cross section models) subject to evaluation: Pearson’s χ2
test [256] (when the number of entries in each cell of thetable is greater than 5), Fisher’s exact test [257], Boschloo’s[258] test, the test based on Suissa and Schuster’s Z-pooledstatistic [259], Santner and Snell’s test [260] and Barnard’stest [261]. As some contingency tables contain cells with alarge number of entries (>100), Barnard’s test was calculated
10
0.014 0.016 0.018 0.020
0
2
4
6
8
E (keV)
Cro
ss s
ectio
n (
Mb)
●
●
●●
●●
●
●●●
●●●
●●
●●●
●
●●
● ● ● ● ●
●
●●
● ● ●
●
●
H, Z=1Beynon1965Kohl1978Palenius1976BiggsG4BiggsChantlerEPDL
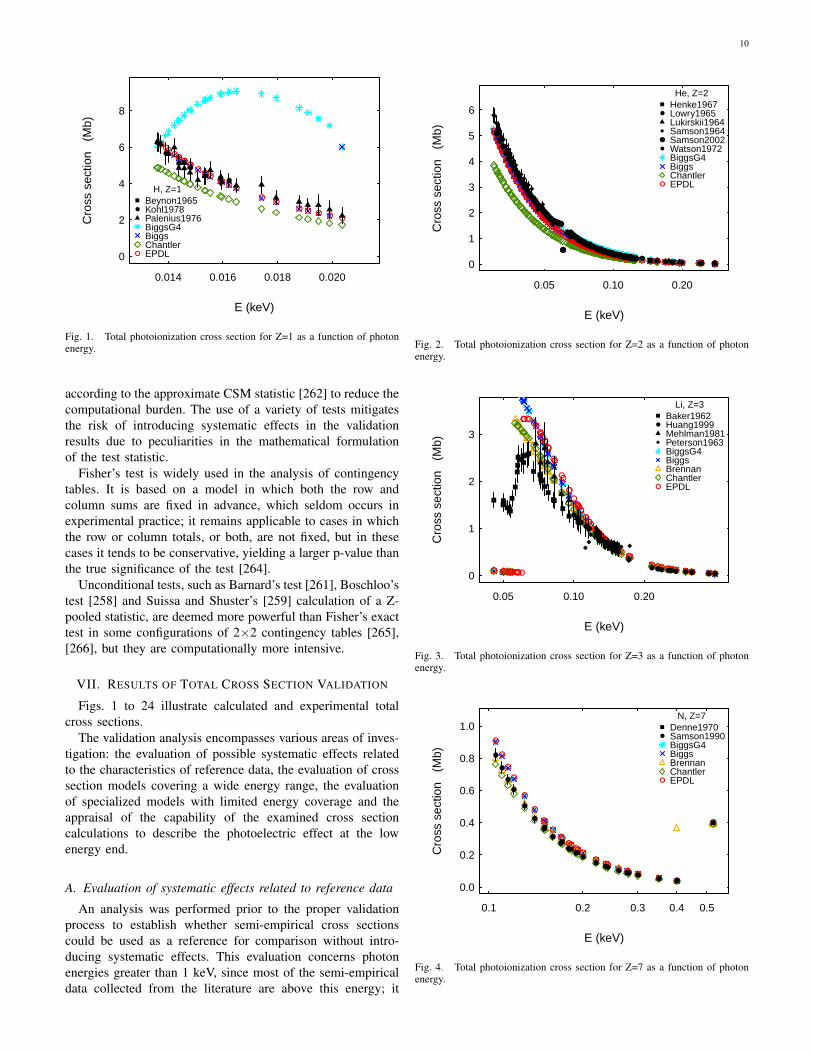
Fig. 1. Total photoionization cross section for Z=1 as a function of photonenergy.
according to the approximate CSM statistic [262] to reduce thecomputational burden. The use of a variety of tests mitigatesthe risk of introducing systematic effects in the validationresults due to peculiarities in the mathematical formulationof the test statistic.
Fisher’s test is widely used in the analysis of contingencytables. It is based on a model in which both the row andcolumn sums are fixed in advance, which seldom occurs inexperimental practice; it remains applicable to cases in whichthe row or column totals, or both, are not fixed, but in thesecases it tends to be conservative, yielding a larger p-value thanthe true significance of the test [264].
Unconditional tests, such as Barnard’s test [261], Boschloo’stest [258] and Suissa and Shuster’s [259] calculation of a Z-pooled statistic, are deemed more powerful than Fisher’s exacttest in some configurations of 2×2 contingency tables [265],[266], but they are computationally more intensive.
VII. RESULTS OF TOTAL CROSS SECTION VALIDATION
Figs. 1 to 24 illustrate calculated and experimental totalcross sections.
The validation analysis encompasses various areas of inves-tigation: the evaluation of possible systematic effects relatedto the characteristics of reference data, the evaluation of crosssection models covering a wide energy range, the evaluationof specialized models with limited energy coverage and theappraisal of the capability of the examined cross sectioncalculations to describe the photoelectric effect at the lowenergy end.
A. Evaluation of systematic effects related to reference data
An analysis was performed prior to the proper validationprocess to establish whether semi-empirical cross sectionscould be used as a reference for comparison without intro-ducing systematic effects. This evaluation concerns photonenergies greater than 1 keV, since most of the semi-empiricaldata collected from the literature are above this energy; it
0.05 0.10 0.20
0
1
2
3
4
5
6
E (keV)
Cro
ss s
ectio
n (
Mb)
● ● ●
●
●
●
●
●
●
●
●●
●
●●●
●●●
● ● ● ●
●●●●●●●
●●●●●●●
●●●
●●
●●●
●
●●●●●●●●●●●●●●●●●●●●●●●●●●●●●●●●●●●●●●●●●●●●●●●●●●●●●●●●●●●●●●●●●●●●●●●●●●●●●●●●●●●●●●●●●●●●●●●
●● ●●
● ● ● ●● ● ● ●
●
●
●
●
●
●
●
●●
●●●●●●●●●●●●●●●●●●●●●●●●●●●●●
●
●●●●●●●●●●●●●●●●●●●●●●●●●●●●●●●●●●●●●●●●●●●●●●●●●●●●●●●●●●●●●●●●●
●
●●
●●
● ● ● ● ● ● ●
●
●
●
●
He, Z=2Henke1967Lowry1965Lukirskii1964Samson1964Samson2002Watson1972BiggsG4BiggsChantlerEPDL
Fig. 2. Total photoionization cross section for Z=2 as a function of photonenergy.
0.05 0.10 0.20
0
1
2
3
E (keV)
Cro
ss s
ectio
n (
Mb)
● ●●●●●●●●●●●●
●●●●●●
●●●●●
●●
●
●
●●●
●●●
●●●
●●●●
●●
●●●●●●●●●●●●
●
●●● ●●● ●● ●●
●●
●●
●
●
●
●
●●●
●●●●●●●●
●●●●●●●●
●●●●
●●
●●●●●●●●●●●●
●
●●● ●●● ●● ●●
●
●
Li, Z=3Baker1962Huang1999Mehlman1981Peterson1963BiggsG4BiggsBrennanChantlerEPDL
Fig. 3. Total photoionization cross section for Z=3 as a function of photonenergy.
0.1 0.2 0.3 0.4 0.5
0.0
0.2
0.4
0.6
0.8
1.0
E (keV)
Cro
ss s
ectio
n (
Mb)
●
●●
●
●●
●
●
●
●
●
●
●
●
●●
●●
●●
●● ● ●
● ●
●
●
●
●
●
●
●
●●
●●
●●
●● ● ●
● ●
●
●
N, Z=7Denne1970Samson1990BiggsG4BiggsBrennanChantlerEPDL
Fig. 4. Total photoionization cross section for Z=7 as a function of photonenergy.

11
0.02 0.05 0.10 0.20
0
5
10
15
20
E (keV)
Cro
ss s
ectio
n (
Mb)
●●●●●●●●●●
●●●●●●●●●●●●●●●●●●●●●●●●●●●●●●●●●●●●●●●●●●●●●●●●●●●●●
●●●●●●●●●●●●●●●●●●●●●
●
●●
●● ● ●●●●●●●●●●●●●●●●●
●●●●●●●●●●
●●●●●●●●●●●
●●●●●●●
●●●●●●●●●●●●●●●●●●●●●●●●●●●●●●●●●●●●●●●●●●●
●●●●●●●●
●●●●●●●●●●●●●
●● ●
●●●●
●
●●●●
●
●
●●●
●
●
●●
●●
●●
●
●
O, Z=8Angel1988Cairns1965Kohl1978Samson1985BiggsG4BiggsBrennanChantlerEPDL
Fig. 5. Total photoionization cross section for Z=8 as a function of photonenergy.
0.02 0.05 0.10 0.20 0.50 1.00
0
2
4
6
8
10
12
E (keV)
Cro
ss s
ectio
n (
Mb)
●●● ●
●●●●●●●●●●●●
●●●●●●●●●●●●●●●●●●●●●●●●●●●●●●●●●●●●●●●●●●●●●●●●●●●●●●●●●●●●●●●●●●●●●●●●●●●●●●●●●●●●●●●●●●●●●●●●●●●
●●
●●
●
●●●●●●●●●●●●●●●●●●●●●●●●●●●●●●●●●●●●●●●●●●●●●●●●●●●●●●●●●●●●●●●●●●●●
●●●●●●●●●●●●●●●●●●●●●●●●●●●●●●
●
●●●●
●●
●
●●
●●●●●
●
●●●●●●●●●●●●●
●●●●●●●●●●●●●●●●
●
●●●●●●●●●●●●●●●●●●●●●●●●●●●●●●●●●●●●●●●●●●●●●●●●●●●●●●●●●●●●●●●●●●●●●●●●●●●●●●●●●
●
●
Ne, Z=10Denne1970Samson2002Suzuki2003Watson1972BiggsG4BiggsBrennanChantlerEPDL
Fig. 6. Total photoionization cross section for Z=10 as a function of photonenergy.
0.02 0.05 0.20 0.50 2.00 5.00
0
10
20
30
40
E (keV)
Cro
ss s
ectio
n (
Mb)
●●●● ●
●
●●
● ●● ●●
●
●●●● ●●●●●● ● ● ● ● ●
●●●●●
● ● ●
●
●
●
●
●
●●●●●●●●●●●●●●●●●●●●●●●●●●●●●●●●●●●●●●●●●●●●●●●●●●●●●●●●●●●●●●●●●●●●●●●●●●●●●●●●●●●●●●●●●●●●●●●●●●●●●●●●●● ●●●●●●●●●●●●●●●●●●●●●●●●
●●●●●●●●●●●●●●●●●●●●●●●●●●●●●●●●●●●●●●●●●●
●●●●●●●●●●●●●●●●●●●●
●●●●●●●●●●●●●●●●●●● ●●●●●●●●●●●●●●●●●●●●●●●●●●●●●●●●●●●●●●●●●
● ●● ●
●●●●●●
●
●●●●
●●
●●
●
●
●
●●●●●●●●●●●●●●●●●●●●●●●●●●●●●●●●●●●●●●●●●●●●●●●●●●●●●●●●●●●●●●●●●●●●●●●●●●●●●●●●●●●●●●●●●●●●● ●●● ●●●●●●●●●●●●●●●●●●●●●
●●●●●●●●●●●●●●●●●●●●●●●●●●●●●●●●●●●●●●●●●●●●●●●●●●●●●●●●●●●●●●
●
●
●
●
●
Ar, Z=18Denne1970Henke1967Kato2007Lukirskii1963Samson2002Suzuki2005Watson1972Yang1987Zheng2006BiggsG4BiggsBrennanChantlerEPDL
Fig. 7. Total photoionization cross section for Z=18 as a function of photonenergy.
1 2 5 10 20
0
200
400
600
800
E (keV)
Cro
ss s
ectio
n (
Kb)
●
●●
●
●● ●●●●●●
●●●● ●● ● ● ● ● ●
●
Fe, Z=26DelGrande1986BiggsG4BiggsBrennanChantlerEPDL
Fig. 8. Total photoionization cross section for Z=26 as a function of photonenergy.
2 5 10 20
0
100
200
300
400
500
E (keV)
Cro
ss s
ectio
n (
Kb)
●●
●
●
●● ● ●● ●●●
●●
● ●
●
Ni, Z=28DelGrande1986BiggsG4BiggsBrennanChantlerEPDL
Fig. 9. Total photoionization cross section for Z=28 as a function of photonenergy.
100 200 300 400 500 600 700
0.00
0.05
0.10
0.15
E (keV)
Cro
ss s
ectio
n (
Kb)
●
● ● ●●
●
●●●● ●
●
●●●
●
●
●
●
Cu, Z=29Gowda1973Gowda1974aGowda1975Ranganathayah1977Sogut2002Titus1959BiggsG4BiggsBrennanChantlerEPDL
Fig. 10. Total photoionization cross section for Z=29 as a function of photonenergy.

12
0.05 0.10 0.20 0.50 1.00 2.00
0
5
10
15
20
25
E (keV)
Cro
ss s
ectio
n (
Mb)
●●
●
●● ● ● ● ● ●
●●
●●
●● ●●●●●●
●●●●●●●●●●●●●●●●●●●●●●●●●●●●●●●●●●●●●●●●●●●●●●●●●●●●●●●●●●●●●●●●●●●●●●●●●●
●●●●●●●●●●●●●●●●●●●●●●●●●●●●●●
●●●●
●●
●●●●●●●●●●●●●●●●●●●●●●●●●●●●●●●●●●
●●
●●
●● ●●●●●●
●
●
Kr, Z=36Henke1967Lang1975Samson2002Suzuki2002BiggsG4BiggsBrennanChantlerEPDL
Fig. 11. Total photoionization cross section for Z=36 as a function of photonenergy.
1 2 5 10 20
0.0
0.5
1.0
1.5
E (keV)
Cro
ss s
ectio
n (
Mb)
●
●●
●
●●●●●●● ●●●●●● ● ● ● ● ●
●
Sn, Z=50DelGrande1986BiggsG4BiggsBrennanChantlerEPDL
Fig. 12. Total photoionization cross section for Z=50 as a function of photonenergy.
0.02 0.05 0.20 0.50 2.00 5.00
0
5
10
15
20
25
30
35
E (keV)
Cro
ss s
ectio
n (
Mb)
●
●
●●
●●
●●●
●●●
●●●●●●●●●●●●●●●●●●●●●●●●●●●●●●●●●●●●●●●●●●●●●●●●●●●●●●●●●●●●●●●●●●●●●●●●●●●●●●●●●●●●●●●●●●●●●●●●●●●●●●●●●●●●●●●●●●●●●●●●●●●●●●●●●●●●●●●●●●●●
●●●●●●●●●●●●●●●●●●●●●●●●●●●●●●
●●●●●●●●●●●●●●●●●●●●●●●●●●●●●●●●●●●●●●●●●●●●●●●●●●●●●●●●●
●●●●●
●
●
●
●
●
●
●●●●●●
●●●
●
●
●●
●●●●●●●●●●●●●●●●●●●●●●●●●●●●●●●●●●
●
●
●
●
●
●
●●●●●●●●●●●●●●●●●●●●
●●●●●●●●●●●●●●●●●●●●●●●●●●●●●●●●●●●●●
●●●●●●●●●●●●●●●●●●●●●●●●●●●●●●●●●●●●●●●●●●●●●●●
●●●●●●●●●●●●●●●●●●●●●●●●●●●●●●●●●●●●●●●●●●●
●
●
●
●●
●
●
●
●
●
●
●●●●●●●●●●●●●●●●●●●●●●●●
●●●●●●●●●●●●●●●●●●●●●
●●●●●●●●●●●●●●●●●●●●●●●●●●●●●●●● ●●●●●●●●●●●●●●●●●●●●●●●●●●●●●●●●●●●●●●●●●●●●●●
●●●●●●●●●●●●●●●●●●●●●●●●●●●●●●●●
●●●
●●●●●●●●●●●●
●●●●●●●●●●●●●●●●●●●●●●●●●●●●●●●●●●●●●●●●●●●●●●●●●●●●●●●●●●●●●●●●●●●●●●●●●●●●●●●●●●●●●●●●●●●●●●●●●●●●●
●●●●●●●●●●●●●●●●●●●●●●●●●●●●●●
●●●●●●●●●●●●●●●●●●●●●●●●●●●●●●●●●●●●●●●●●●
●●
●
●
●
●
●
●
●
●●●
●
●
●
●
●●●●●●●●●●●●●●●●●●●●●●●●●●●●●●●●●●●●●●●●●
●●●●●●●●●●●●●●●●●●●●●●●●●●●●●●●● ●●●●●●●●●●●●●●●●●●●●●●●●●●●●●●●●●●●●●●●●●●●●●●
●
●
●
●
Xe, Z=54Kato2007Saito2001Samson2002Suzuki2003West1978Zheng2006BiggsG4BiggsBrennanChantlerEPDL
Fig. 13. Total photoionization cross section for Z=54 as a function of photonenergy.
2 5 10 20 50 100 500
0
100
200
300
400
500
600
E (keV)
Cro
ss s
ectio
n (
Kb)
●●
●
●
●●●●
●●●●●●●●●● ● ●●● ● ● ● ●● ● ●●●●● ● ●●●
●
●
●
●
●
Ta, Z=73DelGrande1986Gowda1973Gowda1974aGowda1975Jahagirdar1992Ranganathayah1977Titus1959BiggsG4BiggsBrennanChantlerEPDL
Fig. 14. Total photoionization cross section for Z=73 as a function of photonenergy.
1 2 5 10 20
0.0
0.5
1.0
1.5
E (keV)
Cro
ss s
ectio
n (
Mb)
●
●●
● ●
●●
●●●●●●●●●● ●● ● ● ● ● ● ●
●
Pt, Z=78DelGrande1986BiggsG4BiggsBrennanChantlerEPDL
Fig. 15. Total photoionization cross section for Z=78 as a function of photonenergy.
1 2 5 10 20
0.0
0.5
1.0
1.5
2.0
E (keV)
Cro
ss s
ectio
n (
Mb)
●
●●
● ●
●●●●
●●●●●●●●● ● ● ● ● ● ● ●
●
●
●
●
Au, Z=79DelGrande1986Lurio1975BiggsG4BiggsBrennanChantlerEPDL
Fig. 16. Total photoionization cross section for Z=79 as a function of photonenergy.

13
2 5 10 20 50 200 500
0
200
400
600
800
1000
E (keV)
Cro
ss s
ectio
n (
Kb)
●
●●
● ●
●●●●
●●●●●●●●●●●●● ● ●●● ●●● ● ● ●●
●
●●
●●
● ●
●●●●
●●●●●●●●●●● ●● ● ●●● ● ● ●●
●
●
●
●
●
Pb, Z=82Anasuya1994DelGrande1986Ghose1966Gowda1973Gowda1974aGowda1975Jahagirdar1992Lurio1975Parthasaradhi1966Ranganathayah1977BiggsG4BiggsBrennanChantlerEPDL
Fig. 17. Total photoionization cross section for Z=82 as a function of photonenergy.
1.5 2.0 2.5 3.0
0.0
0.5
1.0
1.5
E (keV)
Cro
ss s
ectio
n (
Mb)
●●
●
●
●
U, Z=92DelGrande1986BiggsG4BiggsBrennanChantlerEPDL
Fig. 18. Total photoionization cross section for Z=92 as a function of photonenergy.
involves cross section compilations that are applicable overthe whole energy covered by experimental and semi-empiricaldata.
The efficiency at reproducing experimental and semi-empirical reference data is reported in Table IV for all com-pilations covering the selected energy range. One observesthat it is systematically lower, when semi-empirical dataare considered as a reference in the comparison; the Wald-Wolfowitz test rejects the hypothesis of randomness of thesequence of results associated with experimental and semi-empirical references with 0.01 significance.
Categorical analysis performed over the compatibilityof cross section calculations with experimental and semi-empirical reference data confirms that the observed differenceis statistically significant in all cases, with the exception ofthe Storm and Israel compilation. The p-values resulting fromdifferent tests over contingency tables are listed in Table V.The null hypothesis of equivalent compatibility with referencedata is rejected by all tests with 0.01 significance in the
TABLE IVEFFICIENCY CALCULATED WITH RESPECT TO EXPERIMENTAL OR
SEMI-EMPIRICAL REFERENCE DATA
Experimental Semi-empirical
Model Pass Fail Efficiency Pass Fail Efficiency
BiggsG4 33 9 0.79 ± 0.06 171 128 0.57 ± 0.03Biggs 33 9 0.79 ± 0.06 171 128 0.57 ± 0.03EPDL 36 6 0.86 ± 0.05 180 119 0.60 ± 0.03Penelope 36 6 0.86 ± 0.05 180 119 0.60 ± 0.03PHOTX 34 8 0.81 ± 0.06 176 122 0.59 ± 0.03Scofield 34 8 0.81 ± 0.06 173 120 0.59 ± 0.03Storm 30 12 0.71 ± 0.07 175 123 0.59 ± 0.03XCOM 35 7 0.83 ± 0.06 178 120 0.60 ± 0.03
comparison involving cross sections based on Scofield’s 1973calculations (EPDL, PHOTX, XCOM and Scofield’s own tab-ulations). For the comparison concerning Biggs-Lighthill crosssections, the null hypothesis is rejected by all unconditionaltests and by Pearson’s χ2 tests, while it is not rejected byFisher’s exact test, which is known to be more conservativethan unconditional tests. The insensitivity of the Storm andIsrael model to the type of reference data to which it iscompared is related to its overall lower compatibility withexperiment reported in Table IV.
From these results one can infer that the use of semi-empirical data as a reference in the comparison with photo-electric cross sections would introduce systematic effects inthe validation process.
All the analyses reported in the following sections concernexperimental data samples only.
TABLE VTEST OF EQUIVALENT COMPATIBILITY OF CALCULATED TOTAL CROSS
SECTIONS WITH EXPERIMENTAL OR SEMI-EMPIRICAL DATA
Test
Model Fisher χ2 Boschloo Z-pooled Santner Barnard
Biggs 0.0110 0.0081 0.0099 0.0090 0.0090 0.0072EPDL 0.0010 0.0013 0.0018 0.0023 0.0018 0.0008PHOTX 0.0064 0.0066 0.0063 0.0075 0.0080 0.0056Scofield 0.0063 0.0063 0.0061 0.0073 0.0079 0.0053Storm 0.1319 0.1189 0.1219 0.1223 0.1278 0.1247XCOM 0.0034 0.0032 0.0037 0.0041 0.0042 0.0024
B. Evaluation of total cross section compilations with wideenergy coverage
Some of the total cross section models considered in thisstudy cover a wide energy range: those based on Scofield’s1973 non-relativistic calculations (including EPDL, PHOTXand XCOM compilations), Storm and Israel’s compilation andBiggs-Lighthill’s parameterization, both in its original formand in the modified version used by Geant4. Their extendedapplicability has contributed to their extensive use in particletransport codes.
General purpose Monte Carlo codes have traditionally han-dled photon interactions above 1 keV; extensions to lowerenergies have been included only relatively recently in some

14
20 30 40 50 60 70
0
1
2
3
Atomic number
Cro
ss s
ectio
n (
Kb)
● ● ● ● ● ● ● ● ●●
●●●●●●●●●●●
●●●
●●●●
●●●●●
●●●
●●●●●●●●●●●●●
●●●
● ● ● ● ● ● ● ● ●●
●●●●●●●●●
●●●●
●●●
●
●●●
●●
●
●
●
●
●
●
E = 59.54 keVBudak1999Budak1999aErtugrul1996Ertugrul2003Karabulut1999Sogut2002BiggsG4BiggsBrennanChantlerEPDL
Fig. 19. Total photoionization cross section at 59.54 keV as a function ofthe atomic number Z.
40 50 60 70 80
0
200
400
600
800
1000
Atomic number
Cro
ss s
ectio
n (
b)
●●
●
●●
●●
●
●
●
●●
●
● ●
●
●
E = 123.6 keVJahagirdar1992Jahagirdar1996BiggsG4BiggsBrennanChantlerEPDL
Fig. 20. Total photoionization cross section at 123.6 keV as a function ofthe atomic number Z.
20 40 60 80
0
100
200
300
400
500
600
700
Atomic number
Cro
ss s
ectio
n (
b)
● ●●
●●
●●
●
●
●
●●●
●
●
E = 145.4 keVGowda1973Jahagirdar1996BiggsG4BiggsBrennanChantlerEPDL
Fig. 21. Total photoionization cross section at 145.4 keV as a function ofthe atomic number Z.
30 40 50 60 70 80 90
0
20
40
60
80
100
120
Atomic number
Cro
ss s
ectio
n (
b)
●●●
●●
●
●
●
●
●
●
●
●
●
●
●
●
E = 279.2 keVGowda1974aManna1985BiggsG4BiggsBrennanChantlerEPDL
Fig. 22. Total photoionization cross section at 279.2 keV as a function ofthe atomic number Z.
30 40 50 60 70 80 90
0
10
20
30
40
Atomic number
Cro
ss s
ectio
n (
b)
●●
●●
●
●
●
●
E = 411.8 keVGowda1974aBiggsG4BiggsBrennanChantlerEPDL
Fig. 23. Total photoionization cross section at 411.8 keV as a function ofthe atomic number Z.
30 40 50 60 70 80 90
0
5
10
15
Atomic number
Cro
ss s
ectio
n (
b)
●●●●●● ●●●
●●●●●
●●●●
●
●●
●
●●●●
●●●●
●●
●●●●●●
●●●
●●●
●●
●●●
●●●
●
●
●
E = 661.6 keVAnasuya1994Anasuya1998Gowda1975Manna1985Titus1959BiggsG4BiggsBrennanEPDL
Fig. 24. Total photoionization cross section at 661.6 keV as a function ofthe atomic number Z.

15
of them. The validation process has investigated the abilityof these cross section compilations to reproduce experimentaldata as a function of energy, with special attention devoted tocharacterizing the behaviour at low energies, below 1 keV.
The efficiency of total cross section models applicable from1 keV up to the highest energy measurements included in theexperimental sample (approximately 1.2 MeV) is reported inTable IV. The largest efficiency is achieved by EPDL (whichis also the basis of Penelope’s tabulations). Categorical testsbased on contingency tables, summarized in Table VI, showthat the differences in compatibility with experiment betweenthe various models and EPDL are not statistically significantin this energy range.
One observes some small differences in Table IV regardingthe efficiencies of cross section compilations derived fromScofield’s 1973 calculations. They are due to differences inthe granularity of the energy grid at which cross sections aretabulated, which affects the precision of interpolation.
TABLE VIP-VALUES FROM DIFFERENT TESTS COMPARING THE COMPATIBILITY
WITH EXPERIMENT OF TOTAL CROSS SECTION MODELS WITH EXTENDED
ENERGY COVERAGE AND EPDL, FOR ENERGIES ABOVE 1 KEV
Test
Model Fisher χ2 Boschloo Z-pooled Santner Barnard
BiggsG4 0.570 0.393 0.427 0.427 0.586 0.942Biggs 0.570 0.393 0.427 0.427 0.586 0.942Penelope 1 1 1 1 1 1PHOTX 0.771 0.558 0.608 0.639 0.744 0.997Scofield 0.771 0.558 0.608 0.639 0.744 0.997Storm 0.183 0.111 0.130 0.122 0.230 0.138XCOM 1 0.763 1 0.850 0.913 1
Only EPDL and Biggs-Lighthill’s parameterization coverthe whole energy range corresponding to the experimental datasample, including energies below 1 keV; their efficiencies arereported in Table VII for a series of low energy intervals. Allmodels exhibit low efficiencies below approximately 100 eV;above this energy the efficiencies of cross sections based onEPDL and on the original Biggs-Lighthill’s parameterizationappear quite stable (compatible with statistical uncertainties)and similar, although EPDL ones are always larger.
The modified coefficients of Biggs and Lighthill’s parame-terization implemented in Geant4 do not appear to improvethe compatibility with experiment of the calculated crosssections; discrepancies with respect to experimental data arequalitatively visible in Figs. 1 and 25-28. Cross sections calcu-lated with the original coefficients appear unable to reproduceexperimental data consistently in the very low energy range,below a few tens of eV: a few examples are shown in Figs.29-32.
A dedicated statistical analysis was performed to quan-tify whether the difference in compatibility with experimentbetween the two parameterizations is significant. For thispurpose, the data sample was limited to test cases wherethe two cross section calculations produce different valuesat the same energy of an experimental measurement; thesetest cases concern only noble gases, oxygen and hydrogen.
TABLE VIIEFFICIENCY BELOW 1 KEV OF TOTAL CROSS SECTION MODELS WITH
EXTENDED COVERAGE
Emin Emax Model Pass Fail Efficiency
10 eV 1 keVBiggsG4 12 31 0.28 ± 0.07Biggs 13 30 0.30 ± 0.07EPDL 18 25 0.42 ± 0.07
100 eV 1 keVBiggsG4 14 20 0.41 ± 0.08Biggs 22 12 0.65 ± 0.08EPDL 23 11 0.68 ± 0.08
150 eV 1 keVBiggsG4 14 12 0.54 ± 0.09Biggs 17 9 0.65 ± 0.09EPDL 19 7 0.73 ± 0.08
250 eV 1 keVBiggsG4 14 7 0.67 ± 0.10Biggs 14 7 0.67 ± 0.10EPDL 15 6 0.71 ± 0.09
Two test cases were considered: one involving energies below100 eV and one concerning measurements above or equal to100 eV. The corresponding efficiencies are reported in TableVIII, along with EPDL and RTAB results: the original Biggsand Lighthill parameterization, as well as EPDL and RTABcompilations, exhibit low efficiencies in the lower energyrange, while the efficiency of EPDL, RTAB and the originalBiggs and Lighthill parameterization achieve substantiallybetter compatibility with experiment above 100 eV. It is worthrecalling that this test concerns data below 1 keV, since thecoefficients of the two parameterizations differ only in the lowenergy range.
The results of the analysis of these categorical data, sum-marized in Table IX, show that above 100 eV the nullhypothesis of equivalent compatibility with experiment of thetwo parameterizations is rejected with 0.01 significance by allthe tests applied to the associated contingency table, while itis not rejected below 100 eV.
TABLE VIIIEFFICIENCY OF TOTAL CROSS SECTIONS BASED ON ORIGINAL AND
MODIFIED BIGGS-LIGHTHILL PARAMETERIZATION, LIMITED TO THE TEST
CASES WHERE THEY DIFFER
E < 100 eV E ≥ 100 eV
Model Pass Fail Efficiency Pass Fail Efficiency
BiggsG4 6 16 0.27 ± 0.09 1 13 0.07 ± 0.07Biggs 2 20 0.09 ± 0.07 10 4 0.71 ± 0.12EPDL 5 17 0.23 ± 0.09 11 3 0.79 ± 0.11RTAB 7 15 0.32 ± 0.10 11 3 0.79 ± 0.11
These results suggest reverting to the original coefficientsof Biggs-Lighthill’s parameterization in Geant4 for improvedaccuracy of the physics models that use cross sections basedon it, at least at energies above a few tens of eV.
C. Evaluation of specific total cross section compilations
This investigation addresses the issue of whether specializedcalculation models produce more accurate results than exten-sive cross section compilations in the limited energy range theycover and therefore deserve to partially replace the extensive

16
TABLE XP-VALUES CONCERNING THE COMPARISON OF THE COMPATIBILITY WITH EXPERIMENT OF SPECIFIC TOTAL CROSS SECTION MODELS AND EPDL
Energy range p-values from tests over contingency tables
Model Emin Emax Fisher χ2 Boschloo Z-pooled Santner Barnard
Brennan 30 eV 700 keV 0.006 0.004 0.005 0.004 0.004 0.004150 eV 700 keV 0.004 0.002 0.003 0.003 0.003 0.002
Chantler 10 eV 433 keV 0.0097 0.006 0.008 0.008 0.007 0.00999150 eV 433 keV 0.006 0.003 0.005 0.005 0.006 0.003
Ebel 1 keV 300 keV 1 0.739 0.836 0.834 0.897 0.994Elam 100 eV 1 MeV 0.124 0.084 0.093 0.093 0.133 0.087
Henke 10 eV 30 keV 0.151 0.101 0.109 0.110 0.128 0.108150 eV 30 keV 0.049 0.027 0.031 0.031 0.032 0.030
McMaster 1 keV 700 keV 0.041 0.033 0.033 0.040 0.071 0.039
RTAB 10 eV 300 keV 1 0.843 0.828 0.917 0.920 0.997150 eV 300 keV 1 0.793 1 0.880 0.903 0.870
Storm-Israel 1 keV 100 MeV 0.183 0.111 0.130 0.122 0.230 0.138Veigele 100 eV 1 MeV 1 0.843 0.828 0.917 0.920 0.997XCOM-DB 1 keV 500 keV 0.371 0.232 0.273 0.273 0.403 0.371
0.10 0.15 0.20 0.25
0.0
0.1
0.2
0.3
0.4
E (keV)
Cro
ss s
ectio
n (
Mb)
●
●
●
●
●
●
●
●
●
●●●●●●●●●●●●●●●●●●●●●●●●●
●
●
●●
●
●
●
●
●
●
●
●
●
●
●
●
●
●
●
He, Z = 2Henke1967Lowry1965Lukirskii1964Samson2002Watson1972BiggsG4BiggsEPDL
Fig. 25. Total photoionization cross section for helium as a function of photonenergy, above 100 eV: original and modified Biggs-Lighthill parameterizationsexhibit different behavior with respect to experimental data.
0.10 0.15 0.20 0.25
0.0
0.5
1.0
1.5
E (keV)
Cro
ss s
ectio
n (
Mb) ●
●
●
●
●
●●
●●
●●
● ● ●
●
●
●
●
O, Z = 8Angel1988Samson1985BiggsG4BiggsEPDL
Fig. 26. Total photoionization cross section for oxygen as a functionof photon energy, above 100 eV: original and modified Biggs-Lighthillparameterizations exhibit different behavior with respect to experimental data.
0.10 0.15 0.20 0.25
0
1
2
3
4
E (keV)
Cro
ss s
ectio
n (
Mb)
●●
●
●●●●●●●●●●●●●●●●●●●●●●●●●
●
●
●
●
●
●●
●●
●●
●●
●●
●●
●●
● ● ●
●
●
●
●
●●
●●
●
●●●●●●●●●●●●●●●●●●●●●●●●●
●
●
Ne, Z = 10Denne1970Samson2002Suzuki2003Watson1972BiggsG4BiggsEPDL
Fig. 27. Total photoionization cross section for neon as a function of photonenergy, above 100 eV: original and modified Biggs-Lighthill parameterizationsexhibit different behavior with respect to experimental data.
0.10 0.15 0.20 0.25
0.0
0.2
0.4
0.6
0.8
1.0
1.2
1.4
E (keV)
Cro
ss s
ectio
n (
Mb)
●
●
●●
●●
●
●
●
●
●●●●●●●●●●●●●●●●●●●●●●●●●
●
●
●
●
●
●●
●●
●●
●●●●●
●
●
●●
●●
●
●●●
●
●
●
●
●
●
●
●
●
●
●●
●●
●●
●●●●
●
●
●
●●
●
●
●
●
●●
●
●
●
●
●
●
Ar, Z = 18Denne1970Kato2007Lukirskii1963Samson2002Suzuki2005Watson1972BiggsG4BiggsEPDL
Fig. 28. Total photoionization cross section for argon as a function of photonenergy, above 100 eV: original and modified Biggs-Lighthill parameterizationsexhibit different behavior with respect to experimental data.

17
TABLE IXCOMPARISON OF THE COMPATIBILITY WITH EXPERIMENT OF TOTAL
CROSS SECTIONS BASED ON ORIGINAL AND MODIFIED BIGGS-LIGHTHILL
PARAMETERIZATION
Test p-value, E < 100 eV p-value, E ≥ 100 eV
Fisher 0.240 0.0013Z-pooled 0.137 0.0004Boschloo 0.174 0.0004Santner 0.259 0.0004Barnard 0.223 0.0004
0.04 0.06 0.08 0.10
0
2
4
6
8
E (keV)
Cro
ss s
ectio
n (
Mb)
●
●
●
●
●
●
●
●●
●
●● ●
●
●●●●●●●●●●●●●●●●●●●●●
●●●●●●
●●●●
●●●
●●
●●
●
●
●●●●●●●●●●●●●●●●●●●●●●●●●●●●●●●●● ●●●●●●●●●●●●●●●●●●●●●●●●●●●●●●●●●●●●●●●
●● ● ● ●
●
●● ●
●
●● ● ●
●
●
●
●
He, Z = 2Lowry1965Lukirskii1964Samson1964Samson2002Watson1972BiggsG4BiggsEPDL
Fig. 29. Total photoionization cross section for helium as a function of photonenergy, below 100 eV: original and modified Biggs-Lighthill parameterizationsexhibit different behavior with respect to experimental data.
0.02 0.04 0.06 0.08 0.10
0
5
10
15
20
E (keV)
Cro
ss s
ectio
n (
Mb)
●●●●●●●●●●●●●●●●●●●●●●●●●●●●●●●●●●●●●●●●●●●●●●●●●●●●●●●●●●●●●●●
●●●●●●●●●●●●●●●●●●●●●
●
●●
●
●●●●●●●●●●
●●●●●●●●●●●
●●●●●●●
●●●●●●●
●●●●●●●●●●●●●●●●●●●●●●●●●●●●●●●●●●●●●●●●●
●●●● ●●
●●● ●●● ● ●●●● ●
●●●●
●
●●●●
●
●
●●●
●
●
●●●●
●●
●
●
O, Z = 8Angel1988Cairns1965Kohl1978Samson1985BiggsG4BiggsEPDL
Fig. 30. Total photoionization cross section for oxygen as a functionof photon energy, below 100 eV: original and modified Biggs-Lighthillparameterizations exhibit different behavior with respect to experimental data.
0.02 0.04 0.06 0.08 0.10
0
2
4
6
8
10
12
E (keV)
Cro
ss s
ectio
n (
Mb)
●●●●●●●●●●
●●●●●
●●●●●●●●●●●●●●●●●●●●●●●●●●●●●●●●●●●●●●●●●●●●●●●●●●●●●●●●●●●●●●●●●●●●●●
●●
●●
●
●●
●●
●
●●
●●
●
● ●●
●
●
●●
●●
●
●
Ne, Z = 10Samson2002Suzuki2003Watson1972BiggsG4BiggsEPDL
Fig. 31. Total photoionization cross section for neon as a function of photonenergy, below 100 eV: original and modified Biggs-Lighthill parameterizationsexhibit different behavior with respect to experimental data.
0.02 0.04 0.06 0.08 0.10
0
10
20
30
40
E (keV)
Cro
ss s
ectio
n (
Mb)
●● ●● ●●● ●●● ●
●
●
●
●
●
●●●●●●●●
●●●●●●●●●●●●●●●●●●●●●●●●●●●●●●●●●●●●●●●●●●●●●●●●●●●●●●●●●●●●●●●●●●●●●●●● ● ● ● ● ● ● ●● ● ● ● ● ● ●
●●●●●
●●●●●●●
●
●●●●
●●
●●
●
●
●
●
●●●●●●●●●●●●●●●●●●●●●●●●●●●●●●●●●●●●●●●●●●●●●●●●●●●●●●●●●●●●●●●●●
●
●
Ar, Z = 18Lukirskii1963Samson2002Suzuki2005Watson1972BiggsG4BiggsEPDL
Fig. 32. Total photoionization cross section for argon as a function of photonenergy, below 100 eV: original and modified Biggs-Lighthill parameterizationsexhibit different behavior with respect to experimental data.
cross section compilations currently used in general purposeMonte Carlo codes.
The total cross section compilations listed in Table IVcover different energy ranges, therefore the evaluation of theirintrinsic capabilities requires specific validation tests limitedto the energy range of applicability of each of them.
Efficiencies pertinent to each cross section model are re-ported in detail in the following subsections; they are cal-culated over the subset of the experimental data sampleconsistent with the applicability of each model. The associatedtables show the model especially addressed in each test initalic.
The compatibility with experiment of each specialized crosssection model has been compared with that of EPDL, which isthe compilation with the highest efficiency in Table IV, limitedto the energy range where the model subject to evaluation isapplicable. The results of the statistical analysis that addressesthis issue are summarized in Table X; they are discussed in

18
detail in the following subsections.1) Brennan and Cowan’s cross sections: these cross sec-
tions cover the energy range between 30 eV and 700 keV, andare limited to atomic number greater than 2. The efficiencieslisted in Table XI show lower capability of Brennan andCowan’s cross sections with respect to other compilationsapplicable to this energy range.
According to the results of the categorical analysis listed inTable X, the compatibility with experiment of these cross sec-tions and EPDL ones is rejected with 0.01 significance, bothover the entire energy interval of applicability and excludingtest cases in the lower energy end.
From this analysis one can infer that Brennan and Cowan’scalculations do not achieve greater accuracy than Scofield’s1973 non-relativistic ones tabulated in EPDL.
TABLE XITOTAL CROSS SECTIONS: EFFICIENCY BETWEEN 30/150 EV AND 700 KEV
Emin = 10 eV Emin = 150 eV
Model Pass Fail Efficiency Pass Fail Efficiency
BiggsG4 38 23 0.62 ± 0.06 37 16 0.70 ± 0.06Biggs 38 23 0.62 ± 0.06 40 13 0.75 ± 0.06Brennan 26 35 0.43 ± 0.06 27 26 0.51 ± 0.07EPDL 42 19 0.69 ± 0.06 42 11 0.79 ± 0.06
2) Chantler’s total cross sections: these calculations coverenergies between 10 eV and 433 keV. The efficiency of thecross section models applicable in this energy range is reportedin Table XII: it is lower for Chantler’s cross sections thanfor other options applicable to this energy interval. The p-values listed in Table X show that the hypothesis of equivalentcompatibility with experiment of Chantler’s cross sectionswith respect to EPDL ones is rejected by all tests, both overthe entire energy interval and excluding the lower energy end.
TABLE XIITOTAL CROSS SECTIONS: EFFICIENCY BETWEEN 10/150 EV AND 433 KEV
Emin = 10 eV Emin = 150 eV
Model Pass Fail Efficiency Pass Fail Efficiency
BiggsG4 34 24 0.50 ± 0.06 36 15 0.71 ± 0.06Biggs 35 33 0.51 ± 0.06 39 12 0.76 ± 0.06Chantler 24 44 0.35 ± 0.06 27 24 0.53 ± 0.07EPDL 40 28 0.59 ± 0.06 41 10 0.80 ± 0.06
3) Ebel’s total cross sections: this parameterization isapplicable to energies between 1 keV and 300 keV. Theefficiencies listed in Table XIII, which are calculated forall compilations covering this energy range, show similarcompatibility with experiment for Ebel’s and EPDL crosssections, which is confirmed by the statistical comparison ofthe two categories in Table X.
4) Elam’s and Veigele’s cross sections: they cover energiesbetween 100 eV and 1 MeV. The efficiencies of the modelsapplicable in this energy range are listed in Table XIV. Theresults of the categorical analysis in Table X show that thehypothesis of equivalent compatibility with experiment as forEPDL cross sections is rejected for Veigele’s cross sections,while it is not rejected for Elam’s.
TABLE XIIITOTAL CROSS SECTIONS: EFFICIENCY BETWEEN 1 KEV AND 300 KEV
Model Pass Fail Efficiency
BiggsG4 22 8 0.73 ± 0.08Biggs 22 8 0.73 ± 0.08Brennan 19 11 0.63 ± 0.08Chantler 17 13 0.57 ± 0.09Ebel 24 6 0.80 ± 0.07Elam 23 7 0.77 ± 0.08EPDL 25 5 0.83 ± 0.07PHOTX 23 7 0.77 ± 0.08Scofield 23 7 0.77 ± 0.08Storm 19 11 0.63 ± 0.08Veigele 17 13 0.57 ± 0.09XCOMDB 21 9 0.70 ± 0.08XCOM 24 6 0.80 ± 0.08
TABLE XIVTOTAL CROSS SECTIONS: EFFICIENCY BETWEEN 100 EV AND 1 MEV
Model Pass Fail Efficiency
BiggsG4 40 24 0.63 ± 0.06Biggs 48 16 0.75 ± 0.05Elam 40 24 0.63 ± 0.06EPDL 49 15 0.77 ± 0.05Veigele 30 34 0.47 ± 0.06
5) Henke’s cross sections: this model covers energies be-tween 10 eV and 30 keV. The efficiencies for the totalcross section models applicable to these energies are listedin Table XV, which also reports values for photon energiesabove 150 eV. Henke’s efficiency is lower; nevertheless thetests summarized in Table X do not reject the hypothesisof equivalent compatibility with experiment for Henke’s andEPDL cross sections with 0.01 significance.
It is worth remarking that all models appear inadequate atreproducing experimental measurements in the lower energyrange, while they perform better above 150 eV. Chantler’scalculations remain largely incompatible with experiment evenin the higher energy interval.
TABLE XVTOTAL CROSS SECTIONS: EFFICIENCY BETWEEN 10/150 EV AND 30 KEV
Emin = 10 eV Emin = 150 eV
Model Pass Fail Efficiency Pass Fail Efficiency
BiggsG4 18 33 0.35 ± 0.07 20 14 0.59 ± 0.08Biggs 19 32 0.37 ± 0.07 23 11 0.68 ± 0.08Chantler 7 44 0.14 ± 0.05 10 24 0.29 ± 0.08EPDL 23 28 0.45 ± 0.07 24 10 0.71 ± 0.08Henke 15 36 0.29 ± 0.06 15 19 0.44 ± 0.08RTAB 24 27 0.47 ± 0.07 23 11 0.68 ± 0.08
6) RTAB total cross sections: this compilation covers en-ergies between approximately 10 eV and 300 keV. The effi-ciencies for the total cross section models applicable to theseenergies are listed in Table XVI, which also reports values forphoton energies above 150 eV. The efficiency for RTAB crosssections is similar to that obtained with EPDL; the resultsof the statistical analysis of the related contingency table areconsistent with this observation.
It is worth remarking that all models appear inadequate at

19
TABLE XVITOTAL CROSS SECTIONS: EFFICIENCY BETWEEN 10/150 EV AND 300 KEV
Emin = 10 eV Emin = 150 eV
Model Pass Fail Efficiency Pass Fail Efficiency
BiggsG4 29 34 0.46 ± 0.06 31 15 0.67 ± 0.07Biggs 30 33 0.48 ± 0.06 34 12 0.74 ± 0.06Chantler 19 44 0.30 ± 0.06 22 24 0.48 ± 0.07EPDL 35 28 0.56 ± 0.06 36 10 0.78 ± 0.06Penelope 37 26 0.59 ± 0.06 36 10 0.78 ± 0.06RTAB 36 27 0.57 ± 0.06 35 11 0.76 ± 0.06
reproducing experimental measurements in the lower energyrange, while they perform better above 150 eV. Chantler’scalculations remain largely incompatible with experiment evenin the higher energy interval.
7) XCOMBD cross sections: this compilation, encom-passed in the DABAX database, concerns energies between1 keV and 500 keV. The efficiencies of the applicable totalcross section models are listed in Table XVII. Neither thetests on contingency tables concerning XCOMDB and EPDL(reported in Table X), nor those concerning XCOMDB and thestandard XCOM tabulation reject the hypothesis of equivalentcompatibility with experiment.
The different efficiency for cross sections based onXCOMDB and standard XCOM tabulations could derive froma different energy grid of the two tabulations, which affectsthe cross section values calculated by interpolation, or from adifferent version of XCOM used as a basis for XCOMDB. TheXCOM version used for creating the XCOMDB tabulationscould not be retrieved in the DABAX documentation.
TABLE XVIITOTAL CROSS SECTIONS: EFFICIENCY BETWEEN 1 KEV AND 500 KEV
Model Pass Fail Efficiency
BiggsG4 27 8 0.77 ± 0.07Biggs 27 8 0.77 ± 0.07Brennan 22 13 0.63 ± 0.08Elam 28 7 0.80 ± 0.07EPDL 30 5 0.86 ± 0.06PHOTX 28 7 0.80 ± 0.07Scofield 28 7 0.80 ± 0.07Storm 24 11 0.69 ± 0.08Veigele 22 13 0.63 ± 0.08XCOMDB 26 9 0.74 ± 0.07XCOM 29 6 0.83 ± 0.06
The quantitative validation analysis documented here showsthat none of the specialized cross section models providesbetter accuracy than EPDL tabulations: some of them exhibitsignificantly worse compatibility with experiment, while oth-ers are at most statistically equivalent to EPDL at reproducingexperimental measurements. Therefore their use in their spe-cific range of applicability at the place of EPDL would notimprove the accuracy of general purpose Monte Carlo codes.
D. Evaluation of total cross sections at low energy
The results documented in the previous sections hint thatneither the models applicable to an extended energy range nor
0.07 0.08 0.09 0.10 0.11
0
1
2
3
E (keV)
Cro
ss s
ectio
n (
Mb)
●●
●●
●
●
●
●
●
Li, Z = 3, KMehlman1982ChantlerEPDLRTABscRTAB
Fig. 33. Cross section for the photoionization of the K shell of lithium as afunction of photon energy.
those covering specific energies appear capable of reproducingcross sections measurements at low energies.χ2 tests performed over a data sample with energies be-
tween 10 eV and 150 eV quantify the capability of all modelsapplicable in that energy range to reproduce experimental data.The resulting efficiencies are documented in Table XVIII;they confirm that none of the cross section compilation issuitable for accurate simulation of the photoelectric effect inthis energy range.
TABLE XVIIIEFFICIENCY OF TOTAL CROSS SECTION MODELS IN THE LOW ENERGY
RANGE
10-100 eV 10-150 eV
Model Pass Fail Efficiency Pass Fail Efficiency
BiggsG4 9 22 0.29 ± 0.08 7 28 0.20 ± 0.07Biggs 5 26 0.16 ± 0.07 8 27 0.23 ± 0.07Chantler 4 27 0.13 ± 0.08 5 30 0.14 ± 0.06EPDL 8 23 0.26 ± 0.06 10 25 0.29 ± 0.07Henke 9 22 0.29 ± 0.08 11 24 0.31 ± 0.08Penelope 10 21 0.32 ± 0.08 12 23 0.34 ± 0.08RTAB 10 21 0.32 ± 0.08 12 23 0.34 ± 0.08
VIII. RESULTS OF PARTIAL CROSS SECTION VALIDATION
Figs. 33 to 51 illustrate some examples of calculated andexperimental cross sections for inner and outer shell photoion-ization.
A systematic discrepancy of RTAB shell cross sections withrespect to experimental data is observed, which hints at amissing multiplicative factor in the tabulated values. RTABcross sections scaled by the presumed missing factor areidentified in figures and in the following tables as “scRTAB”.
A. K shell
All but one of the experimental data sets concern energiesabove 1 keV.

20
100 200 500 1000
0.0
0.5
1.0
1.5
2.0
2.5
3.0
E (keV)
Cro
ss s
ectio
n (
kb)
●
● ● ● ●●● ● ●● ● ● ●●● ● ●
●
●
●
●
●
Ta, Z = 73, KGowda1973Gowda1974bNayak2006Nayak2007Ranganath1978Ranganathaiah1979Ranganathaiah1981ChantlerEbelEPDLRTABscRTAB
Fig. 34. Cross section for the photoionization of the K shell of tantalum asa function of photon energy.
100 200 500 1000
0.0
0.5
1.0
1.5
2.0
E (keV)
Cro
ss s
ectio
n (
kb)
●● ● ●● ● ● ●●● ●
●
● ● ● ● ●●● ●
●
●
●
●
Au, Z = 79, KGowda1974bNayak2006Nayak2007Pratt1964Ranganathaiah1979Ranganathaiah1981ChantlerEbelEPDLRTABscRTAB
Fig. 35. Cross section for the photoionization of the K shell of gold as afunction of photon energy.
100 200 500 1000 2000
0.0
0.5
1.0
1.5
2.0
E (keV)
Cro
ss s
ectio
n (
kb)
●
●● ●● ●●●● ● ● ●●●●●●●● ●
●●
● ●●●
●
●
●
●
●
Pb, Z = 82, KBleeker1962Ghose1966Gowda1973Gowda1974bNayak2006Nayak2007Pratt1964Ranganath1978Ranganathaiah1979Ranganathaiah1981ChantlerEbelEPDLRTABscRTAB
Fig. 36. Cross section for the photoionization of the K shell of lead as afunction of photon energy.
30 40 50 60 70
0.0
0.5
1.0
1.5
2.0
2.5
3.0
Atomic number
Cro
ss s
ectio
n (
kb)
● ● ● ●● ● ●
●●●●●●●●●●●●
●●●●
●●●●
●●●
●●●
●●●●●●●●●●
●
●●●●●●●
●●●
●●●
●
●●
●●●
●●
●●
●
●
●
E = 59.54 keV, KArora1981Karabulut2005ChantlerEbelEPDLRTABscRTAB
Fig. 37. Cross section for the photoionization of the K shell at 59.54 keVas a function of the atomic number.
30 40 50 60 70 80 90
0
10
20
30
40
Atomic number
Cro
ss s
ectio
n (
b)
●●
●●
●
●
●
●
E = 411.8 keV, KGowda1974bChantlerEPDL
Fig. 38. Cross section for the photoionization of the K shell at 411.8 keVas a function of the atomic number.
50 60 70 80 90
0
1
2
3
4
5
6
Atomic number
Cro
ss s
ectio
n (
b)
●
●
●●
●●●●
●
●●
●
●●
●
●●
●
E = 1330 keV, KBleeker1962Ghose1966Ranganathaiah1981EPDL
Fig. 39. Cross section for the photoionization of the K shell at 1.33 MeVas a function of the atomic number.

21
Only the compilations based on Scofield’s 1973 non-relativistic calculations cover the whole energy range of theexperimental data sample above 1 keV; their efficienciesare listed in Table XIX. The lower efficiency obtained withPHOTX is related to the characteristics of the energy gridover which cross sections are tabulated.
TABLE XIXK SHELL CROSS SECTION EFFICIENCY OF MODELS BASED ON SCOFIELD
1973 NON-RELATIVISTIC CALCULATIONS
Model Pass Fail Efficiency
EPDL 62 17 0.78 ± 0.05Penelope 62 17 0.78 ± 0.05PHOTX 52 27 0.66 ± 0.05Scofield 62 17 0.78 ± 0.05
Chantler’s, EPDL and scRTAB models are applicable tothe single set of measurements below 1 keV retrieved fromthe literature; according to the outcome of the χ2 test, theircalculations are compatible with the experimental data set with0.01 significance.
The capabilities of Chantler’s, Ebel’s and scRTAB models,which are limited to a specific energy range, are evaluatedby restricting the χ2 test of comparison with experiment tothe data sample consistent with their coverage. The resultingefficiencies, calculated within 1 keV and 300 keV, which cor-respond to the coverage of Ebel’s model, are reported in TableXX. Since the experimental data sample includes no additionalmeasurements between 300 keV and 433 keV, which is thehighest energy tabulated by Chantler’s calculations, the resultsin Table XX express the outcome of the validation test for thismodel too.
TABLE XXEFFICIENCY OF K SHELL CROSS SECTION MODELS FOR ENERGIES
BETWEEN 1 KEV AND 300 KEV
Model Pass Fail Efficiency
Chantler 45 13 0.78 ± 0.05Ebel 50 8 0.86 ± 0.05EPDL 45 13 0.78 ± 0.05Penelope 45 13 0.78 ± 0.05PHOTX 47 11 0.81 ± 0.05scRTAB 45 13 0.78 ± 0.05Scofield 45 13 0.78 ± 0.05
Ebel’s parameterization appears more efficient than EPDLtabulations at reproducing experimental K shell cross sectionsin the energy range between 1 and 300 keV; nevertheless,the hypothesis of equivalent compatibility with experimentfor these K shell cross section models is not rejected byany of the tests applied to the analysis of the associatedcontingency table with 0.01 significance. The failures ofEPDL-based cross sections at reproducing experimental datamostly concern test cases close to absorption edges. Issuesabout the accuracy of related calculations of atomic bindingenergies collected in EADL (Evaluated Atomic Data Library)[267] were documented in [22]; as discussed in section VI-B, experimental measurements in these regions are delicate, as
0.02 0.04 0.06 0.08 0.10 0.12
0
200
400
600
800
E (keV)
Cro
ss s
ectio
n (
kb)
●
●●
●
●
●
Ne, Z = 10, L1Codling1976EPDLRTABscRTAB
Fig. 40. Cross section for the photoionization of the L1 subshell of neon asa function of photon energy.
realistic estimates of experimental uncertainties are prone to beaffected by systematic effects deriving from the experimentalenvironment.
B. L shell
All L subshell measurements included in the experimentaldata sample concern energies between 1 keV and 300 keV,with the exception of one set of L1 cross section data, whichencompasses lower energy measurements.
Efficiencies above 1 keV are reported in Table XXI for allmodels dealing with L subshells. All cross section modelsare equally capable of reproducing the measurements in theexperimental data sample.
TABLE XXIEFFICIENCY OF L SHELL CROSS SECTION MODELS ABOVE 1 KEV
Subshell Model Pass Fail Efficiency
L1
Ebel 24 0 1.00 - 0.04EPDL 24 0 1.00 - 0.04Penelope 24 0 1.00 - 0.04PHOTX 24 0 1.00 - 0.04scRTAB 24 0 1.00 - 0.04Scofield 24 0 1.00 - 0.04
L2
Ebel 23 1 0.96 ± 0.04EPDL 23 1 0.96 ± 0.04Penelope 23 1 0.96 ± 0.04PHOTX 23 1 0.96 ± 0.04scRTAB 23 1 0.96 ± 0.04Scofield 23 1 0.96 ± 0.04
L3
Ebel 27 0 1.00 - 0.03EPDL 27 0 1.00 - 0.03Penelope 27 0 1.00 - 0.03PHOTX 27 0 1.00 - 0.03scRTAB 27 0 1.00 - 0.03Scofield 27 0 1.00 - 0.03
The hypothesis of compatibility with the single experimentaldata set including measurements below 1 keV is rejected forall models subject to evaluation. Nevertheless, no conclusionsregarding the capabilities of the cross section models at lower

22
40 45 50 55 60 65 70
0
50
100
150
200
250
Atomic number
Cro
ss s
ectio
n (
b)
● ● ● ● ●●
●●
●●
●●
●
●●
●●
●●
●●
●●
●
●
E = 59.54 keV, L1Karabulut2005EbelEPDLRTABscRTAB
(a) L1 subshell
40 45 50 55 60 65 70
0
20
40
60
80
100
120
Atomic number
Cro
ss s
ectio
n (
b)
● ● ● ● ● ● ● ● ● ● ●●
●
●●
●
●
●
●
●
●
●
●
●
●
E = 59.54 keV, L2Karabulut2005EbelEPDLRTABscRTAB
(b) L2 subshell
40 45 50 55 60 65 70
0
50
100
150
Atomic number
Cro
ss s
ectio
n (
b)
● ● ● ● ● ● ● ● ● ●●
●●
●●
●●
●
●
●
●
●
●
●
●
E = 59.54 keV, L3Karabulut2005EbelEPDLRTABscRTAB
(c) L3 subshell
Fig. 41. Cross section for the photoionization of the L shell at 59.54 keVas a function of the atomic number.
energies can be inferred from such a limited test; the failureover a single experimental data set could be due either todeficiency of the models or to systematic effects affecting themeasurements, which cannot be investigated in terms of con-sistency with other, independent experimental measurements.
C. Outer shells
The cross sections for outer shells appear incompatible withexperiment; the χ2 test rejects the hypothesis of compatibilitybetween calculated and experimental cross sections in mosttest cases. Nevertheless, caution should be exercised in draw-ing general conclusions from these results, as the experimentaldata sample for the validation of outer shells is small and for agiven test case the available data often originate from a singleexperimental source. This test scenario is prone to be affectedby systematic effects, which would hinder the reliability of theoutcome of the statistical analysis.
Firm conclusions about the accuracy of cross section calcu-lations for outer shells would require more extensive experi-mental data samples.
IX. QUALITATIVE EVALUATION OF PHOTOELECTRONANGULAR DISTRIBUTION
A preliminary appraisal of photoelectron angular distri-bution models has been performed, limited to the differentoptions implemented in Geant4 and GEANT 3. Inconsistenciesin the analytical formula of the latter appearing in the softwaredocumentation have been corrected in the implementation usedfor this evaluation.
Reports of direct measurements of photoelectron angulardistribution are scarce in the literature; the narrow scope of theexperimental data sample we could retrieve from the literatureand the lack of adequate detail on the characteristics of thereported measurements prevent a meaningful statistical studyfor the validation of the models used in general purpose MonteCarlo codes.
Figs. 52 and 53 show qualitative comparisons of photo-electron angular distribution models implemented in Geant4and GEANT 3 with experimental data; discrepancies arevisible, both between calculations and experimental data andbetween the outcome of different model implementations,which suggest that further quantitative investigation would beuseful. In the scenarios corresponding to the limited exper-imental sample retrieved from the literature, Geant4 angulardistribution models exhibit similar behaviour; the correctedGEANT 3 model appears in some cases different from theothers and qualitatively closer to measurements. Nevertheless,no conclusions can be drawn from such a narrow, qualitativetest.
An indirect investigation of photoelectric differential crosssection models could be pursued through testing the so-called“asymmetry parameter” [5]; due to its complexity, this studyshould be considered as the subject of a dedicated paper.
X. CONCLUSION
An extensive set of cross section models for the simulationof photoionization has been quantitatively evaluated regarding

23
0.07 0.08 0.09 0.10 0.11 0.12
0
100
200
300
400
500
600
E (keV)
Cro
ss s
ectio
n (
kb)
● ● ●●
●●
●●
●●
●
Ca, Z = 20, M1Bizau1987EPDLRTABscRTAB
(a) Argon (Z=18)
0.04 0.05 0.06 0.07 0.08 0.10
0
100
200
300
400
500
E (keV)
Cro
ss s
ectio
n (
kb)
●●●●●●
●●●●● ● ●● ● ● ●
●● ●
●
●
●
●
●
Ar, Z = 18, M1Mobus1993Samson1974EPDLRTABscRTAB
(b) Calcium (Z=20)
0.15 0.20 0.25
0
100
200
300
400
E (keV)
Cro
ss s
ectio
n (
kb) ●
●
●
●
●●
●
●
Mn, Z = 25, M1Jimenez1989EPDLRTABscRTAB
(c) Manganese (Z=25)
Fig. 42. Cross section for the photoionization of the M1 subshell of argon,calcium and manganese as a function of energy.
0.7 0.8 0.9 1.0
0.0
0.5
1.0
1.5
2.0
E (keV)
Cro
ss s
ectio
n (
Mb)
●●
●
●●
●●
●●
●●
●●
●
●
Xe, Z = 54, M4Becker1987EPDLRTABscRTAB
Fig. 43. Cross section for the photoionization of the M4 subshell of xenonas a function of photon energy.
0.7 0.8 0.9 1.0
0.0
0.5
1.0
1.5
2.0
2.5
3.0
3.5
E (keV)
Cro
ss s
ectio
n (
Mb)
● ●● ● ● ●
●●
●●
●● ● ● ● ●
●●
●
Xe, Z = 54, M5Becker1987EPDLRTABscRTAB
Fig. 44. Cross section for the photoionization of the M5 subshell of xenonas a function of photon energy.
0.04 0.06 0.08 0.10 0.12
0
100
200
300
400
E (keV)
Cro
ss s
ectio
n (
kb)
●● ●
● ● ● ●●● ●
● ●
●
Ca, Z = 20, N1Bizau1987EPDLRTABscRTAB
Fig. 45. Cross section for the photoionization of the N1 subshell of calciumas a function of photon energy.

24
6 8 10 12 14
0
1
2
3
4
5
E (keV)
Cro
ss s
ectio
n (
kb)
●●●
●
●● ● ● ●
●
Au, Z = 79, N6Kunz2005EbelEPDLRTABscRTAB
Fig. 46. Cross section for the photoionization of the N6 subshell of gold asa function of photon energy.
6 8 10 12 14
0
1
2
3
4
5
6
E (keV)
Cro
ss s
ectio
n (
kb)
●●●
●
●● ● ● ●
●
Au, Z = 79, N7Kunz2005EbelEPDLRTABscRTAB
Fig. 47. Cross section for the photoionization of the N7 subshell of gold asa function of photon energy.
0.07 0.08 0.09 0.10 0.11 0.12
0.0
0.2
0.4
0.6
0.8
1.0
1.2
E (keV)
Cro
ss s
ectio
n (
Mb)
● ●● ●●●●●●●●●●●●●●●● ●●●● ●●●●●
●
Ba, Z = 56, O1Bizau1989EPDLRTABscRTAB
Fig. 48. Cross section for the photoionization of the O1 subshell of bariumas a function of photon energy.
6 8 10 12 14
0.0
0.5
1.0
1.5
2.0
2.5
E (keV)
Cro
ss s
ectio
n (
kb)
●●●
●
●●
● ● ●
●
Au, Z = 79, O1Kunz2005EbelEPDLRTABscRTAB
Fig. 49. Cross section for the photoionization of the O1 subshell of gold asa function of photon energy.
6 8 10 12 14
0.0
0.5
1.0
1.5
2.0
2.5
3.0
E (keV)
Cro
ss s
ectio
n (
kb)
●●●
●
●●
● ● ●
●
Au, Z = 79, O2Kunz2005EbelEPDLRTABscRTAB
Fig. 50. Cross section for the photoionization of the O2 subshell of gold asa function of photon energy.
6 8 10 12 14
0
1
2
3
4
5
E (keV)
Cro
ss s
ectio
n (
kb)
●●●
●
●●
● ● ●
●
Au, Z = 79, O3Kunz2005EbelEPDLRTABscRTAB
Fig. 51. Cross section for the photoionization of the O3 subshell of gold asa function of photon energy.

25
0 30 60 90 120 150 180
0.0
0.2
0.4
0.6
0.8
1.0
! angle (degrees)
Nor
mar
ilzed
cro
ss s
ectio
n Exp. G4Polar G4Sauter GEANT 3
AluminiumK-shell1170 keV
Fig. 52. Photoelectron angular distribution for aluminium, K shell, at 1.17MeV.
0 30 60 90 120 150 180
0.0
0.2
0.4
0.6
0.8
1.0
! angle (degrees)
Nor
mar
ilzed
cro
ss s
ectio
n
Exp. G4Polar G4Sauter GEANT 3
GoldL2-shell412 keV
Fig. 53. Photoelectron angular distribution for gold, L2 subshell, at 412 keV.
their accuracy at reproducing experimental measurements.Since the validation analysis documented in this paper con-cerns cross section data libraries and parameterization meth-ods, which are (and can be) used by any Monte Carlo codes,rather than specific implementations of the photoelectric effect,its results, and the recommendations which derive from them,are of general relevance for the simulation of the photoelectricteffect.
Statistical tests against a large sample of total and partialcross section measurements demonstrate that tabulations basedon Scofield’s 1973 non-relativistic calculations, which cover anextended range of energies starting from a few electronvolts,achieve the best overall capability to reproduce experimentamong the models subject to test. Small differences in theresults of goodness-of-fit tests are observed across differentcompilations (EPDL, Penelope database, PHOTX, XCOM)based on the same theoretical calculation method; they appearrelated to the granularity of the tabulations.
Some discrepancies with experiment of EPDL-based K shellcross sections are observed close to absorption edges, whichcould be related to intrinsic limitations of the calculations, alsohighlighted in the evaluation of related calculations of atomicbinding energies; nevertheless, the possibility of systematic
effects in these delicate measurements suggests caution indrawing conclusions about the reliability of EPDL in theproximity of absorption edges.
No other photoelectric cross section calculation methods,among those considered in this study, demonstrate statisti-cally better accuracy than EPDL tabulations: neither theoret-ical calculations, including relativistic ones, nor empirical ortheory-driven analytical parameterizations. The validation testsdocumented in this paper demonstrate that the compatibilitywith experiment of some of them is significantly worse thanthat of EPDL, while it is statistically equivalent for others,although restricted to the energy range they cover. Only K-shell cross sections based on Ebel’s parameterization producemore accurate results than EPDL in some test cases close toabsorption edges, although the difference in compatibility withexperiment with respect to EPDL is not statistically significant.
Special attention has been devoted to the evaluation of totalcross sections based on Biggs and Lighthill’s parameterization,which is extensively used in Geant4. While the original set ofparameterization coefficients produces cross sections that arestatistically equivalent to EPDL regarding compatibility withexperiment, the modified coefficients implemented in Geant4significantly worsen the resulting cross section compatibilitywith experimental measurements above a few tens of elec-tronvolt. The original and modified parameterization producestatistically equivalent compatibility with experiment belowa few tens of electronvolt; both parameterizations, as wellas other total cross section models, exhibit low efficiency inthat energy range. As a result of this validation test, it isrecommended that future versions of Geant4 revert to using theoriginal coefficients of Biggs and Lighthill parameterizationabove a few tenso of electronvolt, unless a new, more accurateparameterization is developed and quantitatively demonstratedto improve compatibility with experiment over the originalone. The suggestion to implement this modification in Geant4version 10.2, which is in preparation at the time of writingthis paper, has been conveyed to the maintainers of therelated Geant4 code. Given that EPDL photoelectric crosssections are already used in other Geant4 models [93], theburden of maintaining alternative cross sections based onBiggs-Lighthill’s parameterization should be considered aswell, as this validation test has demonstrated that even theoriginal parameterization is not statistically superior to EPDLin reproducing experimental data.
The validation tests show that in the low energy endcross sections based on Scofield’s non-relativistic calculationsproduce results consistent with experiment with 0.01 sig-nificance down to approximately 150 eV. Nevertheless, thelimited representativity of the experimental data sample, whichonly includes noble gases and hydrogen, suggests caution atextrapolating this result to experimental scenarios involvingsolid targets.
No model, among those considered in this validation study,is able to reproduce experimental data consistently belowapproximately 150 eV. Their failure at low energies reflectsthe inadequacy of theoretical calculations in independent par-ticle approximation and of the assumption of isolated atomsadopted in general purpose Monte Carlo codes, in conditions

26
where effects related to the structure of the interacting materialshould be taken into account.
The quantitative results of the validation tests documentedin this paper allow Monte Carlo code developers and experi-mental users to base the selection of physics models in theirsimulations on sound scientific grounds.
ACKNOWLEDGMENT
The authors are grateful to Lynn Kissel for providing a copyof the RTAB database. The authors thank Sergio Bertoluccifor support, Vladimir Grichine and Georg Weidenspointnerfor valuable discussions, and Anita Hollier for proofreadingthe manuscript. The CERN Library has provided helpfulassistance and essential reference material for this study.
REFERENCES
[1] R. H. Pratt, A. Ron, and H. K. Tseng, “Atomic photoeffect above 10keV”, Rev. Mod. Phys., vol. 45, 273-325, 1973.
[2] R. H. Pratt, A. Ron, and H. K. Tseng, “Erratum: Atomic photoeffectabove 10 keV”, Rev. Mod. Phys., vol. 45, 663-664, 1973.
[3] J. A. R. Samson, “Photoionization of atoms and molecules”, Phys.Rep., vol. 28, no. 4, pp. 303-354, 1976.
[4] H. P. Kelly, “Review of our present understanding of the photoion-ization process for atoms”, AIP Conf. Proc., vol. 215, pp. 292-311,1990.
[5] A. F. Starace, “Atomic photoionization”, in Fundamental processesin energetic atomic collisions, ed. H. O. Lutz, J. S. Briggs and H.Kleinpoppin, New York, Plenum Press, 1983.
[6] A. F. Starace, “Photoionization of atoms”, in Atomic, Molecular andOptical Physics Handbook, Springer, Berlin, pp. 379-390, 2006.
[7] M. Y. Amusia, “Atomic Photoeffect”, Plenum, New York, 1990.[8] J. Berkowitz, “Atomic and Molecular Photoabsorption”, Academic
Press, London, 2002.[9] J. H. Hubbell, “Review and history of photon cross section calcula-
tions”, Phys. Med. Biol., vol. 51, pp. R245-R262, 2006.[10] J. J. De Marco et al., “An analysis of MCNP cross-sections and tally
methods for low-energy photon emitters”, Phys. Med. Biol., vol. 47,pp. 1321-1332, 2002.
[11] K. Amako et al., “Comparison of Geant4 electromagnetic physicsmodels against the NIST reference data”, IEEE Trans. Nucl. Sci., vol.52, no. 4, pp. 910-918, 2005.
[12] H. Zaidi, “Comparative evaluation of photon cross section libraries formaterials of interest in PET Monte Carlo simulation”, IEEE Trans.Nucl. Sci., vol. 47, no. 6, pp. 2722-2735, 2000.
[13] U. Chica, M. Anguiano, and A. M. Lallena, “Benchmark of PENE-LOPE for low and medium energy X-rays”, Phys. Med., vol. 25, no.2, pp. 51-57, 2009.
[14] H. Hirayama, Y. Namito, A. F. Bielajew, S. J. Wilderman, and W.R. Nelson, “The EGS5 Code System”, SLAC-R-730 Report, Stanford,CA, 2006.
[15] T. G. Trucano, L. P. Swiler, T. Igusa, W. L. Oberkampf, and M. Pilch,“Calibration, validation, and sensitivity analysis: Whats what”, Reliab.Eng. Syst. Safety, vol. 91, no. 10-11, pp. 1331-1357, 2006.
[16] G. A. P. Cirrone, G. Cuttone, F. Di Rosa, L. Pandola, F. Romano, andQ. Zhang, “Validation of the Geant4 electromagnetic photon cross-sections for elements and compounds”, Nucl. Instr. Meth. A, vol. 618,pp. 315-322, 2010.
[17] S. Agostinelli et al., “Geant4 - a simulation toolkit” Nucl. Instrum.Meth. A, vol. 506, no. 3, pp. 250-303, 2003.
[18] J. Allison et al., “Geant4 Developments and Applications” IEEE Trans.Nucl. Sci., vol. 53, no. 1, pp. 270-278, 2006.
[19] S. Guatelli, A. Mantero, B. Mascialino, P. Nieminen, and M. G. Pia,“Geant4 Atomic Relaxation”, IEEE Trans. Nucl. Sci., vol. 54, no. 3,pp. 585-593, 2007.
[20] S. Guatelli et al., “Validation of Geant4 Atomic Relaxation against theNIST Physical Reference Data”, IEEE Trans. Nucl. Sci., vol. 54, no.3, pp. 594-603, 2007.
[21] M. G. Pia, P. Saracco, and M. Sudhakar, “Validation of K and L ShellRadiative Transition Probability Calculations”, IEEE Trans. Nucl. Sci.,vol. 56, no. 6, pp. 3650-3661, 2009.
[22] M. G. Pia et al., “Evaluation of atomic electron binding energies forMonte Carlo particle transport”, IEEE Trans. Nucl. Sci., vol. 58, no. 6,pp. 3246-3268, 2011.
[23] H. Hirayama and Y. Namito, “Implementation of a General Treatmentof Photoelectric-Related Phenomena for Compounds or Mixtures inEGS4”, KEK Internal 2000-3 Report, Tsukuba, Japan, 2000.
[24] H. Hirayama and Y. Namito, “Implementation of a General Treatmentof Photoelectric-Related Phenomena for Compounds or Mixtures inEGS4 (Revised Version)”, KEK Internal 2004-6 Report, Tsukuba,Japan, 2004.
[25] R. H. Pratt, “Atomic photoelectric effect at high energies”, Phys. Rev.,vol. 117, pp. 1017-1028, 1960.
[26] R. H. Pratt, “K-Shell Photoelectric Cross Sections from 200 keV to 2MeV”, Phys. Rev., vol. 134, pp. A898-A915, 1964.
[27] G. Rakavy and A. Ron, “Atomic Photoeffect in the Range Eγ=1-2000 keV”, Phys. Rev., vol. 159, pp. 50-56, 1960.
[28] R. D. Schmickley and R. Pratt, “K-, L-, and M-shell atomic photoeffectfor screened-potential models”, Phys. Rev., vol. 164, pp. 104-116, 1967.
[29] J. H. Scofield, “Theoretical photoionization cross sections from 1 to1500 keV”, Report UCRL-51326, Lawrence Livermore Laboratory,1973.
[30] C. T. Chantler, “Theoretical form factor, attenuation and scatteringtabulation for Z=1-92 from E=1-10 eV to E=0.4-1.0 MeV”, J. Phys.Chem. Ref. Data, vol. 24, no. 1, pp. 71-643, 1995.
[31] C. T. Chantler, “Detailed tabulation of atomic form factors, photo-electric absorption and scattering cross section, and mass attenuationcoefficients in the vicinity of absorption edges in the soft X-ray (Z=30-36, Z= 60-89, E= 0.1 keV-10 keV), addressing convergence issuesof earlier work”, J. Phys. Chem. Ref. Data, vol. 29, no. 4, pp. 597-1048,2000.
[32] J. H. Hubbell, “Photon Cross Sections, Attenuation Coefficients, andEnergy Absorption Coefficients from 10 keV to 100 GeV”, ReportNSRDS-NBS 29, National Bureau of Standards, Washington, DC(USA), 1969.
[33] F. Fischer, “Beitrage zur Theorie der Absorption vonRontgenstrahlung”, Ann. Phys., vol. 400, no. 7, pp. 821-850,1931.
[34] F. Sauter, Uber den atomaren Photoeffekt in der K-Schale nach derrelativistischen Wellenmechanik Diracs”, Ann. Phys., vol. 403, no. 4,pp. 454-488, 1931.
[35] F. Sauter, Uber den atomaren Photoeffekt bei großer Harte der anre-genden Strahlung”, Ann. Phys., vol. 401, no. 2, pp. 217-248, 1931.
[36] C. M. Davisson and R. D. Evans, “Gamma-Ray Absorption Coeffi-cients”, Rev. Mod. Phys. 24, vol. 79 , pp. 79-107, 1952.
[37] M. Gavrila, “Relativistic K-shell photoeffect”, Phys. Rev., vol. 113, pp.514-536, 1959.
[38] B. Nagel, “Angular distribution and polarization of K-shell photoelec-trons in the high energy limit”, Ark. Fys., vol. 24, pp. 151-159, 1963.
[39] M. Gavrila, “Relativistic L-shell photoeffect”, Phys. Rev., vol. 124, pp.1132-1141, 1961.
[40] W. H. McMaster, N. Kerr Del Grande, J. H. Mallet and J. H. Hubbell,“Compilation of X-ray cross sections”, Section II Revision 1, LawrenceLivermore National Laboratory Report UCRL-50174, 1969.
[41] W. H. McMaster, N. Kerr Del Grande, J. H. Mallet and J. H. Hubbell,“Compilation of x-ray cross sections UCRL-50174, sections I, IIrevision 1, III, IV”, Atom. Data Nucl. Data Tables, vol. 8, no. 4-6,pp. 443-444, 1970.
[42] A. Shaltout, H. Ebel, and R. Svagera, “Update of photoelectric absorp-tion coefficients in the tables of McMaster”, X-Ray Spectrom., vol. 35,pp. 52-56, 2006.
[43] E. Storm and H. I. Israel, “Photon cross sections from 1 keV to 100MeV for elements Z=1 to Z=100”, Atom. Data Nucl. Data Tables, vol.7, pp. 565-681, 1970.
[44] H. Brysk and C. Zerby, “Photoelectric cross sections in the keV range”,Phys. Rev., vol. 171, pp. 292-298, 1968.
[45] W. M. J. Veigele, “Photon cross sections from 0.1 keV to 1 MeV forelements Z = 1 to Z= 94”, Atom. Data Nucl. Data Tables, vol. 5, no.1, pp. 51-111, 1973.
[46] E. B. Saloman, J. H. Hubbell and J. H. Scofield, “X-Ray Attenuationcross sections for Energies 100 eV to 100 keV and Elements Z=1 toZ=92”, Atom. Data Nucl. Data Tables, vol. 38, pp. 1-197, 1988.
[47] E. B. Saloman and J. H. Hubbell, “X-ray attenuation coefficients (totalcross sections): Comparison of the experimental data base with therecommended values of Henke and the theoretical values of Scofieldfor energies between 0.1-100 keV”, Report NBSIR-86-3431, NationalBureau of Standards, Washington, DC (USA), 1986.

27
[48] F. Biggs and R. Lighthill, “Analytical Approximations For X-rayCross-sections”, Sandia National Laboratories Report SC-RR-66-452,Albuquerque, 1967.
[49] F. Biggs and R. Lighthill, “Analytical Approximations For X-ray Cross-sections II”, Sandia National Laboratories Report SC-RR-710507,Albuquerque, 1971.
[50] F. Biggs and R. Lighthill, “Analytical Approximations for X-RayCrossSections III” Sandia National Laboratories Report SAND87-0070, Albuquerque, 1988.
[51] B. L. Henke, P. Lee, T. Tanaka, R. L. Shimabukuro, and B. Fujikawa,“Low-energy X-ray interaction coefficients: Photoabsorption, scatter-ing, and reflection: E= 100-2000 eV Z= 1-94”, Atom. Data Nucl. DataTables, vol. 27, pp. 1-144, 1982.
[52] E. F. Plechaty, D. E. Cullen, and R. J. Howerton, “Tables and Graphs ofPhoton-Interaction Cross Sections From 0.1 keV to 100 MeV Derivedfrom the LLL Evaluated-Nuclear-Data Library”, UCRL-50400, Vol. 6,Rev. 2, Livermore National Laboratory, December 7, 1978).
[53] V. M. Grishin, A. P. Kostin, S. K. Kotelnikov and D. G. Streblechenko,Parametrization of the photoabsorption cross section at low energies”,Bull. Lebedev Inst., no. 6, pp. 1-6, 1994.
[54] B. L. Henke, E. M. Gullikson, and J. C. Davis “X-Ray Interactions:Photoabsorption, Scattering, Transmission, and Reflection at E = 50-30000 eV, Z = 1-92”, Atom. Data Nucl. Data Tables, vol. 54, no. 2,pp. 181-342, 1993.
[55] D. K. Trubey, M. J. Berger, and J. H. Hubbell, “Photon cross sectionsfor ENDF/B-VI”, Oak Ridge National Lab. Report CONF-890408-4,1989.
[56] “PHOTX: Photon Interaction Cross Section Library”, RSICC DataLibrary DLC-136, Oak Ridge National Lab., 1989.
[57] C. L. Dunford, “Evaluated Nuclear Data File, ENDF/B-VI”, in NuclearData for Science and Technology, pp. 788-792, Springer, Berlin, 1992.
[58] M. J. Berger et al., “XCOM: Photon Cross section Database”, Na-tional Institute of Standards and Technology, Gaithersburg, MD, 2010.[Online] Available: http://physics.nist.gov/pml/data/xcom.
[59] M. Sanchez del Rio and R. J. Dejus, “XOP: A Multiplatform GraphicalUser Interface for Synchrotron Radiation Spectral and Optics Calcula-tions”, in Proc. SPIE Materials, Manufacturing, and Measurement forSynchrotron Radiation Mirrors, vol. 3152, pp.148-157 1997.
[60] S. Brennan and P. L. Cowan, “A suite of programs for calculatingxray absorption, reflection, and diffraction performance for a varietyof materials at arbitrary wavelengths”, Rev. Sci. Instrum., vol., 63, pp.850-853, 1992.
[61] D. T. Cromer and D. A. Liberman, “Relativistic calculation of anoma-lous scattering factors for x-rays”, J. Chem. Phys., vol. 53, pp. 1891-1898, 1970.
[62] D. Cullen et al., “EPDL97, the Evaluated Photon Data Library”,Lawrence Livermore National Laboratory Report UCRL-50400, Vol.6, Rev. 5, 1997.
[63] M. B. Chadwick et al., “ENDF/B-VII.1 Nuclear Data for Science andTechnology: Cross Sections, Covariances, Fission Product Yields andDecay Data”, Nucl. Data Sheets, vol. 112, no. 12, pp. 2887-3152, 2011.
[64] J. H. Hubbell, H. A. Gimm, and I. Overbo, “Pair, Triplet, and TotalCross Sections (and Mass Attenuation Coefficients) for 0.1 MeV-100 GeV Photons in Elements Z=1 to 100”, J. Phys. Ref. Data, vol.9, no. 4, pp. 1023-1147, 1980.
[65] D. T. Cromer and D. A. Liberman, “Anomalous dispersion calculationsnear to and on the long-wavelength side of an absorption edge”, ActaCryst., vol. A37, pp. 267-268, 1981.
[66] L. Kissel, “RTAB: the Rayleigh scattering database”, Radiat. Phys.Chem., vol. 59, pp. 185-200, 2000.
[67] W. Elam, B. Ravel, and J. Sieber, “A new atomic database for X-rayspectroscopic calculations”, Radiat. Phys. Chem., vol. 63, pp. 121-128,2002.
[68] M. J. Berger and J. H. Hubbell, “XCOM: Photon Cross Sections ona Personal Computer”, National Bureau of Standards Report NBSIR87-3597, Gaithersburg, MD, 1987.
[69] E. F. Plechaty, D. E. Cullen, and R. J. Howerton, “Tables and Graphs ofPhoton-Interaction Cross Sections From 0.1 keV to 100 MeV Derivedfrom the LLL Evaluated-Nuclear-Data Library”, UCRL-50400, Vol. 6,Rev. 3, Livermore National Laboratory, 1981).
[70] G. P. Williams, “Electron binding energies of the elements”, in CRCHandbook of Chemistry and Physics, 67th Edition, CRC Press, BocaRaton, pp. F163-166, 1986.
[71] H. Ebel, R. Svagera, M. F. Ebel, A. Shaltout, and J. H. Hubbell,“Numerical description of photoelectric absorption coefficients forfundamental parameter programs”, X-Ray Spectrom., vol. 32, no. 6,pp. 442-451, 2003.
[72] W. R. Nelson, H. Hirayama, and D. W. O. Rogers, “The EGS4 CodeSystem”, SLAC-265 Report, Stanford, CA, 1985.
[73] Y. Sakamoto, “Photon cross section data PHOTX for PEGS4 code”,in Proc.Third EGS4 Users Meeting in Japan, KEK Proceedings 93-15,pp. 77-82, Japan, 1993.
[74] A. F. Bielajew and D. W. O. Rogers, “Photoelectron angular distributionin the EGS4 code system”, Report PIRS-0058, National ResearchCouncil of Canada, Ottawa, Canada, 1986.
[75] I. Kawrakow, E. Mainegra-Hing, D.W.O. Rogers, F. Tessier and B.R. B. Walters, “The EGSnrc Code System: Monte Carlo Simulation ofElectron and Photon Transport”, NRCC PIRS-701 Report, 6th printing,National Research Council of Canada, Ottawa, Canada, 2013.
[76] S. M. Seltzer, “Electron-Photon Monte Carlo Calculations: TheETRAN Code”, Appl. Radiat. Isot., vol. 42, no. 10, pp. 917-941, 1991.
[77] G. Battistoni et al., “The FLUKA code: description and benchmarking”,AIP Conf. Proc., vol. 896, pp. 31-49, 2007.
[78] A. Ferrari et al., “Fluka: a multi-particle transport code”, Report CERN-2005-010, INFN/TC-05/11, SLAC-R-773, Geneva, Oct. 2005.
[79] B. C. Franke, R. P. Kensek and T. W. Laub, “ITS5 theory manual”, rev.1.2, Sandia Natl. Lab. Report SAND2004-4782, Albuquerque, 2004.
[80] X-5 Monte Carlo Team, “MCNP – A General Monte Carlo N-ParticleTransport Code, Version 5”, Los Alamos National Laboratory ReportLA-UR-03-1987, 2003, revised 2008.
[81] D. B. Pelowitz et al., “MCNPX 2.7.E Extensions”, Los AlamosNational Laboratory Report LA-UR-11-01502, 2011.
[82] D. E. Cullen et al., “Tables and Graphs of Photon Interaction CrossSections from 10 eV to 100 GeV Derived from the LLNL EvaluatedPhoton Data Library (EPDL)”, Lawrence Livermore National Labora-tory Report UCRL-50400, Vol. 6, Rev. 4, 1989.
[83] T. Goorley et al., “Initial MCNP6 Release Overview - MCNP6 version1.0”, LA-UR-13-22934 Report, Los Alamos National Laboratory, 2013.
[84] D. Garber Ed. , “ENDF/B Summary Documentation”, BNL-17541,1975.
[85] J. Sempau, E. Acosta, J. Baro, J. M. Fernandez-Varea, and F. Salvat,“An algorithm for Monte Carlo simulation of coupled electron-photontransport”, Nucl. Instrum. Meth. B, vol. 132, pp. 377-390, 1997.
[86] F. Salvat, J. M. Fernandez-Varea, and J. Sempau, “Penelope - A codesystem for Monte Carlo simulation of electron and photon transport”,Proc. Workshop NEA 6416, 2008.
[87] F. Salvat, J.M. Fernandez-Varea, and J. Sempau, “Penelope-2011 -A code system for Monte Carlo simulation of electron and photontransport”, Proc. Workhop NEA/NSC/DOC(2011)5, 2011.
[88] “GEANT Detector Description and Simulation Tool”, CERN ProgramLibrary Long Writeup W5013, 1995.
[89] Geant4 Collaboration, “Geant4 Physics Reference Manual”, [Online].Available: http://geant4.web.cern.ch/geant4/UserDocumentation/Users-Guides/PhysicsReferenceManual/fo/PhysicsReferenceManual.pdf.
[90] J. Apostolakis, S. Giani, L. Urbanb, M. Maire, A. V. Bagulya, and V.M. Grichine, “An implementation of ionisation energy loss in very thinabsorbers for the GEANT4 simulation package”, Nucl. Instrum. Meth.A, vol. 453, no. 3, pp. 597-605, 2000.
[91] S. Chauvie, G. Depaola, V. Ivanchenko, F. Longo, P. Nieminen andM. G. Pia, “Geant4 Low Energy Electromagnetic Physics”, in Proc.Computing in High Energy and Nuclear Physics, Beijing, China, pp.337-340, 2001.
[92] S. Chauvie et al., “Geant4 Low Energy Electromagnetic Physics”, in2004 IEEE Nucl. Sci. Symp. Conf. Rec., pp. 1881-1885, 2004.
[93] J. Apostolakis, S. Giani, M. Maire, P. Nieminen, M.G. Pia, L. Urban,“Geant4 low energy electromagnetic models for electrons and photons”,INFN/AE-99/18, Frascati, 1999.
[94] M. Batic, G. Hoff, M. G. Pia, and P. Saracco, “Photon elastic scatteringsimulation: validation and improvements to Geant4”, IEEE Trans. Nucl.Sci., vol. 59, no. 4, pp. 1636-1664, 2012.
[95] A. Alexandrescu, “Modern C++ Design”, Boston: Addison-Wesley,2001.
[96] S. Chauvie et al., “Geant4 physics processes for microdosimetrysimulation: design foundation and implementation of the first set ofmodels”, IEEE Trans. Nucl. Sci., vol. 54, no. 6, pp. 2619-2628, 2007.
[97] M. Augelli et al., “Research in Geant4 electromagnetic physics design,and its effects on computational performance and quality assurance”,in 2009 IEEE Nucl. Sci. Symp. Conf. Rec., pp. 177-180, 2009.
[98] M. G. Pia et al., “Design and performance evaluations of genericprogramming techniques in a R&D prototype of Geant4 physics”, J.Phys.: Conf. Ser., vol. 219, pp. 042019, 2010.
[99] G. Booch, J. Rumbaugh, and I. Jacobson, “The Unified ModelingLanguage User Guide”, Addison-Wesley, 1999.

28
[100] E. Gamma, R. Helm, R. Johnson, and J. Vlissides, “Design Patterns”,Boston: Addison-Wesley, 1995.
[101] M. Fowler, “Refactoring: improving the design of existing code”,Boston: Addison-Wesley, 1999.
[102] J. D. E. Beynon and R. B. Cairns, “An experimental determinationof the photoabsorption cross section of atomic hydrogen”, Proc. Phys.Soc., vol. 86, pp. 1343-1349, 1965.
[103] J. L. Kohl, G. P. Lafyatis, H. P. Palenius, and W. H. Parkinson,“Absolute cross section for photoionization of atomic oxygen”, Phys.Rev. A, vol. 18, no. 2, pp. 571-574, 1978.
[104] H. P. Palenius, J. L. Kohl, and W. H. Parkinson, “Absolute measurementof the photoionization cross section of atomic hydrogen with a shocktube for the extreme ultraviolet”, Phys. Rev. A, vol. 13, no. 5, pp.1805-1816, 1976.
[105] B. L. Henke, R. L. Elgin and R. B. Ledingham, “X-ray absorption inthe 2 to 200 A region”, Norelco Rep., vol. 14, pp. 112-116, 1967.
[106] J. F. Lowry, D. H. Tomboulian, and D. L. Ederer, “PhotoionizationCross Section of Helium in the 100 to 250 A Region”, Phys. Rev., vol.137, no. 4A, pp. 1054-1057, 1965.
[107] A. P. Lukirskii, I. A. Brytov, and T. M. Zimkina, “PhotoionizationAbsorption of He, Kr, Xe, CH4, and Methylal in the 23.6-250 ARegion” Optics Spectrosc., vol. 17, pp. 234-238, 1964.
[108] G. V. Marr and J. B. West, “Absolute photoionization cross-sectiontables for helium, neon, argon, and krypton in the VUV spectralregions” Atom. Data Nucl. Data Tables, vol. 18, pp. 497-508, 1976.
[109] J. A. R. Samson, “Photoionisation cross sections of Helium”, J. Opt.Soc. Am., vol. 54, no. 7, pp. 876-878, 1964.
[110] J. A. R. Samson and W. C. Stolte, “Precision measurements of the totalphotoionization cross-sections of He, Ne, Ar, Kr, and Xe”, J. ElectronSpectros. Relat. Phenomena, vol. 123, pp. 265-276, 2002.
[111] W. S. Watson, “Photoionization of helium, neon and argon in the 60-230 eV photon energy range.”, J. Phys. B, vol. 5, no. 12 pp. 2292-2303,1972.
[112] J. B. West and G. V. Marr, “The absolute photoionization cross sectionsof helium, neon, argon and krypton in the extreme vacuum ultravioletregion of the spectrum”, Proc. Royal Soc. London A, vol. 349, no.1658, pp. 397-421, 1976.
[113] D. J. Baker, Jr. and D. H. Tomboulian, “Photoelectric K-AbsorptionCross Section of Lithium”, Phys. Rev., vol 128, no. 2, pp. 677-680,1962.
[114] M. T. Huang et al., “Single and double photoionization of lithium”,Phys. Rev. vol. 59, no. 5, pp. 3397-3401, 1999.
[115] G. Mehlman, J. W. Cooper, and E. B. Saloman, “Absolute photoab-sorption cross section of the K shell of atomic lithium”, Phys. Rev. A,vol. 25, no. 4, pp. 2113-2122, 1982.
[116] T. J. Peterson, Jr., E. J. McGuire, and D. H. Tomboulian, “PhotoelectricK-Absorption Cross Section of Beryllium”, Phys. Rev. A, vol. 129, no.2,pp. 674-677, 1963.
[117] “Measurements of the ultrasoft X-ray absorption of Ar, Ne, N2, O2,CH4, He and H2”, J. Phys. D , vol.3, pp. 1392-1398, 1970.
[118] J. A. R. Samson and G. C. Angel, “Single- and double- photoionizationcross sections of atomic nitrogen from threshold to 31 A”, Phys. Rev.A, vol. 42, no. 3, pp. 1307-1312, 1990.
[119] G. C. Angel and J. A. R. Samson, “Total photoionization cross sectionsof atomic oxygen from threshold to 44.3 A”, Phys. Rev. A, vol. 38, no.11, pp. 5578-5585, 1988.
[120] R. B. Cairns and J. A. R. Samson, “Total Absorption Cross Sectionof Atomic Oxygen below 910 A”, Phys. Rev., vol. 130, no. 5A, pp.1403-1407, 1965.
[121] J. A. R. Samson and P. N. Pareek, “Absolute photoionization crosssections of atomic oxygen”, Phys. Rev. A, vol. 31, no. 3, pp. 1470-1476, 1985.
[122] I. H. Suzuki and N. Saito, “Absolute photoabsorption cross-sectionsof Ne and Xe in the sub-keV X-ray region” J. Electr. Spectr. RelatedPhenomena, vol. 129, pp. 71-79, 2003.
[123] K. Codling, J. R. Hamley and J. B. West, “The absolute photoabsorp-tion cross section of atomic sodium in the region above the 2p threshold(45-250 eV)”, J. Phys. B, vol. 10, no. 14, pp. 2797-2807, 1977.
[124] R. Gowda and B. Sanjeevaiah, “K-shell photoelectric cross sections for145-keV Gamma Rays”, Phys. Rev. A, vol. 8, no. 5, pp. 2425-2428,1973.
[125] J. A. R. Samson, Y. Shefer, and G. C. Angel, “A Critical Test of Many-Body Theory: The Photoionization Cross Section of Cl as an Exampleof an Open-Shell Atom”, Phys. Rev. Lett., vol. 56, no. 19, pp. 2020-2023, 1986.
[126] A. P. Lukirskii and T. M. Zimkina, “Mass absorption coefficients ofargon and ethyl alcohol in the ultrasoft X-ray region”, Bull. Acad. Sci.USSR, Phys. Ser., vol. 27, pp. 808-811, 1963.
[127] I. H. Suzuki and N. Saito, “Total photoabsorption cross-section of Arin the sub-keV energy region” Radiation Phys. Chem., vol. 73, pp. 1-6,2005.
[128] M. Kato et al., “Absolute photoionization cross sections with ultra-high energy resolution for Ar, Kr, Xe and N2 in inner-shell ionizationregion”, J. Electr. Spectrosc. Rel. Phenom., vol. 160, pp. 39-48, 2007.
[129] B. X. Yang and J. Kirz, “Soft x-ray absorption cross section of argondetermined by a variable absorber technique”, App. Opt., vol. 26, no.18, pp. 3823-3826, 1987.
[130] L. Zheng, M. Cui, Y. Zhao, J. Zhao, K. Chen, “Total photoionizationcross-sections of Ar and Xe in the energy range of 2.1-6.0 keV”, J.Electr. Spectr. Related Phenomena, vol. 152, pp. 143-147, 2006.
[131] W. Sandner, T. F. Gallagher, K. A. Safinya, and F. Gounand, “Pho-toionization of potassium in the vicinity of the minimum in the crosssection”, Phys. Rev., vol. 23, no. 5, pp. 2732-2735, 1981.
[132] O. Sout, “Direct measurement of total atomic photoelectric, total atomicattenuation and total atomic scattering cross-sections in the atomicregion 22 ≤ Z ≤ 58 at 59.5keV photons”, J. Quant. Spectrosc. Ra.,vol. 73, pp. 63-68, 2002.
[133] N. K. Del Grande, “Measured 1 to 40 keV photoabsorption crosssections for: Fe, Ni, Sn, Ta, Pt, Au, Pb, U”, Proc. SPIE 0691, X-RayImaging II, pp. 2-10, 1986.
[134] G. G. Lombardi, P. L. Smith, and W. H. Parkinson, “Measurement ofthe photoionization cross section of neutral iron”, Phys. Rev., vol. 18,no. 5, pp. 2131-2134, 1978.
[135] R. Gowda and B. Sanjeevaiah, “Photoelectric cross sections for 279.1keV and 411.8 keV rays”, J. Phys. B: At. Mol. Phys., vol. 7, pp.1772-1775, 1974.
[136] R. Gowda and B. Sanjeevaiah, “The Total and K Shell PhotoelectricCross Sections for 661.6 keV Gamma Rays”, Can. J. Phys., vol. 53,no. 9, pp. 846-849, 1975.
[137] C. Ranganathaiah, R. Gowda, and B. Sanjeevaiah, “Photoelectric crosssections for 323keV gamma rays in Cu, Zr, Ag, Sn, Ta, Au, and Pb”,JCan. J. Phys., vol. 55, no. 18, pp. 1592-1593, 1977.
[138] W. F. Titus, “Total Photoelectric Cross Sections of Copper, Molybde-num, Silver, Tantalum, and Gold at 662 keV”, Phys. Rev., vol.115, no.2, pp. 351-356, 1959.
[139] J. Lang and W. S. Watson, “The photoabsorption coefficients of kryptonand xenon from 48 A to 210 A”, J. Phys. B, vol. 8, no. 14, pp. 339-343,1975.
[140] I. H. Suzuki and N. Saito, “TPhotoabsorption cross-section for Kr inthe sub-keV energy region” J. Electr. Spectr. Related Phenomena, vol.123, pp. 239-245, 2002.
[141] G. V. Marr and D. M. Creek, “The photoionization absorption continuafor alkali metal vapours”, Proc. Roy. Soc. A., vol.304, pp. 233-244,1968.
[142] A. M. Manna and V. V. Rao, “Photoelectric cross sections of 279 and661 KeV gamma rays in Y, Ce, Dy and Yb”, J. Phys. B: At. Mol.Phys., vol. 18, pp. 3161-3165, 1985.
[143] G. Budak, A. Karabulut, O Simsek, and M. Ertugrul, “Measurementof total atomic attenuation, total atomic photoelectric and total atomicscattering cross sections in the range 40 ≤ Z ≤ 52”, Nucl. Instrum.Meth. B, vol. 149, pp. 379-382, 1999.
[144] H. A. Jahagirdar, B. Hanumaiah, and S. R. Thontadarya, “A new directmethod to determine total atomic photoelectric cross sections at 123.6keV”, Appl. Radiat. Isot., vol. 43, no. 3, pp. 399-404, 1992.
[145] A. Lurio and W. Reuter, “Low energy photoionization cross sectionsfrom proton induced xray spectroscopy”, Appl. Phys. Lett., vol. 27, pp.704-706, 1975.
[146] K. Parthasaradhi, V. Lakshminarayana, and S. Jnanananda, “AbsolutePhotoelectric Cross Sections of 320-keV Gamma Rays in Pb, Sn, andAg”, Phys. Rev., vol. 142, no. 1, pp. 9-11, 1966.
[147] N. Saito and I. H. Suzuki, “Precise photoabsorption cross sections ofNe and Xe”, Nucl. Instrum. Meth. A, vol. 467-468, pp. 1577-1580,2001.
[148] T. B. Cook, F. B. Dunning, G. W. Folts, and R. F. Stebbings, “Absolutemeasurement of the photoionization cross section for ground-statecesium atoms”, Phys. Rev. A, vol. 15, no. 4, pp. 1526-1529, 1977.
[149] M. Ertugrul, “Measurement of K, L and higher shell photoionizationcross-sections at 59.5 keV”, Anal. Chim. Acta., vol. 491, pp. 239-244,2003.
[150] S. J. Anasuya, T. K. Umesh, and R. Gowda, “Photoeffect cross sectionsof some rare earth elements for 661.6 keV gamma rays by a newmethod”, Radiat. Phys. Chem., vol. 51, no. 4-6, pp. 363-364, 1998.

29
[151] H. A. Jahagirdar, B. Hanumaiah, S. R. Thontadarya“Measurement oftotal and photoelectric cross sections of rare earth elements presentin compounds for 123.6 keV and 145.4 keV photons”, Radiat. Phys.Chem., vol. 47, no. 6, pp. 801-805, 1996.
[152] A. Karabulut, G. Budak, M. Ertugrul, “Fast measurement of totalatomic attenuation, total atomic photoelectric and total atomic scat-tering cross sections in the range 58≤Z≤68 using radioisotope X-rayfluorescence”, Nucl. Instrum. Meth. B, vol. 152, no. 2, pp. 202-206,1999.
[153] M. Ertugrul, O. Simsek, O. Dogan,and U. Turgut, “Direct determinationof total atomic attenuation, total atomic photoelectric and total atomicscattering cross sections of Gd, Tb, Dy and Er at 60 keV”, J. Radioanal.Nucl. Chem., Lett., vol. 213, no. 1, pp. 37-44, 1996.
[154] S. V. Nayak and N. M. Badiger, “A novel method for measuring K-shell photoelectric parameters of high-Z elements”, J. Phys. B, vol. 39,pp. 2893-2900, 2006.
[155] A. M. Ghose, “Photoelectric cross sections of gamma rays for heavyelements”, Nucl. Phys., vol. 75, pp. 539-548, 1966.
[156] S. J. Anasuya, T.K. Umesh, and Ramakrishna Gowda, “A new methodto determine the atomic photo effect cross section in lead at 661.6keV”, Nucl. Instrum. Meth. B, vol. 84, pp. 421-424, 1994.
[157] J. M. Bizau, P. Gerard, and F. J. Wuilleumier, “Photoionization ofatomic Ca in the 26-120-eV photon-energy range”, Phys. Rev. A, vol.36, no. 3, pp. 1220-1248, 1987.
[158] K. Codling, R. G. Houlgate, J. B. West, and P. R. Woodruff, “Angulardistribution and photoionization measurements on the 2p and 2selectrons in neon”, J. Phys. B, vol. 9, no. 5, pp. L83-L86, 1976.
[159] M. J. Lynch, A. B. Gardner, K. Godling, and G. V. Marr, “Thephotoionization of the 3s subshell of argon in the threshold region byphotoelectron spectroscopy”, Phys. Lett., vol. 43A, no. 3, pp. 237-238,1973.
[160] R. G. Houlgate, J. B. West, K. Codling, and G. V. Marr, “Angulardistribution and photoionization cross section measurements on the 3pand 3s subshells of argon”, J. Phys. B, vol. 7, no. 17, pp. L470-L473,1974.
[161] B. Mobus, B. Magel, K. H. Schartner, B. Langer, U. Becker, M.Wildberger,and H. Schmoranzer, “Measurements of absolute Ar 3sphotoionization cross sections”, Phys. Rev. A, vol. 47, no. 5, pp. 3888-3893, 1993.
[162] J. A. R. Samson and J. L. Gardner, “Photoionization cross sections ofthe outer s-subshell electrons in the rare gases”, Phys. Rev. Lett., vol.33, no. 12, pp. 671-673, 1974.
[163] J. Jimenez-Mier, M. O. Krause, and P. Gerard, “Partial and totalcross sections and multiplet structure in the photoionization of atomicmanganese”, Phys. Rev. A, vol. 40, no. 7, pp. 3712-3720, 1989.
[164] S. K. Arora, K. L. Allawadhi, and B. S. Sood, “K-shell photoelectriccross-section measurement”, Phys. Rev. A, vol. 23, no. 3, pp. 1147-1151, 1981.
[165] R. Gowda and B. Sanjeevaiah, “K-shell photoelectric cross sections ofCu, Zr, Ag, Sn, Ta, Au, and Pb for 279.1- and 411.8 - keV γ rays”,Phys. Rev. A, vol. 10, no. 4, pp. 1188-1191, 1974.
[166] A. Karabulut, A. Gurol, G. Budak, and M. Ertugrul, “K shell and Lsubshell and L shell photoeffect cross-sections in the atomic region 40≤ Z ≤ 52 and 58 ≤ Z ≤ 68 at 59.537 keV”, Nucl. Instrum. Meth. B,vol. 227, pp. 485-489, 2005.
[167] C. Ranganathaiah, R. Gowda, and B. Sanjeevaiah, “K-shell photoion-ization cross sections for 514, 661.6, 765.8, and 1115.5 keV gammarays”, J. Phys. B, vol. 12, no. 12, pp. 1965-1971, 1979.
[168] C. Ranganath, R. Gowda, and B. Sanjeevaiah, “A coincidence methodof measuring K-shell photoelectric cross sections”, Nucl. Instrum.Meth., vol. 154, pp. 331-334, 1978.
[169] C. Ranganathaiah, R. Gowda, and B. Sanjeevaiah, “Atomic K-shellphotoionization cross sections for Sc 46 and Co 60 γ rays”, Phys. Rev.A, vol. 23, no. 4, pp. 1841-1847, 1981.
[170] T. Gustafsson, “Photoionization cross sections of the 5s electrons inXe measured with synchrotron radiation”, Chem. Phys. Lett., vol. 51,no. 2, pp. 383-385, 1977.
[171] U. Becker, H. G. Kerkhoff, M. Kupsch, B. Langer, D. Szostak, and R.Wehlitz, “Photoionization of xenon with soft X-rays”, J. Phys. Colloq.,vol. 48, pp. 497-500, 1987.
[172] J. M. Bizau, D. Cubaynes, P. Gerard, and F. J. Wuilleumier, “Photoion-ization of atomic barium: Ba atoms in the ground state”, Phys. Rev. A,vol. 40, no. 6, pp. 3002-3025, 1989.
[173] S. V. Nayak and N. M. Badiger, “Measurement of K shell photoelectriccross sections at a K edge–a laboratory experiment”, Eur. J. Phys., vol.28, pp. 859-866, 2007.
[174] S. B. Hosur, L. R. Naik, and N. M. Badiger, “Study of the K shellphotoelectric parameters of Dy, Yb and W atoms using low energybremsstrahlung radiation”, Eur. Phys. J. D, vol. 62, pp. 155-161, 2011.
[175] S. V. Nayak and N. M. Badiger, “Measurement of K-shell photoelectricabsorption parameters of Hf, Ta, Au, and Pb by an alternative methodusing a weak β-particle source”, Phys. Rev. A, vol.73, no. 3, pp.032707, 2006.
[176] K. L. Allawadhi, S. K. Arora, and B. S. Sood, “Measurement of L-shellphotoelectric cross sections in high Z elements at 60 keV”, Pramana,vol. 10, no. 5, pp. 511-517, 1978.
[177] C. Kunz, S. Thiess, B. Cowie, T.-L. Lee, and J. Zegenhagen, “Outersub-shell photoabsorption cross-sections determined by X-ray photo-electron spectroscopy up to 14.5 keV”, Nucl. Instrum. Meth. A, vol.547, pp. 73-86, 2005.
[178] K. L. Allawadhi, B. S. Ghumman, and B. S. Sood, “Measurement ofL-shell photoelectric cross sections in high Z elements at 37 and 74keV”, Pramana, vol. 8, no. 5, pp. 433-437, 1977.
[179] S. K. Arora, K. L. Allawadhi, and B. S. Sood, “Measurement of L IIIsubshell photoelectric cross-sections in high Z-elements”, Pramana,vol.16, no. 6, pp. 467-472, 1981.
[180] E. J. Bleeker, P. F. A. Goudsmit, and C. De Vries, “Measurements ofK shell photoelectric cross sections”, Nucl. Phys., vol.29, pp. 452-461,1962.
[181] H. W. Boyd, W. H. Brantley, and J. H. Hamilton, “Photoelectric Cross-Sections for the L, M and N Shells of Uranium for Photons of 122keV”, Nuovo Cimento, vol.39, no. 1, pp. 1-9, 1965.
[182] K. S. Babu, S. C. Lingam and D. V. K. Reddy, “Total mass attenuationcross sections of rare earth elements in the energy range 30 to 662keV and derived photoelectric cross sections”, Physica C, vol. 125,pp. 353-360, 1984.
[183] A. J. Bearden, “X-Ray Photoeffect Cross Sections in Low and Medi-umZ Absorbers for the Energy Range 852 eV to 40 keV”, J. Appl.Phys., vol. 37, no. 4, pp. 1681-1692, 1966.
[184] K. P. Chand, D. K. S. Reddy, V. R. K. Murty, J. R. Rao, and V.Lakshminarayana, “Photoelectric cross sections of low-energy photonsin light elements”, J. Phys. B, vol. 9, no. 2, pp. 177-184, 1976.
[185] B. E. Cole, “Empirical photoabsorption cross sections for C, N, O, Fand Cl obtained from molecular measurements between 50 and 340A”, J. Quant. Spectrosc. Radiat Transfer, vol. 19, pp. 467-471, 1978.
[186] S. A. Colgate, “Gamma-ray absorption measurements”, Phys. Rev., vol.87, no. 4, pp. 592-601, 1952.
[187] W. Dachun et al., “X-ray attenuation coefficients and photoelectriccross sections of Cu and Fe in the range 3 keV to 29 keV”, Nucl.Instrum. Meth. B, vol. 71, pp. 241-248, 1992.
[188] W. Dachun, Y. Hua, L. Pingan and D. Xunliang, “Measurements ofmass attenuation coefficients of yttrium with characteristic lines fromelements excited by energetic protons”, Nucl. Instrum. Meth. B, vol.71,pp. 249-254, 1992.
[189] L. Gerward, “X-ray attenuation coefficients and atomic photoelectricabsorption cross sections of silicon”, J. Phys. B, vol. 14, pp. 3389-3395,1981.
[190] L .Gerward, “Atomic photoeffect cross sections for beryllium, carbon,silicon and copper from 5 to 20 keV”, J. Phys. B, vol. 22, pp. 1963-1969, 1989.
[191] R. Gowda and B. Sanjeevaiah, “Photoelectric cross sections for 72.1-keV x rays in Al, Cu, Zr, Ag, Sn, Ta, Au, and Pb derived from a totalattenuation-coefficient measurement”, Phys. Rev. A, vol. 9, no. 6, pp.2569-2572, 1974.
[192] S. C. Lingam, K. S. Babu, and D. V. Krishna Reddy, “Photoelectriccross sections around the K edge”, Physica C, vol. 122, pp. 348-352,1983.
[193] F. Machali, G. G. Al-Barakati, A. A. El-Sayed, and W. J. Altaf, “Thephotoelectric cross section of gamma rays in the energy range 43 to152 keV”, J. Phys. F, vol. 17, pp. 1279-1284, 1987.
[194] R. H. Millar, “Atomic number dependence of the photoelectric crosssection for photons in the energy range from 4.5 to 25 keV”, J. Phys.B, vol. 8, no. 12, pp. 2015-2022, 1975.
[195] V. R. K. Murty, K. S. Rao, K. Parthasaradhi, J. R. Rao, and V.Lakshminarayana, “Photoelectric interaction around the K edge”, J.Phys. B, vol. 10, pp. 3189-3194, 1977.
[196] V. R. K. Murty, D. P. Winkoun, and K. R. S. Devan, “Total photoelectriccross sections close to absorption edges”, Radiat. Phys. Chem., vol. 51,no. 4-6, pp. 361-362, 1998.
[197] R. Nathuram, I. S. S. Rao, and M. K. Mehta, “Photoelectric crosssections for 6-20 keV photons in beryllium, carbon, magnesium,aluminum, silicon, copper, silver, and lead”, Phys. Rev. A, vol. 13,no. 12, pp. 4978-4981, 1988.

30
[198] K. Parthasaradhi, “Photoelectric cross sections of gamma rays in Al,Cu, Sn, W, Au and Pb in the energy region 50-208 keV”, J. Phys. A,vol. 1, pp. 256-258, 1968.
[199] K. Parthasaradhi and H. H. Hansen, “Attenuation-coefficient mea-surements for 3.3- to 165.8-keV photons: Analysis in terms of totalphotoelectric cross sections”, Phys. Rev. A, vol. 10, no. 2, pp. 563-568,1974.
[200] K. Parthasaradhi, “Atomic photoelectric effect near threshold edges”,Phys. Rev. A, vol. 32, no. 1, pp. 194-198, 1985.
[201] K. Parthasaradhi, “Photon cross sections near the x-ray-absorptionedges of Ti, Ni, Pt, and Au”, Phys. Rev. A, vol. 38, no. 3, pp. 1608-1611, 1988.
[202] P. P. Pawar and G. K. Bichile, “Photoelectric cross sections deducedfrom the measured total photon interaction cross sections for fiveelements (24≤Z≤82) at 279.30 keV”, J. Chem. Pharm. Res., vol. 3,pp. 212-217, 2011.
[203] R. Prasad, “Total photon-absorption cross-section measurements at52.4, 60, 72.2, and 84.4 keV in Al, Fe, Mo, Ag, W, and Pt: Photoelectriccross sections deduced”, Phys. Rev. A, vol. 18, no. 5, pp. 2167-2169,1978.
[204] R. Prasad, “Photoelectric cross-sections for Cd and In at 22.2, 59.6 and88.8 keV”, Nucl. Instrum. Meth. A, vol. 255, pp. 52-53, 1987.
[205] P. V. R. Rao, V. V. Rao, J. R. Rao, K. Parthasaradhi, “Photoelectriccross-sections of gamma-rays”, Lett. Nuovo Cimento, vol. 1, no. 6, pp.311-312, 1969.
[206] K. S. Rao, P. V. R. Rao, B. V. T. Rao, and K. Parthasaradhi,“Photoelectric effect of Gamma-rays”, Lett. Nuovo Cimento, vol. 8,no. 6, pp. 373-377, 1973.
[207] K. Sivasankara Rao, V. Radha Krishna Murty, K. Parthasaradhi, J.Rama Rao, and V. Lakshminarayana, “Total to K-shell photoelectriccross section ratios in Zr, Ag, Ta, and Th”, Pramana, vol. 9, no. 4, pp.321-328, 1977.
[208] V. Visweswara Rao and Shahnawaz, “Photoelectric cross-sections oflow-energy photons”, Nuovo Cimento, vol. 44A, no. 2, pp. 181-186,1978.
[209] V. Visweswara Rao, Shahnawaz, and D. Venkateswara Rao, “Photoelec-tric cross sections for X-ray photons in low- and midium-Z elements”,Physica C, vol. 111, pp. 107-110, 1981.
[210] D. Venkateswara Rao and V. Visweswara Rao, “Photoelectric Cross-Sections at K and L Edges”, Nuovo Cimento, vol.67A, no. 2, pp. 143-150, 1982.
[211] A. S. Nagaswara Rao, A. Perumallu, and G. Krishna Rao, “Photoncross section measurements in compounds and elements in the energyrange 30-660 keV”, Physica C, vol. 124, pp. 96-104, 1984.
[212] D. K. S. Reddy, K. Premachand, and V. Radha Krishna Murty,“Photoelectric interaction below the K edge”, Phys. Rev. A, vol. 13,no. 1, pp. 326-329, 1976.
[213] D. V. Krishna Reddy, S. Chandralingam, and K. Suresh Babu, “Photo-electric cross sections in heavy elements derived from total attenuationmeasurements”, Physica C, vol. 132, pp. 403-406, 1985.
[214] D. Dattatreya Reddy et al., “Photoelectric effect aroundK-edges in theelements Ce, Sm, Dy and Yb”, Lett. Nuovo Cimento, vol. 44, no. 6,pp. 398-400, 1985.
[215] B. Seetharami Reddy, K. Premachand, P. V. Ramana Rao, and K.Parthasaradhi, “Z-dependence of photoelectric cross-section in theenergy region of absorption edges (6.4-136.47) keV”, Nuovo Cimento,vol. 105, no. 5, pp. 735-379, 1992.
[216] B. Roy, B. K. Chatterjee, S. C. Roy, N. Bhattacharya, and N. Choud-hury, “Photoelectric Cross-sections Derived from Measured Total At-tenuation Coefficient of Photons Near Absorption Edges of HeavierAtoms”, Appl. Radiat. Isot., vol. 48, no. 6, pp. 785-788, 1997.
[217] K. S. R. Sarma, K. L. Narasimham, K. Premchand, S. B. Reddy, K.Parthasaradhi, and V. Lakshminarayana, “Photoelectric cross-sectionsof light elements and compounds at low photon energies”, Pramana,vol. 18, no. 6, pp. 485-494, 1982.
[218] Shanawaz and V. V. Rao, “Low-energy photon attenuation coefficients”,Curr. Sci, vol. 46, no. 8, pp. 256-256, 1977.
[219] B. Sinha and N. Chaudhuri, “Experimental photoionization crosssections of gamma ray photons for low, medium and high Z atoms”,in Radiation physics: Proc. Int. Symp. Radiation Physics, held at BoseInstitute, Calcutta, India, November 30-December 4, 1974, pp. 20-22,1977.
[220] F. Titus, “The photoelectric cross sections of Sn, Ta and Au at 2.62MeV”, Nucl. Phys., vol. 69, pp. 179-185, 1965.
[221] T. K. Umesh and C. Ranganathaiah, “A simple method of determiningthe photoeffect cross sections of elements for gamma rays”, Nucl.Instrum. Meth. B, vol. 5, pp. 472-475, 1984.
[222] T. K. Umesh, C. Ranganathaiah, and B. Sanjeevaiah, “Photoeffect crosssections of some rare-earth elements at 145.4 keV”, Phys. Rev. A, vol.32, no. 2, pp. 959-962, 1985.
[223] Sandiago, T. K. Umesh, and R. Gowda, “Photon interaction cross-sections and anomalous scattering factors of Cu and Ag”, Pramana,vol. 48, no. 5, pp. 1077-1090, 1997.
[224] K. L. Allawadhi and B. S. Sood, “K-shell photoelectric cross sectionsfor intermediate Z elements at 32 and 24 keV”, Phys. Rev. A, vol. 11,no. 6, pp. 1928-1932, 1975.
[225] K. L. Allawadhi, S. L. Verma, B. S. Ghumman, and B. S. Sood,“Measurement of K shell photoelectric cross section of Ba K X-raysin Y, Zr, Mo, Ag, Cd and Sn”, Physica C, vol. 95, pp. 424-431, 1978.
[226] S. K. Arora, K. L. Allawadhi, and B. S. Sood, “L-shell photoelectriccross section measurements”, J. Phys. B, vol.14, pp. 1423-1432, 1981.
[227] S. K. Arora, K. L. Allawadhi, and B. S. Sood, “Relative L-shellphotoelectric cross-section measurements in W, Pb and U”, PhysicaC, vol.106, pp. 155-160, 1981.
[228] M. Ertugrul et al., “Measurement of Li subshell photoionization cross-sections of W, Au and Bi at 31.6 keV”, Radiat. Phys. Chem., vol. 65,pp. 123-126, 2002.
[229] A. Gurol, A. Karabulut, R. Polat, G. Budak, Y. Sahin, and M. Ertugrul,“L-subshell and total L-shell photoeffect cross-sections measurementsfor Pb, Au, W, and Ta at 59.5 keV”, Radiat. Phys. Chem., vol.66, pp.197-205, 2003.
[230] A. Karabulut, A. Gurol, G. Budak, and R. Polat, “Measurements of Lsubshell and total L shell photoeffect cross-sections for some elementsin 72 ≤ Z ≤ 92”, Eur. Phys. J. D, vol. 21, pp. 57-61, 2002.
[231] N. Kaya, G. Apaydın, V. Aylıkcı, E. Cengiz, and E. Tırasoglu, “Kshell, L shell–subshell and M shell–subshell photoeffect cross-sectionsin elements between Tb (Z= 65) and U (Z= 92) at 123.6 keV”, Radiat.Phys. Chem., vol. 77, no. 2, pp. 101-106, 2008.
[232] R. C. G. Leckey, “Subshell photoionization cross sections of theelements for Al K α radiation”, Phys. Rev. A, vol. 13, no. 3, pp. 1043-1051, 1976.
[233] M. L. Mallikarjuna, S. B. Appaji Gowda, K. E. Ganesh, R. Gowda,and T. K. Umesh, “A method to determine the K-shell photoeffect crosssections of some rare earth elements”, Nucl. Instrum. Meth. B, vol. 215,pp. 4-8, 2004.
[234] K. Parthasaradhi, “Note on total to subshell photoelectric cross sectionsratios”, Nucl. Instrum. Meth., vol. 85, pp. 147-150, 1970.
[235] K. Parthasaradhi, “Note on the methods of determining the subshellphotoelectric cross sections”, Nucl. Instrum. Meth., vol. 81, pp. 205-206, 1970.
[236] K. Parthasaradhi et al., “Photon cross sections near the x-ray-absorptionedges of Ti, Ni, Pt, and Au”, Phys. Rev. A, vol. 38, no. 3, pp. 1608-1611, 1988.
[237] R. S. Prakhya, K. Parthasaradhi, V. Lakshminarayana, K. L.Narasimham, K. V. Ramanaiah, and S. Bhuloka Reddy, “Measurementof K-shell photoelectric cross sections by the indirect method”, Phys.Rev. A, vol. 33, no. 4, pp. 2440-2443, 1986.
[238] K. Sivasankara Rao, B. V. Tirumala Rao, B. Mallikarjuna Rao, and K.Parthsaradhi, “Shell-wise photoelectric cross-sections of gamma-rays”,Nuovo Cimento, vol. 13, no. 1, pp. 267-270, 1973.
[239] K. S. Rao et al., “Photoelectric effect of gamma rays”, Lett. NuovoCimento, vol8, no. 6, pp. 373-377, 1973.
[240] G. K. Rao, A. Perumallu and A. S. N. Rao, “A study on atomic photoeffect cross sections at the K-edge in high Z-elements”, Physica, vol.125C, pp. 334-340, 1984.
[241] D. V. Rao, “Measurements of photoelectric cross sections for X-rayand γ-ray photons at K, L1 and L3 edges in Ce, Gd, Dy, Er, Yb andPb: An analysis of the derived shell ratios”, Nucl. Instrum. Meth. A,vol. 280, no. 2, pp. 222-225, 1989.
[242] D. D. Reddy et al., “Photoelectric Effect Around K-Edges in theElements Ce, Sm, Dy and Yb”, Lett. Nuovo Cimento, vol. 44, no.6, pp. 398-400, 1985.
[243] P. R. Sasi, V. Lakshimi Narayana, K. Parthasardhi, K. L. Narasimhan,S. Bhuloka Reddy, and K. V. Ramaniah, “Measurement of K-shellphotoelectric cross sections using a direct method”, Nucl. Instrum.Meth. A, vol. 256, pp. 373-376, 1987.
[244] M. I. Singh and B. S. Sood, “L-Shell Photoelectric Cross-Sections forHeavy Atoms at 145 and 279 keV”, Nuovo Cimento, vol. 8B, no. 1,pp. 261-270, 1972.
[245] N. Singh, R. Mittal, K. L. Allawadhi, and B. S. Sood, “Measurement ofL-shell photoelectric cross-sections in lower intermediate Z elementsat 6 keV”, Pramana, vol. 22, no. 2, pp. 89-92, 1984.
[246] J. A. Huwaldt, PlotDigitizer [Online]. Available: http://plotdigitizer.-sourceforge.net/.

31
[247] A. Wald and J. Wolfowitz, “An exact test for randomness in the non-parametric case, based on serial correlation,“ Ann. Math. Stat., vol. 14,pp. 378-388, 1943.
[248] IEEE Computer Society, “IEEE Standard for Software Verification andValidation”, IEEE Std 1012-2012, May 2012.
[249] ISO/IEC, “International Standard, Information Technology SoftwareLife Cycle Process, IS0 12207”, 2008-2011.
[250] G. A. P. Cirrone et al., “A Goodness-of-Fit Statistical Toolkit”, IEEETrans. Nucl. Sci., vol. 51, no. 5, pp. 2056-2063, 2004.
[251] B. Mascialino, A. Pfeiffer, M. G. Pia, A. Ribon, and P. Viarengo, “Newdevelopments of the Goodness-of-Fit Statistical Toolkit”, IEEE Trans.Nucl. Sci., vol. 53, no. 6, pp. 3834-3841, 2006.
[252] R Core Team, “R: A language and environment for statistical comput-ing”, R Foundation for Statistical Computing, Vienna, Austria, ISBN3-900051-07-0, 2012. [Online]. Available: http://www.R-project.org/.
[253] R. K. Bock and W. Krischer, “The Data Analysis BriefBook ”, Ed.Springer, Berlin, 1998.
[254] A. G. Frodesen, O. Skjeggestad, and H. Tøfte, “Probability andstatistics in particle physics”, Ed. Universitetsforlaget, Bergen, 1979.
[255] M. Paterno, “Calculating Efficiencies and Their Uncertainties”, FermiNational Accelerator Report FERMILAB-TM-2286-CD, Batavia, IL,2004.
[256] K. Pearson, “On the χ2 test of Goodness of Fit”, Biometrika, vol. 14,no. 1-2, pp. 186-191, 1922.
[257] R. A. Fisher, “On the interpretation of χ2 from contingency tables,and the calculation of P”, J. Royal Stat. Soc., vol. 85, no. 1, pp. 87-94,1922.
[258] R. D. Boschloo, “Raised Conditional Level of Significance for the2×2-table when Testing the Equality of Two Probabilities”, Stat.Neerlandica, vol. 24, pp. 1-35, 1970.
[259] S. Suissa, and J. J. Shuster, “Exact Unconditional Sample Sizes forthe 2×2 Binomial Trial”, J. Royal Stati. Soc., Ser. A, vol. 148, pp.317-327, 1985.
[260] T. J. Santner and M. K. Snell, “Small-Sample Confidence Intervals forp1 - p2 and p1/p2 in 2×2 Contingency Tables”, J. Am. Stat. Ass., vol.75, no. 370, pp. 386-394, 1980.
[261] G. A. Barnard, “ Significance tests for 2 2 tables”, Biometrika, vol.34, pp. 123-138, 1947.
[262] E. B. Wilson, “Barnard’s CSM Test of Significance”, Proc. NationalAcad. Sci. United States of America, vol. 38, no. 10, pp. 899-905, 1952.
[263] S. Mato and M. Andres, “Simplifying the calculation of the P-valuefor Barnards test and its derivatives”, Stat. Comp., vol. 7, pp. 137-143,1997.
[264] A. Agresti, “A Survey of Exact Inference for Contingency Tables”,Stat. Sci., vol. 7, pp. 131-153, 1992.
[265] A. Martin Andres and A. Silva Mato, “Choosing the optimal uncondi-tioned test for comparing two independent proportions”, Comp. Stat.Data Anal., vol. 17, pp. 555-574, 1994.
[266] A. Martin Andres, A. Silva Mato, J. M . Tapia Garcia, and M. J.Sanchez Quevedo, “Comparing the asymptotic power of exact tests in2 2 tables”, Comp. Stat. Data Anal., vol. 47, pp. 745-756, 2004.
[267] S. T. Perkins et al., “Tables and Graphs of Atomic Subshell andRelaxation Data Derived from the LLNL Evaluated Atomic DataLibrary (EADL)”, Z=1-100, UCRL-50400 Vol. 30, 1997.