validation of a risk assessment form for recreational water … · the use of water - suchbodies as...
TRANSCRIPT

Validation of a Risk Assessment Form for Recreational Water Bodies
2011
This thesis is submitted in the fulfillment of the requirements for the degree of Masters of Public Health at The University of Western
Australia, School of Population Health
Submitted by Bree Abbott
Bachelor of Science (Environmental Health)

2
Declaration
This thesis contains no material which has been accepted for any award or other degrees
in any university, and to the best of my knowledge and belief, it contains no material
previously published or written by another person, except where due reference is made in
the text of this thesis.
_________________________
Bree Abbott

3
Abstract Pollution of recreational water bodies can pose a significant public health risk. Accurate
determination of pollution sources usually requires completion of a sanitary inspection.
Therefore, there is a need to develop a practical, semi-quantitative, comprehensive annual
risk assessment form to assign sanitary inspection categories to recreational water bodies
in accordance with the requirements of National Health and Medical Research Council
Guidelines for Managing Risks in Recreational Waters. Currently there is no suitable
form prescribed or available that enables the documentation of a sanitary inspection to
meet the requirements of the national guidelines.
A sanitary inspection is designed to identify faecal pollution sources that could impact on
recreational water quality, and is used to underpin the application of microbiological
criteria. Based on the results of the sanitary inspections, recreational waters are ranked
(from very low to very high) depending on the perceived public health risk and level of
uncertainty.
For the purposes of this Master’s thesis, a validated reporting form has been designed and
trialed at a variety of Australian recreational water bodies, including marine and estuarine
waters. The form incorporates risk management principles of AS/NZS ISO 31000:2009
(Standards Association of Australia 2009) by assessing the likelihood and consequence of
pollution occurring from characteristic pollution sources. These include wastewater
treatment plants, stormwater drains, on-site wastewater systems, riverine discharge,
animals, boating, and agricultural activities.
Feedback on the functionality of the form has been provided by Australian State/Territory
and local government authorities, and over the course of the completion of this thesis, the
form has now been adopted by a number of recreational water managers across Australia.
This sanitary inspection form is therefore recommended as a practical reporting tool that
can be applied by recreational water managers to classify recreational water bodies in
accordance with the national guidelines.

4
Published article Accompanying this thesis, the researcher submitted an article entitled “Microbial Risk
Classifications for Recreational Waters and Applications to the Swan and Canning Rivers
in Western Australia” that was published in the Journal of Water and Health in 9 January
11. This paper is included in Appendix 1.

5
Contents ACKNOWLEDGEMENTS ................................................................................................ 8 CHAPTER ONE: INTRODUCTION ............................................................................... 10
1.1 Background ............................................................................................................. 10
1.2 Statement of the Problem ........................................................................................ 11
1.3 Benefits of the Study ............................................................................................... 12
1.4 Aim ......................................................................................................................... 12
1.5 Objectives ............................................................................................................... 13
CHAPTER TWO: LITERATURE REVIEW ................................................................... 15
2.1 Health Effects Associated With Recreational Waters............................................. 15
2.1.1 Waterborne Pathogens and Human Disease 15 2.1.2 Factors Influencing Infection in Humans 18 2.1.3 Faecal Indicator Bacteria 19
2.2. Recreational Water Quality Guidelines ................................................................. 21
2.2.1 World Health Organization Guidelines 22 2.2.2 Australian Guidelines 23 2.2.3 European Union Directive 25 2.2.4 United States Guidelines 26 2.2.5 New Zealand Guidelines 27
2.3 Sanitary Inspection .................................................................................................. 28
2.3.1 Sources of Faecal Pollution 29 2.3.2 Factors Influencing Faecal Indicator Bacterial Survival 35 2.3.3 Types of Sanitary Inspections 36 2.3.4 Comprehensive Start-up Sanitary Inspection Process 37
2.4 Sanitary Inspection Category .................................................................................. 40
2.4.1 Risk Based Approaches 40 2.5 Sanitary Inspection Forms ...................................................................................... 43
2.5.1 Water Services Association of Australia Form 43 2.5.2 New Zealand Sanitary Inspection Form 44 2.5.3 United States Sanitary Inspection Form 45
CHAPTER THREE: METHODOLOGY ......................................................................... 48
3.1 Introduction ............................................................................................................. 48
3.2 Design of the Comprehensive Sanitary Inspection Form ....................................... 48
3.2.1 Form Questions 49 3.2.2 Risk Assessment 50

6
3.3 Validation of Sanitary Inspection Form .................................................................. 53
3.3.1 Testing the Form for Face Validity 54 3.3.2 Testing the Inter-rater Reliability of the Form 57
3.4 Example of the SI Form Application ...................................................................... 61
CHAPTER FOUR: RESULTS ......................................................................................... 64
4.1 Feedback on Workshops and other Stakeholder Inputs .......................................... 64
4.2 Validity and Practicality of the SI Form ................................................................. 71
4.3 Inter-rater Reliability............................................................................................... 72
CHAPTER FIVE: DISCUSSION AND CONCLUSION ................................................ 74
5.1 Discussion of principal findings ............................................................................. 74
5.2 Comparison of the new SI form with other available assessments ......................... 76
5.3 Future modifications and applications .................................................................... 76
5.4 Conclusion .............................................................................................................. 78
REFERENCES ................................................................................................................. 80
Appendix 1: Published article ....................................................................................... 96
Appendix 2: Water Services Association of Australia Sanitary Inspection Form ...... 107
Appendix 3: New Zealand Catchment Assessment Checklist (CAC) ........................ 110
Appendix 4: United States Sanitary Inspection Form ................................................. 117
Appendix 5: Initial Sanitary Inspection Form (original version) ................................ 127
Appendix 6: Sanitary Inspection Report Form (final version) ................................... 147
Appendix 7: Sanitary Inspection Report Instructions ................................................. 171
Appendix 8: Recreational Waters Workshop Survey; User Questionnaire on the
Sanitary Inspection Form ............................................................................................ 190
Appendix 9: Example Sanitary Inspection Report for Coode Street, South Perth ..... 194
Appendix 10: Email circulated to Australian State and Territory Government
Agencies requesting feedback on the SI report form .................................................. 209
Table 1 Common pathogens detected in raw sewage…………………………………… 16 Table 2 Outbreaks associated with recreational water bodies in the USA between 1985 - 1998…………………………………………………………………………………… 17 Table 3 Classification matrix for faecal pollution of recreational water environments*.. 24

7
Table 4 Australian and international comprehensive start-up sanitary inspection models 38 Table 5 Example consequence scale…………………………………………………….. 41 Table 6 Example likelihood scale……………………………………………………….. 42 Table 7 Example matrix for determining level of risk………………………………….. 43 Table 8 Consequence which best suits the recreational water body…………………….. 51 Table 9 Qualitative definitions of likelihood of pollution………………………………. 52 Table 10 Human faecal pollution source risk assessment matrix……………………….. 53 Table 11 Animal faecal pollution source risk assessment matrix……………………….. 53 Table 12 Recreational water sites and responsible authorities who assisted with the trial of the SI form, Perth, Western Australia…………………………………………… 54 Table 13 Recreational water sites selected for inter-rater reliability……………………. 58 Table 14 Interpretation of Kappa value; strength of agreement………………………… 60 Table 15 Feedback from the sanitary inspection report survey completed at the 2009 Department of Health of Western Australia Recreational Waters Workshop trials…….. 65 Table 16 Feedback from Australian Government Agencies who trialed the sanitary inspection report form…………………………………………………………………… 66 Table 17 Inter-rater reliability using Kappa scores………………………………………72
Figure 1 A typical summer’s day, Cottesloe Beach, Western Australia ............................. 8 Figure 2 Boxing Day 2010 at Scarborough Beach, Perth, Western Australia .................... 9 Figure 3 Early morning rise, Swan River (near Garrat Road Bridge), Western Australia 14 Figure 4 Common sources of faecal pollution pathways into a recreational water body (adapted from Kronvang 2009) ......................................................................................... 30 Figure 5 Stormwater drain discharging into the Swan River, Perth, Western Australia .. 32 Figure 6 Wildlife commonly seen in the Upper Swan River, Western Australia………..34 Figure 7 Coastal birdlife, Rockingham Beach, Western Australia………………………34 Figure 8 Bather density in summer at Scarborough Beach, Perth, Western Australia…..35 Figure 9 The Swan River, a recreational playground, Perth, Western Australia………...47 Figure 10 Summer life, Trigg Beach, Western Australia………..………………………63 Figure 11 The City of Perth landscape, taken opposite Coode Street Beach, South Perth73

8
ACKNOWLEDGEMENTS
I wish to thank the School of Population Health, The University of Western Australia and
the Environmental Health Directorate, of the Western Australian Department of Health,
for the opportunity to undertake this course of study.
A big thank you goes to my supervisor Brian Devine for his constant support and
encouragement. Brian always made himself available, and provided constructive advice
and persistent encouragement throughout my study, and I am forever grateful.
I would also like to thank Dr Richard Lugg, Professor Phil Weinstein, and Dr Angus
Cook for their expertise and ongoing interest in the field of recreational water quality, as
well as my work colleagues from the Environmental Health Directorate, Jim Dodds, Llew
Withers, John Hardy and Jared Koutsoukos.
A special thank you also goes out to my close friends and family.
Figure 1 A typical summer’s day, Cottesloe Beach, Western Australia

9
CHAPTER ONE
INTRODUCTION
Figure 2 Boxing Day 2010 at Scarborough Beach, Perth, Western Australia

10
CHAPTER ONE: INTRODUCTION 1.1 Background
The use of water bodies - such as fresh and marine environments - for recreational
purposes is widely practiced throughout the world. Yet worldwide popular swimming
locations have been subjected to pressure from population growth and human activity,
leading to once pristine recreational water bodies being increasingly polluted by
pathogenic (disease causing) microorganisms. This contamination makes them potentially
unsuitable for swimming (WHO 2003a).
Numerous studies have documented the health risks associated with recreating in faecally
polluted recreational water bodies (Balarajan et al. 1991; Corbett et al. 1993; Fattal et al.
1987; Given 2006; Haile et al. 1999; Von Schirnding et al. 1992). A United States study
conducted on two beaches in California alone estimated the health burden of recreational
water related illnesses to exceed US $3.3 million per year (Dwight et al. 2005). Such an
economic burden imposed on societies from polluting recreational water bodies
highlights the need for improved management of recreational water quality issues, with a
focus on better understanding and identifying faecal pollution sources.
In recent years, a new approach to the management of recreational water quality issues
has been formulated whereby the recreational water body is classified by a combination
of a sanitary inspection and microbiological water quality criteria (as opposed to the
traditional pass/fail approach using microbiological water quality criteria) (NHMRC
2008; WHO 2003a). This new approach provides information on possible sources of
pollution, as well as numerical information on the likely level of faecal pollution
(Bartram & Rees 2000; WHO 1999).
The sanitary inspection (SI), a screening approach designed to identify all pollution
sources likely to cause faecal contamination of a water body, is now considered to be a
fundamental component to assess the human health risks of recreational water quality
(NHMRC 2008).
11
1.2 Statement of the Problem
Health risk assessment is based on the concept that all situations carry some degree of
risk and that analysis of these risks can contribute to decisions aimed at minimising harm
to individuals and communities (Department of Health 2006). With the focus now on
undertaking an initial comprehensive sanitary inspection as part of the human health risk
assessment of recreational water quality, there is a need for a practical and standarised
approach for completing a sanitary inspection and assigning a sanitary inspection
category (SIC) to recreational water environments.
While several SI models have been designed (Bartram & Rees 2000; USEPA 2008b;
New Zealand Ministry for the Environment 2003; WHO 2003a; WSAA 2003), there has
been no practical format that ranks individual faecal pollution sources according to one of
the five SIC (very low to very high), as now provided for in the World Health
Organization (WHO 2003a) and Australian Guidelines (NHMRC 2008). This ranking
allows the assigning of a risk classification that is considered a true reflection of the
human health implications of the water quality. This ranking system is needed to assist
water managers assign the overarching SIC, which is later used, in conjunction with the
microbial category to calculate the final risk classification for a site.
Sanitary inspections will commonly be conducted by a diverse range of water managers,
from state and local governments (including metropolitan and regional areas), and
industry or community representatives. These individuals and agencies will have
varying levels of knowledge and expertise of, and resources for, recreational water
quality management. Furthermore, the application of recreational water quality
guidelines in the majority of the Australian States and Territories are not well regulated.
Therefore the SI process needs to be practical, yet as reliable as possible to ensure a
higher degree of compliance and adoption of the process and to enable consistency when
comparing classification processes from state to state and person to person.

12
1.3 Benefits of the Study
The introduction of a health risk assessment approach for undertaking sanitary
inspections will be of significant benefit to water managers. The design of a practical and
reliable sanitary inspection form will enable water managers:
• to document all potential faecal pollution sources likely to impact on a
recreational water body so as to apply a sanitary inspection category ranking (very
low to very high);
• to apply the sanitary inspection category to derive the microbial water quality
assessment category;
• to prioritise and allocate resources for removing or mitigating faecal pollution
sources that may impact on recreational water quality; and
• to maintain an historical record of the assessment process and classification
applied to each site which will serve as a baseline for future assessments.
1.4 Aim
The aim of this study is to develop and validate a standardised form that will allow a
comprehensive health risk assessment as part of the sanitary inspection process. This
form will be used to assign a sanitary inspection category which can be applied in
assessing Australian recreational water bodies, in accordance with the Australian
‘Guidelines for Managing Risks in Recreational Water’ (NHMRC 2008).

13
1.5 Objectives
The objectives of the study are to design a sanitary inspection form that fulfills the
following criteria:
1. Semi-quantitative yet practical to apply
2. May be used to assign faecal pollution sources of human and animal origin into
an appropriate sanitary inspection category, incorporating risk management
principles of AS/NZS ISO 31000:2009 (Standards Association of Australia 2009)
3. Relates land and water use activities to the likelihood of human pathogen
presence
4. May be applied to, and is adaptable to, a variety of recreational water bodies,
including fresh, estuarine and marine waters
5. Provides a model instrument for consistency and reduces subjectivity from user
to user when assigning a SIC for a site; and
6. Provides an appropriate form for undertaking SI as required under Chapter 5 of
the NHMRC Guidelines for Managing Risks in Recreational Waters (NHMRC
2008)

14
CHAPTER TWO
LITERATURE REVIEW
Figure 3 Early morning rise, Swan River (near Garrat Road Bridge), Western Australia

15
CHAPTER TWO: LITERATURE REVIEW
The following is a review of literature published on the current assessment and
management of microbial pollution of recreational water bodies, with a focus on the
development and implementation of sanitary inspections and the assignment of a sanitary
inspection category.
The review examines:
• the human illness associated with microbial pollution in recreational waters, and
outbreaks that have occurred worldwide
• the development of national and international recreational water quality criteria
• the common point and non-point sources of faecal pollution; and
• the sanitary inspection approaches used to assess recreational water quality and
the limitations of these models when applying current Australian recreational
water quality criteria.
2.1 Health Effects Associated With Recreational Waters 2.1.1 Waterborne Pathogens and Human Disease
Pathogens, which include bacteria, viruses, and protozoa, are microorganisms that can
cause disease in humans (Bartram & Rees 2000; Pond 2005). Recreational water bodies
may become contaminated with a diverse range of pathogenic and non-pathogenic
microorganisms as a result of pollution from human and animal faecal material (Bartram
& Rees 2000; NHMRC 2008; WHO 1999; WHO 2003a).
Common sources of faecal pollution in recreational waters will be discussed in more
detail in later Chapters, but typically include treated and untreated wastewater,
stormwater pollution, the bathers themselves (from defecation and/or shedding),
agricultural runoff, wild and domestic animals, and industrial processes (Bartram & Rees
2000; WHO 2000; WHO 2001; WHO 2003a).

16
The types and numbers of pathogens in faecal material will differ depending on the
incidence of disease and carrier status in the contributing human and animal populations
and the seasonality of infections. Hence, the number of pathogens in human and animal
faeces may vary significantly in different parts of the world (USEPA 2009; WHO 2003a).
Table 1 outlines common pathogens typically detected in raw sewage.
Table 1 Common pathogens detected in raw sewage Viruses Parasitic protozoa Bacteria Rotaviruses Cryptosporidium parvum
oocysts Campylobacter spp.
Adenoviruses Entamoeba histolytica Clostridium perfringens spores
Noroviruses Giardia lamblia cysts Escherichia coli Hepatitis A Salmonella spp. Hepatitis E Shigella spp. Source: (NHMRC 2008, Table 5.2)
Many studies have documented human illnesses, such as gastroenteritis and
cryptosporidiosis, associated with swimming in faecally contaminated waters (Balarajan
et al. 1991; Corbett et al. 1993; Fattal et al. 1987; Pond 2005). The number of
microorganisms that may cause infection (the infective dose) or disease depends upon the
specific pathogen, the form in which it is encountered, the conditions of exposure and the
host’s susceptibility and immune status (WHO 2003a).
Numerous epidemiological studies suggest that swimming and other whole of body
contact activities (immersion of the head) in faecally polluted water can increase the risk
of gastrointestinal disease, respiratory problems, ear, eye and skin ailments (Cabelli
1983; Cabelli 1989; Corbett et al. 1993; Fleisher et al. 1996; Kay et al. 1994; Prüss 1998;
Wade et al. 2003; USEPA 2009).
Prüss (1998) concluded that enteric illnesses, such as diarrhoea and vomiting, and acute
febrile respiratory illness are the most frequently investigated and reported adverse health
outcomes in the published literature. Although these illnesses are often mild and self-
limiting, there are also a number of waterborne pathogens that can cause illness with

17
severe outcomes such as hepatitis, enteric fever or even poliomyelitis (Pond 2005).
However, most epidemiological investigations either have not addressed severe health
outcomes or have been undertaken in areas of very low background rates of such diseases
(WHO 2003b).
Nevertheless, severe disease outbreaks have occurred worldwide in both treated and
untreated recreational water bodies, with the most frequently identified agents being
Cryptosporidium, Pseudomonas, Shigella, Naegleria, Giardia, and toxigenic E. coli
(Craun et al. 2005; Pond 2005; WHO 2003). Examples of pathogens that have been
linked to swimming-associated disease outbreaks in the USA between 1985 and 1998 are
listed in Table 2.
Table 2 Outbreaks associated with recreational water bodies in the USA between 1985 - 1998
Etiological agent Number of cases Number of outbreaks Shigella spp. 1780 20
Escherichia coli O157:H7 234 9
Leptospira sp. 389 3
Giardia lamblia 65 4
Cryptosporidium parvum 429 3
Norwalk-like viruses 89 3
Adenovirus 595 1 Acute gastrointestinal infections (no agent
identified) 1984 21
Source: WHO 2003a
Craun et al. (2005) details an outbreak of shigellosis which was associated with
swimming at a human-made lake in Los Angeles, USA in 1985. Sixty eight people had
onset of diarrhoea within one week following exposure to the recreational water body.
Thirty-three of these cases were confirmed as shigellosis (29 Shigella sonnei, 4 Shigella
boydii), with fifteen persons being hospitalised. The illness was shown to be highly
associated with water contact, specifically swallowing water while swimming ( p< 0.001)

18
and age less than 15 years ( p< 0.001). Water samples from the swimming area indicated
high faecal indicator bacteria counts.
In a Western Australian context, Snow (1981) detailed an outbreak of typhoid fever in
1958 at City Beach, Perth. Ten of the fifteen cases involved were attributed to swimming
at one of Perth’s most popular ocean beaches. At the time, this beach was exposed to
pollution from effluent emanating from the Perth’s main sewage treatment plant. The
sewage outfall at the time was only 100 metres long and fractured in two places, causing
a plume of untreated effluent to flow towards the beach. Complaints of odour and brown
discolouration to the water were reported. The Public Health Authority at the time closed
the beach and significant funding was invested in upgrading the treatment plant.
The typhoid event was the catalyst for the Public Health Authority to establish a routine
sampling program for all recreational water sites along the coastline and in the Swan and
Canning Rivers. This program continues to this day.
2.1.2 Factors Influencing Infection in Humans
Different behaviours within populations of swimmers are an important risk factor for
infection. Exposure-related factors, including the duration of time spent in the water and
the quantity of water ingested, will influence a person’s risk of experiencing a waterborne
illness. The longer a person is in the water the more they can be exposed to pathogens in
the water through ingestion, inhalation or penetration of the skin (Pond 2005). The US
Environmental Protection Agency (USEPA) estimates that 100mL of water enters the
mouth and nasopharynx during a typical swimming episode (USEPA 1999).
Susceptible populations, including people with reduced immune function e.g. resulting
from disease (cancer, human immunodeficiency virus (HIV), genetic susceptibility (age),
or lack of acquired immunity to locally endemic diseases (e.g. tourists) may be at higher
risk of contracting severe illness (Kay et al. 1994; Pond 2005).

19
Children are at particular risk of contracting waterborne illnesses. Children tend to be
more frequent water users and immerse themselves for longer periods of time compared
to older age groups, and their activities may increase exposure to contamination through
accidental ingestion (Corbett et al. 1993; Kay et al. 1994; Pond 2005). Special interest
groups such as surfers, people who snorkel, and divers may be at particular risk as the
amount of time spent under water is significantly increased. However, very few studies
and recreational water guidelines have considered these groups (Pond 2005; Schijven et
al. 2006).
Schijven et al. (2006) estimated the volume of water swallowed by occupational and
sports divers as a key factor for infection risk assessment associated with diving. The
findings suggested that there was a high incidence of reported health complaints from
divers, who are subject to a higher risk of infection with waterborne pathogens.
Dwight et al. (2004) compared rates of reported health symptoms among surfers during
two winters. The findings suggested that for every 2.5 hours of weekly water exposure,
surfers experienced a 10% increase in the probability of illness (such as gastrointestinal
illness, stomach pain, vomiting, and diarrhoea).
One overseas study reported higher attack rates for gastroenteritis in visitors to a locality
compared to the resident population, suggesting that immune status may play a role in the
presentation of illness. This suggests that populations may differ in their susceptibility to
waterborne diseases (Pond 2005).
2.1.3 Faecal Indicator Bacteria
Methods for detecting and identifying water borne pathogens are difficult to perform,
time consuming, costly and in some cases may not even exist (Boehm 2003a; Boehm et
al. 2003b; WHO 1999). In the absence of rapid and cost-efficient techniques to directly
detect major pathogens, the common practice is to use faecal indicator bacteria (FIB) to
infer the presence or potential presence of pathogenic microorganisms of faecal origin
(Bartram and Rees 2000; NHMRC 2008; Stevens et al. 2003; WHO 2003a).

20
FIB are not necessarily pathogenic themselves, but are abundant in wastes with human
and animal contributions where pathogenic organisms, such as viruses, are likely to exist
(Balarajan et al. 1991; Cabelli 1983; Corbett et al. 1993; Fattal et al. 1987; Haile et al.
1999; Prüss 1998; NHMRC 2008; Von Schirnding et al. 1992).
While the use of FIB to measure water quality is widespread, there is no universal
agreement on which indicator organism(s) is the most useful. In order for a faecal
indicator to be suitable as an indicator organism it should ideally display a number of
characteristics:
• The indicator should be exclusively of faecal origin and consistently present in
fresh faecal waste
• The indicator should occur in greater numbers than the associated pathogens
• The indicator should be more resistant to environmental stresses and persist for a
greater length in time than the pathogen
• The indicator should not be capable of proliferation to any great extent in the
environment; and
• The indicator should have simple, reliable, and inexpensive methods available for
the detection, enumeration, and identification of the organism (Cabelli 1983;
NHMRC 2008; WHO 1996; WHO 1999).
Today, the most commonly used faecal indicators for recreational waters include
Escherichia coli (E.coli), Thermotolerant coliforms (TC) and enterococci (Nobel et al.
2003; NHMRC 2008). However, enterococci is now considered to be the single most
preferred FIB for recreational waters due to enterococci exhibiting a clear dose-response
relationship with disease outcomes (Kay et al. 1994; Turbow et al. 2003; Wade et al.
2006; Wiedenmann et al. 2006; Zmirou et al. 2003).

21
2.2. Recreational Water Quality Guidelines
“A recreational water quality criterion is defined as a quantifiable dose-response
relationship based on scientific evidence between the level of some indicator of the
quality of the water concerned and the potential human health risks associated with the
recreational use of that water” (Georgiou 2002; Salas 1986). A water quality guideline
derived from such a criterion is a suggested maximum density of the indicator in the
water which is associated with unacceptable health risks (Salas 1986).
Although not mandatory in most Australian States and Territories, recreational water
quality guidelines are necessary at popular swimming locations to protect the health of
recreational water users and to preserve the aesthetic qualities of the water (NHMRC
2008). Worldwide recreational water guidelines have been successful in: the clean-up of
recreational water bodies, increasing public awareness, contributing to informed personal
choice and contributing to an increase in public health benefits (Hagedorn et al. 1999;
WHO 1999).
Traditionally, Australian and international recreational water guidelines for assessing
public risks have been largely based on percentage compliance of faecal indicator
bacteria counts (NHMRC 2008; WHO 1999). In Australia, the common practice has
been to use faecal coliforms, with:
- a median value of less than 150 cfu/100mL for a minimum of five samples taken
at regular intervals not exceeding one month
and
- four out of the five samples having less than 600 cfu/100mL,
or
- a geometric mean of 33 enterococci/100mL (ANZECC 2000; NHMRC 1990).
Leading experts in recreational water quality are now of the opinion that the adequacy
and effectiveness of the percentage compliance approach to monitoring and managing
faecally polluted recreational waters are limited (Ashbolt & Bruno 2003; USEPA 2007;

22
Kay et al. 2004; NHMRC 2008; WHO 1999; WHO 2003a). Notably, management
actions to noncompliant results were retrospective and could only be deployed after
human exposure to the hazard. Beaches were either classified as safe or unsafe with no
gradient of increasing severity of risk. Also, limited information was available to the
public on bacterial water quality, and the traditional faecal indicators used were usually
from non-faecally derived sources (NHMRC 2008; WHO 1999; WHO 2003a).
2.2.1 World Health Organization Guidelines
In 1998, the WHO convened a meeting of world experts in Annapolis, USA, to discuss
issues relating to recreational water quality. These experts agreed on the need for an
improved approach to the regulation of recreational water that better reflected health risks
and provided enhanced scope for effective management intervention (WHO 1999). As a
result of the meeting, a new approach to the management of recreational water issues was
formulated and termed the ‘Annapolis Protocol’ (WHO 1999).
The protocol applied a health risk assessment framework to the context of recreational
water quality. During the last decade, the use of the health risk approach has been
promoted by many researchers and institutions, with WHO being instrumental in
integrating it into both drinking water and recreational water guidelines (Medema &
Smeets 2004). The approach recognises that all situations carry some degree of risk and
that analysis of these risks can contribute to decisions aimed at minimising harm to
individuals and communities (Department of Health 2006; enHealth 2004). In general
terms, a risk is the probability that an adverse health outcome will occur in a given
situation in a certain timeframe. A hazard is the capacity of an agent to produce a
particular type of adverse health effect (enHealth 2004).
The Annapolis Protocol’s health risk assessment framework provides for the management
of risks associated with the microbial quality of recreational water by combining sanitary
inspection and microbial water quality assessment. This approach provides information

23
on possible sources of pollution, as well as numerical information on the likely level of
faecal pollution (WHO 1999; Bartram and Rees 2000).
In 2001, a further expert consultation subsequently reviewed the Annapolis Protocol,
together with the latest evidence available to update measures for the protection of
recreational water users from hazards associated with faecal pollution of the waters. The
revised new approach was termed the ‘Farnham Protocol’ (WHO 2003b; WHO 2000),
being held in Farnham, UK, in 2001.
The Farnham Protocol was then was adopted by the WHO in 2003, with the release of the
‘Guidelines for Safe Recreational Water Environments. Volume 1 – Coastal and Fresh
Waters’. These guidelines lead the principal focus of recreational water guidelines
expanding from retrospective numerical compliance to include real-time management and
public health protection (WHO 2003a).
National and international adaptations of the WHO approach to managing
microbiological recreational water quality, with particular focus on the adaptation of the
sanitary inspection process; will be discussed in the following sections.
2.2.2 Australian Guidelines
In October 2005, the National Health and Medical Research Council (NHMRC),
Australia’s leading expert body promoting the development and maintenance of public
health standards, subsequently adopted the 2003 WHO framework for the Australian
setting and released the 2005 NHMRC Guidelines for Managing Risks in Recreational
Waters (reissued in 2008).
The NHMRC Guidelines are a major revision of previous Australian recreational water
guidelines, providing a mechanism for communicating substantiated information to the
public on microbial risks in popular recreational water bodies (NHMRC 2008).

24
Chapter Five of the Guidelines – Microbial Quality of Recreational Water, adopts the
health risk assessment approach (Table 3) which is used to assign risk classifications or
‘beach grades’ (from very good to very poor) to popular swimming locations depending
on the perceived public health risk and level of uncertainty (NHMRC 2008). The
classifications are achieved by combining:
a) Microbial assessment category (MAC), which uses historical enterococci counts
to provide a measurement of actual water quality over time; and
b) Sanitary inspection category (SIC), which measures the susceptibility of the
water body to faecal contamination (NHMRC 2008).
The classifications (Table 3) are used by water managers to determine the safety status of
the recreational water and to promote informed choices to the public as a risk
management strategy. This approach aims to provide generic statements on the level of
public health risk a particular water body may present to a water user, rather than solely
relying on the traditional percentage compliance of faecal indicators.
Table 3 Classification matrix for faecal pollution of recreational water environments*
Microbiological Assessment Category (95th percentiles - intestinal enterococci /100mL)
Exceptional circumstancesc
A ≤40
B 41–200
C 201–500
D >500
ACTION
Sanitary Inspection Category (suscept-
ibility to faecal influence)
Very low Very Good Very Good Follow upb Follow upb
Low Very Good Good Follow upb Follow upb
Moderate Gooda Good Poor Poor
High Gooda Faira Poor Very Poor
Very high Follow upa Faira Poor Very Poor
Exceptional circumstancesc ACTION
Source: (NHMRC 2008 Table 5.13) a Indicates possible discontinuous/sporadic contamination (often driven by results such as rainfall). This is
most commonly associated with the presence of combined sewer overflows. These results should be investigated further, and initial follow-up should include verification of the sanitary inspection category and ensuring that samples recorded include ‘event’ periods. Confirm analytical results, review possible analytical errors.
b Implies nonsewage sources of faecal indicators (eg livestock) which need to be verified.

25
c Exceptional circumstances are known periods of higher risk, such as during an outbreak involving a pathogen that may be waterborne (eg avian botulism – where outbreaks of avian botulism occur, swimming or other aquatic recreational activities should not be permitted), rupture of a sewer in a recreational water catchment etc. Under such circumstances, the classification matrix may not fairly represent risk/safety.
* In certain circumstances, there may be a risk of transmission of pathogens associated with more severe health effects through recreational water use. The human health risk depends greatly on specific (often local) circumstances. Public health authorities should be engaged in the identification and interpretation of such conditions.
Risk classifications help to determine whether ongoing monitoring is required, and
provide the basis for informing the public as to whether or not the water is suitable for
recreational use (New Zealand Ministry for the Environment 2003; NHMRC 2008). The
classifications describe the general water quality at any given time, based on both risk
and faecal indicator bacteria counts.
The Guidelines form the basis of acceptable risk. Salas (1986) defines acceptable risk as
the level of risk that is protective of public health for a population considering cost,
feasibility, and other considerations. Acceptable risk figures are commonly used to derive
water quality standard in an attempt to be protective of health goals, understandable,
tolerated by the public, scientifically defensible, implementable, and roughly equal to the
other risks faced by members of the community (Department of Health 2006; enHealth
2004; Salas 1986). Although an acceptable risk level can be difficult to identify, it is
often necessary so that a management goal can be defined.
For most healthy people, water conforming to the Guideline value will pose only a
minimal increase in daily risk. However, even water that conforms to the guidelines may
still pose a potential health risk to high-risk user groups such as the very young, the
elderly and those with impaired immune systems (NHMRC 2008).
2.2.3 European Union Directive
On the 24 March 2006, the Bathing Water Directive (2006/7/EC) came into force in the
European Union (EU), which was transposed into EU law within two years of this date
(DEFRA 2009; EUROPA 2009). The 2006 Directive subsequently replaced the previous
1976 Bathing Water Directive (76/160/EEC).

26
Key changes to the Directive included a tightening of water quality standards and a
requirement to provide information about bathing waters to the public on signage on
beaches and on the internet. The revised Directive sets four new classifications of water
quality (excellent, good, sufficient and poor), with all bathing waters expected to achieve
at least the “sufficient” classification by 2015, with limited exceptions (DEFRA 2009;
EUROPA 2009).
The Directive establishes separate numerical microbiological criteria for fresh (inland)
and marine (coastal and transitional) bathing waters for the twenty four EU member
states. The numerical values are based on the WHO 2003 Guidelines (Kay et al. 1994)
and an additional study conducted by Wiedenmann et al. (2006).
The Directive does not adopt the SI component used to assign the overall risk
classification or beach grade. Instead, it uses the numerical microbial water quality
assessment to categorise the probability of exposure to human pathogens (DEFRA 2009;
USEPA 2007; EUROPA 2009).
Additionally, bathing waters under the administration of the United Kingdom, which
form part of the EU, are subject to the Bathing Waters Regulations 2008, issued by the
Secretary of State for the Environment, Food and Rural Affairs on 26 September 2008.
Part 2: Bather Water Profiles outlines the requirements for undertaking ‘bathing water
profiles’, which are descriptions of the bathing water and the potential impacts and
threats to water quality, a similar concept to SI. Details of the bather water profiles can be
used in the overall bather water assessment outlined in Part 4: Bather Water Assessment
and Classification (DEFRA 2009).
2.2.4 United States Guidelines
In 1986, the US Environmental Protection Agency (USEPA) published a criteria
document titled the Ambient Water Quality Criteria (AWQC) for Bacteria 1986 (USEPA
2009). This document was adopted in the Water Quality Standards for Coastal and Great

27
Lakes Recreation Waters Rule (or Beach Act) (USEPA 2004) which requires US States
and Tribes to adopt the 1986 AWQC for Bacteria. The USEPA criterion relies solely
upon microbiological criteria and does not formally adopt the sanitary inspection process.
In 2007, the USEPA held an expert scientific workshop with the intent to discuss the
development of new or revised national recreational ambient water quality criteria
(USEPA 2007). Subsequently, a report was released following the workshop which
discussed the application of the WHO framework with reference to sanitary inspections
(USEPA 2007). The report identified a need for a relatively simple to implement,
standarised quantitative based sanitary inspection investigation rather that a qualitative
process.
In May, 2008 the USEPA released the “Great Lakes Beach Sanitary Survey User
Manual” to provide beach managers with a consistent approach to identify pollution
sources and share information (USEPA 2008b). This model will be discussed further in
section 2.5.3. It is likely that future updates to the US criteria may involve adoption of the
SI approach as part of the overall risk assessment.
2.2.5 New Zealand Guidelines
The New Zealand Ministry for the Environment and the Ministry of Health released the
Microbiological Water Quality Guidelines for Marine and Freshwater Recreational
Areas in 2003 (New Zealand Ministry for the Environment 2003). The framework of
these Guidelines encompasses the two key components of the 2003 WHO model by
assigning a beach grade to a recreational water body by combining the sanitary inspection
category with the historical microbiological results.
These two combined components give an overall suitability for recreation grade (SFRG),
which describes the general condition of a site at any given time, based on both risk and
faecal indicator bacteria counts (New Zealand Ministry for the Environment 2003).

28
The Guidelines establish separate surveillance, alert and action microbiological criteria
modes for freshwater and marine bathing waters. The numerical values are based on the
epidemiological studies reported in the WHO 2003 Guidelines (Kay et al. 1994) and an
additional study conducted by Wiedenmann et al. (2006).
The NZ Ministry of Environment has developed a software package entitled
“Bathewatch” which has been specifically designed to assist water managers determine
the suitability for recreation grade (SFRG) or beach grade. The NZ approach to assigning
SI will be discussed in Section 2.5.
2.3 Sanitary Inspection
The SI is designed to provide a detailed inventory and assessment of all pollution sources
likely to cause faecal contamination of a water body (Bartram & Rees 2000; USEPA
2008b). It categorises each recreational water environment according to the severity of
the overall adverse faecal impact to which it is judged susceptible. It also provides the
basis for designing and implementing an effective water quality sampling program and
provides valuable information to assist in the interpretation of water quality data (Bartram
& Rees 2000).
The SI focuses on identifying dominant land and water based faecal pollution sources,
including human and animal wastes, potentially impacting on the water quality of each
site (Bartram & Rees 2000). The identification of human faecal pollution sources is
particularly important because they represent a greater risk to health, and will tend to
drive the overall SIC assigned to a site (NHMRC 2008; USEPA 2007; WHO 2003a).
The three most important sources of human faecal contamination of recreational water
bodies for public health purposes are typically sewage, riverine discharges and direct
contamination from bathers (NHMRC 2008; USEPA 2007; WHO 2003a).
Animal sources such as agricultural pollution, wildlife and domestic animals, cannot be
ignored and infectivity factors (USEPA 2009; WSAA 2003) are useful indicators in
determining such significance.

29
The SI uses a qualitative risk assessment approach by assigning a faecal pollution source
into one of five sanitary inspection categories (SICs) ranging from very low to very high
in terms of susceptibility to faecal influence. This qualitative approach is presented as a
‘screening approach’ for the purpose of determining a sanitary inspection category.
2.3.1 Sources of Faecal Pollution
Several sources of faecal pollution may exist in recreational water environments
including marine, estuarine and fresh waters. These sources are categorised as either:
1. Point sources
Point sources of faecal pollution are the readily identifiable inputs where waste is
discharged to the receiving waters from a specific source, most commonly from a pipe or
drain (USEPA 2008a). The City Beach, Perth, WA, example as mentioned in Chapter 1,
Section 2.1, is a good example of point source pollution from a sewage outfall that caused
a typhoid outbreak at a nearby popular swimming beach (Snow 1981).
2. Non-point sources
Non-point source pollution, also known as diffuse sources, are a major contributor to
water pollution in many waterways around the world. Unlike point source pollution, non-
point source pollution comes from a wider area and can include agriculture, forestry,
grazing, septic systems, boating, urban runoff and construction. Non-point source
pollution generally occur when rain or irrigation picks up human and/or animal faecal
pollution and transports them (on land or via groundwater) into nearby waterways at any
given time (USEPA 2008a; Kinzelman et al. 2004; Hagedorn et al. 1999; Calderon et al.
1991).
The porous and varied terrain of natural landscapes like forests, wetlands, and grasslands
trap rainwater and allow it to slowly filter into the ground. This runoff tends to reach
receiving waters gradually. In contrast, nonporous urban landscapes like roads, bridges,

30
parking lots, and buildings do not allow runoff to slowly percolate into the ground.
Therefore, the water remains above the surface, accumulates, and runs off in large
amounts into the receiving waters.
Common point and non-point sources that impact on the receiving waters of recreational
waters are discussed in more detail below. Figure 4 provides a graphical representative of
these sources.
Figure 4 Common sources of faecal pollution pathways into a recreational water body (adapted from Kronvang 2009)
Rainfall runoff
Numerous studies have highlighted the influence of rainfall patterns on FIB counts in a
receiving water body (Ackerman & Weisberg 2003; Ashbolt & Bruno. 2003; Hill et al.
2006; Hose 2005; Shehane et al. 2005; Signor et al. 2007; Signor et al. 2005). Local
weather patterns, including storm events, can facilitate the transport of pathogens into
natural waters, thereby leading to a decrease in water quality. Heavy rainfall can also
overwhelm wastewater treatment facilities and septic systems by reducing the efficacy of
drainfields in saturated soils, thereby leading to direct faecal inputs into a water body
(Geary 2003).

31
Rainfall runoff has been implicated in water borne disease outbreaks within the USA,
with 55% of outbreaks between 1948 to 1994 related to precipitation events (Epstein
1998). Shehane et al. (2005) showed a significant correlation with microbial densities
with increased rainfall and stream flow into Charlotte Harbor, Florida, USA.
In Melbourne (Australia), Goulding et al. (2007) examined microbial loading in streams
following a large (1 in 5 year) and small (1 in 1 year) storm event, which resulted in the
small storm having higher instream concentrations of FIB due to lesser rainfall dilution
when compared to the large storm event FIB concentrations.
In Sydney (Australia), concentrations of FIB, as well as the pathogens Aeromonas spp.,
Giardia and Cryptosporidium, were detected at increased levels in the tidal regions of the
Georges River following rainfall and subsequent overflows from combined sewage and
storm water overflows (Ferguson et al. 1996; Ferguson et al. 2003).
On-site wastewater systems
High concentrations of on-site wastewater systems (commonly known as septic tanks) in
coastal areas in the USA, including Florida and California, have been associated with
elevated nutrient as well as increased levels of bacterial and viral faecal indicators
(Harper et al. 1995; Paul et al. 1995; Choi et al. 2003). Geary (2003) used tracers in
assessing on-site system failure into nearby waterways as part of the New South Wales
Port Stephens Council SepticSafe program. The study detected failures in a number of on-
site wastewater systems that were contributing to unsanitary conditions in nearby
waterways.
Stormwater
The effect of stormwater conveyance systems and their impact on water quality has been
well documented (Brownell et al. 2007; Ahn et al. 2005; Le Fevre & Lewis 2003).
Brownell et al. (2007) found that during a rain event, recreational criteria for both faecal
coliforms and enterococci were exceeded, contrasting with significantly lower levels
under dry conditions. Similarly, Ahn et al. (2005) conducted field studies to assess the

32
coastal water quality impact of stormwater runoff from the Santa Ana River, California,
USA. It was concluded that stormwater runoff from the river lead to very poor surf zone
water quality, with faecal indicator bacteria concentrations exceeding California ocean
bathing water standards by up to 500%.
Figure 5 shows a typical stormwater main drain discharging into the Swan River, Perth,
Western Australia. This discharge point is only metres away from an active recreational
water area.
Figure 5 Stormwater drain discharging into the Swan River, Perth, Western Australia
Riverine discharge
The impact of water flowing from rivers in an open waterway is known to influence the
microbial loading of nearby swimming beaches (Rosenfeld el al. 2006; Kashefipour et al.
2006; Sanders et al. 2005). When runoff or other pollution sources enters a river system,
tides and current swirl may act to transport many of the pollutants downstream.
Kashefipour et al. (2006) showed that the River Irvine was the most significant faecal
pollutant input during high river flows on near shore coast waters in the United Kindgom,
and that under these conditions the bathing waters were likely to fail to comply with the
European Union Bathing Water Directive.

33
Warm blooded animal influence
Current literature (NHMRC 2008; USEPA 2008a; USEPA 2010; WHO 1999) suggests
that faecal pollution derived from animals has a significantly lower health risk to
swimmers than faecal pollution derived from humans. However there have been only a
limited number of targeted studies on the human health risks associated with swimmers
bathing in waters exclusively (or primarily) impacted by faecal contamination from
animal sources (USEPA 2007).
Cheung et al. (1990) showed that illness rates were lower at two Hong Kong beaches
impacted by pig wastes than at seven other beaches impacted by predominantly human
wastes. Calderon et al. (1991) showed no association between illness rates and faecal
contamination from animal sources in Connecticut, USA, and McBride et al. (1998)
concluded that there was no significant difference in illness risk between beaches
impacted by human versus animal faecal pollution in New Zealand. However,
contamination levels were consistently low throughout the study.
Investigations have concluded that animal faecal sources will typically influence FIB in
water (Booth et al. 2003; Hill et al. 2006; Thurston-Enriquez et al. 2005; Wither et al.
2005). Wither et al. (2005) showed an association between bird faeces and microbial
water quality. Thurston-Enriquez et al. (2005) investigated the concentration of FIB
loading on nearby water bodies from cattle manure and swine slurry runoff. The results
suggest that large microbial loads could be released via heavy rainfall events that produce
runoff from livestock manure applied agricultural fields.
A study conducted by Hagedorn et al. (1999), isolated high levels of faecal streptococci
from three sites which were classified as being predominantly from cattle (>78% of
isolates), with small proportions from waterfowl, deer, and unidentified sources (<7%
each). Based on these results, cattle access to the stream was restricted by installation of
fencing and in-pasture watering stations. Faecal coliforms were reduced at the three sites
by an average of 94%, from pre-fencing average populations of 15,900/100 mL to post

34
fencing average populations of 960/100 mL. After fencing, <45% of faecal streptococcus
isolates were classified as being from cattle.
Figure 6 and 7 shows bird life commonly sighted in river and coastal regions of Perth,
WA.
Figure 6 Figure 7
Figure 6 Wildlife commonly seen in the Upper Swan River, Western Australia
Figure 7 Coastal birdlife, Rockingham Beach, Western Australia
Bather loading
Bathers are considered to be a potential non-point source of contamination to recreational
waters. Although there are limited studies available, it is considered that bathers shed
appreciable amounts of microbes from their skin into the water column and that
swimming-related illnesses may be associated with microbial water quality, even when a
point source of faecal contamination is absent (Elmir et al. 2007; Graczyk et al. 2010).
In 1985 an outbreak of shigellosis was associated with swimming at a man-made lake in
Los Angeles, USA. Sixty eight people had onset of diarrhea within one week following
exposure to the recreational water body. Thirty-three of these cases were confirmed as
shigellosis (29 Shigella sonnei, 4 Shigella boydii), with fifteen persons being hospitalised.
Water samples from the swimming area had high FIB counts; however, dye testing
showed no evidence of sewage contamination. Direct bather contamination of the

35
swimming area may have occurred in the context of large crowds, inadequate restroom
facilities, poor water exchange, and the absence of a mechanism of disinfection.
A study conducted by Graczyk et al. (2007) demonstrated that the resuspension of bottom
sediments caused by bathers and their direct microbial input resulted in elevated levels of
Cryptosporidium parvum oocysts, Giardia lamblia cysts, and microsporidian spores,
particularly Enterocytozoon bieneusi, in recreational beach water on days deemed
acceptable for bathing by faecal bacterial standards.
A further study by Graczyk et al. (2010) in marine waters demonstrated that the
concentration of Cryptosporidium parvum, Giardia duodenalis, and Enterocytozoon
bieneusi significantly correlated with bather density (P<0.01). The study recommended
that in order to protect public health, water managers should: (a) prevent diapered
children from entering beach water; (b) introduce bather number limits to recreational
areas; (c) advise people with gastroenteritis to avoid bathing; and (d) use showers prior to
and after bathing. Figure 8 shows bather use during the summer months at the popular
Scarborough Beach, Perth, Western Australia.
Figure 8 Bather density in summer at Scarborough Beach, Perth, Western Australia 2.3.2 Factors Influencing Faecal Indicator Bacterial Survival
Environmental conditions are also known to influence the survival of Faecal Indicator
Bacteria (FIB) in recreational water (Kinzelman et al. 2004). The time it takes for FIB to
die off is dependent on a number of conditions including:

36
- Wind speed
A study in Sydney (Australia) noted that in the absence of rain events high FIB counts
could generally be explained by wind effects. Prevailing summer south-easterly winds off
the Bondi and South Cronulla beaches >7.5 ms-1 appeared to direct (rising) primary
sewage plume waters onshore (released at 60-80m depth off Bondi, and at the cliff edge
at Cronulla) (Ashbolt & Bruno 2003).
- Wave height
In the study by Ashbolt and Bruno (2003), a rising or high tide contributed to high
enterococci counts in 70% of sampling events. The study also concluded that, during
periods of dry weather, the combination of wind direction/speed and tide were important
in explaining increased FIB loading to bathing waters.
- Turbidity and solar radiation
Turbidity and solar radiation also contribute to the rapid die-off rate of FIB (Cioglia &
Loddo 1962; Kashefiour et al. 2006). Of these factors, sunlight is the principal driver for
enterococci survival (Burkhardt et al. 2000; Kay et al. 2005; Pommepuy et al. 1996;
Sinton et al. 1999; Sinton et al. 2002). The ability of sunlight to penetrate the water
column is influenced by turbidity, cloud cover, wave conditions, the position of the tide
and time of day. All of these factors ultimately determine the rate of FIB inactivation.
- Salinity
Studies have looked at the effect of salinity and the die off rate of FIB in seawater
compared to fresh water environments. These studies suggests that FIB die off more
rapidly in the more saline marine waters, compared to the fresher low saline waters
(Anderson et al 2005; Davies-Colley et al. 1994).
2.3.3 Types of Sanitary Inspections
Bartram and Rees (2000) describe three main types of sanitary inspections that can be
performed:

37
1. Comprehensive Start-up
A comprehensive sanitary inspection is relatively intensive and conducted when
establishing a site as part of a monitoring program. Comprehensive inspections
can also be used as part of the annual inspection, or assessing whether any new,
proposed or changed activity could significantly alter the microbiological quality
of the water in an existing recreational water body.
2. Annual inspection
The annual inspection is a verification of the original comprehensive inspection.
Its purpose is to ascertain if any of the circumstances have changed. It should not
only look for new sources of microbiological hazards but also review the
adequacy of the sampling program and the corrective measures in place to deal
with existing hazards.
3. Follow-up investigations
Follow-up investigations occur as a result of abnormal events, new sources of
pollution and extreme values of pollution indicators.
The remaining sections will focus on the comprehensive start-up sanitary inspection
process.
2.3.4 Comprehensive Start-up Sanitary Inspection Process
The success of a comprehensive start up sanitary inspection relies essentially on
preparation and planning. It is important that as much accurate, relevant information as
possible is collected prior to the actual physical inspection of the catchment/beach area.
This enables important issues to be identified for further investigation, improves
quantification of each risk, and minimises the need for repeat interviews and visits
(Bartram & Rees 2000).

38
In most cases the sanitary inspection of the catchment area should be undertaken in both
dry and wet weather conditions and a beach classification determined for each
circumstance (WHO 1996; WSAA 2003; NHMRC 2008). The rationale for this is that
under certain conditions (e.g. during rainfall) bathing water quality may deteriorate.
Therefore, a beach classification may be good under dry weather and poor during rainfall
driven events (Ashbolt & Bruno et al. 2003; Hill et al. 2006; Shehane et al. 2005; Signor
et al. 2007; Signor et al. 2005).
Six literature sources have been identified as providing various levels of undertakings
that are necessary for a meaningful sanitary inspection. These sources are shown in
Table 4, and the common themes and criteria identified are:
1. Define the recreational area
2. Undertake a desktop study, interviews and workshops
3. Conduct an on-site field inspection: Identifying faecal pollution sources and
4. Determine the potential health risk.
Table 4 Australian and international comprehensive start-up sanitary inspection models Author Title Chapter
Bartam and Rees
2000
Monitoring of Bathing Waters: A
practical guide to the design and
implementation of assessments
and monitoring programmes
Chapter 8: Sanitary
inspection and
microbiological water
quality
WHO 2001 Outcome of Expert Consultation,
Farnham, UK, April 2001
Box 4.7 Case study
WSAA 2003 Occasional Paper No. 8
Catchments for Recreational
Water: Conducting and Assessing
Sanitary Inspections
Full paper
New Zealand
Ministry for the
Environment 2003
Water Quality Guidelines Recreational Water Quality
Assessment Software

39
NSWDEC 2004 Part 2: Field Manual for
Monitoring the Quality of
Recreational Waters
Chapter 13: Methods for
identifying and assessing
beach pollution
USEPA 2008b May 2008 Great Lakes Beach
Sanitary Survey User Manual
Appendix C: Annual
Sanitary Survey Form
Define the recreational area
It is important to define the recreational water body of interest. For example, the relevant
area may be the official swim zone between the flags, the entire beach, or zones which
are excluded from access but where bathers will nonetheless decide to swim (NHMRC
2008).
Desktop study, interviews and workshops
The collection and review of existing data, reports, maps, and aerial photographs are
considered an essential component to the SI. This historical information provides the
tools necessary to identify faecal pollution sources and those that may not be visible
during an on-site inspection.
Not all faecal pollution sources are readily identifiable on paper and documentation may
be outdated. Therefore interviews or workshops with local community members, water
managers, parks and garden maintenance personnel and other key stakeholders familiar
with the history of the site assists in identifying potential sources (NHMRC 2008).
On-site field inspection - Identifying faecal pollution sources
An on-site visit to each site is essential and involves walking around the identified
catchment area likely to impact on the beach area. It also assists in detecting additional
sources of faecal pollution and evaluates and confirms sources identified during the
desktop study and interviews. The on-site inspection allows the water manager to identify
the following: visual pollution such as litter; the density of wildlife; the extent and
popularity of the waterbody used by the public (NHMRC 2008).

40
Determine the public health risk
As a result of the information collected throughout the SI process, the likely impact on
public health as a result of each faecal pollution source needs to be assessed. This is
further discussed in Section 2.4.1.
2.4 Sanitary Inspection Category
Completion of the sanitary inspection enables a sanitary inspection category to be
determined. This is based on the overall risk posed by all identified sources of faecal
pollution at a recreational water body and is categorised as very low, low, moderate, high
or very high (NMHRC 2008). Because risks are considered cumulative, an overall risk
for the site is determined by deriving a summative estimate of all risks identified as faecal
pollution sources. The highest risk is then assigned as the SIC. The concept behind the
SIC is to combine the category with the microbial water-quality assessment using the
matrix detailed in Table 3 Section 2.2.2, providing an overall risk or beach grade to
protect public health (NHMRC 2008).
The classification emphasises faecal contamination from humans, with lesser importance
placed on faecal contamination from other sources such as drainage from areas of animal
pasture and intensive livestock rearing, the presence of seabirds, or the use of the area for
dogs or horses (NHMRC 2008).
2.4.1 Risk Based Approaches
The SI process adopts the risk based approach. The risk based approach is increasingly
used by water authorities throughout the world (enHealth 2004). In Australia, the risk
based approach is commonly applied in drinking water catchments (NHMRC 2004).
The basic principles of the risk based or risk management approach, as defined in the
Standards Association of Australia (2004) risk management guidelines p 1, include:
• “A more confident and rigorous basis for decision-making and planning
• Gaining value from uncertainty and variability

41
• Qualitative analysis [that] uses words to describe the magnitude of potential
consequences and the likelihood that those consequences will occur.
• Semi-quantitative analysis
• Quantitative analysis [that] uses numerical values for both consequence and
likelihood using data from a variety of sources”.
Key definitions relating the risk management approach taken from Standards Association
of Australia 2009, pp 1 - 3, include:
• “Risk - effect of uncertainty on objectives
• Consequence - outcome of an event affecting objectives
• Likelihood - chance of something happening
• Level of risk - magnitude of a risk or combination of risks, expressed in terms of
the combination of consequences and their likelihood
• Risk analysis - is about developing an understanding of risk. Risk analysis
involves consideration of the sources of risk, their positive and negative
consequences and the likelihood that those consequences may occur. Risk is
analysed by combining consequences and their likelihood”
The risk management process may be used to develop a risk matrix that incorporates the
following:
- Consequences scale
The consequence scale is the consequences of the risk occurring, and will vary with each
type of risk. Common terms used to describe consequences include insignificant, minor,
moderate, major or catastrophic (Standards Association of Australia 2009). Table 5
provides an example of a typical consequence scale. Table 5 Example consequence scale
Descriptive Definition Severe Most objectives cannot be achieved Major Some important objectives cannot be achieved
Moderate Some objectives are easily remedied Minor Minor effects that are easily remedied
Negligible Negligible impact upon objectives Source: Standards Association of Australia 2004, Table 6.3, p54

42
- Likelihood scale
A likelihood scale is used to estimate the likelihood of an event and can be tailored to the
different type of risks. Likelihood is described in terms of a rate, for example, ‘will occur
at least once a year or more’ (Standards Association of Australia 2009). Table 6 provides
an example of a typical likelihood scale.
Table 6 Example likelihood scale Level Descriptor Description Indicative Frequency
(expected to occur)
A Almost certain The event will occur on an annual basis Once a year or more
frequently
B Likely The event has occurred several times or
more in your career
Once every three years
C Possible The event might occur once in your
career
Once every ten years
D Unlikely The event does occur somewhere from
time to time
Once every thirty years
E Rare Heard of something like this occurring
elsewhere
Once every 100 years
F Very rare Have never heard of this happening Once in 1000 years
G Almost incredible Theoretically possible but no expected
to occur
One in 10 000 years
Source: Standards Association of Australia 2004, Table 6.4, p54
- Level of risk
The level of risk is determined by combining consequence and likelihood, and is very
useful for prioritising risks. Terms such as very high, high, medium, low, very low, or
negligible are often used to describe the level of risk (Standards Association of Australia
2009).
The consequence and likelihood scales are combined to produce the overall level of risk
(Standards Association of Australia 2004). Table 7 outlines the Standards Association of
Australia 2004 example matrix for determining the level of risk.

43
Table 7 Example matrix for determining level of risk Likelihood label
Consequence Label I II III IV V
A Medium High High Very High Very High B Medium Medium High High Very High C Low Medium High High High D Low Low Medium Medium High E Low Low Medium Medium High Source: Australian Standard 2004, Table 6.6, p55
2.5 Sanitary Inspection Forms
Four sanitary inspection formats have been identified and reviewed and are discussed
below together with the limitations considered with each form.
The 2008 NHMRC Guidelines provide invaluable information on common faecal sources
likely to impact on Australian water bodies. However, the Guidelines are limited by their
lack of a detailed template or practical assessment format on ranking individual faecal
sources into one of the five SIC. Instead the Guidelines recommend adopting principles
outlined in the Best Practice Environmental Management Guidelines – Catchments for
Recreational Water: Conducting and Assessing Sanitary Inspections (WSAA 2003).
2.5.1 Water Services Association of Australia Form
The Water Services Association of Australia (WSAA) role was to build on the WHO
guidelines and quantitative terms e.g. ‘very good’ ‘poor’ etc. and provide further
explanation of the terms. The fundamental principle behind the WSAA document was to
consider the likely contamination sources within the catchment (dry and wet weather) and
to predict their impacts on the recreational water (Appendix 2).
However, the WSAA (2003) approach is predicated on using worst-case scenarios (pers
comm. R. Lugg 2006). Attempts to apply the WSAA approach to regional Western
Australian recreational waterways indicated that it was indeed conservative in its
application and over-estimated the potential contamination of faecal pollution sources
identified (Shire of Murray 2005 unpublished). The WSAA (2003) approach was more

44
inclined to assign an overall classification of a site into a poorer or unsafe category even
though the microbiological results indicated that it may be in the “good” to “very good”
range.
Applying the WSSA approach did form the basis of a sound model for the collection of
information recorded during the SI process and incorporated details on site identification,
physical characteristics of the water body, user history and identification of typical faecal
pollution sources (such as stormwater and wastewater outlets).
2.5.2 New Zealand Sanitary Inspection Form
The New Zealand Ministry of Environment produced the ‘Recreational Water Quality
Assessment Software’ and associated ‘Microbiological Water Quality Guidelines for
Marine and Freshwater Recreational Areas’ which provides an online approach for
recording information as part of the sanitary inspection (New Zealand Ministry for the
Environment 2003).
The SI category is based on a Catchment Assessment Checklist, a formal series of
mandatory and optional questions to be answered for each site. This list identifies
principal microbiological contamination from faecal sources and assigns a category
according to risk. Categories include: very low, low, moderate, high, and very high.
Essentially, the checklist is a series of tick boxes with some text fields for additional
information (Appendix 3).
Although a relatively user-friendly approach, the methodology for assigning a SIC to
individual pollution sources was not considered robust. The microbiological hazard
section of the form is a generic series of tick box questions; “is it present” and “does it
cause an effect”. The user is restricted to tick the appropriate answer and does not have
the ability to record site specific considerations for the hazard that could potentially
impact on the overall categories assigned. The public health risks from each faecal
pollution source/hazard may be unique to a site, and the ability for the user to assess the
hazard individually is not available.

45
The form does not provide adequate data on which a future reviewer can competently
determine the basis of the initial assessment. A SIC reporting form should ideally have
the capacity to be used as a comprehensive historical recording tool to enable future
water managers to gain an understanding of the risks associated with a site, and the
underlying reasoning regarding why the site was assigned a particular SIC.
Although the NZ approach was considered one of the more advanced SI tools,
particularly in the format using an online database, a tool that incorporates the risk
likelihood/consequence assessment principles of AS/NZS ISO 31000:2009 (Standards
Association of Australia 2009) was considered essential for the Australian setting.
2.5.3 United States Sanitary Inspection Form
The USEPA reviewed the variation in the design and information gathering from nine
sanitary survey forms (USEPA 2010). The review identified common questions and
themes to the SI which were incorporated in the 2008 Great Lakes Beach Sanitary Survey
User Manual Appendix C: Annual Sanitary Survey Form (USEPA 2008b). This form
(Appendix 4) details the US approach for undertaking a SI. Although this form contains a
comprehensive series of questions that attempts to collate detailed information on a
recreational water site, the approach used to assess the health risks associated with
individual faecal pollution sources outlined in section 11 of the form is considered to be
highly subjective.
The user is requested to rate the level of concern they have with a specific pollution
source, using a score of high, medium, low or not applicable. However, there is limited
guidance within the accompanying manual or form to assist the user to determine how to
rate the level of concern, with only a single statement “identify whether the source is a
high, medium, or low contributor to beach pollution” (USEPA 2008b). The limited
definitions are likely to lead to confusion and differing ratings applied to specific
pollution sources.

46
In its current format, the US form is more of an information collection tool rather than a
health risk assessment rating tool. In terms of information collection, this form provides a
valuable compilation of questions but provides little help in assigning an overall final SIC
for a site.

47
CHAPTER THREE
METHODOLOGY
Figure 9 The Swan River, a recreational playground, Perth, Western Australia

48
CHAPTER THREE: METHODOLOGY
3.1 Introduction
A review of the literature failed to find a comprehensive, valid and practical measurement
instrument for the assignment of sanitary inspection categories to faecal pollution sources
in recreational water bodies. Those forms which were available had limitations in the
degree of detail collected (see Section 2.5). A SI form ideally should enable a robust
assessment that limits subjectivity between users and enable consistency in assigning a
SIC.
The aim of this Project was to produce a validated and practical instrument that will
enable water managers to record accurate details to derive a reliable and defensible
position in classifying inputs of faecal pollution sources.
Measurement instruments must be validated to ensure the researcher is measuring what it
is intended to measure. Green and Lewis (1986) define validity as the ability of an
instrument to accurately measure a variable or concept of interest. Windsor et al. (1984)
defines validity as the degree of confidence that can be placed on inferences based on
scores from a scale. The extent to which a measurement instrument has been subjected
to a validation process determines the degree of confidence a researcher may place upon
the results produced using that instrument (Streiner and Norman 1989).
3.2 Design of the Comprehensive Sanitary Inspection Form
In the absence of a practical methodology, a standardised and comprehensive SI report
form (Appendix 6) and instructions (Appendix 7) was drafted adopting principles from
three main sources: WSAA (2003); New Zealand Ministry for the Environment (2003);
and Bartram and Rees (2000).

49
3.2.1 Form Questions
Preparing questions for a form requires a great deal of care and diligence because no
amount of statistical manipulation can compensate for poorly chosen questions. The first
step in designing the SI form was to review the material prepared by others in the past. A
review of the literature and previous SI forms identified repeated themes and common
questions as discussed in Chapter 2, Section 2.3.4.
The form was designed to include the identified questions and themes, and divided into
four parts:
Part A: Define the catchment and recreational water body
1. Site identification
2. Physical characteristics of the recreational water body
2.1 Recreational water body
2.2 Land use and geography
2.3 Recreational water usage
3. Public health consequence of a pollution event occurring at the site
Part B: Sources of faecal pollution
1. Bather density
2. Bather toilet facilities
3. Discharges of wastewater (human effluent sources)
4. Stormwater discharge
5. Rainfall runoff following summer rainfall events
6. Riverine discharge (from rivers, streams or other tributaries)
7. Boats
8. Animals
9. Other
Part C: Management

50
Part D: Sanitary Inspection Category
1. Sanitary Inspection Category
1.1 Dry weather sanitary inspection category
1.2 Wet weather sanitary inspection category
1.3 Effectiveness of management controls
1.4 Final assigned sanitary inspection category
2. Actions/further investigation notes
3.2.2 Risk Assessment
The second step in designing the form was to adopt the principles of risk assessment into
Part B. The Guidelines (NHMRC 2008) already discuss the risk potential to human health
from exposure to faecal pollution from wastewater overflows, riverine discharges and
bather shedding. The risk potentials for these three sources were taken directly from the
NHMRC 2008 Guidelines (Table 5.10, 5.11 and 5.12 pp 81-82) and included within the
form.
Therefore, likelihood/consequence tables needed to be developed to define the potential
human health risk exposure from:
1. Bather toilet facilities
2. Stormwater discharge
3. Rainfall runoff following summer rainfall events
4. Boats
5. Animals
The use of likelihood/consequence tables, discussed in Chapter 2, Section 2.4.1 were
considered an essential feature to be included within the form to assist the user to
determine the public health risk associated with each faecal pollution source. The
likelihood/consequence tables provide a qualitative analysis using words to describe the
magnitude of potential consequences and the likelihood that those consequences will
occur (Standards Association of Australia 2009, Standards Association of Australia 2004).

51
Using the principles of risk management (Standards Association of Australia 2009) the
following steps were developed:
1. Consequence scale
2. Likelihood scale
3. Level of risk scale
4. Risk matrix
1. Consequence scale
By determining the consequence of human exposure to faecal pollution at a particular
swimming location, water managers can prioritise actions to reduce the risks where most
appropriate.
The consequence of human exposure to faecal pollution at recreational water sites is
likely to be greater at very popular recreational locations where large numbers of people
may come into contact with waterborne pathogens or at tourist beaches where reports of
poor water quality may affect the local economy. The consequences may also be greater
at beaches used by people with weaker immune systems, such as small children or the
elderly.
For the purpose of the form, consequences have been rated into three categories; minor,
moderate and major, and defined using the qualitative definitions provided in Table 8.
Table 8 Consequence which best suits the recreational water body Description (Tick appropriate boxes from only one consequence that best suits the recreational water body. NOTE: Not all boxes need to be ticked)
Consequence (Circle the most suitable consequence that best fits the description of the site)
Location of minimal importance to local economy Location rarely used on weekdays Location occasionally used on weekends or holidays Few people enter the water Location not popular with children or the elderly
Minor
Location of some importance to the local economy (e.g. tourism)
Location occasionally used on weekdays (e.g. <100 people per day for non-holiday period)
Moderate

52
Source: Table adapted from Standards Association of Australia 2004; and NSWDEC 2004
2. Likelihood scale
For the purpose of the form, likelihood has been rated into five categories: that is, rare,
unlikely, possible, likely, and almost certain, and defined using the qualitative definitions
provided in Table 9.
Table 9 Qualitative definitions of likelihood of pollution
Rating Description – the likelihood of human exposure to faecal pollution
from this source at the recreational water body
Rare Exposure to faecal pollution from this source is unlikely to occur or may
occur only in exceptional circumstances (e.g. every five years or more).
Unlikely Exposure to faecal pollution from this source is unlikely but could
potentially occur at least once within a five year period.
Possible Exposure to faecal pollution from this source might occur at least once
or twice per bathing season.
Likely Exposure to faecal pollution from this source is expected to occur
several times per bathing season (e.g. at least five or more times per
season).
Almost
Certain
Exposure to faecal pollution from this source is expected to occur on a
regular basis (e.g. once a week). Source: Table adapted from Standards Association of Australia 2004; and NSWDEC 2004
Location frequently used on weekends or holidays Some or most people enter the water Location can be popular with children or the elderly Location of great importance to the local economy (e.g.
tourism, water activities, world heritage site) Serious media attention /community outcry Location frequently used on weekdays, weekends and
holidays Most people enter the water Location very popular with children or the elderly
Major

53
3. Level of risk
The level of risk scale was developed using the scale identified by the NHMRC 2008
Guidelines: that is, very low, low, moderate, high and very high. The level of risk
describes the potential risk to human health from exposure to the faecal pollution source.
4. Risk matrix
Two risk matrix tables (Table 10 and Table 11) were developed incorporating the
likelihood/consequence principles. A risk matrix was required for both human (Table 10)
and animal (Table 11) sources to differentiate between the reduced risks to humans from
animal derived sources of faecal pollution (NHMRC 2008; USEPA 2010; WHO 1999).
Table 10 Human faecal pollution source risk assessment matrix
Source: Table adapted from Standards Association of Australia 2004 Table 11 Animal faecal pollution source risk assessment matrix
Source: Table adapted from Standards Association of Australia 2004
Consequence (Use the consequence assigned in Part A Ssection 3)
Likelihood of Pollution From This Source (Refer to Table 2 of SI instructions for further definitions of likelihood) Rare (May occur only in exceptional circumstances e.g. >5 years)
Unlikely (Could potentially occur at least once within a 5 year period)
Possible (Could potentially occur at least once or twice per bathing season)
Likely (Will probably occur at least 3 – 4 times per bathing season)
Almost Certain
(Will occur on a regular basis e.g. once a week)
Minor Very Low risk Very Low risk Low risk Low risk Moderate risk
Moderate Very Low risk Low risk Low risk Moderate risk High risk
Major Low risk Low risk Moderate risk High risk Very High risk
Consequence (Use the consequence assigned in Part A Section 3)
Likelihood of Pollution From This Source (Refer to Table 2 of SI instructions for further definitions of likelihood) Rare (May occur only in exceptional circumstances e.g. >5 years)
Unlikely (Could potentially occur at least once within a 5 year period)
Possible (Could potentially occur at least once or twice per bathing season)
Likely (Will probably occur at least 3 – 4 times per bathing season)
Almost Certain (Will occur on a regular basis e.g. once a week)
Minor Very Low risk Very Low risk Very Low risk Very Low risk Low risk
Moderate Very Low risk Very Low risk Very Low risk Low risk Moderate risk
Major Very Low risk Very Low risk Low risk Moderate risk Moderate risk

54
3.3 Validation of Sanitary Inspection Form
3.3.1 Testing the Form for Face Validity
Face validity indicates whether, on the face of it, the instrument appears to be assessing
the desired qualities (Litwin 1995). The face validity of survey instruments may be
assessed by a review of the questions by untrained individuals. The individuals make
their judgments on whether the items are relevant. Face validity is a qualitative measure
of validity, and it is not quantified with statistical methods (Statistics.com 2010).
Testing the SI report form for face validity was trialled during three settings:
1. Local Government Authority trials
2. Department of Health of Western Australia-Recreational Waters Workshop trials
3. Australian State and Territory Government agency trials
Local Government Authority trials
During 2007 to mid-2009 ten WA Local Government Authorities, detailed in Table 12,
were approached to trial the SI report form at a number of recreational water settings.
Table 12 Recreational water sites and responsible authorities who assisted with the trial of the SI form, Perth, Western Australia Recreational Water Site Responsible Local Government
Authority
City Beach (coastal), Perth, WA Town of Cambridge
Parker Point Beach (coastal), Rottnest Island,
WA
Geordie Bay (coastal), Rottnest Island, WA
Rottnest Island Authority
Sandy Beach Reserve (estuarine), Perth, WA Town of Bassendean
Scarborough Beach (coastal), Perth, WA City of Stirling
Hillarys Marina (coastal harbour), Perth, WA City of Joondalup

55
Hillarys South Beach (coastal), Perth, WA
Middle Swan Reserve (estuarine), Perth, WA City of Swan
Mandurah Ocean Marina Beach (estuarine),
Mandurah, WA
Halls Park Beach (estuarine), Mandurah, WA
City of Mandurah
Rockingham Beach (coastal embayment), Perth,
WA
City of Rockingham
Mindarie Keys Beach, Perth,WA City of Wanneroo
Murray River Bend, Pinjarra, WA Shire of Murray
Coode Street Beach (estuarine), Perth, WA City of South Perth
The Local Government validation of the SI form involved the following:
1. Desktop study
2. Briefing on using the SI report form and
3. On-site field inspections
Individuals approached within the Local Government Authorities were instructed to
undertake a desktop study of a desired recreational water location(s) within their
jurisdiction and asked to collect a range of information sources relevant to the
recreational water site e.g.:
1. Aerial maps
2. Street maps
3. Local Government infrastructure (toilet blocks, stormwater drains and recreational
facilities)
4. Location maps of unsewered and sewered areas surrounding the site
5. Locations of water pumping stations and other state utility owned infrastructure
The researcher then organised a meeting with each Local Government representative(s),
who were provided with a thirty minute briefing that included:
• Background to the development of the form
• A general overview on how to complete the form and

56
• A rationalisation for validating the form.
An historical overview of the site was provided by the Local Government
representative(s) who undertook the desktop study. Based on the information collected,
each Local Government representative was instructed to complete the appropriate
sections of the SI report form, without the assistance of the researcher.
The researcher and the Local Government representative then travelled to each
recreational water body to conduct an on-site field inspection. The Local Government
representative then completed the remaining parts of the form that required on-site
observations to be recorded, and the desktop study information to be visually confirmed.
Whilst on site, each Local Government representative was encouraged to provide verbal
feedback on the form wherever appropriate. The feedback requested included:
• Did the user understand all of the form questions or was clarification required to
further refine a particular questions?
• Did the user find that the form was practical to apply?
• Did the user identify how the form could be applied to recreational water sites within
their jurisdiction into the future?
• Did the user have any suggestions on how to improve the form?
Department of Health of Western Australia-Recreational Waters Workshop trials
Additional feedback was obtained during two recreational waters workshop, held in April
2009, hosted by the Environmental Health Directorate, Department of Health WA.
Twenty Local Government Authority representatives attended the workshop.
The workshop proceedings included:
1. A briefing on the sanitary inspection process

57
2. A desktop study exercise which included supplying each workshop attendee with
faecal pollution source information relating to two case study recreational water
bodies and
3. On-site field inspections of the two case studies recreational water sites
A similar process, outlined above for the Local Government Authority trials, was
followed to obtain verbal feedback from workshop attendees on the practicality of the SI
report form.
Workshop attendees were also asked to complete a user questionnaire on the SI report
form detailed in Appendix 8.
3.3.2 Testing the Inter-rater Reliability of the Form
Reliability is a way to reflect the amount of error, random and systematic, inherent in any
measurement (Streiner and Norman 1989 p 15). Reliability is the extent to which an
experiment, test, or any measuring procedure yields the same result on repeated trials.
Without the agreement of independent observers who are able to replicate research
procedures or the ability to use research tools and procedures that yield consistent
measurements, researchers would be unable to satisfactorily draw conclusions, formulate
theories, or make claims about the generalisability of their research (Colarado State
University 2010).
Inter-rater reliability:
• is the extent to which two or more individuals (coders or raters) agree with respect
to a particular measurement process
• addresses the consistency of the implementation of a rating system and
• is dependent upon the ability of two or more individuals to be consistent with
respect to the measurement instrument.

58
Training, education and monitoring skills can enhance inter-rater reliability (Colarado
State University 2010).
In order to test the inter-rater reliability the researcher and an Environmental Health
Officer (reviewer) from the Department of Health, trialled the form at ten recreational
water sites within the metropolitan area, Perth, Western Australia. The trial aimed to
determine if both reviewers assigned the same SIC to each site.
Both the researcher and the reviewer had a high level of knowledge of the sanitary
inspection process and the requirements for implementing sanitary inspections in Chapter
5 of the NHMRC Guidelines (NHMRC 2008).
The ten recreational water sites selected comprised coastal and estuarine sites (Table 15).
The sites chosen provided sufficient variation in respect to pollution and catchment
aspects to enable a thorough use/application of the SI form.
Table 13 Recreational water sites selected for inter-rater reliability
Site
No. Trial recreational water site
1 Hillary’s Marina (coastal harbour), Perth, WA
2 Hillary’s South Beach (coastal), Perth, WA
3 Coode Street Beach (estuarine), Perth, WA
4 City Beach (coastal), Perth, WA
5 Middle Swan Reserve (estuarine), Perth, WA
6
Mandurah Ocean Marina Beach (estuarine), Mandurah,
WA
7 Halls Park Beach (estuarine), Mandurah, WA
8 Rockingham Beach (coastal embayment), Perth, WA
9
North Hymus St Beach (coastal embayment), Perth,
WA
10 Mindarie Beach, Alexandra View (coastal), Perth, WA

59
The SI form was completed for each site over three stages:
1. Desktop study
2. Interviews with Local Government Environmental Health Officers and
3. On-site inspections
Firstly, the two reviewers, who were relatively familiar with all sites, undertook a desktop
study to review the relevant literature that was available for all ten sites including aerial
photographs, stormwater maps, wastewater maps and other infrastructure maps (toilets,
unsewered areas). The desktop study ensured that each reviewer could readily identify all
potential sources of faecal pollution related to each site.
Secondly, further interviews with Local Government Environmental Health Officers were
conducted to discuss the history of the sites (e.g. popularity, previous pollution events),
and identify any other local factors that may influence the microbial water quality of the
recreational water bodies.
Thirdly, on-site inspections were conducted for each site. Both reviewers walked the
length of the bathing and surrounding areas while at the same time recording the
information on the SI form and confirming the faecal pollution sources identified during
the desk top study.
To determine consistency among raters an inter-rater reliability of the form using the
Kappa statistic was performed using Stata MP v.10.1. Kappa provides a measure of the
degree to which two judges, A and B, concur in their respective sorting (SPSS tutorials
2010).

60
The equation for κ is:
where Pr(a) is the relative observed agreement among raters, and Pr(e) is the hypothetical
probability of chance agreement, using the observed data to calculate the probabilities of
each observer randomly saying each category. If the raters are in complete agreement
then κ = 1. If there is no agreement among the raters (other than what would be expected
by chance) then κ ≤ 0 (Smeeton 1985).
Kappa analysis ranges from -1.0 to 1.0 where values approaching + 1.0 indicate
improving reliability, values near zero suggest that agreement is attributable to chance,
and values less than zero signify that agreement is even less than that which could be
attributed to chance. It is generally thought to be a more robust measure than simple
percent agreement calculation since κ takes into account the agreement occurring by
chance. The common measures of the strength of agreement are described in Table 16
(SPSS tutorials 2010).
Table 14 Interpretation of Kappa value; strength of agreement Kappa value Strength of agreement
<0.40 Poor
0.41 – 0.60 Fair/moderate
0.61 – 0.80 Good
0.81 – 1.00 Very Good Source: Table adopted from SPSS tutorials 2010
The measure of agreement (Kappa value) was calculated for the ten sites and is further
discussed in the Chapter 4, Section 4.2.

61
3.4 Example of the SI Form Application
An example of the application of the SI report form for an estuarine site tested during the
intra-rater reliability trials within the City of South Perth, Perth, Western Australia, is
outlined below. The applicable sections of the SI report form completed for this site,
referred to as “Coode St”, is detailed in Appendix 9.
Coode St, South Perth is an estuarine water body located opposite the Perth City centre.
The site is exposed to a number of potential faecal pollution sources. The relevant SI
report form risk classification matrix tables (Table 10 and Table 11) were applied to each
identified faecal pollution source and the corresponding SI risk classifications was
assigned to each source. These included:
• Bather Density – Very low risk
• Bather Toilet Facilities – Very low risk
• Discharge of Wastewater – Low risk
• Stormwater discharge (both dry and wet weather) – Moderate risk
• Rainfall runoff – Moderate risk
• Boats – Moderate risk
• Animals – Very low risk
The highest ranked SI risk classification is then perceived as the overall SI category for
the site. Therefore Coode St was assigned a “Moderate” SI category for both wet and dry
weather periods. This was predominantly due to the presence of stormwater drains that
discharged directly near the bathing area.

62
To calculate the overall classification for the site the SI category of “Moderate” is
combined with the microbial assessment category (MAC) calculated for the site. The
MAC was predetermined during extensive field studies and calculated as a “B” MAC.
When a “Moderate” SI category and a “B” MAC is applied to the risk classification
matrix outlined in Table 3: Classification matrix for faecal pollution of recreational
water environments, an overall classification of “Good” is assigned to the Coode St site.

63
CHAPTER FOUR
RESULTS
Figure 10 Summer life, Trigg Beach, Western Australia

64
CHAPTER FOUR: RESULTS 4.1 Feedback on Workshops and other Stakeholder Inputs
Common feedback received during these one on one trials from 10 representatives
included:
• On first impression the form looked lengthy at 18 pages (A4) and was viewed as being
an onerous form to complete. However, after applying the form in a practical setting
majority of users advised that the form was not too detailed and proved to be a
proper and reliable assessment tool.
• Further explanatory information for the consequence table outlined in Part A, Section
3, was required to limit subjectivity between users.
• Further clarification of terms such as low or high bather density was required.
• General formatting changes such as font size, bolding of headings, and clear
separation of sections to improve the forms design.
• The inclusion of ‘unsure’ boxes for appropriate questions that required further
investigation.
• The addition of land use topography and water use requirements to take into
consideration different environmental features for fresh, estuarine and coastal
waterways.
• The inclusion of likelihood descriptions within the risk matrix tables. For example,
Rare may occur only in exceptional circumstances e.g. > 5 years.
• The potential to enhance the form by converting into an interactive electronic
template or online database
Although a poor response rate was received, a total of five attendees out of twenty four
provided written feedback on the initial report design. A summary of the survey feedback
is provided in Table 15.

65
Table 15 Feedback from the sanitary inspection report survey completed at the 2009 Department of Health of Western Australia Recreational Waters Workshop trials
Question
Responses Scale 1 to 5
(1 not easy to use – 5 extremely easy to use)
Have you had any experience completing a sanitary inspection form before this workshop?
• 4 no experience • 1 experience
Do you like the layout (or design) of the SI report form?
• 5 liked the design
Do you have any suggestions on how to improve the layout of the report form?
• Comment1: No, I think it’s quite easy to understand and use
Using a scale of 1 to 5, how practical do you think the SI report form is?
• 4 respondents rated 4 (easy to use) • 1 respondent rated 3 (Ok to use)
Using a scale of 1 to 5, did you find the SI report form an easy or difficult method for assigning a sanitary inspection category?
• 4 respondents rated 4 (easy to use) • 1 respondent rated 3 (Ok to use)
Do you think you would use the SI form when conducting sanitary inspection?
• 5 respondents said yes
Part A Using a scale of 1 to 5, how would you rate the level of difficulty when completing Part A?
• 3 respondents rated 4 (easy to use) • 2 respondents rated 3 (Ok to use)
Using a scale of 1 to 5, how would you rate the ease of use when applying the consequence table?
• 2 respondents rated 5 (extremely easy to use)
• 3 respondent rated 4 (easy to use) Part B Using a scale of 1 to 5, rate the ease of use when applying the likelihood / consequence tables to assist risk to faecal pollution sources?
• 4 respondents rated 4 (easy to use) • 1 respondent rated 5 (extremely
easy to use)
How subjective do you think the likelihood /consequence tables are?
• 3 respondents rated low level of subjectivity
• 2 respondents rated medium level of subjectivity
Part C Using a scale of 1 to 5, did you find Part C easy or difficult to complete?
• 3 respondents rated 4 (easy to use) • 2 respondents rated 3 (OK to use)
Part D Using a scale of 1 to 5, did you find Part D easy or difficult to understand?
• No responses

66
Following the workshop an email was received by a workshop participate providing
further feedback; detailed below:
2009: Suzanne Neale, Environmental Health Officer, City of Cockburn, Western
Australia
Extract taken from an email dated 7/4/2009:
“Although I have done sanitary inspections of our beaches before, I found the form very
easy to use. There are only a few areas where there is some subjectivity, but overall I
can’t see that it would make a big difference to the result.
When we carry out another inspection at the start of the next bathing season I will
provide you with any further feedback. We would be keen to attend any further training
sessions that you have planned”.
Australian State and Territory Government agency trials
Throughout 2008 – 2009 Australian State or Territory Government environmental or
health agencies from Victoria, New South Wales and the Northern Territory were
requested to trial the form through a series of emails (Appendix 10). These agencies are
described in Table 16.
Table 16 Feedback from Australian Government Agencies who trialed the sanitary inspection report form
Australian State or Territory Government Agency
Victoria Environmental Protection Agency
New South Wales Department of Environment and Climate
Change
Northern Territory Department of Health and Families
Feedback provided by the above Australian Government Agencies is detailed below.

67
2010: Peter Rogers, Senior Policy Officer, Environmental Health Branch,
Department of Health and Families, Northern Territory
Extract taken from an email dated 28/9/2010:
“We made some minor amendments to the survey form but have been mindful not to
alter how it assesses risk. Apart from some changes to terminology, some of the
amendments include:
• Section 4. - A few of our survey areas identified multiple local drains discharging
to local areas and therefore it wasn’t viable to apply a risk assessment to each
drain. Therefore we grouped the drains but counted the wet & dry drains and
added an extra field in 4 (i.e. No. of wet drains v dry drains) just above ‘Global
Positioning Coordinates’.
• Section 5.1 – Changed ‘following a summer rainfall event’ to ‘following a
significant rainfall event’ as summer is not commonly referred to in the top end.
We are still impressed with the survey form but it has taken us a while to understand its
scope and detail, though we are still learning much about the survey. We have
complemented the survey using a spreadsheet and Google maps that incorporate survey
boundaries, sample points, embedded photos of geocoded features and objects.
We are aiming to complete the surveys and drafted a report for the Chief Health Officer
over the next month or so I’ll keep you posted...”.
2010: Peter Rogers, Senior Policy Officer, Environmental Health Branch,
Department of Health and Families, Northern Territory
Extract taken from an email dated 3/9/2010:
“Just letting you know that our officers have been conducting a number of sanitary
surveys of the Darwin Harbour and beach areas using the sanitary survey form. We
modified the form to set it up as a dot file and also reflect DHF branding plus created
extra forms for drains & faecal sources. Will keep you posted”.

68
2009: Cristien Hickey, Manager Beachwatch Programs, Department of
Environment and Climate Change, New South Wales
Extract taken from an email dated 7/5/2009:
“That's great news re. the database - it will make our lives so much easier. And, yes, we
will definitely acknowledge your copyright and fully credit your work. I think the
database will mirror the templates quite closely - maybe some changes to allow for the
smaller screen size compared to page size. Once it's all nutted out, I can be more specific.
I'm hoping to make time to get it done in the next couple of months as we will need to roll
it out to councils in October”.
2009: Cristien Hickey, Manager Beachwatch Programs, Department of
Environment and Climate Change, New South Wales
Extract taken from an email dated 17/4/2009:
“Yes, I understand how and why you’ve defined consequence in terms of beach use, and
personally, I think it’s a good approach – we developed it for beach prioritisations back
in 2003. My concern is that it’s not consistent with the risk tables provided in the
guidelines which don’t take beach use into account – these tables effectively define
consequence as ‘impact on water quality at the site’. I think consequence should be
defined consistently for all pollution sources. If risk is defined in terms of public health
impact, then the risk tables in the guidelines effectively become likelihood tables
(magnitude of impact = chance of impact) – you just need to change the wording and
combine with consequence to get risk. I think this is a logical change and also works out
fine when applied to real situations, but take a look and see what you think”.
2008: Meredith Jay, Beach Report cadet, Environmental Protection Agency,
Victoria
In 2008, the Victorian Environmental Protection Agency published a report entitled “A
trial of sanitary inspection reports for recreational water quality assessments in the Port

69
Philip Bay”. The report trialed three sanitary inspection forms at three sites within Port
Philip Bay in order to identify the most suitable method for Victorian beaches.
The following is an extract from the report;
Note: WA method refers to the SI report form developed by the researcher.
“Results
The WA method was the most comprehensive and detailed of the three methods trialled.
The qualitative report was spilt into four sections: defining the catchment and
recreational waterbody; sources of faecal pollution; management; and overall sanitary
inspection category (SIC). The SIC section spilt sources into wet and dry weather
scenarios, thus recognising the major impact rainfall has on a recreational waterbody.
Initially the WA report (a Microsoft word document) was difficult to use. The font was
not easy to read and the text not well spaced. However, with a few format changes and
the addition of colour-coded headings, the report became much easier to fill-out and read.
Gathering all the information necessary for the WA report was challenging and time-
consuming, requiring a lot of personal communication with other government
departments and businesses.
Through working with the WA method, it become apparent that the report needed further
editing, including in-text space for attachment of maps and photos, as well as an appendix
whereby extra information collected (i.e. information of rivers, pumping stations, etc.
further than 1 km from the recreational waterbody) but not relevant to the overall SIC can
be stored, as well as an appendix to reference where the information was obtained from
(i.e. past data, personal communication, etc.). In addition, names of stormwater drains
and creeks were added as they are easier to recall than ’drain 1’ or ’creek 1’”.
Discussion
From the three sanitary inspection methods trialled, the WA method was preferred due to
its broad range of impacts, fine detail, and stringent guidelines. It also allowed for the
addition of site-specific impacts, such as seaweed at Altona. However, improvements to

70
the WA method are still necessary. As mentioned in the Results section, the sanitary
inspection form (currently a Microsoft word document) was difficult to read, lacked
space for maps and photos, and needed to include drain names to assist with recall.
Through this experiment, it was found that using a Microsoft access database (or similar
database program) could greatly improve the WA method, as it would allow for better
formatting and storage of data, as well the potential to easily compare sites and update
information. Entering data into the database would also be a lot easier than into the
current form. However, space for ‘extra’ details should still be included, as it would
assist with re-assessing and updating the reports without the need to start from the
beginning. These would explain why the classifications were made (which is particularly
important if a different person is managing the reports)”.
2008: Nina Bate, Freshwater Sciences Unit, Environmental Protection Agency,
Victoria
Extract taken from an email dated 29/52008:
“I've received your request for comment on the information in the Microbial Quality of
Recreational Waters Guidance documents. We are hoping to use the Sanitary Inspection
Report Format in a trial sanitary survey that GHD consultants are carrying out for us. The
Report format will need to be modified for our purposes -- we are trialling its use in a
river system. We note that the Report Format is copyright, and are seeking your
permission to use and modify it in our Yarra River Pilot Sanitary Survey. I would
appreciate an email that I can put on our file, if possible”.
Feedback received on the SI form throughout all the consultation processes referred to
above was incorporated into the revised SI form wherever appropriate. Further details on
the modifications made are outlined in Section 4.2.

71
4.2 Validity and Practicality of the SI Form
Based on the trials of the SI report form with various water managers including Local
Government Environmental Health Officers, and Australian State Government
representatives from Health and Environmental agencies (as described above in Section
4.1), the researcher was satisfied that, with respect to face validity, the form was seen to
be asking questions that are appropriate and that it was assessing the necessary
recreational water criteria required to assign a sanitary inspection category.
Many of the water managers involved in the workshop commented that their first
impression was that the form appeared to be lengthy at 18 pages (Appendix 5). This
initially gave rise to the view that the form would be onerous and time-consuming to
complete, and not the practical tool that was envisioned. However, during the trial of the
form using local case studies and application to a variety of recreational water
environments (estuarine and marine waters), the majority of the water managers realised
that the form was not as time consuming to complete as originally anticipated. Many of
the faecal pollution sources outlined in Part B of the form were not applicable to all of the
sites trialled, which meant that a number of sections within Part B of the form did not
have to be completed. This reduced the time burden for the user.
The trials of the form identified a number of improvements to the initial form design
(appendix 5) and format. These improvements were incorporated into updated versions of
the form, and the revised form (Appendix 6) is now considered a practical tool which
provides for consistent and historical data collection for each site assessed. Most notable
changes were to:
• Terms that required more detailed definitions. For example, terms such as high and
low, and minor, moderate and major required further clarification to limit subjectivity
between users.
• The addition of explanatory information for the consequence table outlined in Part A,
Section 3, to limit subjectivity between users.

72
• The addition of land use topography and water use requirements to take into
consideration a variety of environmental features.
• The rewording of risk matrix questions to limit subjectivity between users.
4.3 Inter-rater Reliability
The result of the inter-rater reliability analysis described above in Section 3.3.2, using
Kappa scores, is shown in Table 17 utilizing Stata MP v.10.1.
Table 17 Inter-rater reliability using Kappa scores Expected
Agreement Agreement Kappa Std. Err. Z Prob>Z
100.00% 82.00% 1.0000 0.3162 3.16 0.0008
The Kappa analysis for inter-rater reliability indicated perfect agreement, with a high
level of significance (p<0.001). This Kappa value suggests that there should be limited
variation in an overall SIC assigned to a recreational water body when the SI report form
is completed by more than one competent person (e.g. water manager) who has
knowledge of the recreational water body. That is, there should be a very good agreement
from one user to another on the final SIC assigned to a water body.
Strong inter-rater reliability of the form was considered an important component in the
development of the SI form to ensure limited subjectivity between users. In order for
water quality management programs to run effectively, it is essential that any user in the
future can understand the rationale behind a SI classification assigned to a water body,
and to come to a similar SI conclusion if they were to repeat the SI process.

73
CHAPTER FIVE
DISCUSSION AND CONCLUSIONS
Figure 11 The City of Perth landscape, taken opposite Coode Street Beach, South Perth

74
CHAPTER FIVE: DISCUSSION AND CONCLUSION
5.1 Discussion of principal findings
Within the context of health risk assessment of recreational water quality, this study
identified a need for a practical and standarised approach for completing a sanitary
inspection. For this thesis, the researcher has developed a practical tool to complement
the Guidelines and assist with the implementation of the required sanitary inspections.
This involved assessing the risks of individual faecal pollution sources and assigning an
overall sanitary inspection category (SIC) to recreational water environments.
The outcomes of the testing suggest that the SI report form can be viewed as a valid,
practical and reliable tool. Face validity and reliability were explicitly evaluated as part of
this project. The researcher undertook several trials of the SI report form with a range of
water managers that had varying degrees of knowledge on how to complete a sanitary
inspection or how to assess different pollution sources according to their level of health
risk. The trials included application of the form to a variety of recreational water bodies,
including fresh, estuarine and marine waters environments, indicating that the form could
be adapted to a range of recreational contexts.
The SI report form provided a number of important innovations compared to existing
measurements. In this research project, the SI form was designed to provide a detailed
inventory and assessment of all pollution sources likely to cause faecal contamination of
a water body (Bartram & Rees 2000; USEPA 2008b). It categorised each recreational
water environment according to the severity of the overall adverse faecal impact to which
it is judged susceptible, and provided valuable information to assist in the interpretation
of water quality data (Bartram & Rees 2000). Each pollution source was assigned a
corresponding health risk assessment matrix to assist each user to determine the most
appropriate SI risk category. This component of the SI form incorporated risk
management principles of AS/NZS ISO 31000:2009 (Standards Association of Australia
2009). Furthermore, the SI risk categories were combined to determine the overarching

75
SIC risk to assign to the water body for both dry weather and wet weather conditions.
The combination of trigger questions and risk matrix tables enabled the user to clearly
identify faecal pollution risks that may impact on the quality of the water of a recreational
water body, and assign a more accurate sanitary inspection category.
One significant aspect of the form is that it provided the basis on which each SIC was
determined so that any user in the future can understand the rationale for such
classifications. Rather than being a simple “yes/no” checklist of pollution sources, the SI
report form enabled the user to justify why they judged that a particular faecal pollution
source did or did not present a health risk and to provide specific details and evidence
(e.g. microbiological sampling results) relating to the pollution source. The ability to
provide details specific to a pollution source helped to ensure future water managers
could understand the justification for the SIC assigned to individual pollution sources,
and for the entire site. The recording of this type of decision making endeavors to
eliminate as much ‘subjectivity’ as possible and documents the basis for each decision.
There is a lack of this information and detail on other SI forms reviewed.
In summary, the results above suggest that the form has met the identified objectives of
the study. A comprehensive start-up risk assessment form has been designed that fulfills
the following criteria:
1. Semi-quantitative
2. Practical to apply
3. Assigns faecal pollution sources of human and animal origin into an appropriate
sanitary inspection category, incorporating risk management principles of
AS/NZS ISO 31000:2009 (Standards Association of Australia 2009)
4. Relates land and water use activities to the likelihood of human pathogen
presence
5. May be applied to, and is adaptable to, a variety of recreational water bodies,
including fresh, estuarine and marine waters
6. Provides a model instrument for consistency and reduces subjectivity from user to
user when assigning a SIC for a site

76
7. Provides an appropriate form for undertaking SI as required under the NHMRC
Guidelines for Managing Risks in Recreational Waters (NHMRC 2008)
5.2 Comparison of the new SI form with other available assessments
While several SI models have been designed (Bartram & Rees 2000; USEPA 2008b;
New Zealand Ministry for the Environment 2003; WHO 2003a; WSAA 2003), there has
been no practical, stand alone form that ranks all individual faecal pollution sources
according to one of the five SIC (very low to very high), provided for in the World
Health Organization (WHO 2003a) and Australian Guidelines (NHMRC 2008). This
ranking allows the assigning of a risk classification that is considered a true reflection of
the human health implications of the water quality. This ranking system is needed to
assist water managers assign the overarching SIC, which is later used, in conjunction with
the microbial category to calculate the final risk classification for a site.
The NHMRC Guidelines for Managing Risks in Recreational Waters (chapter 5;
NHMRC 2008) does provide an evidenced-based method compared to previous models
for communicating risks on recreational water quality, the Guidelines are limited in that
they do not provide the practical tools for undertaking the required SI in real life
scenarios. In contrast, the current SI form incorporated a series of common questions
related to the use of the surrounding catchment of the recreational water body, physical
characteristics of the water body, the significance of the water body to the local
community and relates land and water use activities to the likelihood of human pathogen
presence. The SI report form also guided the user through common sources of human and
animal origin faecal pollution, and asked the user to identify those sources that are
applicable to the water body.
5.3 Future modifications and applications
One limitation of the SI report form is its current format which is completed in Microsoft
word. To strengthen the ease of use, improve records management, and practicality of the

77
report form, the researcher recommends that the form be developed into an online
electronic database. This will minimise the amount of time required to complete the form
for subsequent years, enable the user to click through sections of the form that are not
applicable to a location, and provide an ideal historical records management system for
future water managers. The creation of the form into an interactive electronic database
will enhance the practicality of the form and further limit the subjectivity between various
users assigning a SIC to a site.
Although the form, based on initial impressions, appeared lengthy at 18 pages (A4) and
was viewed as requiring too much detail, it is in fact necessary to obtain all the data
identified to ensure that a proper and reliable assessment is made. The trialling of the
form did not show it was too detailed once the user applied the form in a practical setting.
Sanitary inspections will commonly be conducted by a diverse range of water managers,
from state and local governments (including metropolitan and regional areas), and
industry or community representatives, all of whom will have varying levels of
knowledge and expertise of, and resources for, recreational water quality management.
Furthermore, the application of recreational water quality guidelines in the majority of the
Australian States and Territories is not mandatory. This means the SI process needs to be
both practical and reliable as possible to ensure a higher degree of compliance and
adoption of the process and to enable consistency when comparing classification
processes from state to state and person to person.
The successful design of the SI risk assessment reporting form has now resulted in the
form being adopted by a number of State Health and Environmental Authorities e.g. the
Western Australian Department of Health and associated Local Government Authorities,
New South Wales Department of Environment and Climate Change, and the Northern
Territory Department of Health and Families.
Although the SI form may require some minor modifications by agencies to ensure
applicability to local and unique water environments e.g. the inclusion of differing

78
topographical features, rainfall pattern descriptions (e.g. Northern Territory) and health
risks (e.g. helminths in tropical areas), the general layout, questions and risk assessment
matrix has remained consistent.
5.4 Conclusion
The components of this dissertation demonstrate that although the NHMRC Guidelines
for Managing Risks in Recreational Water provide a thorough examination of
recreational water quality issues and management in Australia, they do not provide the
practical tool needed to apply sanitary inspections to real life scenarios.
This study has led to the development and validation of a comprehensive and practical
annual health risk assessment report form for undertaking sanitary inspections and
assigning sanitary inspection categories to Australian recreational water bodies.
The trial and application of the risk assessment form to various swimming locations
throughout Australia has created a robust reporting tool that will aid water managers from
a range of agencies and improve compliance with Australian Recreational Water
Guidelines.
Although the study identified the need for water managers located in unique settings
(such as the Northern Territory) to make very minor modifications to the form to capture
differing topographical features, the general layout, faecal pollution questions and risk
rating matrix has remained consistent and proven to be applicable in a range of Australia
recreational water environments.
Although the form can be completed online using a Microsoft word document, ideally the
form could be converted into an interactive database to further enhance record keeping
and aid in minimising time needed to complete subsequent forms.

79
The introduction of this practical tool will be of significant benefit to water managers
throughout Australia.
The reporting form has now been adopted nationally by a number of State/Territory
Health and Environmental Authorities.
This study can be viewed as a proactive approach to the development of a practical tool
that is essential (or required) for the implementation of Chapter 5 of the NHMRC
Guidelines for Managing Risks in Recreational Waters and perhaps international
Recreational Water Quality Guidelines.

80
REFERENCES
Ackerman, D & Weisberg, SB 2003, ‘Relationship between rainfall and beach bacterial
concentrations on Santa Monica Bay beaches’, Journal of Water and Health, vol.
01.2, pp. 85-89.
Ahn, J. H., Grant, S. B., Surbeck, C. Q., Digiacomo, P. M., Nezlin, N. P. & Jiang, S.
2005, 'Coastal Water Quality Impact of Stormwater Runoff from an Urban
Watershed in Southern California', Environmental Science & Technology, vol. 39,
no. 16, pp. 5940-5953.
Anderson, K., Whitlock, J. & Harwood, V. 2005, 'Persistence and differential survival of
fecal indicator bacteria in subtropical waters and sediments', Applied and
Environmental Microbiology, vol. 71, no. 6, pp. 3041–3048.
ANZECC 2000, Australian and New Zealand Guidelines for Fresh and Marine Water
Quality. National Water Quality Management Strategy, Australian and New
Zealand Environment and Conservation Council & Agriculture and Resource
Management Council of Australia and New Zealand, Canberra.
Ashbolt, NN. & Bruno, M 2003, ‘Application and refinement of the WHO risk
framework for recreational waters in Sydney, Australia’. Journal of Water and
Health, vol. 1, no.3, pp. 125-31.
Balarajan, R., Soni Raleigh, V., Yuen, P., Wheeler, D., Machin, D. & Cartwright, R.
1991, 'Health risks associated with bathing in sea water', Brazilian Medical
Journal, vol. 303, pp. 1444-1445.
Bartram, J and Rees, G 2000, Monitoring Bathing Waters: A Practical Guide to the
Design and Implementation for Assessments and Monitoring Programmes, E &
FM Spon, London, Chapter 8.

81
Boehm, A. B. 2003a, 'Model of Microbial Transport and Inactivation in the Surf Zone
and Application to Field Measurements of Total Coliform in Northern Orange
County, California', Environmental Science and Technology, vol. 37, no. 24, pp.
5511 – 5517.
Boehm, A. B., Fuhrman, J. A., Morse, R. D. & Grant, S. B. 2003b, 'Tiered Approach for
Identification of a Human Fecal Pollution Source at a Recreational Beach: Case
Study at Avalon Bay, Catalina Island, California', Environmental Science and
Technology, vol. 37, no. 4, pp. 673-680.
Booth, AM, Hagedorn, C., Graves, AK., Hagedorn, SC., and Mentz, KH 2003, ‘Sources
of Fecal Pollution in Virginia's Blackwater River’. Journal of Environmental
Engineering. Volume 129, Issue 6, pp. 547-552 (June 2003).
Brownell, MJ, Harwood, VJ, Kurz, RC, McQuig, SM, Lukasik, J & Scott, TM 2007,
‘Confirmation of putative stormwater impact on water quality at a Florida beach
by microbial source tracking methods and structure of indicator organism
populations’, Water Research. Aug;41(16):3747-57.
Burkhardt, W., Calci, K.R., Watkins, W.D., Rippey, S.R., and Chirtel, S.J. 2000,
‘Inactivation of indicator microorganisms in estuarine waters’. Water Research
34: 2207-2214.
Cabelli, V.J.. 1989, ‘Swimming-associated illness and recreational water quality criteria’.
Water Science and Technology 21(2): 13-21.
Cabelli, V.J. 1983, Health Effects Criteria for Marine Recreational Waters, U.S.
Environmental Protection Agency, Washington, DC.

82
Calderon, R.L., Moodi, E.W., Dufour, A.P. 1991, ‘Health effects of swimmers and
nonpoint sources of contaminated water’. International Journal of Environmental
Health Research 1: 21-31.
Cheung WH, Chang KC, Hung RP, Kleevens JW. 1990, ‘Health effects of beach water
pollution in Hong Kong’, Epidemiology Infection. Aug;105(1):139–162.
Choi, S, Chu, W, Brown, J, Becker, SJ, Harwood, VJ and Jiang, SC 2003, ‘Application of
enterococci antibiotic resistance patterns for contamination sources identification
at Huntington Beach’. California. Marine Pollution Bulletin, vol. 46, pp. 748-755.
Cioglia, L. and Loddo, B 1962, ‘The process of self-purification in the marine
environment III. Resistance of some enteroviruses, Nouvi Annli Di Igiene’,
Environmental Microbiologia, 13, 11.
Colarado State University 2010, ‘Interrater reliability’. Colarado State University, Viewed on 21 May 2010 <http://writing.colostate.edu/guides/research/relval/com2a5.cfm>
Corbett, S. S., Rubin, G. L, Curry, G. K. and Kleinbaum, D. G. 1993, ‘The health effects
of swimming at Sydney beaches. The Sydney Beach Users Study Advisory
Group’. American Journal of Public Health 83(12): 1701-6.
Craun, GF, Calderon, RL, Craun, MF 2005, ‘Outbreaks associated with recreational
water in the United States’. International Journal of Environmental Health
Research, Volume 15,, Issue 4 August 2005, pp 243 – 262.
Davies-Colley, R., Bell, RG., and Donnison, AM. 1994, ‘Sunlight Inactivation of
Enterococci and Fecal Coliforms in Sewage Effluent Diluted in Seawater’.
Applied and Environmental Microbiology, 1994 June; 60(6): 2049-2058.

83
Department of Health 2006, ‘Health risk assessment’. Department of Health, Western
Australia, Viewed on 5 may 2010
<http://www.public.health.wa.gov.au/cproot/1499/2/Health_Risk_Assessment.pdf
>
Department of Health (DOH) 2007a, Entero Tester Template, Department of Health,
Perth, Western Australia, viewed 10 December 2007,
<http://www.healthyswimming.health.wa.gov.au/publications/docs/EnteroTesterT
oU.XLT >
Department of Health (DOH) 2007b, Microbial Quality of Recreational Waters Guidance
Notes in Support of Chapter 5 of the NHMRC Guidelines for Managing Risks in
Recreational Waters, Department of Health, Uni Print, Perth, Western Australia,
viewed 10 December 2007,
<http://www.healthyswimming.health.wa.gov.au/publications/docs/Microbial>
DEFRA 2009, ‘The 1976 Bathing Water Directive (76/160/EEC)’,
Department of Environment and Rural Affairs, UK, Viewed on 12 February 2010
<
http://www.defra.gov.uk/environment/quality/water/waterquality/bathing/index.ht
m>
Dwight, R.H., Baker, D.B., Semenza, J.C. and Olson, B.H. 2004, ‘Health effects
associated with recreational coastal water use: urban versus rural California’.
American Journal of Public Health, 94(4), 565–567.
Dwight, RH, Fernandez, LM, Baker, DB, Semenza, JC & Olson, BH 2005, ‘Estimating
the economic burden from illnesses associated with recreational coastal water
pollution—a case study in Orange County, California’, Journal of Environmental
Management, vol. 76, no. 2, pp 95-103.

84
Elmir, S.M., Wright, M.E., Abdelzaher, A., Solo-Gabriele, H.M., Fleming, L. E., Miller,
G., Rybolowi, M., Shih, M.P, Pillai, S.P., Cooper, J.A., and Quaye, E.A. 2007,
‘Quantitative evaluation of bacteria released by bathers in a marine water’. Water
Research, Volume 41, Issue 1, January 2007, pp 3-10.
Epstein, PR 1998, Marine ecosystems: Emerging diseases as indicators of change. Year
of the ocean special report on the health of oceans from Labrador to Venezulea.
Boston, MA: Centre for Health and the Global Environment, Harvard Medical
School.
Environmental Protection Authority (EPA) 2001, Recreational water quality monitoring
at Popular Beaches, Lakes and Rivers in South-east Queensland, 2000 – 2001,
Waterways Scientific Services, EPA, Queensland, Australia.
enHealth 2004, ‘Environmental health risk assessment guidelines for assessing human
health risks from environmental hazards’. Department of Health and Ageing.
Australia, June 2004.
EUROPA 2009, “The 1976 Bathing Water Directive (76/160/EEC)”, European
Commission, Viewed on 5 May 2010
<http://ec.europa.eu/environment/water/water-bathing/index_en.html>
Fattal, B., Peleg-Olevsky, E., Agursky, T. & Shuval, H. I. 1987, 'Association Between
Seawater Pollution as Measured by Bacterial Indicators and Morbidity Among
Bathers at Mediterranean Bathing Beaches of Israel ', Chemosphere vol. 16, pp.
565-570.
Ferguson, C., Husman, A.M.D., Altavilla, N., Deere, D. and Ashbolt, N. 2003, Fate and
transport of surface water pathogens in watersheds. Critical Reviews in
Environmental Science and Technology 33, 299–361.

85
Ferguson, C.M., Coote, B.G., Ashbolt, N.J. and Stevenson, I.M. 1996, Relationships
between indicators, pathogens and water quality in an estuarine system. Water
Research 30, 2045–2054.
Fleisher, J. J., Kay, D., Wyer, M. and Merrett, H. 1996, ‘The enterovirus test in the
assessment of recreational water-associated gastroenteritis’. Water Research
30(10): 2341-2346.
Geary, PM. 2003, “The Use of Tracers in assessing on-site system failures in Port
Stephens” School of Environmental and Life Sciences, University of Newcastle,
Onsite conference 2003 (conference paper).
Georgiou, S., Langford, IH., 2002, ‘Coastal Bathing Water Quality and Human Health
Risks: A Review of Legislation, Policy and Epidemiology, with an Assessment of
Current UK Water Quality, Proposed Standards, and Disease Burden in England
and Wales”. Centre for Social and Economic Research on the Global
Environment (CSERGE) ECM-2002-06.
Graczyk, TK., Sunderland, D., Awantang, GN., Mashinski, Y., Lucy, FE., Graczyk, Z.,
Chomicz, l., and Breysse, PN. 2010, ‘Relationships among bather density, levels
of human waterborne pathogens, and fecal coliform counts in marine recreational
beach water’. Journal of Parasitology Research, Volume 106, Number 5 / April,
2010, 1103 – 1108.
Graczyk, TK., Sunderland, D., Tamang, L., Lucy, FE., & Breysse, PN. 2007, ‘Bather
density and levels of Cryptosporidium, Giardia, and pathogenic microsporidian
spores in recreational bathing water’. Journal of Parasitology Research, Volume
101, Number 6 / November, 2007.
Green, L. and Lewis, F. 1986, ‘Measurement and Evaluation in Health Education and
Health Promotion’. Mayfield, Palo Alto, CA.

86
Given, S, Pendleton, LH & Boehm, AB 2006, “Regional Public Health Cost Estimates of
Contaminated Coastal Waters: A Case Study of Gastroenteritis at Southern
California Beaches”, Environmental Science and Technology, vol. 40, no. 16, pp.
4851–4858.
Goulding, R., Jayasuriya, N., Horan, E. & Nugegoda, D. 2007, 'Faecal indicators in
waterways following wet weather sewer spills' 2nd IWA - Aspire Conference and
Exhibition, IWA (ed.), 2nd IWA - Aspire Conference and Exhibition, Perth,
Australia.
Hagedorn, C, Robinson, SL, Filtz, JR, Grubbs, SM, Angier, TA & Reneau Jr, RB 1999,
‘Determining Sources of Fecal Pollution in a Rural Virginia Watershed with
Antibiotic Resistance Patterns in Fecal Streptococci’ Applied and Environmental
Microbiology. vol. 65, No. 12, p. 5522-5531,
<http://aem.asm.org/cgi/content/abstract/65/12/5522>
Haile, R. W., Witte, J. S., Gold, M., Cressey, R., McGee, C., Millikan, R. C., Glasser, A.,
Harawa, N., Ervin, C., Harmon, P., Harper, J., Dermand, J., Alamillo, J., Barrett,
K., Nides, M. & Wang, G. 1999, 'The Health Effects of Swimming in Ocean
Water Contaminated by Storm Drain Runoff', Epidemiology, vol. 10, no. 4, p.
355.
Harper, HH, Bachmann, RW, Jones, JR, Peters, RH & Soballe DM 1995, ‘Effects of
groundwater seepage from septic areas on nutrient loadings and bacteriological
inputs on Clear Lake’, Lake Reservation Management, vol. 11, pp. 147-152.
Hose, GC, Gordon, G, McCullough, FE, Pulver, N & Murray, BR 2005, ‘Spatial and
rainfall related patterns of bacterial contamination of Sydney Harbour estuary’,
Journal of Water and Health, vol. 3, no. 4, pp. 349-358.

87
Hill, DD, Owen, WE & Tchounwou, PD 2006, ‘The impact of rainfall on fecal coliform
bacteria in Bayou Dorcheat (North Louisiana)’, International Journal of
Environmental Research and Public Health, vol. 3(1). Pp. 114-117.
Kashefipour, SM, Lin, B & Falconer, RA 2006, ‘Modelling the fate of faecal indicators in
a coastal basin’, Water Research, vol. 40, pp1413-1425.
Kay, D. D., Bartram, J., Pruss, A., Ashbolt, N., Wyer, M. D., Fleisher, J. M. 2004,
‘Derivation of numerical values for the World Health Organization guidelines for
recreational waters’. Water Research 38(5): 1296-304.
Kay, D. D., Ashbolt, N., Wyer. M. D., Fleisher, J. M., Fewtrall, L. et al. 2006. ‘Reply to
comments on Derivation of numerical values for the World Health Organization
guidelines for recreational waters’. Water Research 40(9): 1921-1925.
Kay, D. D., Fleischer, J. M., Salomon, R. L., Jones, F., Wyer, M. D., Goodfree, A. F.,
Zelenauch-Jacquotte, Z. and Shore, R. 1994, ‘Predicting likelihood of
gastroenteritis from sea bathing; results from randomized exposure’. The Lancet,
344 (8927), 905-909.
Kay, D., Stapleton, CM., Wyer MD, McDonald AT, Crowther, J., Paul N, Jones K,
Francis C, Watkins J, Wilkinson J, Humphrey N, Lin B, Yang L, Falconer RA,
and Gardner S. 2005, ‘Decay of intestinal enterococci concentrations in high-
energy estuarine and coastal waters: towards real-time T90 values for modeling
faecal indicators in recreational waters’, Water Research, 2005 Feb;39(4):655-67.
Kay, D, Fleisher, JM, Salmon, RL, Wyer, MD, Godfree, AF, Zelenauch-Jacquotte, Z.
1994, ‘Predicting likelihood of gastroenteritis from sea bathing: results from
randomised exposure’, The Lancet, vol. 344, pp. 905-910.

88
Kinzelman, J, McLellan, SL, Daniels, AD, Cashin, S, Singh, A, Gradus, S & Bagley, R
2004, ‘Non-point source pollution: Determination of replication versus
persistence of Escherichi coli in surface water and sediments with correlation of
levels to readily measurable environmental parameters’. Journal of Water and
Health, vol 02.2, pp. 103-114.
Kronvang, B. Rubæk, g.H., and Heckrath, G. 2009 ‘International Phosphorus Workshop:
Diffuse Phosphorus Loss to Surface Water Bodies—Risk Assessment, Mitigation
Options, and Ecological Effects in River Basins’. Journal of Environment Quality,
vol 38 No. 5, p. 1924-1929.
Le Fevre, NM & Lewis, GD 2003, ‘The role of resuspension in enterococci distribution
in water at an urban beach’. Water Science and Technology, vol 47, no. 3, pp 205-
210.
Litwin, MS. 1995, ‘How to measure survey reliability and validity’, SAGE Publications,
Thousand Oaks, California.
McBride, G.B., Salmond, C.E., Bandaranayake, D.R., Turner, S.J., Lewis, G.D. and Till,
D.G. 1998, ‘Health effects of marine bathing in New Zealand’. Int. J. Environ.
Health Res. 8, 173–189.
Medema, G., Smeets, P. 2004, ‘The interaction between Quantitative Microbial Risk
Assessment and risk management in the Water Safety Plan’, Kiwa Water
Research/Delft University.
Medema, G.J., van Asperen, I., Havelaar, A. 1997, ‘Assessment of the exposure of
swimmers to microbiological contaminants in fresh waters’. Water Science and
Technology 35(11): 157-163.

89
New Zealand Ministry for the Environment (NZME). 2003, Microbiological Water
Quality Guidelines for Marine and Freshwater Recreational Areas. Technical
report. Ministry for the Environment.
NHMRC 2008, Guidelines for Managing Risks in Recreational Waters, National Health
and Medical Research Council, Australian Government Publishing Service,
Canberra, pp. 57-90.
NHMRC 2004, Australian Drinking Water Quality Guidelines, National Health and
Medical Research Council, Australian Government Publishing Server, Canberra.
NHMRC 1990, Australian Guidelines for Recreational Use of Water, NHMRC,
Australian Government Publishing Service, Canberra.
Noble, RT, Moore, DF, Leecaster, MK, McGee,CD, Weisberg, SB. 2003, “Comparison
of total coliform, fecal coliform, and enterococcus bacterial indicator response for
ocean recreational water quality testing” Water Research 37, 1637–1643.
NSWDEC 2004, ‘Monitoring and reporting coastal recreational water quality:
information package and field manual’. Department of Environment and
Conservation, Sydney, Australia. Viewed at:
< http://www.epa.nsw.gov.au/beach/cpp/protocol.htm>
Paul, JH, Rose, JB, Jiang, S, Kellogg, C & Shinn, EA 1995, ‘Occurrence of fecal
indicator bacteria in surface waters and the subsurface aquifer in Key Largo’..
Applied and Environmental Microbiology, vol. 61, pp. 2235-2241.
Pond, K 2005, Water Recreation and Disease – Plausibility of associated infections:
Acute effects, sequelae and mortality, IWA Publishing, London.

90
Pommepuy, M., Fiksdal. L,. Gourmelon, M.,Melikechi, H.,. Caprais, M.P., Cormier, M.
and Colwell, R.R. 1996, “Effect of seawater on Escherichia coli β-galactosidase
activity”. Journal of Applied Microbiology, Volume 81, Issue 2, pages 174–180,
August 1996.
Prüss, AA 1998, “Review of epidemiological studies on health effects from exposure to
recreational water”, International Journal of Epidemiology, vol. 27, no. 1, pp. 1-
9.
Rosenfeld, LK, McGee, CD, Robertson, GL, Noble, MA, and Jones BH 2006, “Temporal
and spatial variability of fecal indicator bacteria in the surf zone off Huntington
Beach, CA”, Marine Environmetnal Research, pp 471-480.
Samir M. Elmir, SM, Wright, ME, Abdelzaher, A, Solo-Gabriele, HM, Fleming, LE,
Miller, G, Rybolowik, M, Shih, MP, Pillai, SP, Cooper, JA & Quaye, EA 2006,
“Quantitative evaluation of bacteria released by bathers in a marine water”, Water
Research, vol. 41, no. 1, pp. 3-10.
Sanders, BF, Arega, F & Sutula, M 2005, “Modeling the dry-weather tidal cycling of
fecal indicator bacteria in surface waters of an intertidal wetland”, Water
Research, vol. 39, pp. 3394-3408.
Salas, H.J., 1986, History and Application of Microbiological Water Quality Standards in
the Marine Environment, Water Science Technology, Vol. 18, No. 11, 1986.
Schijven, J., & de Roda Husman, AM. 2006, ‘A Survey of Diving Behavior and
Accidental Water Ingestion among Dutch Occupational and Sport Divers to
Assess the Risk of Infection with Waterborne Pathogenic Microorganisms’.
Environmental Health Perspectives, 2006 May; 114(5): 712–717.

91
Shehane, SD, Harwood, VJ, Whitlock, JE & Rose, JB 2005, ‘The influence of rainfall on
the incidence of microbial faecal indicators and the dominant sources of faecal
pollution in Florida river’, Journal of Applied Microbiology, vol. 98, 1127-1136.
Shire of Murray 2005, Sanitary Survey of the Murray River, Shire of Murray, Western
Australia (unpublished).
Signor, RS, Ashbolt, NJ, & Roser, DJ 2007, ‘Microbial risk implications of rainfall-
induced runoff events entering a reservoir used as a drinking-water source’,
Journal of Water Supply: Research and Technology, vol. 56. no. 8. pp 515-531.
Signor, RS, Roser, DJ, Ashbolt, NJ & Ball, JE 2005, ‘Quantifying the impact of runoff
events on microbiological contaminat concentrations entering surface drinking
source waters’, Journal of Water and Health, vol 03.4, pp. 4453-468.
Sinton, L.W., Hall, C.H., Lynch, P.A. and Davies-Colley, R.J. 2002, ‘Sunlight
inactivation of fecal indicator bacteria and bacteriophages from waste stabilization
pond effluent in fresh and saline waters’. Applied and Environmental
Microbiology, 68: 1122-1131.
Sinton, L. W., Finaly, R. K. and Lynch, P. A. 1999, ‘Sunlight inactivation of fecal
bacteriophages and bacteria in sewage-polluted seawater’. Applied and
Environmental Microbiology, 65(8), 3605-3613.
Sinton, L., Finlay, R.K., Hannah, D.J. 1998, ‘Distinguishing human from animal faecal
contamination in water: a review’. New Zealand Journal of Marine and
Freshwater Research, 32: 323-348.
Smeeton, N.C. 1985. ‘Early History of the Kappa Statistic’. Biometrics 41: 795.

92
Snow, D. 1981, The progress of public health in Western Australia, 1829-1977. Public
Health Department: distributed by University of Western Australia Press, 1981.
SPSS tutorials 2010, ‘Interrater reliability (Kappa) Using SPSS’, viewed 13 October
2010, <http://www.stattutorials.com/SPSS/TUTORIAL-SPSS-Interrater-
Reliability-Kappa.htm>
Sorvillo FJ, Waterman SH, Vogt JK, England B. 1998, ‘Shigellosis associated with
recreational water contact in Los Angeles County’. PubMed 1988 May;38(3):613-
7.
Standards Association of Australia 2009, Risk management - Principles and guidelines.
Australian Standard 3100:2009, Standards Australia, Sydney.
Standards Association of Australia 2004, Risk Management Guidelines Companion to
AS/NZS 4360:2004, Standards Australia, Sydney.
Statistics.com 2010, Statistical Glossary: Face Validity. Viewed 16 December 2010 at
<http://www.statistics.com/resources/glossary/f/facevalid.php>
Streiner, DL. and Norman GR. 1989, Health measurement scales: a practical guide to
their development and use, Oxford Medical Publications, New York.
Thurston-Enriquez, JA, Gilley, JE & Eghball, B 2005, ‘Microbial quality of runoff
following land application of cattle manure and swine slurry’, Journal of Water
and Health, vol 3.2, pp. 157171.
Turbow, DD, Osgood, ND & Jiang, SC 2003, ‘Evaluation of recreational health risk in
coastal waters based on enterococcus densities and bathing patterns’.
Environmental Health Perspectives, vol. 111, no.4, pp. 598-603.

93
USEPA 2010, ‘Review of published studies to characterize relative risks from different
sources of fecal contamination in recreational water’. Office of Water Health and
Ecological Criteria Division, United States Environmental Protection Agency
(USEPA), Viewed on 5 May 2010 <
http://www.epa.gov/waterscience/criteria/recreation/pdf/fecalcontamrecreationalw
aters.pdf >
USEPA 2009, ‘Comparison table of TMDL reports and shoreline/sanitary surveys’.
United States Environmental Protection Agency (USEPA). Viewed on 5
December 2009 <
http://www.epa.gov/waterscience/beaches/sanitarysurvey/pdf/comparison_table.p
df>
USEPA 2008a, ‘Nonpoint Source Pollution: The Nation's Largest Water Quality
Problem’, United States Environmental Protection Agency (USEPA), viewed 12
March 2009, < http://www.epa.gov/owow/nps/facts/point1.htm>
USEPA 2008b. “Great Lakes Beach Sanitary Survey User Manual’. United States
Environmental Protection Agency (USEPA) Office of Water, viewed 5 May 2010,
< http://www.epa.gov/waterscience/beaches/sanitarysurvey/>
USEPA 2007, Report of the Experts Scientific Workshop on Critical Research Needs for
the Development of New or Revised Recreational Water Quality Criteria, United
States Environmental Protection Agency (USEPA), Office of Water, June 15
2007, viewed August 2007,
<http://www.epa.gov/waterscience/criteria/recreation/experts/index.html>
USEPA 2004 “Water Quality Standards for Coastal and Great Lakes Recreation Waters
Rule” United States Environmental Protection Agency (USEPA), November 16,
2004, viewed on 10 January 2009 < http://www.epa.gov/fedrgstr/EPA-
WATER/2004/November/Day-16/w25303.pdf>

94
USEPA 1999. Action Plan for Beaches and Recreational Waters. United States
Environmental Protection Agency Available online:
<http://www.epa.gove/ORD/publications>
Von Schirnding, Y. E., Kfir, R., Cabelli, V., Franklin, L. & Joubert, G. 1992, 'Morbidity
among bathers exposed to polluted seawater. A prospective epidemiological
study', South African Medical Journal, vol. 81, no. 11, pp. 543-546.
Wade, T.T., Calderon, R.L., Sams, E., Beach, M., Brenner, K.P. 2006. ‘Rapidly measured
indicators of recreational water quality are predictive of swimming-associated
gastrointestional illness’. Environmental Health Perspectives 114(1): 24-28.
Wade, T.J., Pai, N., Eisenberg, J.N. and Colford, J.M. 2003. ‘Do U.S. Environmental
Protection Agency water quality guidelines for recreational waters prevent
gastrointestinal illness? A systematic review and meta-analysis’. Environmental
Health Perspectives, Jun 111(8): 1102-1109.
Water Services Association of Australia (WSAA) 2003, Catchments for Recreational
Water: Conducting and Assessing Sanitary Inspections, WSAA, Occasional Paper
No. 8.
Wiedenmann, A., Petra Krüger, P., Dietz, K., López-Pila, JM., Szewzyk, R., and
Botzenhart, K., 2006, ‘A Randomized Controlled Trial Assessing Infectious
Disease Risks from Bathing in Fresh Recreational Waters in Relation to the
Concentration of Escherichia coli, Intestinal Enterococci, Clostridium
perfringens, and Somatic Coliphages’. Environmental Health Perspectives,
February; 114(2): 228–236.
WHO 2003a, Guidelines for Safe Recreational Water Environments Volume 1 Coastal
and Fresh Waters, World Health Organization, Geneva.

95
WHO 2003b, Healthy recreational waters, World Health Organization, Geneva, viewed
12 March 2009, <http://www.who.int/features/2003/10/en/>
WHO, 2001, Bathing water quality and human health, Outcome of an expert consultation.
Farnham, UK, April 2001.
WHO 2000, Monitoring Bathing Waters - A Practical Guide to the Design and
Implementation of Assessments and Monitoring Programmes: Chapter 8*:
SANITARY INSPECTION AND MICROBIOLOGICAL WATER QUALITY.
Geneva, World Health Organization.
WHO 1999, Health-based monitoring of recreational waters: the feasibility of a new
approach (the “Annapolis Protocol”). Geneva, World Health Organization
(http://www.who.int/water_sanitation_health/bathing/Annapolis.pdf)
WHO 1996, Guidelines for drinking-water quality. Second edition. Volume 2; Health
criteria and supporting information. Geneva, World Health Organization.
Wikipedia 2010, ‘Cohen’s Kappa’. Wikipedia, Viewed on 10 January 2011 at
<http://en.wikipedia.org/wiki/Cohen's_kappa>
Windsor, R., Baranowski, T., Clark, N., Cutter, G., 1994. Evaluation of Health
Promotion, Health Education and Disease Prevention Programs, 2nd Edition,
May®eld Publishing, Toronto.
Wither, MA, Rehfisch. M, and Austin, G 2005, ‘The impact of bird populations on the
microbiological quality of bathing waters’. Water Science and Technology, vol
51, no. 3-4, pp. 199-207.
Zmirou, D., Pena, L., Ledrans, M., and Letertre, A. 2003. Risks associated with the
microbiological quality of bodies of fresh and marine water used for recreational
purposes: Summary estimates based on published epidemiological studies.
Archives of Environmental Health 58(11): 703-711.

96
Appendix 1: Published article

97

98

99

100

101

102

103

104

105

106

107
Appendix 2: Water Services
Association of Australia Sanitary
Inspection Form

108
Appendix 2: Water Services Association of Australia Sanitary Inspection Form
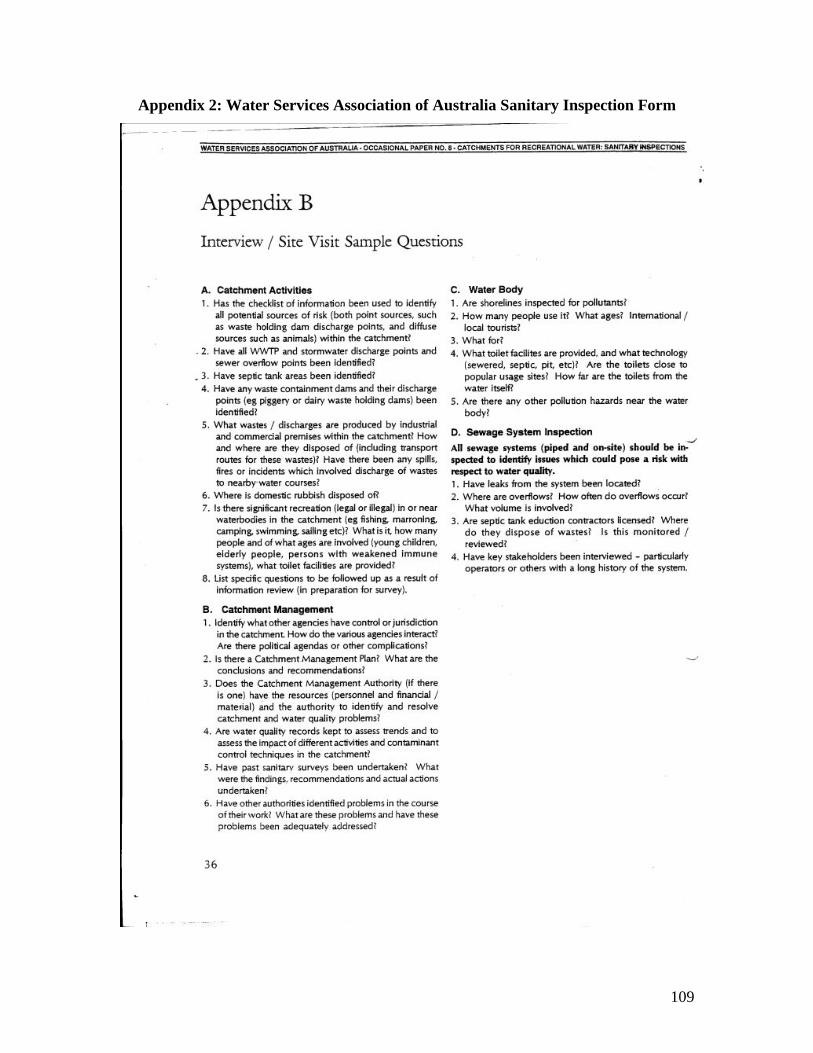
109
Appendix 2: Water Services Association of Australia Sanitary Inspection Form

110
Appendix 3: New Zealand Catchment
Assessment Checklist (CAC)

111
Appendix 3: New Zealand Catchment Assessment Checklist (CAC)

112
Appendix 3: New Zealand Catchment Assessment Checklist (CAC)

113
Appendix 3: New Zealand Catchment Assessment Checklist (CAC)

114
Appendix 3: New Zealand Catchment Assessment Checklist (CAC)

115
Appendix 3: New Zealand Catchment Assessment Checklist (CAC)

116
Appendix 3: New Zealand Catchment Assessment Checklist (CAC)

117
Appendix 4: United States Sanitary
Inspection Form

118
Appendix 4: United States Sanitary Inspection Form

119
Appendix 4: United States Sanitary Inspection Form

120
Appendix 4: United States Sanitary Inspection Form

121
Appendix 4: United States Sanitary Inspection Form

122
Appendix 4: United States Sanitary Inspection Form

123
Appendix 4: United States Sanitary Inspection Form

124
Appendix 4: United States Sanitary Inspection Form

125
Appendix 4: United States Sanitary Inspection Form

126
Appendix 4: United States Sanitary Inspection Form

127
Appendix 5: Initial Sanitary
Inspection Form (original version)

128
PART A: DEFINE THE CATCHMENT AND RECREACTIONAL WATER BODY NOTE: Recreational water body means any public coastal, estuarine or freshwater areas where a significant number of people use the water for recreation (or “whole of body contact”). 1. Site Identification Type of site: Estuarine Coastal Freshwater Other: Site Name: Site Address: Global Positioning Coordinates: Northing: Easting: Responsible Authority: Site Reference No.: Sample Site Global Positioning Coordinates
(The exact location where sample is collected): Northing: Easting:
Sample Site Description
(Describe the exact location where the sample is collected): Contact Person: Date: Has a previous sanitary inspection category (SIC) been assigned? Yes No
If yes, provide details (category and date of completion): 2. Physical Characteristics of the Recreational Water Body 2.1 Recreational Water Body Is there a beach (e.g. sand along the shoreline of the body of water) at this location? Yes
No Define the approximate dimensions of the recreational water body used by the public for whole of body contact (define area on an aerial MAP): Length:
Mean Width: Area:
Describe characteristics of the immediate area surrounding the recreational water body e.g. trees along shoreline, reeds along river banks, reef, jetty:
Direction of prevailing winds (Prevailing wind is the wind that blows most frequently across a particular region):
N NE NW E S SE SW W What level of dilution (e.g. mixing) occurs in the water?
High (high level of flushing and turn over of water, high tidal movement e.g. coastal beaches, estuaries)
Low (low level of flushing and turn over of water, low tidal movement e.g. enclosed water bodies, small lakes)

129
2.2 Land Cover and Geography Describe the main land cover and geography of the catchment (include the approximate percentage (%) of land cover within a 2km radius of site)
Residential _______ % Rural _______ % Landfill site
________ %
Commercial _______ % Parks, gardens, reserve, bush land _______ %
Road/rail _______ %
Industrial ________% Specify: From your knowledge of the recreational water body, what are the potential faecal pollutant sources coming from the catchment? (e.g. sewage outfall, agricultural runoff)
ATTACH MAP and PHOTOGRAPHS detailing physical characteristics of the immediate and surrounding areas.
3. Recreational Water Usage What common recreational activities occur in the recreational water body?
Swimming Water skiing Jet-skiing Fishing Canoeing/kayaking Boating Other What common age groups recreate in the recreational water body:
Predominately young Children (<7 years of age) All age groups Tourists Predominately adults and children (>7 years of
age) Predominantly elderly groups (>60
years) Is this swimming location subject to above summer/holiday bather loading? (e.g. does the recreational water body experience a considerable increase in usage during the summer/school holiday period) Yes No Approximate number of people using the recreational water body (e.g. 500 to 1000 people on the weekend, check lifeguard statistics where available): _________to _______ people per day on the weekend ______ to _____ people per weekday (non-holiday period)
_________to _______ people per weekday (holidays period) Do surf or water conditions regularly deter people from entering the water? Yes No On some occasions List other conditions that have deterred people from entering the water? E.g. algal blooms Are lifeguard services provided for this site?
Yes No If yes, weekends weekdays both
Are car parking bays provided? Yes No If yes, approximately how many bays?
Are BBQ facilities provided? Yes No Are rubbish bins provided?
Yes No

130
Have complaints of recreational water illnesses been recorded from this site? Yes No If yes, provide details:
Circle the most appropriate “consequence” that describes the level of consequence a pollution event at the recreational water body may present to public health. Only choose one consequence that best suits the location.
Source: Table Adopted from HB 436:2004 and 2004 DEC (NSW)
Note: The consequence circled in the table above is to be used throughout the following sections.
Consequence (Circle the most appropriate consequence that best fits the description of the location)
Description (Tick appropriate boxes from only one consequence that best suits the recreational water body. NOTE: Not all boxes need to be ticked)
Minor
Location rarely used on weekdays Location occasionally used on weekends or holidays Few people enter the water Location not popular with children or the elderly Of minimal importance to local economy
Moderate
Location occasionally used on weekdays (e.g. <100 people per day for non-holiday period)
Location frequently used on weekends or holidays Most people enter the water Location very popular with children or the elderly Location of some importance to the local economy
Major
Location frequently used on weekdays, weekends and holidays
Most people enter the water Location very popular with children or the elderly Location of great importance to the local economy
PART B: SOURCES OF FAECAL POLLUTION 1. Toilet Facilities

131
Are toilet facilities located in close proximity to the recreational water body? Yes No If no refer to section 2 Approximately how far are the toilets located from the water body? _______ m Have any discharges, leakages or odours been recorded from the sewerage system? Yes
No If yes provide details:
What type of sewerage system is used? On-site wastewater system (e.g. septic tank systems) Sewer
Total no. of toilets: ______ Total no. of showers: ______ If an on-site wastewater system is used, how often are they pumped out and/or serviced? _______ Using the table below, to what degree is the water quality at the recreational water body affected, or likely to be affected by faecal pollution from the toilets? (Consider the distance of the toilets from water body, type of wastewater disposal, usage of toilets) Circle the appropriate risk classification by aligning the most suitable likelihood of pollution with the corresponding consequence.
Consequence (Use the
consequence assigned in Part
A section 3)
Likelihood of Pollution From This Source
(Refer to table 2 of instructions for further definitions of likelihood) Rare
(May occur only in
exceptional circumstances e.g. >5 years)
Unlikely
(Unlikely to occur but
could occur at least once
within a 5 year period)
Possible
(Might occur at least once or twice per
bathing season)
Likely
(Will probably occur at least
3 – 4 times per bathing
season)
Almost Certain
(Will occur on a regular basis
e.g. once a week)
Minor Very Low risk
Very Low risk
Low risk Low risk Moderate risk
Moderate Very Low risk
Low risk Low risk Moderate risk
High risk
Major Low risk Low risk Moderate risk
High risk Very High risk
From your knowledge of the recreational water body, do you believe the above risk classification accurately represents this risk? Yes No If No, justify answer and provide suggested reassigned risk classification (Use table 5 of the Sanitary Inspection Report Instructions for guidance where historical enterococci data is available):
List the assigned risk classification:
2. Bather Density Circle the appropriate risk classification below for the appropriate bather density risk (the number of people using the recreational water body) during peak usage times in relation to

132
the dilution rate (e.g. mixing) of the recreational water body (use dilution rate referred to in Part A Section 2).
High density: >100 people during peak times Low density: <100 people during peak times High bather density, high dilutiona
Low risk High bather density, low dilutiona,b
Moderate risk
Low bather density, high dilution
Very Low risk Low bather density, low dilutionb
Low risk
a Move up to next category if no sanitary facilities are available at site b Dilution low if no water movement Comment: (Where available, provide details of any monitoring that has been undertaken to confirm bather impact on water quality)
From your knowledge of the recreational water body, do you believe the above risk classification is a true representation of this risk? Yes No If No, justify answer and provide suggested reassigned risk classification (Use table 5 of the Sanitary Inspection Report Instructions for guidance where historical enterococci data is available):
List the assigned risk classification:
3. Discharges of Wastewater 3.1 Sewage Outfalls Are sewage outfalls located within a 2km radius of the site? Yes No If no refer to section 3.2 If yes, outfall name: Global Positioning Coordinates: Northing: Easting: How far does the outfall discharge out into the water body? ______________________ How far is the outfall located from the recreational water body (are used by the public)? __________________ Attach specific details of the type of wastewater treatment and MAP of outfall schematics and location.
Type of Outfall

133
Using the table below, circle the appropriate risk classification by aligning the type of outfall with the treatment applied:
Source: Table adopted from WHO Monitoring Bathing Waters – A Practical Guide to the Design and Implementation of Assessments and Monitoring Programmes
na = not applicable a The risk is modified by population size. Risk is greater for discharges from large populations and less for discharges from small populations
This assumes that the design capacity has not been exceeded and that climatic and oceanic extreme conditions are considered in the design objective (ie no sewage on the beach zone) c Disinfection alone is inadequate d Additional investigation recommended to account for the likely lack of prediction with faecal indicator organisms as outlined in Table 5.7 of the Guidelines
Treatment
(How is wastewater treated before being discharged into offshore?)
Directa
(Discharged directly to
recreational water body or adjacent area)
Shorta
(Discharges within inter-tidal zone, significant
probability of sewage plume
reaching recreational water body)
Long/Effectiveb
(Discharged several kilometres offshore,
sufficient length and depth to ensure low probability of
sewage plume reaching
recreational water body)
No treatment (raw sewage) Very High High Na Preliminary (filtration with milli- or micro-screens)
Very High High Low
Primary (physical sedimentation) Very High High Low Secondary (primary + trickling filter/activated sludge)
High High Low
Secondary + disinfection (primary + trickling filter/activated sludge + disinfection)c,d
Moderate Moderate Very Low
Tertiary (secondary + coagulation-sand filtration)
Moderate Moderate Very Low
Tertiary + disinfection (secondary + coagulation-sand filtration + disinfection)
Very Low Very Low Very Low
Lagoons (low-rate biological treatment)
High High Low
Is wastewater discharged at the outfall monitored regularly for microbiological quality? Yes No Provide comments on monitoring program (List program name, responsible authority, overview of monitoring results): Have any signs of sewage pollution been reported at the recreational water body? Yes
No

134
If yes, provide details: Using the table below, to what degree is water quality at the recreational water body affected or likely to be affected by onshore winds, currents or tides carrying polluted wastewater into the area? Circle the appropriate risk classification by aligning the most suitable likelihood of pollution with the corresponding consequence.
Consequence (Use the
consequence assigned in Part
A section 3)
Likelihood of Pollution From This Source
(Refer to table 2 of instructions for further definitions of likelihood) Rare
(May occur only in
exceptional circumstances e.g. >5 years)
Unlikely
(Unlikely to occur but
could occur at least once
within a 5 year period)
Possible
(Might occur at least once or twice per
bathing season)
Likely
(Will probably occur at least
3 – 4 times per bathing
season)
Almost Certain
(Will occur on a regular basis
e.g. once a week)
Minor Very Low risk
Very Low risk
Low risk Low risk Moderate risk
Moderate Very Low risk
Low risk Low risk Moderate risk
High risk
Major Low risk Low risk Moderate risk
High risk Very High risk
From your knowledge of the recreational water body, do you believe the above risk classification is a true representation of this risk? Yes No If No, justify answer and provide suggested reassigned risk classification (Use table 5 of the Sanitary Inspection Report Instructions for guidance where historical enterococci data is available):
Where available ATTACH CHARTS detailing ocean currents and tides. 3.2 Sewerage System Are pumping stations located within a 1km radius of the site? (1km is an approximate estimation and can be increased or decreased depending on the catchment) Yes No If no refer to section 3.3 If yes, provide pump station location(s) and ATTACH MAP detailing locations:
Are pump station(s) fitted with emergency overflow alarms? (Confirm with appropriate agency)
Yes No Comment (Last time alarms checked for compliance):
In the event that pumping station overflow alarms fail, where will wastewater be diverted (e.g. into stormwater system, retention basin)?

135
3.3 On-Site Wastewater Systems (e.g. septic tanks, aerobic treatment units) Are surrounding properties using on-site wastewater systems? (Look at a distance of at least a 100m radius from the recreational water body) Yes No If no refer to section 3.4
If yes, ATTACH MAP detailing approximate on-site system locations. How far is the nearest on-site disposal system from the recreational water body (not including onsite toilet facilities discussed in Part B.1)? Have specific studies been undertaken to determine whether on-site wastewater systems are contributing to faecal pollution of the recreational water body? Yes No If yes, provide details:
Using the table below, to what degree is water quality at the recreational water body affected, or likely to be affected by contamination from on-site wastewater systems? (Consider the distance from water body)
Circle the appropriate risk classification by aligning the most suitable likelihood of pollution with the corresponding consequence.
Consequence (Use the
consequence assigned in Part
A section 3)
Likelihood of Pollution From This Source
(Refer to table 2 of instructions for further definitions of likelihood) Rare
(May occur only in
exceptional circumstances e.g. >5 years)
Unlikely
(Unlikely to occur but
could occur at least once
within a 5 year period)
Possible
(Might occur at least once or twice per
bathing season)
Likely
(Will probably occur at least
3 – 4 times per bathing
season)
Almost Certain
(Will occur on a regular basis
e.g. once a week)
Minor Very Low risk
Very Low risk
Low risk Low risk Moderate risk
Moderate Very Low risk
Low risk Low risk Moderate risk
High risk
Major Low risk Low risk Moderate risk
High risk Very High risk
From your knowledge of the recreational water body, do you believe the above risk classification is a true representation of this risk? Yes No If No, justify answer and provide suggested reassigned risk classification (Use table 5 of the Sanitary Inspection Report Instructions for guidance where historical enterococci data is available):
3.4 Wastewater Reuse
Are there areas where reuse of wastewater occurs within a 100m radius of the recreational water body? (e.g. To irrigate local parks and gardens) Yes No Is wastewater treated (e.g. chlorination) prior to application? Yes No

136
How far is the wastewater reuse area from the recreational water body? ___________ Using the table below, to what degree is water quality at the bathing site affected, or likely to be affected by contamination from nearby wastewater reuse application? (Consider the distance from water body) Circle the appropriate risk classification by aligning the most suitable likelihood of pollution with the corresponding consequence.
Consequence (Use the
consequence assigned in Part
A section 3)
Likelihood of Pollution From This Source
(Refer to table 2 of instructions for further definitions of likelihood) Rare
(May occur only in
exceptional circumstances e.g. >5 years)
Unlikely
(Unlikely to occur but
could occur at least once
within a 5 year period)
Possible
(Might occur at least once or twice per
bathing season)
Likely
(Will probably occur at least
3 – 4 times per bathing
season)
Almost Certain
(Will occur on a regular basis
e.g. once a week)
Minor Very Low risk
Very Low risk
Low risk Low risk Moderate risk
Moderate Very Low risk
Low risk Low risk Moderate risk
High risk
Major Low risk Low risk Moderate risk
High risk Very High risk
From your knowledge of the recreational water body, do you believe the above risk classification is a true representation of this risk? Yes No If No, justify answer and provide suggested reassigned risk classification (Use table 5 of the Sanitary Inspection Report Instructions for guidance where historical enterococci data is available):
List the highest ranked risk classification from section 3.1, 3.3 and 3.4:
5. Rainfall and Polluted Runoff (Wet weather during and following summer rainfall events) Does rainfall trigger microbiological contamination? Yes No Unsure (If unsure investigate further) If no refer to section 6 Has monitoring for bacterial indicators (at the recreational water body) following rainfall events been undertaken to confirm the above? Yes No If no it is recommended monitoring during and following rainfall events is undertaken If yes, provide details of monitoring (Sampling results collected from the recreational water body during rainfall events):
If yes, using the table below (where appropriate), at what volume of rainfall is enterococci detected in the recreational water body? (Use the highest enterococci value detected in samples following high volumes of rainfall (preferably >20mm) collected from the recreational water body, not the drain)
Rainfall Enterococci levels (cfu/100ml)

137
Table based on Table 5.7 of the 2006 NHMRC Guidelines
(mm) 0-40 40-200 201-500 >501 0- 9mm Very Low Low Moderate High
10- 20mm Very Low Low Moderate High >20mm Very Low Low Moderate High
From your knowledge of the recreational water body, do you believe the above risk classification is a true representation of this risk? Yes No If No, justify answer and provide suggested reassigned risk classification (Use table 5 of the Sanitary Inspection Report Instructions for guidance where historical enterococci data is available):
What period of time following a summer rainfall event (e.g. >10mm) is the recreational water body considered to be unsuitable for whole of body contact activities (e.g. swimming)? (If unknown use 24 hrs for ocean water and 72 hours for freshwater) 0 hours 12 hours 24 hours 48 hours 72 hours other _______ Are bather numbers dramatically reduced during and following rainfall? Yes No Are permanent or temporary warning signs used to advise people not to swim following a summer rainfall event?
Yes No If yes, provide details:
List the assigned risk classification:
6. Riverine Discharge (Do rivers, streams or other tributaries enter into the recreational water body) 6.1 General Riverine Discharge Do rivers, streams or other tributaries flow into or within a 1 km radius of the recreational water body? (1km is an approximation and can be increased or decreased depending on the nature of the recreational water body) Yes No If no refer to section 7 If yes, provide details of riverine location(s) on a MAP What pollutant sources discharge (or potentially discharge) into the riverine system? (Excluding sewage outfalls referred to in Part A Section 3.1)
Stormwater Leaching from on-site wastewater systems Surface run-off Agricultural runoff
Other __________________ When is pollution from these sources likely to present a problem? Dry weather Wet weather Both
None Using the table below, to what degree is water quality at the recreational water body

138
affected, or likely to be affected by pollution from these riverine sources? Circle the appropriate risk classification by aligning the most suitable likelihood of pollution with the corresponding consequence.
Consequence (Use the
consequence assigned in Part
A section 3)
Likelihood of Pollution From This Source
(Refer to table 2 of instructions for further definitions of likelihood) Rare
(May occur only in
exceptional circumstances e.g. >5 years)
Unlikely
(Unlikely to occur but
could occur at least once within a 5
year period)
Possible
(Might occur at least once or twice per
bathing season)
Likely
(Will probably occur at least 3 – 4 times per
bathing season)
Almost Certain
(Will occur on a regular basis e.g. once a
week)
Minor Very Low risk
Very Low risk
Low risk Low risk Moderate risk
Moderate Very Low risk
Low risk Low risk Moderate risk
High risk
Major Low risk Low risk Moderate risk
High risk Very High risk
From your knowledge of the recreational water body, do you believe the above risk classification is a true representation of this risk? Yes No If No, justify answer and provide suggested reassigned risk classification (Use table 5 of the Sanitary Inspection Report Instructions for guidance where historical enterococci data is available):
6.2 Sewage Contamination Do sewage outfalls discharge into these rivers/streams/tributaries? Yes No If no refer to section 7 If yes, when do riverine discharges present a problem? Dry weather Wet weather None Has monitoring for bacterial indicators from these rivers/streams/tributaries been undertaken to assess microbiological contamination? Yes No If yes, provide details of monitoring: (Results during dry and wet weather)
Using the table below to what degree is water quality at the recreational water body affected, or likely to be affected by contamination from riverine discharges where sewage is discharged into the riverine system? Circle the appropriate risk classification by aligning the most suitable likelihood of pollution with the corresponding consequence.

139
Source: Table adopted from Table 5.11 from the NHMRC Guidelines
a The population factor includes, in principle, all the population upstream from the recreational water area
b Stream flow of primary concern is the lowest typical flow during the bathing season
c Additional investigations recommended to account for the likely lack of prediction with faecal organisms
Population and Flow Characteristics a,b
Treatment Level
None Primary Secondary Secondary with
Disinfection c
High Population with low river flow Very high Very high High Low Low population with low river flow Very high High Moderate Very low Medium population with medium river flow High Moderate Low Very low
High population with high river flow High Moderate Low Very low Low population with high river flow High Moderate Very low Very low
From your knowledge of the recreational water body, do you believe the above risk classification is a true representation of this risk? Yes No If No, justify answer and provide suggested reassigned risk classification (Use table 5 of the Sanitary Inspection Report Instructions for guidance where historical enterococci data is available):
List the highest ranked risk classification from section 6.1 and 6.2:
7. Boats Are boats/vessels located in the immediate area? Yes No If no refer to section 8
Marina Permanent boat moorings Jetty Boat ramp Harbour Temporary boat moorings Ferry Berth Anchorage
ATTACH MAP detailing boat mooring locations. How far is the nearest boat/vessel located from the recreational water body? What is the maximum number of boats/vessels that area likely to be anchored/moored at any given time? (In reasonable proximity to recreational water body):___________________________________________________________________ Are pump out facilities provided for boat wastes? Yes No If No, how are boat wastes disposed of?
Have any complaints of boat discharges been recorded? Yes No If yes, provide details:

140
Are onshore toilet facilities provided for boat owners? Yes No Has monitoring been undertaken to determine the impact of boat discharges on the recreational water body?
Yes No If yes, provide details:
Using the table below, to what degree is water quality at the recreational water body affected, or likely to be affected by pollution from boat discharge? (Considering the number of boats, historical enterococci data, recorded illnesses, pump out facilities available) Circle the appropriate risk classification by aligning the most suitable likelihood of pollution with the corresponding consequence.
Consequence (Use the
consequence assigned in Part
A section 3)
Likelihood of Pollution From This Source
(Refer to table 2 for further definitions of likelihood) Rare
(May occur only in
exceptional circumstances e.g. >5 years)
Unlikely
(Unlikely to occur but
could occur at least once
within a 5 year period)
Possible
(Might occur at least once or twice per
bathing season)
Likely
(Will probably occur at least
3 – 4 times per bathing
season)
Almost Certain
(Will occur on a regular basis
e.g. once a week)
Minor Very Low risk
Very Low risk
Low risk Low risk Moderate risk
Moderate Very Low risk
Low risk Low risk Moderate risk
High risk
Major Low risk Low risk Moderate risk
High risk Very High risk
From your knowledge of the recreational water body, do you believe the above risk classification is a true representation of this risk? Yes No If No, justify answer and provide suggested reassigned risk classification (Use table 5 of the Sanitary Inspection Report Instructions for guidance where historical enterococci data is available):
List the assigned risk classification:
8. Animals 8.1 Wildlife (not including domestic animals)
Are the following wildlife present at the site? Aquatic birds (e.g. including ducks, geese, seagulls, swans) Other (e.g. kangaroos, parrots) _____________ None If none refer to section 8.2 Comment (Provide details of anything significant concerning wildlife e.g. popular duck

141
feeding area, migratory birds)
If present, describe the density of the local aquatic bird population:
Low (<5 birds on any occasion) Medium (5-20 birds on any occasion) High (>20 birds on any occasion) Are structures (e.g. jetties, bridges, trees) present to promote birds (e.g. pigeons, parrots) nesting/roosting close to the water body? Yes No If yes, provide details: Using the table below, to what degree is water quality at the recreational water body affected, or likely to be affected by faecal pollution from wildlife? Circle the appropriate risk classification by aligning the most suitable likelihood of pollution with the corresponding consequence.
Note: Table modified due to decrease in potential public health risk that aquatic birds etc. may present to humans.
Consequence (Use the
consequence assigned in Part
A section.3)
Likelihood of Pollution From This Source
(Refer to table 2 for further definitions of likelihood) Rare
(May occur only in
exceptional circumstances e.g. >5 years)
Unlikely
(Unlikely to occur but
could occur at least once
within a 5 year period)
Possible
(Might occur at least once or twice per
bathing season)
Likely
(Will probably occur at least
3 – 4 times per bathing
season)
Almost Certain
(Will occur on a regular basis
e.g. once a week)
Minor Very Low risk
Very Low risk
Very Low risk
Very Low risk
Low risk
Moderate Very Low risk
Very Low risk
Very Low risk
Low risk Moderate risk
Major Very Low risk
Very Low risk
Low risk Moderate risk
Moderate risk
From your knowledge of the recreational water body, do you believe the above risk classification is a true representation of this risk? Yes No If No, justify answer and provide suggested reassigned risk classification (Use table 5 of the Sanitary Inspection Report Instructions for guidance where historical enterococci data is available):
8.2 Domestic Animals Is the area used as an animal exercise site? (Includes areas where domestic animals are commonly exercised even if not permitted) Yes No If no refer to section 8.3 If yes, what types of animals? dogs horses other _________________ Are dog waste bags supplied?
Yes No Do animals directly access the recreational water body? Yes No

142
Is the area regularly cleaned and maintained to reduce the amount of animal faeces along the shoreline of the recreational water body? Yes No
Using the table below, to what degree is water quality at the recreational water body affected, or likely to be affected by faecal pollution from domestic animals? Circle the appropriate risk classification by aligning the most suitable likelihood of pollution with the corresponding consequence.
Note: Table modified due to decrease in potential public health risk that domestic animals etc. may present to humans.
Consequence (Use the
consequence assigned in Part
A section 3)
Likelihood of Pollution From This Source
(Refer to table 2 of instructions for further definitions of likelihood) Rare
(May occur only in
exceptional circumstances e.g. >5 years)
Unlikely
(Unlikely to occur but
could occur at least once
within a 5 year period)
Possible
(Might occur at least once or twice per
bathing season)
Likely
(Will probably occur at least
3 – 4 times per bathing
season)
Almost Certain
(Will occur on a regular basis
e.g. once a week)
Minor Very Low risk
Very Low risk
Very Low risk
Very Low risk
Low risk
Moderate Very Low risk
Very Low risk
Very Low risk
Low risk Moderate risk
Major Very Low risk
Very Low risk
Low risk Moderate risk
Moderate risk
From your knowledge of the recreational water body, do you believe the above risk classification is a true representation of this risk? Yes No If No, justify answer and provide suggested reassigned risk classification (Use table 5 of the Sanitary Inspection Report Instructions for guidance where historical enterococci data is available):
8.3 Agricultural Animals
Are any of the following agricultural animals located within the catchment (as identified in Part A section 2.2)?
Poultry Cattle Pigs Sheep Other _________ None If none refer to section 9 Have any waste containment dams and their discharge points (e.g. piggery or dairy waste holding dams) been identified?
Yes No (ATTACH LOCATIONS ON MAP) If yes, provide details:
Can agricultural animals directly access the water? Yes No If yes, provide details: (Access points, times of access)

143
Using the table below, to what degree is water quality at the recreational water body affected, or likely to be affected by faecal pollution from agricultural animals in the immediate catchments, and potential run-off of untreated animal effluent (e.g. dairying, piggeries) into the recreational water body?* Circle the appropriate risk classification by aligning the most suitable likelihood of pollution with the corresponding consequence.
Consequence (Use the
consequence assigned in Part
A section.3)
Likelihood of Pollution From This Source
(Refer to table 2 of instructions for further definitions of likelihood) Rare
(May occur only in
exceptional circumstances e.g. >5 years)
Unlikely
(Unlikely to occur but
could occur at least once
within a 5 year period)
Possible
(Might occur at least once or twice per
bathing season)
Likely
(Will probably occur at least
3 – 4 times per bathing
season)
Almost Certain
(Will occur on a regular basis
e.g. once a week)
Minor Very Low risk
Very Low risk
Low risk Low risk Moderate risk
Moderate Very Low risk
Low risk Low risk Moderate risk
High risk
Major Low risk Low risk Moderate risk
High risk Very High risk
From your knowledge of the recreational water body, do you believe the above risk classification is a true representation of this risk? Yes No If No, justify answer and provide suggested reassigned risk classification (Use table 5 of the Sanitary Inspection Report Instructions for guidance where historical enterococci data is available):
When does runoff from agricultural animals present a risk? Both dry and wet weather Wet weather
None
*Note: If runoff only presents a risk during and following wet weather, this risk should only be used to calculate the sanitary inspection category for wet weather. List the highest ranked risk classification from animal sources (Note: Where sources identified in section 8.3 only present a risk during or following wet weather this risk classification is only to be included in the wet weather sanitary inspection category as per Part D Section 1): Section 8.1 & 8.2: Section 8.3:
9. Other Faecal Sources Provide details of any other faecal sources that are likely to impact on the recreational water body:
Using the table below, to what degree is water quality at the recreational water body affected, or likely to be affected by pollution from this source(s)? Circle the appropriate

144
risk classification by aligning the most suitable likelihood of pollution with the corresponding consequence.
Consequence (Use the
consequence assigned in Part
A section.3)
Likelihood of Pollution From This Source
(Refer to table 2 for further definitions of likelihood) Rare
(May occur only in
exceptional circumstances e.g. >5 years)
Unlikely
(Unlikely to occur but
could occur at least once
within a 5 year period)
Possible
(Might occur at least once or twice per
bathing season)
Likely
(Will probably occur at least
3 – 4 times per bathing
season)
Almost Certain
(Will occur on a regular basis
e.g. once a week)
Minor Very Low risk
Very Low risk
Low risk Low risk Moderate risk
Moderate Very Low risk
Low risk Low risk Moderate risk
High risk
Major Low risk Low risk Moderate risk
High risk Very High risk
From your knowledge of the recreational water body, do you believe the above risk classification is a true representation of this risk? Yes No If No, justify answer and provide suggested reassigned risk classification (Use table 5 of the Sanitary Inspection Report Instructions for guidance where historical enterococci data is available):
List the assigned risk classification:
PART C: MANAGEMENT 1. Management Are any of the following management controls in place to warn people of microbiological risks during high risk periods (e.g. following heavy rainfall)? If none refer to Part D
Permeant on site signage Media releases Website Temporary on site signage Beach closures other
_______________

145
Provide specific details of advisories:
Do management controls referred to above effectively prevent people from accessing the water during high risk periods?
Yes No Unsure If yes, justify evidence to prove this (e.g. Follow-up inspections during high risk periods indicate minimal water users):
Does the responsible authority have a management response plan to deal with exceptional water contamination events such as sewage overflows? Yes No
If yes, provide details:
PART D: Sanitary Inspection Category (SIC) 1. Sanitary Inspection Category (SIC) Fill in the corresponding risk classifications for each pollutant source identified throughout the sanitary inspection report. Where a particular sources is not present write N/A.
SOURCE
(Part B)
Risk Classification
(Use the
SOURCE
(Part B)
Risk Classification
(Use the highest risk classification identified for

146
highest risk classification identified for each section under Part B)
each section under Part B)
1. Toilet Facilities 6. Riverine discharge
2. Bather Density 7. Boats
3. Discharge of Wastewater 8. Animals
4. Stormwater discharge 9. Other
5. Rainfall
1.1 Dry Weather Sanitary Inspection Category (SIC)
List the highest ranked risk classification identified from the above table from Part B sections 1, 2, 3, 6, 7, 8 and 9. Remember to exclude Part B section 8.3 where agricultural runoff only presents a risk during wet weather):
Dry Weather Sanitary Inspection Category: _______________________
1.2 Wet Weather Sanitary Inspection Category (SIC)
List the highest ranked risk classification identified from the above table from Part B sections 1, 2, 3, 4, 5, 6, 7, 8, and 9):
Wet Weather Sanitary Inspection Category: _______________________
1.3 Effectiveness of Management Controls
Do management controls effectively prevent people from accessing the water during and following wet weather events? Yes No
If no, the wet weather sanitary inspection category identified above (1.2) should be accepted as the assigned sanitary inspection category.
If yes, the dry weather sanitary inspection category identified above (1.1) should be accepted as the assigned sanitary inspection category. Assigned Sanitary Inspection Category:
2: Actions/Further Investigation What actions/further investigations are required to provide additional evidence to demonstrate microbial water quality for the recreational water body?

147
Appendix 6: Sanitary Inspection
Report Form (final version)

148

149
SANITARY INSPECTION REPORT FORM
PART A: DEFINE THE CATCHMENT AND RECREATIONAL WATER BODY This section is used to describe the sampling site, the catchment surrounding the recreational water body and the types of activities and people who use the bathing area. 1. SITE IDENTIFICATION Type of site: Estuarine Coastal Freshwater Other: Name of site: Address of site: Authority responsible for managing site: Site Reference No.: Sample Site(s) Description (Use key landmarks to describe the exact location where the sample(s) is collected): Sample Site(s) Global Positioning Coordinates (The exact location where sample(s) is collected): Date of SI: Name of person completing SI: Has a previous sanitary inspection category (SIC) been assigned? Yes No If yes, provide details (category, date of completion, references): 2. PHYSICAL CHARACTERISTICS OF THE RECREATIONAL WATER BODY 2.1 Recreational Water Body Is there a sandy beach area to access the water? Yes No Define the approximate dimensions of the area of water used for bathing: Length (m): Mean Width (m): Area (m2): Describe the immediate area e.g. trees along shoreline, reeds along river banks, reef, jetty: What level of dilution (e.g. mixing/flushing) occurs in the water?
Medium to high (level of flushing and turn over of water, medium to high tidal movement) Low (level of flushing and turn over of water, low tidal movement)
Provide any further comments on dilution/flushing (as appropriate): 2.2 Land Use and Geography Estimate using percentage values (%), the land use and geography of the catchment within a 2km radius of sampling site: % Residential % Commercial % Industrial % Parks, reserve, bush land % Road/rail % Agricultural % Other (specify)

150
Are car parking bays provided in the immediate area (approx 200m radius from site)? Yes No
If yes, approximately how many bays? Are BBQ facilities provided in the immediate area (approx 200m radius from site)? Yes No Are rubbish bins provided in the immediate area (approx 200m radius from site)? Yes No ATTACH MAPS, AERIAL PHOTOGRAPHS and OTHER PHOTOGRAPHS detailing physical characteristics and land use (of the immediate and surrounding areas) within a 2km radius of the recreational water body. Include on the map and aerial photographs:
Sample point(s) Identified pollutant sources e.g. stormwater drains, wastewater outfall Sewer v’s on-site wastewater system areas Boating areas Marinas / groins Toilet facilities Land use area e.g. highlight residential areas, agricultural activities, piggeries Key buildings e.g. restaurants, Bathing/swimming area Car parks Parks and gardens / playgrounds Riverine discharge areas.3 Recreational Water Usage
What recreational activities occur in the recreational water body? Swimming Water skiing Jet-skiing Fishing Canoeing/kayaking Boating Other (specify): What groups recreate in the recreational water body:
Mainly young children (<7 years of age) Mainly older children (7-18 years of age) Mainly adults (>18-60 years of age) Mainly elderly groups (>60 years) A mixture of age groups
Is the water body a popular tourist destination and/or bathing area? Yes No Unsure Is the water used for swimming classes? Yes No Unsure If yes, who conducts the classes and when do classes usually take place (times, months)? Is the water subject to above average bather use during peak times such as summer/school holidays? (e.g. do more people tend to use the water during the summer/school holiday period)
Yes No Estimate the number of bathers using the water on weekends and weekdays (e.g. 500 to 1000 bathers, or 0 to 50 bathers on the weekend, check lifeguard statistics if available): Approximate to bathers per day on the weekend Approximate to bathers per weekday (non-holiday period) Approximate to bathers per weekday (holidays period) Do surf or water conditions regularly deter people from entering the water? Yes No On some occasions (specify): Are lifeguard services provided for this site? Yes No If yes, weekends weekdays both Have complaints of recreational water illnesses been recorded from this site? Yes No
Unsure

151
If yes, provide details: 3. PUBLIC HEALTH CONSEQUENCE OF A POLLUTION EVENT OCCURING AT THE SITE This section must be filled out before proceeding to Part B. The table below is used to determine the appropriate “consequence” that best describes the level of public health impact that a pollution event at the recreational water body may present. The best fitting consequence is to be used when applying all likelihood /consequence tables in Part B.
Using the table below, in the “Description” column tick the boxes that best describes the recreational use of the water body. The row with the most ticks will correspond to the most suitable “Consequence”. Only choose one consequence that best suits the location. Source: Table Adapted from HB 436:2004 and 2004 DEC (NSW) This assigned consequence is to be used for ALL likelihood /consequence tables throughout Part B.
Description (Tick appropriate boxes from only one consequence that best suits the recreational water body. NOTE: Not all boxes need to be ticked)
Consequence (Circle the most suitable consequence that best fits the description of the site)
Location of minimal importance to local economy Location rarely used on weekdays Location occasionally used on weekends or holidays Few people enter the water Location not popular with children or the elderly
Minor
Location of some importance to the local economy (e.g. tourism)
Location occasionally used on weekdays (e.g. <100 people per day for non-holiday period)
Location frequently used on weekends or holidays Some or most people enter the water Location can be popular with children or the elderly
Moderate
Location of great importance to the local economy (e.g. tourism, water activities, world heritage site)
Serious media attention /community outcry Location frequently used on weekdays, weekends and holidays Most people enter the water Location very popular with children or the elderly
Major
Assigned Consequence:

152
PART B: SOURCES OF FAECAL POLLUTION This section is used to assign a sanitary inspection risk classification to common faecal pollution sources that may impact on the recreational water body including:
1. Bather density 2. Bather toilet facilities 3. Discharges of wastewater (human effluent sources) 4. Stormwater discharge 5. Rainfall runoff following summer rainfall events 6. Riverine discharge (from rivers, streams or other tributaries) 7. Boats 8. Animals 9. Other
If any of these pollution sources have not been identified at the water body tick ‘no’ and refer to the next section. 1. BATHER DENSITY Bather density refers to the number of people using the water, particularly during peak usage times. Tick the risk classification below which best describes bather density during peak usage times (e.g. High density: 100 or more people during peak times, Low density: <100 people during peak times) compared to the level of dilution (e.g. high or low mixing/flushing) of the water. Use the bather density and dilution rate referred to in Part A Section 2.1 & 2.3).
Bather density v’s level of dilution Risk classification Low bather density medium to high dilution Very Low risk Medium to high bather density medium to high dilution Low risk
Low bather density low dilution Low risk Medium to high bather density low dilution Moderate risk
Table adapted from: NHMRC 2008 pg 83 Comment: (Where available, provide details of any monitoring that has been undertaken to confirm bather impact on water quality) From your knowledge of the recreational water body, do you believe the above risk classification is an accurate representation of this risk? Yes No If yes, this is your assigned risk classification for bather density. If No, justify answer (Use table 5 of the Sanitary Inspection Report Instructions for guidance where historical enterococci data is available): If No, what risk classification would you assign?
Risk classification for bather density:
Use answer for Part D

153
2. BATHER TOILET FACILITIES Are toilet facilities available for bather use in the immediate area (approx 100m)?
Yes No If no refer to section 3 Approximately how far (in metres) are the toilets located from the water body? metres Total no. of toilets: Total no. of showers: What type of sewerage system is used? On-site wastewater system (e.g. septic tank) Sewer If an on-site wastewater system is used, how often are they pumped out and/or serviced? Have any discharges, leakages or odours been recorded from the sewerage system? Yes No Unsure (If unsure investigate further) If yes provide details: Using the table below, to what degree is water quality at the bathing site affected, or likely to be affected by faecal pollution from the toilets? (Consider the distance of the toilets from water body, type of wastewater disposal) Tick the appropriate risk classification by aligning the most suitable likelihood of pollution with the corresponding consequence assigned in part A section 3.
From your knowledge of the recreational water body, do you believe the above risk classification is an accurate representation of this risk? Yes No If yes, this is the assigned risk classification for bather toilet facilities. If No, justify answer (Use table 5 of the Sanitary Inspection Report Instructions for guidance where historical enterococci data is available): If No, what risk classification would you assign?
Consequence (Use the
consequence assigned in Part
A section 3)
Likelihood of Pollution From This Source (Refer to table 2 of SI instructions for further definitions of likelihood) Rare
(May occur only in exceptional circumstances e.g. >5 years)
Unlikely (Unlikely to
occur but could occur at least
once within a 5 year period)
Possible (Might occur at least once or
twice per bathing season)
Likely (Will probably
occur at least 3 – 4 times per
bathing season)
Almost Certain
(Will occur on a regular basis e.g.
once a week)
Minor Very Low risk
Very Low risk
Low risk Low risk Moderate risk
Moderate Very Low risk
Low risk Low risk Moderate risk
High risk
Major Low risk Low risk Moderate risk
High risk Very High risk
Risk classification for bather toilet facilities:
Use answer for Part D

154
3. DISCHARGES OF WASTEWATER (HUMAN SEWAGE SOURCES) This section refers to human wastewater sources. Stormwater pollution is covered in part B section 4. 3.1 Wastewater outfalls from treatment plant (also known as sewage outfalls) Are any wastewater outfalls located within a 2km radius of the site? Yes No If no refer to section 3.2 If yes, outfall name: Global Positioning Coordinates: Approx how far does the outfall (pipe) discharge into the water? What type of outfall discharge is used:
Direct (Discharges directly to recreational water body or adjacent area) Short (Discharges within inter-tidal zone ~15m from foreshore, significant probability of sewage plume
reaching recreational water body) Long/effective (Discharges several kilometers offshore, sufficient length and depth to ensure low
probability of sewage plume reaching recreational water body) What type of treatment is used to treat the wastewater:
No treatment (raw sewage) Preliminary (filtration with milli- or micro-screens) Primary (physical sedimentation) Secondary (primary + trickling filter/activated sludge) Secondary + disinfection (primary + trickling filter/activated sludge + disinfection)
Tertiary (secondary + coagulation-sand filtration)
Tertiary + disinfection (secondary + coagulation-sand filtration + disinfection) Lagoons (low-rate biological treatment)
Attach specific details of the type of wastewater treatment and MAP of outfall schematics and location. Where available ATTACH CHARTS detailing ocean/river currents and tides. Approx how far is the outfall located from the area people are swimming? What is the wastewater treatment plant discharge rate/day?
Is wastewater discharged at the outfall monitored regularly for microbiological quality? Yes
No If yes, provide details on monitoring program (List program name, responsible authority, overview of monitoring results): Have any signs of sewage pollution been reported at the recreational water body? Yes No If yes, provide details: Using the table below, tick the appropriate wastewater outfall risk classification by aligning the type of outfall with the treatment applied:
Type of Treatment
Type of Outfall Direct Short Long/effective
No treatment Very High High NOT APPLICABLE Preliminary Very High High Low Primary Very High High Low Secondary High High Low Secondary + disinfection Moderate Moderate Very Low Tertiary Moderate Moderate Very Low Tertiary + disinfection Very Low Very Low Very Low Lagoons High High Low
Source: Table adapted from WHO Monitoring Bathing Waters – A Practical Guide to the Design and Implementation of Assessments and Monitoring Programmes

155
From your knowledge of the recreational water body, do you believe the above risk classification is an accurate representation of this risk? Yes No If yes, this is the assigned risk classification for the wastewater outfall. If No, justify answer (Use table 5 of the Sanitary Inspection Report Instructions for guidance where historical enterococci data is available): If No, what risk classification would you assign? 3.2 Sewerage System Pumping Stations Are pumping stations located within a 1km radius of the site? (1km is an approximate estimation and can be increased or decreased depending on the catchment) Yes No If no refer to section 3.3 If yes, provide pump station location(s) and ATTACH MAP detailing locations: Are pump station(s) fitted with emergency overflow alarms? (Confirm with appropriate agency)
Yes No Comment (Last time alarms checked for compliance): In the event that pumping station overflow alarms fail, where will wastewater be diverted (e.g. into stormwater system, retention basin)? Using the table below, to what degree is water quality at the bathing site affected, or likely to be affected by contamination from a sewerage pumping station? (Consider the distance from water body) Tick the appropriate risk classification by aligning the most suitable likelihood of pollution with the corresponding consequence assigned in part A section 3.
From your knowledge of the recreational water body, do you believe the above risk classification is an accurate representation of this risk? Yes No If yes, this is the assigned risk classification for sewerage pumping stations. If
Consequence (Use the
consequence assigned in Part
A section 3)
Likelihood of Pollution From This Source (Refer to table 2 of SI instructions for further definitions of likelihood) Rare
(May occur only in exceptional circumstances e.g. >5 years)
Unlikely (Unlikely to
occur but could occur at least
once within a 5 year period)
Possible (Might occur at least once or
twice per bathing season)
Likely (Will probably
occur at least 3 – 4 times per
bathing season)
Almost Certain
(Will occur on a regular basis e.g.
once a week)
Minor Very Low risk
Very Low risk
Low risk Low risk Moderate risk
Moderate Very Low risk
Low risk Low risk Moderate risk
High risk
Major Low risk Low risk Moderate risk
High risk Very High risk
Risk classification for wastewater outfall:

156
No, justify answer (Use table 5 of the Sanitary Inspection Report Instructions for guidance where historical enterococci data is available): If No, what risk classification would you assign? 3.3 On-Site Wastewater Systems e.g. septic tanks, aerobic treatment units Are surrounding properties using on-site wastewater systems? (Look at a distance of at least a 100m radius from the recreational water body) Yes No If no refer to section 3.4 If yes, ATTACH MAP detailing approximate on-site system locations How far is the nearest on-site disposal system from the recreational water body (not including onsite toilet facilities discussed in Part B.2)? Have specific investigations been undertaken to determine whether on-site wastewater systems are contributing to faecal pollution of the recreational water body (e.g. groundwater flow)? Yes
No Unsure If yes, provide details: Using the table below, to what degree is water quality at the bathing site affected, or likely to be affected by contamination from on-site wastewater systems? (Consider the distance from water body) Tick the appropriate risk classification by aligning the most suitable likelihood of pollution with the corresponding consequence assigned in part A section 3.
From your knowledge of the recreational water body, do you believe the above risk classification is an accurate representation of this risk? Yes No If yes, this is the assigned risk classification for on-site wastewater systems. If No, justify answer (Use table 5 of the Sanitary Inspection Report Instructions for guidance where historical enterococci data is available): If No, what risk classification would you assign?
Consequence (Use the
consequence assigned in Part
A section 3)
Likelihood of Pollution From This Source (Refer to table 2 of SI instructions for further definitions of likelihood) Rare
(May occur only in exceptional circumstances e.g. >5 years)
Unlikely (Unlikely to
occur but could occur at least
once within a 5 year period)
Possible (Might occur at least once or
twice per bathing season)
Likely (Will probably
occur at least 3 – 4 times per
bathing season)
Almost Certain
(Will occur on a regular basis e.g.
once a week)
Minor Very Low risk
Very Low risk
Low risk Low risk Moderate risk
Moderate Very Low risk
Low risk Low risk Moderate risk
High risk
Major Low risk Low risk Moderate risk
High risk Very High risk
Risk classification for on-site wastewater systems:
Risk classification for sewerage system pumping stations:

157
3.4 Wastewater Reuse Are there areas where reuse of wastewater occurs within a 100m radius of the recreational water body? (e.g. To irrigate local parks and gardens) Yes No If no fill out highest ranked risk classification for section 3 Is wastewater treated (e.g. chlorination) prior to application? Yes No How far (in metres) is the wastewater reuse area from the recreational water body? Using the table below, to what degree is water quality at the bathing site affected, or likely to be affected by contamination from nearby wastewater reuse application? (Consider the distance from water body) Tick the appropriate risk classification by aligning the most suitable likelihood of pollution with the corresponding consequence assigned in part A section 3.
From your knowledge of the recreational water body, do you believe the above risk classification is an accurate representation of this risk? Yes No If yes, this is the assigned risk classification for wastewater reuse. If No, justify answer (Use table 5 of the Sanitary Inspection Report Instructions for guidance where historical enterococci data is available): If No, what risk classification would you assign?
Based on all discharges of wastewater identified in sections 3.1, 3.2, 3.3 and 3.4 you need to rank the overall highest assigned risk classification. Type N/A if the risk classification does not apply.
Consequence (Use the
consequence assigned in Part
A section 3)
Likelihood of Pollution From This Source (Refer to table 2 of SI instructions for further definitions of likelihood) Rare
(May occur only in exceptional circumstances e.g. >5 years)
Unlikely (Unlikely to
occur but could occur at least
once within a 5 year period)
Possible (Might occur at least once or
twice per bathing season)
Likely (Will probably
occur at least 3 – 4 times per
bathing season)
Almost Certain
(Will occur on a regular basis e.g.
once a week)
Minor Very Low risk
Very Low risk
Low risk Low risk Moderate risk
Moderate Very Low risk
Low risk Low risk Moderate risk
High risk
Major Low risk Low risk Moderate risk
High risk Very High risk
Risk classification for wastewater reuse:
Highest ranked risk classification for discharges of wastewater - 3.1, 3.2, 3.3 & 3.4:
Use answer for Part D

158
4. STORMWATER DISCHARGE Do stormwater drains discharge into the recreational water body? Yes No (Look at a distance of at least a 500m radius either side of the sampling site. 500m is a general approximation and can be increased, or decreased depending on the nature of the recreational water body) If no refer to section 5 If yes, ATTACH MAP detailing stormwater discharge locations DRAIN 1 Drain site description: Global Positioning Coordinates: Agency responsible for management of stormwater drain: What type of area does the drain discharge from:
Urban - Main drain (High volume discharge from a large urban catchment area) Urban - Local (Medium volume discharge from surrounding carpark and roads) Bushland (Discharge from surrounding bushland/forested area including low use roads and
carpark) Rural/Agricultural (Medium volume discharge from rural, agricultural, pastures)
Is the drain piped or open? Piped Open Both Where does the drain discharge (refer to next page):
Swale/dune discharge (Stormwater does not flow directly into the recreational water body. The stormwater is either taken up by vegetation, held in the sand or infiltrates through to the groundwater via deep percolation. Deep percolation allows some of the stormwater to reach the water via groundwater flow; however, much of the contaminants will be filtered out before reaching the recreational water body)
Beach discharge (Stormwater flows over beach sand and into the water with some filtered into the beach sediment The drain should be located at least 10m from the recreational water body)
Direct discharge (Stormwater discharges directly into the recreational water body, with significant probability of plume reaching the area where people swim)
Effective discharge (Stormwater is discharged several metres offshore to minimise the impact on the recreational water body. The outlet should be located at least 50m offshore) How often does the drain flow? Following wet weather only Constantly (both in dry and wet weather conditions) Unsure (If unsure investigate further) Is the drain fitted with a pollutant trap? Yes No Unsure (If unsure investigate further) If yes, provide details: Describe possible faecal sources that may discharge into drain (e.g. drain subject to excess faecal load from agricultural area): Has any monitoring for bacterial indicators been undertake at the outlet? Yes No Unsure (If no or unsure investigate further) If yes, provide details of monitoring: Has the stormwater drain been inspected for the presence of illegal wastewater connections?
Yes No Unsure (If unsure investigate further) If yes, provide details: Have visible signs of stormwater pollution been recorded at the recreational water body? (Includes discoloured water, excess leaves, twigs, street litter, cigarette butts) Yes No
Unsure If yes, provide details:

159
Using the table below, tick the appropriate stormwater risk classification by aligning the type of stormwater drainage area with the area of discharge:
Table adapted from: Green, A. and Doucette, J. (2006) From your knowledge of the recreational water body, do you believe the above risk classification is an accurate representation of this risk? Yes No If yes, this is the assigned risk classification for drain 1. If No, justify answer (Use table 5 of the Sanitary Inspection Report Instructions for guidance where historical enterococci data is available): If No, what risk classification would you assign?
DRAIN 2: Drain site description: Global Positioning Coordinates: Agency responsible for management of stormwater drain: What type of area does the drain discharge from:
Urban - Main drain (High volume discharge from a large urban catchment area) Urban - Local (Medium volume discharge from surrounding carpark and roads) Bushland (Discharge from surrounding bushland/forested area including low use roads and
carpark) Rural/Agricultural (Medium volume discharge from rural, Agricultural, pastures)
Is the drain piped or open? Piped Open Both Where does the drain discharge:
Swale/dune discharge (Stormwater does not flow directly into the recreational water body. The stormwater is either taken up by vegetation, held in the sand or infiltrates through to the groundwater via deep percolation. Deep percolation allows some of the stormwater to reach the water via groundwater flow; however, much of the contaminants will be filtered out before reaching the recreational water body)
Beach discharge (Stormwater flows over beach sand and into the water with some filtered into the beach sediment The drain should be located at least 10m from the recreational water body)
Direct discharge (Stormwater discharges directly into the recreational water body, with significant probability of plume reaching the area where people swim)
Area of discharge
Type of stormwater drainage area
Urban Bushland
Rural/Agricultural Main drain Local
Swale/dune discharge Low Very Low Very Low Very Low Beach discharge Moderate Low Very Low Low Direct discharge High Moderate Low Moderate Effective discharge Low Low Very Low Low
Risk classification for drain 1:
Choose the most suitable description of the drain: 1. Drain flows constantly (during fine and sunny conditions and wet weather) 2. Drain flows only following wet weather conditions (e.g. rain)

160
Effective discharge (Stormwater is discharged several metres offshore to minimise the impact on the recreational water body. The outlet should be located at least 50m offshore) How often does the drain flow? Following wet weather only Constantly (both in dry and wet weather conditions) Unsure (If unsure investigate further) Is the drain fitted with a pollutant trap? Yes No Unsure (If unsure investigate further) If yes, provide details: Describe possible faecal sources that may discharge into drain (e.g. drain subject to excess faecal load from agricultural area): Has any monitoring for bacterial indicators been undertake at the outlet? Yes No Unsure (If no or unsure investigate further) If yes, provide details of monitoring: Has the stormwater drain been inspected for the presence of illegal wastewater connections?
Yes No Unsure (If unsure investigate further) If yes, provide details: Have visible signs of stormwater pollution been recorded at the recreational water body? (Includes discoloured water, excess leaves, twigs, street litter, cigarette butts) Yes No If yes, provide details: Using the table below, circle the appropriate stormwater risk classification by aligning the type of stormwater drainage area with the area of discharge:
Table adapted from: Green, A. and Doucette, J. (2006) From your knowledge of the recreational water body, do you believe the above risk classification is an accurate representation of this risk? Yes No If yes, this is the assigned risk classification for drain 1. If No, justify answer (Use table 5 of the Sanitary Inspection Report Instructions for guidance where historical enterococci data is available): If No, what risk classification would you assign?
Area of discharge
Type of stormwater drainage area
Urban Bushland
Rural/Agricultural Main drain Local
Swale/dune discharge Low Very Low Very Low Very Low
Beach discharge Moderate Low Very Low Low Direct discharge High Moderate Low Moderate Effective discharge Low Low Very Low Low
Risk classification for drain 2:

161
IF MORE THEN 2 DRAINS ARE IDENTIFIED CUT AND PASTE THE REQUIRED FIELDS AND INSERT TEXT HERE Based on the number of stormwater drains identified at the recreational water body, you need to
rank the overall highest risk classification from each drain. It is important to distinguish if the drain(s) flow constantly or only following wet weather (rain). If the drain flows constantly it may present a risk all the time. If the drain only flows following wet weather, it will generally only present a risk after it rains. Type N/A if the risk classification does not apply.
5. RAINFALL RUNOFF FOLLOWING SUMMER RAINFALL EVENTS This section is divided into two parts: 5.1 should be completed where water quality monitoring has been completed following rainfall events. 5.2 should be completed where no water quality monitoring is available following rainfall events. (5.1) Has monitoring for bacterial indicators (at the recreational water body) following rainfall events been undertaken to confirm if rainfall triggers bacterial contamination? Yes No Unsure If no or unsure it is recommended monitoring of the recreational water body following rainfall events is undertaken. Refer to 5.2 If yes, provide details of monitoring (Sampling results collected from the recreational water body following rainfall events): If yes, using the table below to what degree is water quality at the bathing site affected, or likely to be affected by contamination from rainfall runoff? Tick the appropriate risk classification by aligning the most suitable likelihood of pollution with the corresponding consequence assigned in part A section 3.
Choose the most suitable description of the drain: 1. Drain flows constantly (during fine and sunny conditions and wet weather) 2. Drain flows only following wet weather conditions (e.g. rain)
Highest ranked risk classification for: 2. Drain flows only following wet weather conditions (e.g. rain)
Use answer for PART D
Highest ranked risk classification for: 1. Drain(s) that flow constantly (during fine and sunny conditions and wet weather)
Use answer for PART D

162
From your knowledge of the recreational water body, do you believe the above risk classification is an accurate representation of this risk? Yes No If yes, this is the assigned risk classification for rainfall runoff. If No, justify answer (Use table 5 of the Sanitary Inspection Report Instructions for guidance where historical enterococci data is available): If No, what risk classification would you assign? (5.2) If no or unsure, until further monitoring has been undertaken circle one of the following provisional risk classifications for rainfall events based on the type of water body:
Type of water body Risk Classification
Ocean/estuarine water (avoid water 24 hours following rainfall)
Moderate risk
Freshwater (avoid water 72 hours following rainfall High risk
6. RIVERINE DISCHARGE (FROM RIVERS, STREAMS OR OTHER TRIBUTARIES) Do rivers, streams or other tributaries flow into or within a 2 km radius of the recreational water body? (2km is an approximation and can be increased or decreased depending on the nature of the recreational water body) Yes No If no refer to section 7 If yes, provide details of riverine location(s) on a MAP What pollutant sources discharge (or potentially discharge) into the riverine system?
Wastewater outfall Stormwater drains Leaching from on-site wastewater systems Surface run-off Agricultural runoff Other (specify): When is pollution from these sources likely to present a problem?
Dry weather Wet weather Both None Using the table below, to what degree is water quality at the bathing site affected, or likely to be affected by pollution from these riverine sources? Circle the appropriate risk classification by aligning the most suitable likelihood of pollution with the corresponding consequence assigned in part A section 3.
Consequence (Use the
consequence assigned in Part
A section 3)
Likelihood of Pollution From This Source (Refer to table 2 of SI instructions for further definitions of likelihood) Rare
(May occur only in exceptional circumstances e.g. >5 years)
Unlikely (Unlikely to
occur but could occur at least
once within a 5 year period)
Possible (Might occur at least once or
twice per bathing season)
Likely (Will probably
occur at least 3 – 4 times per
bathing season)
Almost Certain
(Will occur on a regular basis e.g.
once a week)
Minor Very Low risk
Very Low risk
Low risk Low risk Moderate risk
Moderate Very Low risk
Low risk Low risk Moderate risk
High risk
Major Low risk Low risk Moderate risk
High risk Very High risk
Highest ranked risk classification for rainfall runoff:
Use answer for Part D

163
From your knowledge of the recreational water body, do you believe the above risk classification is an accurate representation of this risk? Yes No If yes, this is the assigned risk classification for riverine discharge. If No, justify answer (Use table 5 of the Sanitary Inspection Report Instructions for guidance where historical enterococci data is available): If No, what risk classification would you assign?
7. BOATS Are boats/vessels located in the immediate area? Yes No If no refer to section 8 What boating facilities are provided (Tick all that apply)
Marina Harbour Permanent boat moorings Temporary boat moorings Jetty Boat ramp Ferry Berth Anchorage
ATTACH MAP detailing boat mooring locations. How far (in metres) is the nearest boat/vessel located from the bathing area? What is the maximum number of boats/vessels that are likely to be anchored/moored at any given time? (In reasonable proximity to recreational water body): Are pump out facilities provided for boat wastes? Yes No If No, how are boat toilet wastes generally disposed of? Have any complaints of boat discharges been recorded? Yes No Unsure If yes, provide details: Are onshore toilet facilities provided for boat owners? Yes No Has monitoring been undertaken to determine the impact of boat discharges on the recreational water body?
Yes No Unsure (If unsure investigate further) If yes, provide details: Using the table below, to what degree is water quality at the bathing site affected, or likely to be affected by pollution from boat discharge? (Considering the number of boats, historical enterococci data, recorded illnesses, pump out facilities available) Circle the appropriate risk classification by aligning the most suitable likelihood of pollution with the corresponding consequence assigned in part A section 3.
Consequence (Use the
consequence assigned in Part
A section 3)
Likelihood of Pollution From This Source (Refer to table 2 of SI instructions for further definitions of likelihood) Rare
(May occur only in exceptional circumstances e.g. >5 years)
Unlikely (Unlikely to
occur but could occur at least
once within a 5 year period)
Possible (Might occur at least once or
twice per bathing season)
Likely (Will probably
occur at least 3 – 4 times per
bathing season)
Almost Certain
(Will occur on a regular basis e.g.
once a week)
Minor Very Low risk
Very Low risk
Low risk Low risk Moderate risk
Moderate Very Low risk
Low risk Low risk Moderate risk
High risk
Major Low risk Low risk Moderate risk
High risk Very High risk
Risk classification for riverine discharge:
Use answer for Part D

164
From your knowledge of the recreational water body, do you believe the above risk classification is an accurate representation of this risk? Yes No If yes, this is the assigned risk classification for boats. If No, justify answer (Use table 5 of the Sanitary Inspection Report Instructions for guidance where historical enterococci data is available): If No, what risk classification would you assign?
8. ANIMALS 8.1 Wildlife (not including domestic animals) Are the following wildlife present in and around the recreational water body? (Tick all that apply):
Aquatic birds (e.g. including ducks, geese, seagulls, swans) Other (e.g. kangaroos, parrots) None If none refer to section 8.2
Comment (Provide details of anything significant concerning wildlife e.g. popular duck feeding area, migratory birds): If present, describe the density of the local aquatic bird population:
Low (<5 birds on any occasion) Medium (5-20 birds on any occasion) High (>20 birds on any occasion) Are structures (e.g. jetties, bridges, trees) present to promote birds (e.g. pigeons, parrots) nesting/roosting close to the water body? Yes No If yes, provide details: Using the table below, to what degree is water quality at the bathing site affected, or likely to be affected by faecal pollution from wildlife? Tick the appropriate risk classification by aligning the most suitable likelihood of pollution with the corresponding consequence assigned in part A section 3.
Consequence (Use the
consequence assigned in Part
A section 3)
Likelihood of Pollution From This Source (Refer to table 2 of SI instructions for further definitions of likelihood) Rare
(May occur only in exceptional circumstances e.g. >5 years)
Unlikely (Unlikely to
occur but could occur at least
once within a 5 year period)
Possible (Might occur at least once or
twice per bathing season)
Likely (Will probably
occur at least 3 – 4 times per
bathing season)
Almost Certain
(Will occur on a regular basis e.g.
once a week)
Minor Very Low risk
Very Low risk
Low risk Low risk Moderate risk
Moderate Very Low risk
Low risk Low risk Moderate risk
High risk
Major Low risk Low risk Moderate risk
High risk Very High risk
Risk classification for boats: Use answer for Part D

165
Note: Table modified due to decrease in potential public health risk that aquatic birds etc. may present to humans.
From your knowledge of the recreational water body, do you believe the above risk classification is an accurate representation of this risk? Yes No If yes, this is the assigned risk classification for wildlife. If No, justify answer (Use table 5 of the Sanitary Inspection Report Instructions for guidance where historical enterococci data is available): If No, what risk classification would you assign? 8.2 Domestic Animals Is the area used as an animal exercise site? (Includes areas where domestic animals are commonly exercised even if not permitted) Yes No If no refer to section 8.3 If yes, what types of animals? dogs horses other (specify): Are dog waste bags supplied? Yes No Do animals directly access the recreational water body? Yes No Is the area regularly cleaned and maintained to reduce the amount of animal faeces along the shoreline of the recreational water body? Yes No Using the table below, to what degree is water quality at the bathing site affected, or likely to be affected by faecal pollution from domestic animals? Tick the appropriate risk classification by aligning the most suitable likelihood of pollution with the corresponding consequence assigned in part A section 3.
Consequence (Use the
consequence assigned in Part
A section.3)
Likelihood of Pollution From This Source (Refer to table 2 for further definitions of likelihood)
Rare
(May occur only in exceptional circumstances e.g. >5 years)
Unlikely (Unlikely to
occur but could occur at least
once within a 5 year period)
Possible
(Might occur at least once or
twice per bathing season)
Likely
(Will probably occur at least 3 – 4 times per
bathing season)
Almost Certain
(Will occur on a regular basis e.g.
once a week)
Minor Very Low risk
Very Low risk
Very Low risk
Very Low risk
Low risk
Moderate Very Low risk
Very Low risk
Very Low risk
Low risk Moderate risk
Major Very Low risk
Very Low risk
Low risk Moderate risk
Moderate risk
Risk classification for wildlife:

166
Note: Table modified due to decrease in potential public health risk that domestic animals etc. may present to humans. From your knowledge of the recreational water body, do you believe the above risk classification is an accurate representation of this risk? Yes No If yes, this is the assigned risk classification for domestic animals. If No, justify answer (Use table 5 of the Sanitary Inspection Report Instructions for guidance where historical enterococci data is available): If No, what risk classification would you assign?
8.3 Agricultural Animals Are any of the following agricultural animals located within a 2km radius of the catchment?
Poultry Cattle Pigs Sheep Other (specify): ______________________ None If none fill out the highest ranked risk classification for section 8 Have any waste containment dams and their discharge points (e.g. piggery or dairy waste holding dams) been identified? Yes No If yes, provide details (ATTACH LOCATIONS ON MAP): Can agricultural animals directly access the water? Yes No If yes, provide details: (Access points, times of access) Using the table below, to what degree is water quality at the bathing site affected, or likely to be affected by faecal pollution from agricultural animals in the immediate catchments, and potential run-off of untreated animal effluent (e.g. dairying, piggeries) into the recreational water body? Circle the appropriate risk classification by aligning the most suitable likelihood of pollution with the corresponding consequence assigned in part A section 3.
Consequence (Use the
consequence assigned in Part
A section.3)
Likelihood of Pollution From This Source (Refer to table 2 for further definitions of likelihood)
Rare (May occur only in exceptional circumstances e.g. >5 years)
Unlikely (Unlikely to
occur but could occur at least
once within a 5 year period)
Possible (Might occur at least once or
twice per bathing season)
Likely (Will probably
occur at least 3 – 4 times per
bathing season)
Almost Certain
(Will occur on a regular basis e.g.
once a week)
Minor Very Low risk
Very Low risk
Very Low risk
Very Low risk
Low risk
Moderate Very Low risk
Very Low risk
Very Low risk
Low risk Moderate risk
Major Very Low risk
Very Low risk
Low risk Moderate risk
Moderate risk
Risk classification for domestic animals:

167
From your knowledge of the recreational water body, do you believe the above risk classification is an accurate representation of this risk? Yes No If yes, this is the assigned risk classification for agricultural animals. If No, justify answer (Use table 5 of the Sanitary Inspection Report Instructions for guidance where historical enterococci data is available): If No, what risk classification would you assign?
Based on animals identified in section 8.1, 8.2 and 8.3, you need to rank the overall highest ranked risk classification. Type N/A if the risk classification does not apply.
9. OTHER FAECAL SOURCES Provide details of any other faecal sources that are likely to impact on the recreational water body. If none, type N/A and refer to Part C. Using the table below, to what degree is water quality at the bathing site affected, or likely to be affected by pollution from other faecal pollutant source(s)? Circle the appropriate risk classification by aligning the most suitable likelihood of pollution with the corresponding consequence assigned in part A section 3.
From your knowledge of the recreational water body, do you believe the above risk classification is an accurate representation of this risk? Yes No If yes, this is the assigned risk classification for ‘other’. If No, justify answer (Use table 5 of the Sanitary Inspection Report Instructions for guidance where historical enterococci data is available): If No, what risk classification would you assign?
Consequence (Use the
consequence assigned in Part
A section 3)
Likelihood of Pollution From This Source (Refer to table 2 of SI instructions for further definitions of likelihood)
Rare (May occur only in exceptional circumstances e.g. >5 years)
Unlikely (Unlikely to
occur but could occur at least
once within a 5 year period)
Possible (Might occur at least once or
twice per bathing season)
Likely (Will probably
occur at least 3 – 4 times per
bathing season)
Almost Certain
(Will occur on a regular basis e.g.
once a week)
Minor Very Low risk
Very Low risk Low risk Low risk Moderate
risk
Moderate Very Low risk Low risk Low risk Moderate
risk High risk
Major Low risk Low risk Moderate risk High risk Very High
risk
Risk classification for agricultural animals:
Highest ranked risk classification for animals - 8.1, 8.2 & 8.3:
Use answer for Part D
Risk classification for other faecal sources:
Use answer for Part D

168
PART C: MANAGEMENT This section helps to identify any management interventions that may be used to minimise public access to the recreational water body during periods of higher risk (e.g. following rainfall). 1. Management (1) Are any of the following management controls in place to warn people of microbiological risks during high risk periods (e.g. following heavy rainfall)?
None. If none refer to Part C, (2) Permanent on site signage Temporary on site signage Media releases Beach closures Website other (specify)
Provide specific details of advisories: Do management controls referred to above effectively prevent people from accessing the water during high risk periods? Yes No Unsure If yes, justify evidence to prove this (e.g. Follow-up inspections during high risk periods indicate minimal water users): (2) Does the authority responsible for management of the recreational water body have a management response plan to deal with exceptional water contamination events such as sewage overflows? Yes No If yes, provide details: Have any harmful algal blooms (e.g. harmful to humans) occurred in the water? Yes No If yes, provide details of any recent harmful algal bloom events that have occurred: If yes, are people effectively prevented from access the recreational water bodies during an algal bloom event?
Yes No N/A Type N/A if not applicable.
Do management controls effectively prevent people from accessing the water during and following wet weather events?
Use answer for Part D

169
PART D: Sanitary Inspection Category (SIC) This section is used to assign a final sanitary inspection category to the recreational water body. It reviews individual risk classifications for each faecal source, and ranks the overall highest ranked classification from all faecal sources to assign a SIC for both dry and wet weather conditions. 1. SANITARY INSPECTION CATEGORY (SIC) Fill in the corresponding risk classifications for each faecal pollutant source (using the highest ranked risk) identified throughout Part B of the sanitary inspection report. Where a particular source is not present write N/A.
SOURCE (Part B)
Risk Classification (Use the highest risk classification identified for each section under Part B, If not present
write N/A)
SOURCE (Part B)
Risk Classification (Use the highest risk
classification identified for each section under Part
B)
1. Bather Density 6. Riverine discharge
2. Bather Toilet Facilities 7. Boats
3. Discharge of Wastewater (highest ranked risk)
8. Animals (highest ranked risk)
4. Stormwater discharge 1. Drain(s) that flow constantly (during fine and sunny conditions and wet weather) 2. Drain(s) flows only following wet weather conditions (e.g. rain)
9. Other
5. Rainfall runoff
1.1 Dry Weather Sanitary Inspection Category (SIC) A dry weather SIC indicates the level of risk expected during fine and sunny weather conditions without rainfall. To determine the dry weather SIC, from the table above list the highest ranked risk classification from sources identified in Part B sections 1, 2, 3, 4.1 drains that flow constantly (during fine and sunny conditions and wet weather), 6, 7, 8 and 9. (Exclude Part B section 4.2 for drains that flow only following wet weather and section 5 rainfall runoff). 1.2 Wet Weather Sanitary Inspection Category (SIC) The wet weather SIC indicates the level of risk expected following summer wet weather conditions. In general the level of health risk may increase because rain may increase the level of faecal pollution in a recreational water body. To determine the wet weather SIC, from the table above list the highest ranked risk classification from all sources.
Dry weather sanitary inspection category:
Wet weather sanitary inspection category:

170
1.3 Effectiveness of Management Controls Effective management controls will help to determine the overall SIC. If bathers are prevented from accessing the water during faecal pollution events (such as rainfall) the level of public health risk is reduced. If management strategies are not in place to prevent bathers accessing the water during faecal pollution events the risk to public health is increased. Do management controls effectively prevent people from accessing the water during and following wet weather events? Yes No (Refer to Part C for answer) If no, the wet weather sanitary inspection category identified above (1.2) should be accepted as the final assigned sanitary inspection category. If yes, the dry weather sanitary inspection category identified above (1.1) should be accepted as the final assigned sanitary inspection category.
2. ACTIONS / FURTHER INVESTIGATION NOTES What actions/further investigations are required to:
1. Provide additional evidence to demonstrate microbial water quality of the recreational water body? Review the report form, particularly boxes ticked ‘unsure’.
2. Improve the recreational water quality? E.g. redivert stormwater drains from entering water, install advisory signage, upgrade toilet facilities
© The copyright to this template belongs to Ms Bree Abbott, under the provisions of the Copyright Act 1968 (C'with Australia). Apart from any fair dealing for personal, academic, research or non-commercial use, no part may be reproduced, or used for any commercial purposes, without the written permission of the Environmental Health Directorate, Western Australian Department of Health (Attention: Ms Bree Abbott), PO Box 8172, Perth Business Centre, Western Australia 6849, AUSTRALIA or [email protected]
FINAL ASSIGNED SANITARY INSPECTION CATEGORY:

171
Appendix 7: Sanitary Inspection
Report Instructions

172
Sanitary Inspection Report Instructions To assist with completing a sanitary inspection a “Sanitary Inspection Report Form” has
been developed to help guide you through this process. The Sanitary Inspection Report is
to be applied in combination with the guidance instructions below.
Definitions: Recreational water body means any public coastal, estuarine or freshwater areas where a
significant number of people use the water for recreation (or “whole of body contact”).
Whole of body contact means any activity in which the whole body or the face and trunk
are frequently immersed or the face is frequently wet by spray, and where it is likely that
some water will be swallowed or inhaled, or come into contact with ears, nasal passages,
mucous membranes or cuts in the skin (e.g. swimming, diving, surfing or whitewater
canoeing) (2008 NHMRC Guidelines).
1. Assessing the risk to public health – qualitative approach The Sanitary Inspection Report uses a qualitative risk assessment approach by assigning
faecal pollutant sources into categories such as ‘very low’, ‘low’, ‘moderate’, ‘high’ or
‘very high’ (Table 5.13 NHMRC Guidelines).
This qualitative approach is presented as a ‘screening approach’ tool for the purpose of
determining sanitary inspection categories.
A number of faecal pollutant sources may impact on recreational water quality, which
includes:
10. Bather density
11. Bather toilet facilities
12. Discharges of wastewater (human effluent sources)
13. Stormwater discharge
14. Rainfall runoff following summer rainfall events

173
15. Riverine discharge (from rivers, streams or other tributaries)
16. Boats
17. Animals
18. Other
The risks to human health through direct discharge of municipal wastewater, riverine
discharge contaminated with sewage and bather contamination have been predetermined
by the NHMRC Guidelines (Table 5.10 and 5.11). These risks estimations have taken
into account the likelihood of human exposure and the degree of treatment of sewage.
Risk estimations have not been provided for other sources including contamination from
on-site toilet facilities, stormwater discharge, on-site wastewater systems, boats and
animals. To reduce the subjectivity from one person to another when assigning sanitary
inspection categories to these pollutant sources, a qualitative framework has been
developed.
The qualitative approach uses words to describe the magnitude of the potential
consequence of pollution occurring at a recreational water body and the likelihood of
pollution occurring from specific pollutant sources into a recreational water body.
2. Consequence Firstly, you need to determine the consequence of a pollution event occurring at the site
and the impact it will have on the recreational water users. A consequence is defined as
the outcome of an event affecting objectives (AS/NZS ISO 31000:2009).
The consequence of a pollution event is likely to be greater at very popular recreational
water bodies where large numbers of people may come into contact with water borne
pathogens or at tourist beaches where reports of poor water quality may affect the local
economy. The consequences may also be greater at beaches used by people with weaker
immune systems, such as small children or the elderly.

174
For the purpose of this sanitary inspection, consequences have been rated into three
categories; minor, moderate and major, and is defined using the qualitative definitions
provided in Table 1.
The recreational water usage information (reported in Part A, Section 3 of the Sanitary
Inspection Report) will help determine which consequence best suits the recreational
water body.
The consequence which best suits the location is to be used when assessing the impact of
each pollutant source.
Table 1: Qualitative definitions of consequence of pollution Source: Table Adopted from HB 436:2004 and 2004 DEC (NSW)
3. Likelihood Secondly, you need to determine the likelihood of faecal pollution occurring from each of
the identified sources. Likelihood is a general description for the chance of something
happening (AS/NZS ISO 31000:2009).
Description (Tick appropriate boxes from only one consequence that best suits the recreational water body. NOTE: Not all boxes need to be ticked)
Consequence (Circle the most suitable consequence that best fits the description of the site)
Location of minimal importance to local economy Location rarely used on weekdays Location occasionally used on weekends or holidays Few people enter the water Location not popular with children or the elderly
Minor
Location of some importance to the local economy (e.g. tourism)
Location occasionally used on weekdays (e.g. <100 people per day for non-holiday period)
Location frequently used on weekends or holidays Some or most people enter the water Location can be popular with children or the elderly
Moderate
Location of great importance to the local economy (e.g. tourism, water activities, world heritage site)
Serious media attention /community outcry Location frequently used on weekdays, weekends and
holidays Most people enter the water Location very popular with children or the elderly
Major

175
For the purpose of this sanitary inspection, likelihood has been rated into five categories;
rare, unlikely, possible, likely, and almost certain, and defined using the qualitative
definitions provided in Table 2.
Table 2: Qualitative definitions of likelihood of pollution
Rating Description – the likelihood of pollution from a source occurring at the recreational water body
Rare Pollution from this source is unlikely to occur or may occur only in exceptional circumstances (e.g. every five years or more).
Unlikely Pollution from this source is unlikely but could occur at least once within a five year period.
Possible Pollution from this source might occur at least once or twice per bathing season.
Likely Pollution from this source is expected to occur several times per bathing season (e.g. at least three or four times).
Almost Certain
Pollution from this source is expected to occur on a regular basis (e.g. once a week).
Source: Adopted from HB 436:2004
4. Risk Classification Thirdly, a risk classification can be determined for each faecal pollutant source by
combining the consequence and likelihood. Risk classifications will vary depending on
whether the source is of human or animal origin.
For the purpose of the sanitary inspection report, the level of risks has been rated into five
categories; very low risk, low risk, moderate risk, high risk and very high risk. This
has been done to equate with the categories shown in Table 5.13 of the NHMRC
Guidelines. Table 3 represents estimated risks of human origin; Table 4 represents
estimated risks of animal origin.
Determine the risk classification by aligning the most suitable likelihood of pollution
with the corresponding consequence.

176
Table 3: Qualitative risk analysis matrix – level of risk from human sources
Source: Adopted from HB 436:2004 Table 4: Qualitative risk analysis matrix – level of risk from animal sources
Source: Adopted from HB 436:2004 5. Reclassifying Risk Where you believe the risk classification (Tables 3 and 4) does not accurately represent
the impact the pollutant source has on the recreational water body, there is flexibility to
reassign the classification. It is recommended that the decision to reassign the risk
classification is done as a team exercise and agreed on by a committee or suitable persons
with knowledge of the recreational water body.
Provide an explanation on why you believe the risk classification should be reviewed.
Document any differing views (i.e. one person may feel the reclassification is not suitable
when the remainder of the group do) to ensure information on how the decision to
reclassify was agreed upon. This information will help with future sanitary inspections.
Consequence
Likelihood of Pollution From This Source Rare
(May occur only in
exceptional circumstances e.g. >5 years)
Unlikely (Unlikely to
occur but could occur at
least once within a 5
year period)
Possible (Might occur at least once or twice per
bathing season)
Likely (Will probably occur at least 3 – 4 times per bathing
season)
Almost Certain
(Will occur on a regular basis
e.g. once a week)
Minor Very Low risk Very Low risk Low risk Low risk Moderate risk Moderate Very Low risk Low risk Low risk Moderate risk High risk
Major Low risk Low risk Moderate risk High risk Very High risk
Consequence
Likelihood of Pollution From This Source Rare
(May occur only in
exceptional circumstances e.g. >5 years)
Unlikely (Unlikely to
occur but could occur at
least once within a 5
year period)
Possible (Might occur at least once or twice per
bathing season)
Likely (Will probably occur at least 3 – 4 times per bathing
season)
Almost Certain
(Will occur on a regular basis
e.g. once a week)
Minor Very Low risk Very Low risk Very Low risk Very Low risk Low risk Moderate Very Low risk Very Low risk Very Low risk Low risk Moderate risk
Major Very Low risk Very Low risk Low risk Moderate risk Moderate risk

177
When reclassifying the risk classification you should review, where available, historical
enterococci results recorded at the recreational water body, and any microbial data
specific to the pollutant source.
Use the semi-quantitative definitions outlined in Table 5 as a guide to assist you in
determining the most suitable risk classification category to reassign the location to.
Table 5: Semi quantitative risk classifications
Level of Risk Number of Faecal Streptococci (organisms per 100 mL)
Very Low Risk 0 – 10 Low Risk >10 – 40 Moderate Risk 41 - 200 High Risk 201 – 500 Very High Risk > 501
Source: Table adopted from 2003 WSAA Guidelines Applying the Sanitary Inspection Report
The information below provides details on how to complete specific sections of the
sanitary inspection report.
PART A: DEFINE THE CATCHMENT AND RECREATIONAL
WATER BODY
1. Site Identification
This section requires basic information to help you and others (such as new employees)
identify the exact location of the recreational water body, including details of the officer
compiling the list and outcomes of previous sanitary inspections that have been
completed.

178
2. Physical Characteristics of the Recreational Water Body
This section requires you to define the immediate recreational water body which is used
by the public, as well as the characteristics and usage of the surrounding catchment (e.g.
residential, commercial, industrial).
The defined recreational water body should reflect the main area where majority of
people are swimming or undertaking other water based recreational activities where
immersion of the head in the water takes place.
As a guide, the recreational water body (represented by the sample location) should be no
more then a 200 metre radius from the sampling location.
Attach photographs of the recreational water body and an aerial map(s) that clearly
illustrates the catchment area.
3. Recreational Water Usage
You need to gain an understanding of who uses the recreational water body and what
facilities are provided to attract people to the area. Are certain age groups entering the
water more often then other groups? For example, disabled access ramps may attract a
higher proportion of elderly and disabled people, or confined bays and marinas may
attract a younger population. These age groups are more susceptible to recreational water
illnesses.
The number of recreational water users should be estimated for weekends, weekdays and
school holidays. These estimated figures may be obtained from lifeguards, rangers or
other personal that regularly patrol the area. This information will help you gain an
understanding of the usage patterns of the recreational water body.
The number of recreational water users who actually go into the water should also be
considered. Even though a recreational water body may be popular, dangerous surf

179
conditions or regularly occurrences of algal blooms may deter many people from
swimming.
Recreational water usage information will help you determine the consequence of a
pollution event occurring at the site and the impact it will have on the local community. A
consequence is the outcome or impact of an event.
4. Public Health Consequence of a Pollution Event Occurring at the Site
For the purpose of this sanitary inspection, consequences have been rated into three
categories; minor, moderate and major, which each being defined using the qualitative
definitions provided in the Table below.
The recreational water usage information will help determine which consequence best
suits the recreational water body. The consequence which best suits the location is to be
used for ALL likelihood /consequence tables throughout Part B.
Description (Tick appropriate boxes from only one consequence that best suits the recreational water body. NOTE: Not all boxes need to be ticked)
Consequence (Circle the most suitable consequence that best fits the description of the site)
Location of minimal importance to local economy Location rarely used on weekdays Location occasionally used on weekends or holidays Few people enter the water Location not popular with children or the elderly
Minor
Location of some importance to the local economy (e.g. tourism)
Location occasionally used on weekdays (e.g. <100 people per day for non-holiday period)
Location frequently used on weekends or holidays Some or most people enter the water Location can be popular with children or the elderly
Moderate
Location of great importance to the local economy (e.g. tourism, water activities, world heritage site)
Serious media attention /community outcry Location frequently used on weekdays, weekends and
holidays Most people enter the water Location very popular with children or the elderly
Major

180
PART B: SOURCES OF FAECAL POLLUTION
1. Bather Density
Bathers can influence water quality directly through bather shedding of microorganisms.
Defecating in the water, particularly where toilet facilities are not readily available may
occur. It can also be assumed that young children (<7 years of age) are more likely to
defecate in the water.
The potential impact of bathers on water quality will relate to the number of bathers using
the recreational water body and the dilution rate of the water. Low dilution represent
areas where there is a low level of flushing and turn over of the water, or little or no water
movement (e.g. lakes, lagoons and coastal embayments). High dilution represents areas
where there is a high level of flushing and turn over of water (e.g. coastal beaches).
2. Toilet Facilities
On-site toilet facilities have the potential to cause faecal pollution to nearby water bodies
if they are not regularly maintained and serviced. The type of disposal system used and
the distance of the toilets from the recreational water body needs to be taken into
consideration when determining if the toilets represent a risk to the recreational water
body or are a pollutant source. Also note any recorded complaints of leaks, discharges or
odours from such systems.
Reviewing information relating to on-site toilet facilities will help you to determine the
likelihood of faecal contamination from the toilets polluting the recreational water body.
3. Discharge of Wastewater
3.1 Wastewater outfalls from treatment plant (also known as sewage outfalls)
Discharges from municipal wastewater treatment plants can be a significant source of
faecal contamination. Wastewater treatment plants (WWTP) can often malfunction as a
result of human error or breakage of old equipment. During these times raw or partially

181
treated sewage may be discharged into coastal waters or other receiving water bodies.
Depending on the location of the outfall and level of treatment applied, inadequately
treated sewage may reach nearby recreational water areas and put bathers at risk.
A number of factors need to be taken into consideration to determine the likelihood of
contamination from WWTP on the bathing area. These include:
Location of outfall:
o Direct – discharges directly to the recreational water body or adjacent area.
o Short – discharges within inter-tidal zone, significant probability of sewage
plume reaching the recreational water body.
o Long/effective – discharges several kilometres offshore, sufficient length and
depth to ensure low probability of sewage plume reaching the recreational
water body.
Level of wastewater treatment:
o No treatment (raw sewage)
o Preliminary (filtration with milli- or micro-screens)
o Primary (physical sedimentation)
o Secondary (primary + trickling filter/activated sludge)
o Secondary + disinfection (primary + trickling filter/activated sludge +
disinfection)
o Tertiary (secondary + coagulation-sand filtration)
o Tertiary + disinfection (secondary + coagulation-sand filtration +
disinfection)
o Lagoons (low-rate biological treatment)
Visible signs of sewage pollution at the recreational water body:
o Are regular complaints of sewage contamination recorded at the recreational
water body?

182
Knowledge of local currents, dilution rates and tidal movements also need to be
considered when determining the potential for polluted water reaching the recreational
water body.
Where available provide details of tide charts, currents, and specific details and design
requirements of the WWTP and outfall.
3.2 Sewerage System Pumping Stations
Pumping stations are used to help transport wastewater to wastewater treatment plants.
They can be located near recreational water bodies and in the event of a malfunction, can
pollute the recreational water body.
Determine the location of pumping stations in the catchment and specific details on
where the wastewater will be diverted to in the event of system failure. For example, if
there is a power failure and the pumping station stops working the wastewater may be
diverted directly into a recreational water body.
3.3 On-Site Wastewater Systems e.g. septic tanks, aerobic treatment units
There is the potential for on-site wastewater systems which include septic tanks and
aerobic treatment units, which if not sited, built, and maintained properly can leach
wastewater into nearby recreational water bodies. Recreational water bodies can be
contaminated by faecal matter from malfunctioning or overloaded systems. Runoff can
also carry bacteria from failing on-site wastewater systems into streams or drains that
empty into or near the recreational water body.
Determine where onsite wastewater systems are located within the catchment and assess
the likelihood of contamination of the recreational water body from these systems.
Further studies and community education programs may be required by local
governments to ensure on-site wastewater systems are adequately maintained to reduce
the likelihood of contamination.

183
3.4 Wastewater Reuse
Wastewater reuse systems are increasingly popular, and if not managed correctly have the
potential to increase the microbial loading on nearby recreational waterways.
Determine the location of wastewater reuse systems located within the catchment and
assess the likelihood of contamination of the recreational water body from these systems.
4. Stormwater Discharge
Many urban lakes, rivers, estuaries and coastal beaches are polluted by urban stormwater,
which can present a significant source of faecal pollution to bathers. As rainwater washes
over roads, car parks, construction sites, industrial and commercial areas, and parks and
gardens it collects a number of contaminates on its way to the stormwater system. Such
contaminates can include faecal matter from dogs, cats, pigeons, seagulls, other urban
and rural animals.
Human waste may find its way into the stormwater system from illegal pipes connected
into the system from adjacent residences or businesses. Leaks from sewage pipes or
septics may also flow into the stormwater system.
A number of factors need to be taken into consideration when determining the likelihood
of contamination from stormwater drains. These include:
Area of discharge into the recreational water body:
o Swale/dune discharge - Stormwater does not flow directly into the
recreational water body. The stormwater is either taken up by vegetation, held
in the sand or infiltrates through to the groundwater via deep percolation.
Deep percolation allows some of the stormwater to reach the water via
groundwater flow; however, much of the contaminants will be filtered out
before reaching the water.

184
o Beach discharge - Stormwater flows over beach sand and into the water with
some filtered into the beach sediment. The drain should be located at least
10m from the recreational water body.
o Direct discharge - Stormwater discharges directly into the recreational water
body, with significant probability of plume reaching the area where people
swim.
o Effective discharge – Stormwater is discharged several metres offshore to
minimise the impact on the recreational water body. The drain should be
located at least 50m offshore.
Type of stormwater drainage/catchment area:
o Main drain - High volume discharge from a large urban catchment area.
o Local drain - Medium volume discharge from surrounding carpark and roads.
o Bushland - Discharge from surrounding bushland/forested area including low
use roads and carpark.
o Rural - Medium volume discharge from rural, Agricultural, pastures.
5. Rainfall following summer rainfall events
There is sufficient evidence that suggests summer rainfall (referred to as wet weather)
events can contribute significantly to the pollution load of a recreational water body. In
urban and rural areas uncontrolled runoff from farms, roads, golf course, and lawns can
flow into waterways. Such runoff can result in high concentrations of bacteria in the
recreational water body.
Monitoring water quality at the recreational water body during and following rainfall
events, particularly rainfall above 10mm should be undertaken to determine the waters
susceptibility to faecal contamination during and following summer rainfall. The die-off
rate of bacteria following rainfall needs to be determined to help estimate the period of
time people should avoid swimming in the recreational water body. For example, in
coastal waters it may take at least a day for the water to return to a safe level, and in river
and estuarine waters it may take up to three days for the water body to return back to
normal.
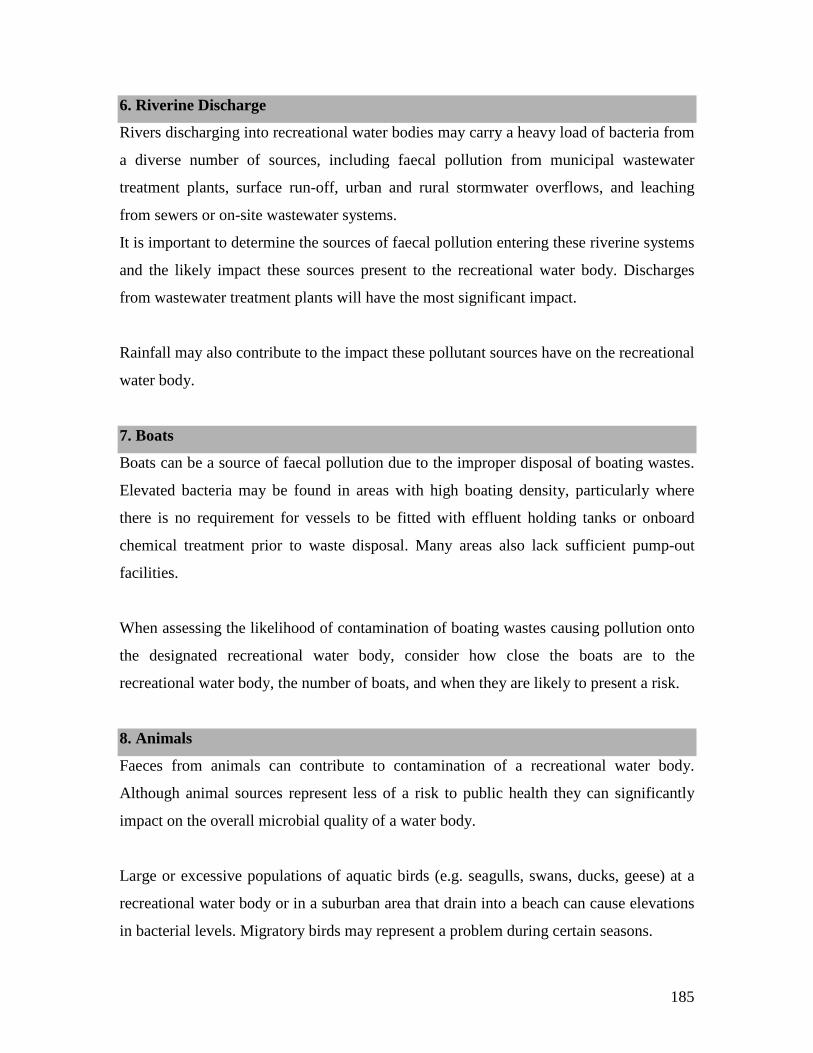
185
6. Riverine Discharge
Rivers discharging into recreational water bodies may carry a heavy load of bacteria from
a diverse number of sources, including faecal pollution from municipal wastewater
treatment plants, surface run-off, urban and rural stormwater overflows, and leaching
from sewers or on-site wastewater systems.
It is important to determine the sources of faecal pollution entering these riverine systems
and the likely impact these sources present to the recreational water body. Discharges
from wastewater treatment plants will have the most significant impact.
Rainfall may also contribute to the impact these pollutant sources have on the recreational
water body.
7. Boats
Boats can be a source of faecal pollution due to the improper disposal of boating wastes.
Elevated bacteria may be found in areas with high boating density, particularly where
there is no requirement for vessels to be fitted with effluent holding tanks or onboard
chemical treatment prior to waste disposal. Many areas also lack sufficient pump-out
facilities.
When assessing the likelihood of contamination of boating wastes causing pollution onto
the designated recreational water body, consider how close the boats are to the
recreational water body, the number of boats, and when they are likely to present a risk.
8. Animals
Faeces from animals can contribute to contamination of a recreational water body.
Although animal sources represent less of a risk to public health they can significantly
impact on the overall microbial quality of a water body.
Large or excessive populations of aquatic birds (e.g. seagulls, swans, ducks, geese) at a
recreational water body or in a suburban area that drain into a beach can cause elevations
in bacterial levels. Migratory birds may represent a problem during certain seasons.

186
Faecal matter from domesticated animals such as dogs or horses may enter the
recreational water body along animal exercise beaches, or into surrounding stormwater
drains.
Agricultural animals with direct access may pollute the recreational water body with
faeces. Runoff from agricultural fields, feedlots, piggeries or dairy waste holding dams
may contain high concentrations of bacteria.
10. Other Faecal Sources
Identify any other faecal sources that may contribute to faecal pollution of the
recreational water body. Assess these risks using the likelihood and consequence table.
PART C: MANAGEMENT
Recreational water areas with successful management controls that aim to prevent or
significantly reduce the number of people from accessing the recreational water body
during high risk periods (e.g. following heavy rainfall) can improve the overall sanitary
inspection category assigned to a site.
A number of communication strategies can be introduced to advice people of the risks of
swimming in recreational water bodies during high risk periods. These can include press
releases, temporary and permanent signage, and websites.
Where a recreational water body is very popular, particularly by tourists, and is
susceptible to pollution following rainfall or from sewage pollution, temporary beach
closures may be the only effective measure to prevent people from accessing the water.

187
PART D: SANITARY INSPECTION CATEGORY
1. Sanitary Inspection Category (SIC)
There are two parts to assigning a sanitary inspection category (SIC). Firstly you need to
review the risk classifications assigned to each faecal pollutant source identified in the
sanitary inspection report for both dry weather and wet weather. List these in the table
provided within the form.
Example table:
SOURCE (Part B)
Risk Classification
(Use the highest risk classification
identified for each section under Part B)
SOURCE (Part B)
Risk Classification
(Use the highest risk classification identified for each section under Part
B)
1. Toilet Facilities Low 6. Riverine discharge N/A
2. Bather Density Low 7. Boats Low 3. Discharge of Wastewater Moderate 8. Animals Very Low
4. Stormwater discharge Low 9. Other N/A 5. Rainfall High 1.1 Dry Weather Sanitary Inspection Category
A dry weather sanitary inspection category includes all faecal pollutant sources that are
likely to present a risk during dry summer dry weather only. Such faecal pollutant sources
include those identified in Part B sections 1, 2, 3, 4.1 drains that flow constantly (during
fine and sunny conditions), 6, 7, 8 and 9.
The highest ranked risk classification identified from these sources becomes the dry
weather SIC.

188
For example, the example table above outlines the risk classifications identified for a
coastal recreational water body. The highest ranked risk classification for dry weather is
‘discharge of wastewater’ which is “Moderate”.
Therefore the Dry Weather Sanitary Inspection Category: MODERATE
1.2 Wet Weather Sanitary Inspection Category
A wet weather sanitary inspection category includes all faecal pollutant sources that are
likely to present a risk during wet weather summer periods (e.g. rainfall that occurs
during the summer only). Such faecal pollutant sources include all sources identified
above in Part B.
The highest ranked risk classification identified from the above sources becomes the wet
weather SIC.
For example, from the example table ‘rainfall’ has been assigned a “high” risk
classification. This is the highest ranked risk classification from all the sources.
Therefore the Wet Weather Sanitary Inspection Category: HIGH
1.3 Effectiveness of Management Controls
Where effective management controls (identified in Part C) are in place to prevent or
significantly reduce the number of people who access the recreational water body during
and following summer wet weather events (where wet weather presents a problem), the
dry weather SIC is to be used as the assigned sanitary inspection category.
Where management controls do not effectively prevent people from accessing the water
during or following summer wet weather events, the wet weather SIC is to be used as the
final SIC until such time that wet weather events are managed appropriately to minimise
the number of people accessing the recreational water body.

189
Assigned Sanitary Inspection Category: The assigned SIC is to be used when applying
the risk classification matrix Table 5.13 of the NHMRC Guidelines.
2. Actions/Further Investigation
A number of issues may need to be addressed or followed up as you complete the
sanitary inspection report. Use this section to list follow up actions or other measures that
can be taken to improve the quality of the recreational water body.

190
Appendix 8: Recreational Waters
Workshop Survey; User
Questionnaire

191

192

193

194
Appendix 9: Example Sanitary
Inspection Report for Coode Street,
South Perth

195
Sanitary Inspection Report Form – Example Coode Street, South Perth
Part A: Define the Catchment and Recreational Water Body This section is used to describe the sampling site, the catchment surrounding the recreational water body and the types of activities and people who use the bathing area.
1. Site Identification Type of site: Estuarine Coastal Freshwater Other: Name of site: Coode St, South Perth Address of site: end of Coode Street, South Perth - Western Car park Authority responsible for managing site: City of South Perth Site Reference No: EV3/513 Sample Site(s) Description (Use key landmarks to describe the exact location where the sample(s) is
collected): Sample collected opposite the catamaran administration building or directly opposite the boat marks in
the water
Sample Site(s) Global Positioning Coordinates (The exact location where sample(s) is collected): E 392 588 N 646 1820
Date of Site Inspection: 8 April 2010 Name of person completing Site Identification: Bree Abbott Has a previous sanitary inspection category (SIC) been assigned? Yes No If Yes, provide details (category, date of completion, references):
2. Physical Characteristics of the Recreational Water Body 2.1 Recreational Water Body Is there a beach (e.g. sand along the shoreline)? Yes No
Define the approximate dimensions of the area used for bathing: Length (m): 100
Mean width (m):
15 Area (m):
1500
Describe the immediate area e.g. trees along shoreline, reeds along river banks, reef, jetty: beach sand, shadey trees, grassed areas, picnic and BBQ areas, carparks, restaurant, playground and
footpath
What level of dilution (e.g. mixing/flushing) occurs in the water? Medium to High (high level of flushing and turnover of water, high tidal movement) Low (low level of flushing and turnover of water, low tidal movement)

196
2.2 Land Use and Geography Describe land use and geography of the catchment within a 2km radius of site in ~percentage (%)
55 % Residential 10 % Commercial % Industrial 25 % Parks, reserve, bush land
10 % Road/Rail % Agricultural % Other (specify):
Are car parking bays provided in the immediate area? Yes No If Yes, approximately how many bays?
150
Are BBQ facilities provided in the immediate area? Yes No Are rubbish bins provided in the immediate area? Yes No ATTACH MAPS, AERIAL PHOTOGRAPHS and OTHER PHOTOGRAPHS detailing physical
characteristics and land use (of the immediate and surrounding areas) within a 2km radius of the recreational water body. Include on the map and aerial photographs:
Sample point(s) Key buildings e.g. restaurants
Identified pollutant sources e.g. stormwater drains, wastewater outfall
Land use area e.g. highlight residential areas, agricultural activities, piggeries
Sewer versus onsite wastewater system areas Bathing / Swimming area Boating areas Car Parks Marinas / Groins Parks and Gardens / Playgrounds Toilet facilities Riverine discharge areas 2.3. Recreational Water Usage What recreational activities occur in the recreational water body?
Swimming Water Skiing Jet-Skiing Fishing
Canoeing/Kayaking
Boating Other (specify): catamarran's What groups recreate in the recreational water body:
Mostly young Children (<7 years of age) Mostly adults and young children (<7 years of age)
Mostly elderly groups (>60 years) Tourists All age groups Is the water used for swimming classes? Yes No If Yes, who conducts the classes and when do classes usually take place (times, months)? Is the water subject to above average bather use during peak times such as summer/school holidays?
(e.g. do more people tend to use the water during the summer/school holiday period) Yes No Estimate the number of bathers using the water on weekends and weekdays (e.g. 500 to 1000 bathers
on the weekend, check lifeguard statistics if available): Approximate 10 to 100 bathers per day on the weekend
Approximate 0 to 30 bathers per weekday (non-holiday period) Approximate 10 to 50 bathers per weekday (non-holiday period)
Do surf or water conditions regularly deter people from entering the water? Yes No On some occasions (specify below):
water discolouration, oils, jellyfish
Are lifeguard services provided for this site? Yes No. If Yes, weekends weekdays both Have complaints of recreational water illnesses been recorded from this site? Yes No. If Yes,
provide details below:

197
3. PUBLIC HEALTH CONSEQUENCE OF A POLLUTION EVENT OCCURRING AT THE SITE
This section must be filled out before proceeding to Part B. The table below is used to determine the appropriate “consequence” that best describes the level of public health consequence a pollution event at the recreational water body may present. The best fitting consequence is to be used when applying all likelihood /consequence tables in Part B.
Using the table below, in the description column tick the boxes that best describes the recreational use of the water body. The row with the most ticks will correspond to the most suitable “consequence”. Only choose one consequence that best suits the location.
Description (Tick appropriate boxes from only one consequence that best suits the recreational water body. NOTE: Not all boxes need to be ticked)
Consequence (Check the most suitable consequence that best fits the description of the site)
Low to no financial impact on local economy Minor Limited to no media attention Unlikely to result in illness due to few people entering the water
(particularly young people or the elderly Moderate financial impact on the local economy (e.g. tourism) Moderate Some media attention / community outcry Moderate number of illnesses expected due to some or most
people entering the water (including young people and the elderly) and moderate use of the water on weekdays, weekends and holidays
Extensive financial impact on local economy (e.g. tourism, water activities, world heritage site) Major
Serious media attention /community outcry High number of illnesses expected due to most people entering
the water (particularly young people and the elderly) and high use of the water on weekdays, weekends and holidays
Source: Table Adopted from HB 436:2004 and 2004 DEC (NSW)
Assigned Consequence
:
Moderate
The assigned consequence is to be used for ALL likelihood / consequence tables throughout Part B.

198
This section is used to assign a sanitary inspection risk classification to individual faecal pollution sources that may impact on the recreational water body.
1. Bather Density Bather density is the number of people using the water, usually during peak usage times. Tick the risk classification below which best describes bather density during
peak usage times (e.g. High density: >100 people during peak times, Low density: <100 people during peak times) compared to the level of dilution (e.g. high or low mixing/flushing) of the water. Use the bather density and dilution rate referred to in Part A Section 2.1 & 2.3).
Low bather density, high dilution = Very Low risk
High bather density, high dilution = Low risk
Low bather density, low dilution = Low risk
High bather density, low dilution = Moderate risk
Comment: (Where available, provide details of any monitoring that has been undertaken to confirm
PART B: SOURCES OF FAECAL POLLUTION 2. Bather Toilet Facilities Are toilet facilities available for bather use? Yes No. If No refer to Section 3. Approximately how far (in metres) are the toilets located from the water body? 100m Total number of toilets: 5 Total number of showers: 0 What type of sewage system is used? Onsite wastewater system (e.g. septic tank) Sewer If an onsite wastewater system is used, how often are they pumped out and/or serviced? Have any discharges, leakages or odours been recorded from the sewerage system? Yes No. If Yes provide details below: Using the risk matrix below, what is the potential risk to human health from exposure to faecal pollution from the toilets? (Consider the distance of the toilets from water body, type of wastewater disposal): Consequence
(Use the consequence
assigned in Part A
Section 3)
Likelihood of Pollution From This Source (Refer to Table 2 of SI instructions for further definitions of likelihood)
Rare (May occur
only in exceptional circumstanc
es e.g. >5 years)
Unlikely (Unlikely to occur but could occur
at least once within a 5 year
period)
Possible (Might occur at least once or
twice per bathing season)
Likely (Will
probably occur at
least 3 – 4 times per bathing season)
Almost Certain (Will occur on a regular basis e.g. once a week)
Minor Very Low risk
Very Low risk Low risk Low risk Moderate risk
Moderate Very Low risk
Low risk Low risk Moderate risk
High risk
Major Low risk Low risk Moderate risk
High risk Very High risk
From your knowledge of the recreational water body, do you believe the above risk classification accurately represents this risk?
Yes No If No, justify answer (Use Table 5 of the Sanitary Inspection Report Instructions for guidance where historical enterococci data is available):
Based on the ‘No’ answer above, what risk classification would you assign?
Assigned Risk Classification for Bather Toilet Facilities: Very Low

199
3. Discharge of Wastewater
bather impact on water quality):
no monitoring available From your knowledge of the recreational water body, do you believe the above risk
classification is a true representation of this risk? Yes No
If No, justify answer (Use Table 5 of the Sanitary Inspection Report Instructions for guidance where historical enterococci data is available):
Based on the ‘No’ answer above, what risk classification would you assign?
Assigned Risk Classification for Bather Density:
Very Low Risk
3.1 Wastewater Outfalls Are any wastewater outfalls located within a 2km radius of the site? Yes No If No refer to Section 3.2, if Yes, outfall name: 3.2 Sewage System Are pumping stations located within a 1km radius of the site? (1km is an approximate estimation and
can be increased or decreased depending on the catchment) Yes No If No, refer to Section 3.3. If Yes, provide pump station location(s) and ATTACH MAP detailing
locations: Are pump station(s) fitted with emergency overflow alarms? (Confirm with appropriate agency)
Yes No Unsure (Confirm this question and the following questions with the appropriate agency)
Comment (Last time alarms checked for compliance):
In the event that pumping station overflow alarms fail, where will wastewater be diverted (e.g. into stormwater system, retention basin)? It appears that the overflow enters directly into the river at Mend St Jetty. Note burst sewer main overflowed into stormwater in 2005
Global positioning coordinates: S 115° 51’ 14.4’’ E 31° 58.285’
Using the risk matrix below, what is the potential risk to human health from exposure to contamination from onsite wastewater systems? (Consider the distance from water body)
Consequence (Use the
consequence assigned in Part A
Section 3)
Likelihood of Pollution From This Source (Refer to Table 2 of SI instructions for further definitions of likelihood)
Rare (May occur
only in exceptional
circumstances e.g. >5 years)
Unlikely (Unlikely to
occur but could occur at least
once within a 5 year period)
Possible (Might occur at least once or
twice per bathing season)
Likely (Will probably occur at least 3 – 4 times per bathing
season)
Almost Certain
(Will occur on a regular basis e.g.
once a week) Minor Very
Low risk Very Low
risk Low risk Low risk Moderate
risk Moderate Very
Low risk Low risk Low risk
Moderate risk
High risk
Major Low risk Low risk Moderate risk
High risk Very High risk
From your knowledge of the recreational water body, do you believe the above risk classification is a true representation of this risk? Yes No

200
3.3 Onsite Wastewater Systems e.g. septic tanks, aerated wastewater treatment systems Are surrounding properties using onsite wastewater systems? (Look at a distance of at least a 100m
radius from the recreational water body) Yes No If No, refer to Section 3.4. If Yes, ATTACH MAP detailing approximate onsite system locations 3.4 Wastewater Reuse Are there areas where reuse of wastewater occurs within a 100m radius of the recreational water body?
(e.g. To irrigate local parks and gardens) Yes No – If No, fill out highest ranked risk classification for Section 3.
Based on all discharges of wastewater identified in sections 3.1, 3.3 and 3.4 you need to rank the overall highest assigned risk classification.
Highest Ranked Risk Classification for Discharges of Wastewater – 3.1, 3.3 and 3.4:
4. Stormwater Discharge Do stormwater drains discharge into the recreational water body? Yes No (Look at a distance of at least a 500m radius either side of the sampling site. 500m is a general
approximation and can be increased, or decreased depending on the nature of the recreational water body)
If No, refer to Section 5. If Yes, ATTACH MAP detailing stormwater discharge locations Drain 1 Global Positioning
Coordinates: S 31° 58’28.3” E 115° 51’52.9”
Agency responsible for management of stormwater drain:
City of South Perth
What type of area does the drain discharge from: Urban - Main drain (High volume discharge from a large urban catchment area) Urban - Local (Medium volume discharge from surrounding carpark and roads) Bushland (Discharge from surrounding bushland/forested area including low use roads and
carpark) Rural (Medium volume discharge from rural, Agricultural, pastures) Is the drain piped or open? Piped Open Both Where does the drain discharge: Swale/dune discharge (Stormwater does not flow directly into the recreational water body. The
stormwater is either taken up by vegetation, held in the sand or infiltrates through to the groundwater via deep percolation. Deep percolation allows some of the stormwater to reach the water via groundwater flow; however, much of the contaminants will be filtered out before reaching the recreational water body)
Beach discharge (Stormwater flows over beach sand and into the water with some filtered into the beach sediment. The drain should be located at least 10m from the recreational water body)
Direct discharge (Stormwater discharges directly into the recreational water body, with significant probability of plume reaching the area where people swim)
If No, justify answer (Use Table 5 of the Sanitary Inspection Report Instructions for guidance where historical enterococci data is available):
Based on the ‘No’ answer above, what risk classification would you assign?
Assigned Risk Classification for Onsite Wastewater
Systems: Low risk

201
Effective discharge (Stormwater is discharged several metres offshore to minimise the impact on the recreational water body. The outlet should be located at least 50m offshore)
How often does the drain flow? Following wet weather only Constantly Unsure (If unsure investigate further)
Is the drain fitted with a pollutant trap? Yes No. If Yes, provide details: Provide a description of possible faecal sources that may discharge into drain (e.g. drain subject to
excess faecal load from agricultural area): garden mulch, dog faeces
Has any monitoring for bacterial indicators been undertake at the outlet? Yes No. (If No investigate further)
If Yes, provide details of monitoring: Has the stormwater drain been inspected for the presence of illegal wastewater connections? Yes
No Unsure (If unsure investigate further) If Yes, provide details:
Have visible signs of stormwater pollution been recorded at the recreational water body? (Includes discoloured water, excess leaves, twigs, street litter, cigarette butts) Yes No
If Yes, provide details:
Using the Table below, check the appropriate stormwater risk classification by aligning the type of stormwater drainage area with the area of discharge:
Area of discharge Type of stormwater drainage area Urban Bushland Rural Main drain Local Swale/dune discharge Low Very Low Very Low Very Low Beach discharge Moderate Low Very Low Low Direct discharge High Moderate Low Moderate Effective discharge Low Low Very Low Low Table adopted from: Green, A. and Doucette, J. (2006) From your knowledge of the recreational water body, do you believe the above risk classification is a true
representation of this risk? Yes No If No, justify answer (Use Table 5 of the Sanitary Inspection Report Instructions for guidance where
historical enterococci data is available):
Based on the ‘No’ answer above, what risk classification would you assign?
Risk Classification for Drain 1: Moderate
Is this drain a risk following wet weather only, dry weather only
or both? Constantly
Based on the number of stormwater drains identified at the recreational water body and/or catchment area, you need to rank the overall highest risk classification from each drain for both dry weather and wet weather only. It is important to differentiate between dry and wet weather as this will affect your final sanitary inspection category.
Highest Ranked Risk Classification for Stormwater
Drains – Dry Weather: Moderate

202
Highest Ranked Risk Classification for Stormwater
Drains – Wet Weather: Moderate
5. Rainfall Runoff Following Summer Rainfall Events Does rainfall trigger microbiological contamination? Yes No Unsure (if Unsure investigate further). If No, refer to Section 6 Has monitoring for bacterial indicators (at the recreational water body) following rainfall events been undertaken to confirm the above? Yes No. If No, it is recommended monitoring of the recreational water body following rainfall events is undertaken – refer to Section 5.2. (5.2) If no, until further monitoring has been undertaken circle one of the following provisional
risk classifications for rainfall runoff based on the type of water body: Type of water body Risk Classification Ocean/estuarine water (avoid water 24 to
48 hours following rainfall) Moderate risk
Freshwater (avoid water 72 hours following rainfall
High risk
Highest Ranked Risk Classification for Rainfall
Runoff: Moderate
6. Riverine Discharge (from Rivers, Streams or Other Tributaries) Do rivers, streams or other tributaries flow into or within a 2 km radius of the recreational water body?
(2km is an approximation and can be increased or decreased depending on the nature of the recreational water body) Yes No. If No refer to Section 7
7. Boats Are boats/vessels located in the immediate area? Yes No. If No, refer to Section 8. What boating facilities are provided:
Marina Harbour Permanent boat moorings Temporary boat moorings Boat ramp Jetty Ferry Berth Anchorage
ATTACH MAP detailing boat mooring locations. How far (in metres) is the nearest boat/vessel located from the bathing area?
1000m
What is the maximum number of boats/vessels that area likely to be anchored/moored at any given time? (In reasonable proximity to recreational water body): n/a
Are pump out facilities provided for boat wastes? Yes No. If No, how are boat wastes generally disposed of? meant to be disposed of out to sea
Have any complaints of boat discharges been recorded? Yes No Unsure If Yes, provide details:
Are onshore toilet facilities provided for boat owners? Yes No. Has monitoring been undertaken to determine the impact of boat discharges on the recreational water body?
Yes No. If Yes, provide details:
Using the risk matrix below, what is the potential risk to human health from exposure to pollution from boat discharge? (Considering the number of boats, historical enterococci data, recorded illnesses, pump out facilities available). Check the appropriate risk classification by aligning the most suitable likelihood of pollution with the corresponding consequence.

203
Consequence (Use the
consequence assigned in Part A
Section 3)
Likelihood of Pollution From This Source (Refer to Table 2 of SI instructions for further definitions of likelihood)
Rare (May occur only in exceptional circumstances e.g. >5 years)
Unlikely (Unlikely to occur but
could occur at least once
within a 5 year period)
Possible (Might occur at least once or
twice per bathing season)
Likely (Will probably
occur at least 3 – 4 times per
bathing season)
Almost Certain (Will occur on a
regular basis e.g. once a week)
Minor Very Low risk
Very Low risk
Low risk Low risk Moderate risk
Moderate Very Low risk
Low risk Low risk Moderate risk
High risk
Major Low risk Low risk Moderate risk
High risk Very High risk
From your knowledge of the recreational water body, do you believe the above risk classification is a true representation of this risk? Yes No. If No, justify answer (Use Table 5 of the Sanitary Inspection Report Instructions for guidance where historical enterococci data is available):
Based on the ‘No’ answer above, what risk classification would you assign?
Risk Classification for Boats: Moderate
8. Animals Wildlife (not including domestic animals) Are the following wildlife present in and around the recreational water body?
Aquatic birds (e.g. including ducks, geese, seagulls, swans) Other (e.g. kangaroos, parrots) None If none refer to Section 8.2
Comment (Provide details of anything significant concerning wildlife e.g. popular duck feeding area, migratory birds): seagulls and migratory birds
If present, describe the density of the local aquatic bird population: Low (<5 birds on any occasion) Medium (5-20 birds on any occasion) High (>20 birds on any
occasion) Are structures (e.g. jetties, bridges, trees) present to promote birds (e.g. pigeons, parrots) nesting/roosting close to the water body? Yes No If Yes, provide details: beach areas, car parks and jetties
Using the risk matrix below, what is the potential risk to human health from exposure to faecal pollution from wildlife? Check the appropriate risk classification by aligning the most suitable likelihood of pollution with the corresponding consequence. Consequence
(Use the consequence
assigned in Part A
Likelihood of Pollution From This Source (Refer to Table 2 of SI instructions for further definitions of likelihood)
Rare (May occur only
Unlikely (Unlikely to
Possible (Might occur at
Likely (Will probably
Almost Certain (Will occur on a

204
Section 3) in exceptional circumstances e.g. >5 years)
occur but could occur
at least once within a 5
year period)
least once or twice per
bathing season)
occur at least 3 – 4 times per
bathing season)
regular basis e.g. once a week)
Minor Very Low risk
Very Low risk
Very Low risk
Very Low risk
Low risk
Moderate Very Low risk
Very Low risk
Very Low risk
Low risk Moderate risk
Major Very Low risk
Very Low risk
Low risk Moderate risk
Moderate risk
Note: Table modified due to decrease in potential public health risk that aquatic birds etc. may present to humans. From your knowledge of the recreational water body, do you believe the above risk classification is a true representation of this risk? Yes No If No, justify answer (Use Table 5 of the Sanitary Inspection Report Instructions for guidance where historical enterococci data is available):
Based on the ‘No’ answer above, what risk classification would you assign?
Risk Classification for Wildlife: Very low risk
Domestic Animals Is the area used as an animal exercise site? (Includes areas where domestic animals are commonly exercised even if not permitted) Yes No. If No, refer to Section 8.3. If Yes, what types of animals? Dogs Horses Other (specify):
Are dog waste bags supplied? Yes No Do animals directly access the recreational water body? Yes No Using the risk matrix below, what is the potential risk to human health from exposure to faecal pollution from wildlife? Check the appropriate risk classification by aligning the most suitable likelihood of pollution with the corresponding consequence. Consequence
(Use the consequence
assigned in Part A
Section 3)
Likelihood of Pollution From This Source (Refer to Table 2 of SI instructions for further definitions of likelihood)
Rare (May occur only in exceptional circumstances e.g. >5 years)
Unlikely (Unlikely to occur but
could occur at least once
within a 5 year period)
Possible (Might occur at least once or
twice per bathing season)
Likely (Will probably
occur at least 3 – 4 times per
bathing season)
Almost Certain (Will occur on a
regular basis e.g. once a week)
Minor Very Low risk
Very Low risk
Very Low risk
Very Low risk
Low risk
Moderate Very Low risk
Very Low risk
Very Low risk
Low risk Moderate risk
Major Very Low risk
Very Low risk
Low risk Moderate risk
Moderate risk
Note: Table modified due to decrease in potential public health risk that domestic animals etc. may present to humans. From your knowledge of the recreational water body, do you believe the above risk classification is a true representation of this risk? Yes No

205
If No, justify answer (Use Table 5 of the Sanitary Inspection Report Instructions for guidance where historical enterococci data is available):
Based on the ‘No’ answer above, what risk classification would you assign?
Risk Classification for Domestic Animals: Very Low Risk
Agricultural Animals Are any of the following agricultural animals located within a 2km radius of the catchment?
None Poultry Cattle Pigs Sheep Other (specify):
If none fill out the highest ranked risk classification for Section 8
Risk Classification for Agricultural Animals: n/a
Do agricultural animals only present a risk following wet
weather only? n/a
Based on animals identified in Section 8.1, 8.2 and 8.3, you need to rank the overall highest ranked risk classification for all animals identified. Where runoff from agricultural animals only presents a risk following wet weather you need to rank this separately as it will affect your final sanitary inspection category.
Highest Ranked Risk Classification for Animals
– 8.1, 8.2 & 8.3 (not including
8.3 if wet weather only):
Very Low Risk
If applicable, Risk Classification for
8.3 wet weather only: n/a
9. Other Faecal Sources
Provide details of any other faecal sources that are likely to impact on the recreational water body: n/a
Using the risk matrix below, what is the potential risk to human health from exposure to pollution from other faecal pollutant source(s)? Check the appropriate risk classification by aligning the most suitable likelihood of pollution with the corresponding consequence. Consequence
(Use the consequence
assigned in Part A
Section 3)
Likelihood of Pollution From This Source (Refer to Table 2 of SI instructions for further definitions of likelihood)
Rare (May occur only in exceptional circumstances e.g. >5 years)
Unlikely (Unlikely to occur but
could occur at least once
Possible (Might occur at least once or
twice per bathing season)
Likely (Will probably
occur at least 3 – 4 times per
bathing
Almost Certain (Will occur on a
regular basis e.g. once a week)
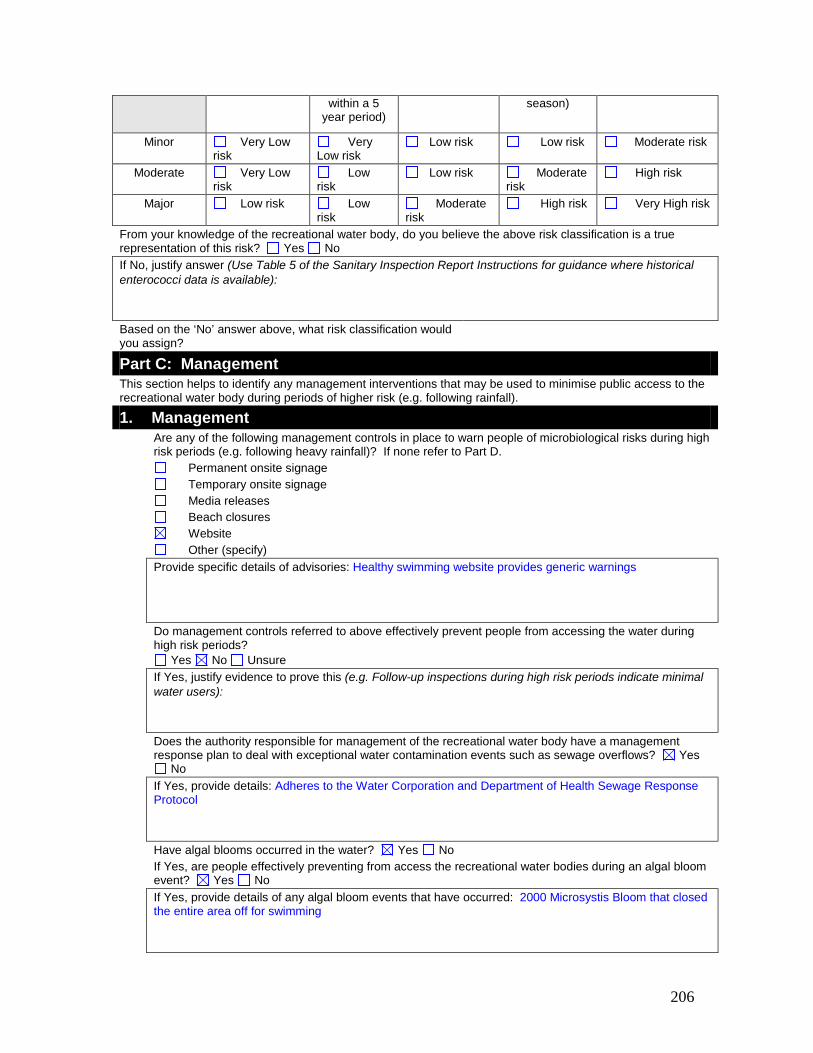
206
within a 5 year period)
season)
Minor Very Low risk
Very Low risk
Low risk Low risk Moderate risk
Moderate Very Low risk
Low risk
Low risk Moderate risk
High risk
Major Low risk Low risk
Moderate risk
High risk Very High risk
From your knowledge of the recreational water body, do you believe the above risk classification is a true representation of this risk? Yes No If No, justify answer (Use Table 5 of the Sanitary Inspection Report Instructions for guidance where historical enterococci data is available):
Based on the ‘No’ answer above, what risk classification would you assign?
Part C: Management This section helps to identify any management interventions that may be used to minimise public access to the recreational water body during periods of higher risk (e.g. following rainfall).
1. Management Are any of the following management controls in place to warn people of microbiological risks during high
risk periods (e.g. following heavy rainfall)? If none refer to Part D. Permanent onsite signage Temporary onsite signage Media releases Beach closures Website Other (specify) Provide specific details of advisories: Healthy swimming website provides generic warnings
Do management controls referred to above effectively prevent people from accessing the water during high risk periods?
Yes No Unsure If Yes, justify evidence to prove this (e.g. Follow-up inspections during high risk periods indicate minimal
water users):
Does the authority responsible for management of the recreational water body have a management response plan to deal with exceptional water contamination events such as sewage overflows? Yes
No If Yes, provide details: Adheres to the Water Corporation and Department of Health Sewage Response
Protocol
Have algal blooms occurred in the water? Yes No If Yes, are people effectively preventing from access the recreational water bodies during an algal bloom
event? Yes No If Yes, provide details of any algal bloom events that have occurred: 2000 Microsystis Bloom that closed
the entire area off for swimming

207
Part D: Sanitary Inspection Category (SIC) This section is used to assign a final sanitary inspection category to the recreational water body. It reviews individual risk classifications for each faecal source, and ranks the overall highest ranked classification from all faecal sources to assign a SIC for both dry and wet weather conditions.
1. Sanitary Inspection Category (SIC) Fill in the corresponding risk classifications for each pollutant source (using the highest ranked risk)
identified throughout Part B of the sanitary inspection report. Where a particular source is not present write N/A.
SOURCE (Part B)
Risk Classification (Use the highest risk
classification identified for each Section under Part
B, If not present write N/A)
SOURCE (Part B)
Risk Classification (Use the highest risk
classification identified for each
Section under Part B)
1. Bather Density Very Low 6. Riverine discharge N/A 2. Bather Toilet
Facilities Very Low 7. Boats Moderate
3. Discharge of Wastewater (highest ranked risk)
Low 8. Animals 8.1 & 8.2 (highest ranked risk) 8.3 wet weather only
Very Low
4. Stormwater discharge Dry weather Wet weather
Moderate 9. Other faecal sources
N/A
5. Rainfall runoff Moderate
1.1 Dry Weather Sanitary Inspection Category (SIC) List the highest ranked risk classification identified from the above table from Part B Sections 1, 2, 3, 4
(dry weather only), 6, 7, 8 and 9. Exclude Part B Section 4 and 8.3 where the source only presents a risk during wet weather.
Dry Weather Sanitary Inspection Category: Moderate
1.2 Wet Weather Sanitary Inspection Category (SIC) List the highest ranked risk classification identified from the above table from Part B Sections 4 (wet
weather), 5, 8.3 (wet weather only) and 9.
Dry Weather Sanitary Inspection Category: Moderate
1.3 Effectiveness of Management Controls Do management controls effectively prevent people from accessing the water during and following wet
weather events? Yes No
If No, the wet weather sanitary inspection category identified above (1.2) should be accepted as the assigned sanitary inspection category.
If Yes, the dry weather sanitary inspection category identified above (1.1) should be accepted as the assigned sanitary inspection category.
Assigned Sanitary Inspection Category: Moderate

208
2. Actions / Further Investigation Notes What actions/further investigations are required to provide additional evidence to demonstrate microbial
water quality for the recreational water body?
A. Follow-up with Water Corporation regarding the following questions: Status: Outstanding In relation to the Mend Street, South Perth Pump Station please confirm the following: 1. Is the pump station fitted with emergency overflow alarms? 2. When was the last time the pump station alarm was checked for compliance? 3. How often is the pump station alarm checked for compliance? 4. In the event that pumping station overflow alarms fail, where will wastewater be diverted? B. Follow-up with City of South Perth regarding the following questions: Status: Outstanding I) Toilet Sewage System Please indicate whether you are aware of any discharges, leakages or odours been recorded from the toilet sewerage system at Coode Street. II) Septic Tanks 1. Please confirm and provide appropriate details as to whether the Scout Hall located adjacent to the boat ramp at Coode Street Jetty, or any other buildings located at Coode Street utilise septic tank and leach drain or other on-site wastewater systems? 2. If yes, please confirm whether any discharges, leakages or odours been recorded from the sewerage system? III) Stormwater 1. Are any of the storm-water drain’s located at Coode Street, South Perth fitted with pollutant trap’s? IV) Boats 1. What is the maximum number of boats/vessels that are likely to be anchored/moored at any given time at the Mend Street, or Coode Street Jetty’s? 2. How do boats which are located at Mend Street or Coode Street jetty’s wastes generally dispose of sewage wastes? C. General I) Rainfall & Stormwater Drains Status: Outstanding 1. Undertake monitoring of the recreational water body sampling site following rainfall events. 2. Undertake bacterial monitoring from stormwater drain when flowing and/or during or immediately following rainfall. II) Other Information Rqd Status: Outstanding Photo’s of Landuse: Catamarans, Restaurant, Car-park, Toilet Facilities at Coode Street, Mend Street Jetty, Gardens & Playgrounds, Boat Ramp.

209
Appendix 10: Email circulated to
Australian State and Territory
Government Agencies requesting
feedback on the SI report form

210
Email sent on the 9 May 2008:
Feedback on the Microbial Quality of Recreational Waters Guidance Notes With the end of many summer sampling programs it is now the ideal time to revisit the Microbial Quality of Recreational Water Guidance Notes that were circulated in December 2007 (download from http://www.healthyswimming.health.wa.gov.au/publications/index.cfm). Hopefully you or your colleagues have had the opportunity to trial the guidance notes during the bathing season. The Western Australian Department of Health is interested to hear your feedback, particularly on the use of the Enterotester, trigger levels and the practicality of the sanitary inspection form. The types of feedback we are interested in include: Sanitary Inspection Form (Appendix 1) 1. Was the format e.g. font, style, layout, of the sanitary inspection (SI) form easy to follow. If no, how
could it be improved? 2. Was the SI form practical to apply to a recreational water body? If no, what would you change? 3. Did the SI form have too much or too little detail? What should be included or excluded? 4. Did the final SI classifications accurately match the microbial quality of the water when compared to
historical results? 5. Could the SI form be applied to a variety of recreational water bodies? 6. Have you compared this SI form with any other SI methodologies eg the WSAA guidelines. If yes,
how did it compare in its practicality? Enterotester 1. Was the enterotester simple to operate? If no, can you suggest ways it could be improved? 2. Were the enterotester instructions (appendix 4) easy to follow? If no, can you suggest ways they could
be improved? Trigger levels (page 5-7)

211
1. What is your opinion on site specific trigger levels (pg 5 of the Guidance notes)? 2. Did you apply site specific triggers to any sites? If yes, did they correlate with any pollution events or
illness? 3. What is your opinion on generic trigger levels (page 6)? 4. Did you apply the generic triggers to any sites? If yes, did they correlate with any pollution events or
illness? Other Have you any other comments you would like to make about the overall application of chapter 5 of the NHMRC guidelines Your feedback would be appreciated by July 10th 2008 and should be emailed to [email protected] or contact (08) 9388 4997. All feedback will ensure the revised Guidance Notes are as practical to the Australian setting as possible.

212