validating simulation tools for vehicle system studies ... -...
TRANSCRIPT

1
Validating Simulation Tools for Vehicle System Studies Using Advanced Control and Testing Procedure
Maxime Pasquier, Mike Duoba, and Aymeric Rousseau Argonne National Laboratory
Abstract
Hybrid electric vehicles (HEVs) offer the potential to increase propulsion system efficiency and decrease pollutant emissions relative to conventional vehicles. The U.S. Department of Energy (DOE) and the auto industry are developing HEV technology as part of the Partnership for a New Generation of Vehicles (PNGV) program. Argonne National Laboratory supports the DOE in this program by
contributing to technical target setting and evaluating new technologies in a vehicle systems context.
In this role, ANL has developed a unique set of interrelated tools and facilities to analyze, develop, and validate components and propulsion systems in a vehicle environment. Vehicle systems are analyzed using the PNGV System Analysis Toolkit (PSAT), a forward-looking (i.e., driver-to-wheels) model written in MATLAB/SIMULINK environment to realistically characterize transient component behavior in a wide range of HEV configurations. PSAT-PRO, a control code based on PSAT models, was developed to support component control in the Advanced Powertrain Test Facility (APTF). This direct connection between modeling and simulation software (analysis), control software (development), and the APTF (testing and validation) offers the opportunity to streamline technology development through continual feedback and refinement.
Validation is an indispensable part of the process – providing the reality check between hardware development/testing and modeling. This paper describes the testing methodology used to validate PSAT using special equipment and procedures for components and vehicles in the APTF.
Keywords: HEV (hybrid electric vehicle), modeling, simulation, control system, HIL, instrumentation.
Validation In an Integrated Development Process
Figure 1: Integrated development process
Argonne National Laboratory (ANL) uses an integrated process to perform systems analysis – from requirements definition through development and validation (Figure 1). The process reduces wasted effort in progressing from modeling and simulation to implementation, testing, and validation by removing the barriers associated with communication, data transfer, unnecessary code generation, or software changes.
The enablers for the integrated process are the tools that ANL has developed to generate data, feed component models, analyze vehicle powertrain systems, perform testing using control tools, and produce results that validate the models. An important common thread of

these tools is model validation. The usefulness of a model can only extend to the limits of confidence based upon rigorous validation of the models. Hence, this paper demonstrates how advanced control and testing procedures were used to validate the PNGV System Analysis Toolkit (PSAT) and the inherent benefits of an integrated process.
1.1 Analysis Using PSAT PSAT is a powerful modeling tool for analyzing hybrid electric vehicle (HEV) systems. The model was created as a result of the Partnership for a New Generation of Vehicles (PNGV), a cooperative effort between the auto industry and the U.S. government. PSAT allows users to realistically evaluate not only fuel consumption and exhaust emissions for several driving cycles, but also vehicle performance. One of the most important characteristics of PSAT is that it is a forward-looking model – it simulates a vehicle system from the driver to the wheels, with realistic control commands. Advanced component models react to these commands, taking into account transient effects (such as engine startup, clutch engagement/disengagement, or shifting), and realistic control strategies can be developed.
The strengths of PSAT are in its modular nature and its flexibility to easily model configurations such as those in this paper and more complex hardware arrangements (for example, a split parallel) without rewriting code. Indeed, the validity and accuracy of the model is extremely important when simulation results provide the basis for analysis, and also when the control command code developed in PSAT becomes the instructions for component control in ANL’s PSAT-PRO tool.
1.2 Development Using PSAT-PRO To make the bridge between modeling and testing, ANL staff developed a HEV control tool called PSAT-PRO. The ease of configuration design and parameter initialization defined in PSAT is converted to code used in PSAT-PRO in just a few moments. Using PSAT, we decide how to command each component in an optimal way to reach the operator commands. Then, the PSAT control strategy can easily be transferred into PSAT-PRO. This integration facilitates the study of real-world system behavior. PSAT-PRO control software can be used to test and validate control designs in a real-time environment. A validated simulation tool is the basis for a development environment tool such as PSAT-PRO.
2 Validating a Forward Systems Model
2.1 Definition of Validation To produce credible simulation results the simulated environment must be realistic and validated using accepted practices. Model validation should be performed at the lowest level that can be supported by test data in addition to the vehicle level to build confidence that the models can be used for vehicles other than the specific one(s) used for validation.
Confidence in a model should be based on the accuracy of the model relative to test data, and the repeatability of the test data should be considered as well. For example, if a model yields results with 3% error versus test data, then conclusions from simulations can only be made when differences are greater than 3%. However, if system response data exhibits a repeatability of only 5%, then the validation error is at least 5%.
system I1
On Stimulus Response
I2 In
O2
O1
Figure 2: Component characterization
Since PSAT is a forward model, components are characterized by inputs (stimulus) and outputs (response) that can be tested in a “realistic” manner: components can be tested for an expected response given a prescribed input (Figure 2). If the inputs and outputs of a component or subsystem can be isolated
and accurately measured, the subsystem or component can be validated separately. This is not always possible in an assembled propulsion system or vehicle, but special laboratory instrumentation can be developed or applied in certain cases (example in the next section).
collected accordingly; however, model validation is not possible because correct vehicle-level results could result from compensating component-level errors. This reinforces the concept that the level of confidence in a system model should be based on component-level validation results.
Two stages of validating a vehicle model are employed: component and complete drivetrain. To validate a component model, data measured at the input of the component are fed directly into the component model and the simulated output is compared with the measured output. For maximum accuracy, the components should be validated individually, followed by validation of the complete drivetrain model. Validation of the drivetrain model involves testing the vehicle on several cycles and initial conditions. The results are then compared with the simulated results.
2.2 Specialized Vehicle Testing for Model Validation
2.2.1 Vehicle System Layout and Instrumentation
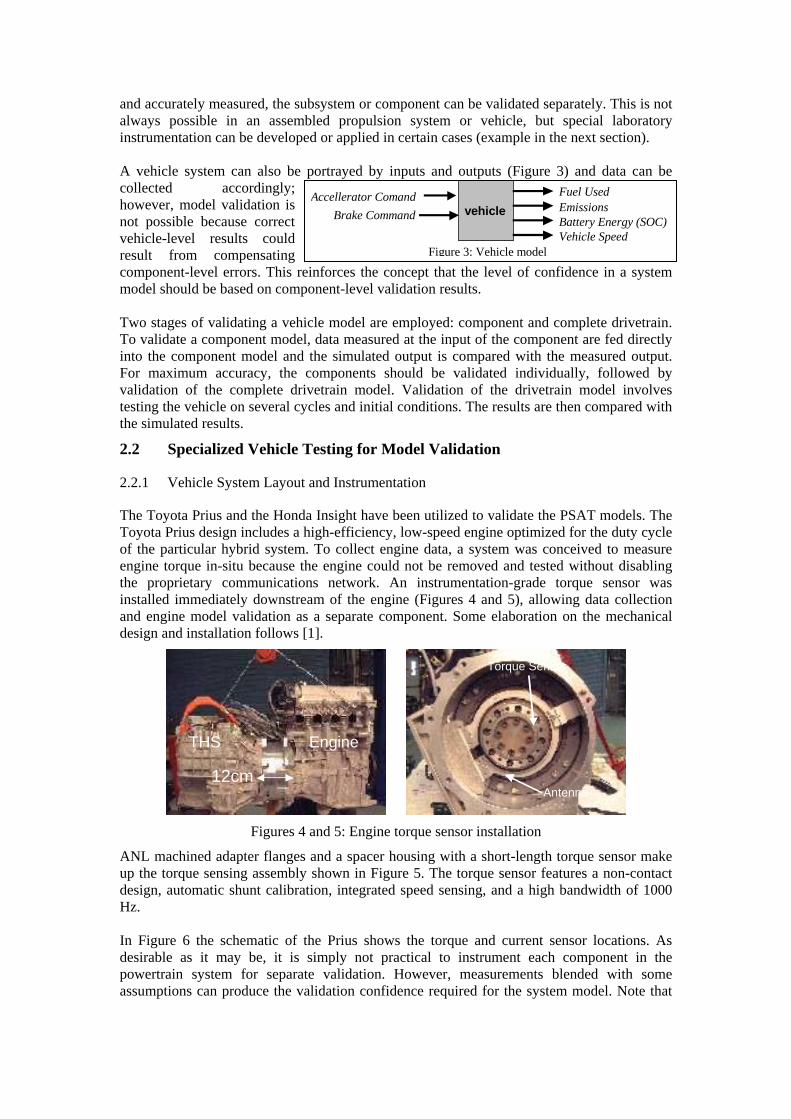
The Toyota Prius and the Honda Insight have been utilized to validate the PSAT models. The Toyota Prius design includes a high-efficiency, low-speed engine optimized for the duty cycle of the particular hybrid system. To collect engine data, a system was conceived to measure engine torque in-situ because the engine could not be removed and tested without disabling the proprietary communications network. An instrumentation-grade torque sensor was installed immediately downstream of the engine (Figures 4 and 5), allowing data collection and engine model validation as a separate component. Some elaboration on the mechanical design and installation follows [1].
A vehicle system can also be portrayed by inputs and outputs (Figure 3) and data can be
vehicle Accellerator Comand
Brake Command
Fuel Used Emissions Battery Energy (SOC) Vehicle Speed
Figure 3: Vehicle model
12cm
Engine THS
Torque Sensor
Antenna
Figures 4 and 5: Engine torque sensor installation
ANL machined adapter flanges and a spacer housing with a short-length torque sensor make up the torque sensing assembly shown in Figure 5. The torque sensor features a non-contact design, automatic shunt calibration, integrated speed sensing, and a high bandwidth of 1000 Hz.
In Figure 6 the schematic of the Prius shows the torque and current sensor locations. As desirable as it may be, it is simply not practical to instrument each component in the powertrain system for separate validation. However, measurements blended with some assumptions can produce the validation confidence required for the system model. Note that

Added Torque
Final Drive
Generator
Motor Engine Brakes
and Wheels
0
Sensor
Battery i i
Current Sensors
DC/DC Conv ii
Figure 6: Layout of the Toyota Prius
The entire Prius powertrain system shown in Figure 6 can be reduced to the sections shown in
Torque Command
Given Rotational Speed
all component speeds and the high-voltage bus were measured to reveal the interaction among the engine and generator speeds.
The Prius engine model was validated with the data collected during vehicle testing. The fuel and emissions maps were based on measured steady-state engine data and used in the standard engine model. To model transients, ANL is developing transient engine and emissions-predictor modules from data collected at 10 Hz (Figure 7).
Engine Fuel Consumption Rate Torque Output Emissions Rate
Figure 7: Engine model validation Figure 8 in dashed boxes. These discrete boxes were validated separately and the overall vehicle system was validated.
The Honda Insight powertrain is not as complex as the Prius, but the electric motor is closely coupled to the engine. A less desirable torque sensor location was necessitated – on the axle shafts – providing torque data on the complete powertrain (Figures 9 and 10). The engine torque can be roughly estimated using assumptions for transmission losses.
Powertrain, Tires, Brakes
Engine ()
Battery i i i
Dyno
Figure 8: Toyota Prius subsystem models validated
Torque sensor
Engine I M A
5-Speed Final Drive
Clutch Wheels & Brake τ
Battery DC/DC Conv
i
i
Figure 9: Axle shaft torque sensor Figure 10: Honda Insight subsystems validated
2.2.2 Validating Vehicle Losses on a Chassis Dynamometer
The first step in validating the model with chassis dynamometer tests is dialing in the correct road-load setting. This can be done by using certification road-load settings or performing on-road coast downs. Performing coast-down tests is preferred because the coast-down procedure can be simulated with the model and the results compared and validated.

Engine Clutch Transmission Final Drive
Road and Areo
force acting on vehicle
Faero
Frr front Frr rear
Faccel
τ
Ftotal = τ x reff
Fgrade
Figure 11: Vehicle losses on road and on dynamometer
Brake and Wheels
On Road: Ftotal = Faero + Frrfront + Frrrear + Faccel Eq1 On Dyno: Ftotal = Fdyno + F’rrfront + Faccel Eq2 F’rrfront: rolling resistance of front axle
Emulating vehicle losses with a two-wheel drive dynamometer requires careful tracking of the vehicle forces. In a simple powertrain shown in Figure 11, at a steady-state vehicle speed, there is a force by the powertrain (Ftotal) to keep the vehicle at that speed (see Equation 1 in Figure 11). On the road this force is equal to the sum of the aerodynamic drag of the vehicle (Faero), the forces acting from the front axle
(Frr front), and those from the rear axle (Frr rear). Axle losses include tire, brakes, and bearing losses. The Fgrade is set to zero because all vehicle testing was done assuming a zero grade.
For a front-wheel-drive vehicle on a two-wheel-drive dynamometer at a steady speed, the total motive force is equal to the force of the dynamometer at that speed (Fdyno) and the rolling resistance force of the front axle on the dynamometer rolls (F’rr front). The rolling resistance of the driven axle is typically higher on the dynamometer than on a flat road surface. For electric dynamometers, the dynamometer force curve is a polynomial equation that is a force value with respect to vehicle speed, F = a + bv + cv2, where F is the force and v is vehicle speed. The dynamometer force is a correcting factor that is not the vehicle road load, but is the difference between the road load on the road with all four wheels turning and the dynamometer with only one axle turning. It is therefore possible for the dynamometer road load to have a peculiar shape that may at some point dip below the x-axis (a negative force) [2].
Using good, repeatable coast-down data for setting the dynamometer road load and validating the vehicle model is very desirable. The procedures for coast-down testing can be found in Society for Automotive Engineers Standard J1263. Simply put, the procedure involves driving the vehicle under its own power to about 65–70 mph and placing the powertrain in neutral. Neutral gear is the near equivalent to forcing the powertrain torque (τ) to zero. In this case, Faccel is equal to the sum of Faero, Frr front, and Frr rear. On the dynamometer, the time/speed coast-down results are matched through iteration of the dynamometer force setting. The same coast-down procedure is performed in simulation and the vehicle model parameters are adjusted until a time/speed match is made.
In the case of the Honda Insight, the dynamometer road load and tire losses were not explicitly known. For the model validation it was important to ensure that the powertrain loads were exactly the same on the dynamometer as in the simulation.
2.2.3 Drive Cycles Used for Validation
To validate a vehicle and all its components, the model is dialed in and calibrated with a wide variety of cycles. The validation procedure starts with the most fundamental cycles and the process moves to more varied and transient cycles. The first cycle used is shown in Figure 12. This is a cycle of steady-state speeds that is used to check the road-load setting and the steady operation of the instrumented components. For example, the engine model can be checked for accurate speed, torque, and fuel consumption rate under the various load conditions. In the case of the Prius, this cycle was run at varying acceleration rates to observe and capture the engine on/off behavior.

Axle force [N]Curve FitAxle force [N]Curve Fit
20 40 60 80 100 120 140 1600
5
10
15
20
25
30
time (sec)
Vehicle Speed (m/s)
Figure 12: First cycle used for validation
y = 0.26x 2 + 0.3839x + 141.34
0
50
100
150
200
250
300
350
400
0 10 20 30
Vehicle Speed [m/s]
For ce [N]
Road load curve
y = 0.26x2 + 0.3839x + 141.34350
400
0
Axle force [N] Curve Fit
Figure 13: Road load curve
In the case of the Honda Insight, the dynamometer road load and tire losses were not explicitly known. For validation of the powertrain it is important to ensure that the load at the axle is exactly the same on the dynamometer as it is in the simulation. The steady-state cycle test provided the torque data at the axle shaft; this load was substituted for the loads simulated in the vehicle model (Figure 13).
After the model has been validated in steady-Vehicle Speed (m/s) state, the next cycles to run are the Japan 10-
15 mode and the European Union Dynamometer Cycle (EUDC) (Figure 14). The European and Japanese cycles are well suited to understanding the vehicle control strategy
because of their constant acceleration profiles. Once the control strategy is tuned on these less
transient cycles, the process moves to the Federal Urban Dynamometer Schedule
200 400 600 time (sec)
800 1000 1200 (FUDS) and the Federal Highway Dynamometer Schedule (FHDS).
0
5
10
15
20
25
30
35
Figure 14: EUDC cycle
In the case of HEVs, the initial battery state-of-charge (SOC) is vitally important to the outcome of the results. Because of this, ANL’s validation procedure includes collecting data from at least three different SOC levels: (1) at the SOC the vehicle will equilibrate to when driving the cycle over and over, (2) at a slightly higher SOC, and (3) at a slightly lower SOC. The SOC is manipulated by having the driver perform particular accelerations and braking the vehicle starting each cycle at SOC of the battery on the system. Each of these cycles has to be realized for a different SOC. In the case of the Prius, slow accelerations followed by quick decelerations will raise the SOC. Abrupt accelerations then selecting neutral (no regenerative braking) for the deceleration will lower the SOC.
2.2.4 Component and Subsystem Validation We consider a vehicle model validated only when all the component model predictions are in agreement with the test data. To validate a single component, the data measured during a drive cycle are fed directly into the component model, and the simulated output is compared with the measured data. If there are errors in individual component models, this method will easily expose them.

Drive cycle
Measured fuel
economy (mpg)
Simulated fuel
economy (mpg)
Difference (%)
Initial SOC (%)
Measured final SOC
(%)
Simulated final SOC
(%)
Difference (%)
JP 10-15a 57.95 58.8 1.5 59.6 61 61.1 0.16 NEDCb 60.65 60.25 0.66 60 60.2 58.3 3.26 FHDSc 74.25 75.3 1.4 59 58.8 58.9 0.17 UDDSd 58.3 57.85 0.8 72.8 70.6 72 2
a Japan 10-15 mode cycle b New European Driving Cycle. c Federal Highway Dynamometer Schedule (EPA Highway). d Urban Dynamometer Driving Schedule (EPA Urban).
14Measured Measured Simulated Simulated
12 62
10 61
8
60
6
594
582
0 57 100 200 300 400 500 600
800 850 900 950 1000 1050 Time (s)
Figure 15: Simulated Fuel Consumption Compared to Figure 16: Simulated SOC versus measured SOC during a
Measured Data Japan 10-15 cycle
Figure 15 shows validation results of the Prius engine fuel consumption. The engine model is, indeed, showing excellent agreement in steady and transient portions of the cycle. Other models such as the battery can be validated in this manner by looking at the simulated torque output and tracking voltage and current throughout the drive cycle.
Once the components have been validated independently, the last step is to integrate a control strategy into the PSAT model that provides the correct powertrain operation and subsequent fuel economy and electrical energy usage results for all the cycles driven. Figure 16 shows the response of the battery SOC during a simulation, compared with the test data. Agreement of both SOC and fuel consumption is necessary because of the high sensitivity these parameters have to each other.
The results of the PSAT Insight model validation work (Table 1) show that both fuel economy and SOC have been validated on different driving cycles and with different initial SOC. Moreover, the correct amount of assist was given at the right time, and regenerative braking and the battery charging were taking place as expected. The results of the simulations were consistent with those from the actual tests. We can then affirm that the Honda Insight PSAT model has been validated.
SO
C (%
)
Table 1: Honda Insight Validation Results
Validation typically consists of demonstrating that the models represent the system and the real-world operational environment with acceptable accuracy. The standard approach is to compare test results. The ANL approach also includes validation of the control system model using a powertrain controlled with PSAT-PRO [3].
2.3 Advanced Powertrain Testing for Model and Control Validation
2.3.1 Requirements for Model and Control Validation
In addition to a vehicle test, another way to provide model validation is to develop a powertrain composed of the components we want to validate. The required instrumentation is

Engine Clutch Transmission Final Drive Vehicle
Real Time System Controller
Forward-Looking Models
Component Under Test
Figure 17: Forwarding-looking models and hardware
easier to implement in this case. The data collected can be compared to the simulation results for component model validation.
Using PSAT-PRO control software, we do not have to test all the components of the powertrain. We can control the part of the drivetrain that needs to be validated and simulate the other components using already validated models.
This advanced testing procedure requires dynamic models that simulate the remainder of the system under validation. The models need to accurately represent the behavior of the real components and be well suited for control purposes. Forward models are the only possible
approach to fulfilling these requirements. Figure 17 shows that forward-looking component models can be controlled by exactly the same controller as the component being tested. The model reacts to a command by providing a speed output when the inertia of the component is simulated, or a torque output when both inertia and stiffness of the shaft are taken into account in the model.
To obtain good validation results, we must use only validated component models to simulate the part of the vehicle that is not being tested. Component models that have been validated through a traditional test using our Advanced PowerTrain Facilities (APTF) can be used to validate other component models.
Because we are assembling our own powertrain, we can validate the control that has been developed in simulations using PSAT. During vehicle testing, we cannot control all of the components; but using PSAT-PRO and the assembled powertrain, we can reproduce the PSAT controller for validation.
This type of validation involves running the system through a procedure that is identical to the one that was performed in simulation. The results are then compared and any differences are analyzed to determine whether they represent a significant deviation between the simulation and the real world. The link between the modeling software PSAT and the control software PSAT-PRO facilitates this comparison.
If the simulation results do not accurately match the test results, improving the fidelity of the simulation modeling in particular areas may be necessary. Defects become apparent when comparing simulation results to test results. If changes must be made to correct problems, we must rerun any tests that have already been performed to confirm adequate simulation performance.
After all deviations between the performance of the system in simulation and under testing have been reduced to an acceptable level, the model is considered validated.
2.3.2 Powertrain Layout
The powertrain studied for validation is composed of innovative components. The models of those components have not yet been validated. Therefore, only the vehicle losses -based on validated equations- can be simulated. The drivetrain, a pretransmission parallel hybrid with a

continuous variable transmission (CVT), is connected to a dynamometer, which simulates the vehicle losses.
The CVT offers control that surpasses the capabilities of the conventional multispeed transmission. This HEV configuration with the CVT and paralleled electric motor allows advanced controls to isolate vehicle powertrain demands from the operation of the engine. Engine torque demand is mediated by the motor torque and engine speed is controlled by the CVT ratio.
Piston engines tend to have optimum performance and efficiency within narrow RPM ranges. The more gears a vehicle has, the easier it is to use the best RPM range for the desired purpose. The CVT provides the vehicle with an infinite number of gear ratios to select from during driving, allowing the engine to be kept in the optimum RPM range for any driving demand. Therefore, the CVT can theoretically provide any vehicle with more power and better fuel economy from the same engine in a vehicle with a multispeed transmission.
The torque converter of the CVT has been removed; it is not needed because a clutch is be used. The reverse planetary gear has also been removed because HEVs with electric-only capabilities can use the electric motor for reverse. The oil pump is removed because CVT efficiency can be dramatically improved by using a dedicated on-demand, off-board pump (Figure 18). An aluminum block replaces the oil pump and maintains the oil circuit of the rest of the CVT.
Figure 18: Removal of the CVT oil pump
Figure 19: Engine Mercedes-Benz 170
CIDI
The engine we have selected is a 1.7L Mercedes common rail, direct injection (Figure 19). This engine is one of the first mass produced common rail diesel engines produced in the world. The possibility of using this type of engine in future vehicles of both conventional and hybrid configurations is considered significant and therefore worthy of analysis.
The motor we have selected is a permanent magnet traction drive system from Unique Mobility (UQM) (Figure 20). This system has been upgraded by UQM to produce 45 kW instead of 32 kW. This was done through software and increased current supplied to the motor by the inverter. The motor has regenerative braking capability and a high energy efficiency. The assembly shown here utilizes aluminum in nearly all the coupling flanges and pulleys to lower the inertia of the entire rotating system, which would not have as many components in the vehicle. The inertia of the whole system has been set to be realistic and to be in accordance with the inertia used in PSAT.
With the clutch disengaged, thus removing the engine from the rest of the powertrain, the CVT can be used to provide regenerative braking at high levels of utilization. During braking, the motor can be allowed to stay at a speed that does not limit the torque during the braking event. The pretransmission parallel with the CVT allows us to maintain the greatest amount of
Figure 20: Motor UQM 45 kW

control of the engine and motor to accomplish the goal of lower CIDI vehicle-level emissions in an HEV without sacrificing fuel economy.
2.3.3 Extensive Instrumentation for Model Validation Component by Component
The whole drivetrain has been instrumented to allow a validation of each component. Three torque and speed sensors are necessary: one on the motor shaft, one on the input shaft of the CVT, and one on the output shaft of the CVT, as shown on Figure 21.
To measure the CVT inputs without modifying the behavior of this component, we integrated a flat torque
sensor. The bell-housing of the CVT transmission had to be modified to mount the HBM T-10F flat torque sensor for measured CVT input torque. Flanges that mate to the splined shaft and the engine output are also machined (Figure 22).
2K N-m Torque Sensor
500N-m Torque Sensor
Engine
Dyno
4:1 Shaft Speed Increaser Inertia
Disk Brake
2K–5K N-m Torque Limiter
200 N-m Torque Sensor
CVT
Motor
Figure 21: Instrumentation of the drivetrain
Receiver for T-10F torque sensor
CVT bell housing Torque sensor
Figure 22: Instrumentation of the CVT
2.3.4 Control Principle Reproducing PSAT Decisions
The pretransmission parallel with the CVT allows us to maintain the greatest amount of control of the engine and motor to reduce emissions and increase fuel economy. However, to achieve this goal, the control strategy takes a crucial role. So, to complete the PSAT model validation, it is important to be able to control this drivetrain using the PSAT control strategy. Figure 23 depicts how we control the drivetrain and the dynamometer to test this configuration in a system context and in accordance with the control strategy developed in PSAT.
Inertia Clu tch
Motor
Engine
Wheel Speed DC Source/Sink
Brake
i
CVT Transmission & Final Drive
Road Load Dynamometer
Real Time System Controller
Powertrain Vehicle
Figure 23: Control principle of the HIL CIDI CVT powertrain

To validate the PSAT pretransmission parallel model with the CVT configuration assembled on the test stand, we simulate the actual acceleration and brake pedal position of a driver following a cycle. This information provides the input of the control strategy developed in PSAT. The outputs are the commands to send to the various components (i.e., engine, clutch, motor, CVT, brake) to reach the expectations of the simulated driver.
On the other hand, we also measure the drive shaft speed and use the vehicle model to estimate the vehicle losses. This torque loss is sent to the dynamometer as a command. The dynamometer is controlled to perform like a vehicle. We control the dynamometer by applying the resisting torque that would be applied to the drive shaft in the case of a real vehicle (Figure 24). To simulate the vehicle inertia, we add a fixed inertia on the dynamometer shaft (Figure 25). We also control a real disk brake to apply the mechanical braking torque (Figure 26).
Figure 24: Figure 25: Figure 26: Dynamometer to Additional inertia to Disc brake and its actuator to simulate the
simulate the vehicle simulate the vehicle driver commands
For HEVs, engine starts and stops are critical decisions of the control strategy. Each of these events entails an intervention of the clutch. To switch from an electric-only mode to a hybrid mode, the engine should be started and the clutch engaged. This action is particularly delicate, and we have to control the clutch exactly like during a PSAT simulation. A clutch actuator is controlled to apply the PSAT control strategy (Figure 27).
Figure 27: Clutch actuator
Figure 28: Stepper motor
Ratio control Stepper valve stem motor
Ratio control fulcrum
In order to have full control of the ratio and apply the PSAT commands, the stock component had to be modified to add the ratio stepper motor control unit. The stock electronic control unit for the transmission will not be used. A new driver for the stock ratio control stepper motor in the hydraulic control circuit is installed so we can send RS-232 communication for the stepper motor position and command the CVT ratio as the PSAT control strategy has decided (Figure 28).
Conclusion Validation is an indispensable part of simulation development. If the simulation tool is not adequately validated, the results lack credibility and decisions dependent on the analysis carry unnecessary technical risk. In fulfilling its systems analysis and technology validation roles, ANL is utilizing a process that minimizes such risks.
ANL’s tools and facilities enable different types of model validation:
3

• In-situ component testing and model validation – the use of advanced powertrain test facilities and fully instrumented vehicles (i.e., “component-by-component”) allows adequate data collection for model validation.
• Advanced powertrain control – by developing advanced control principles, the PSAT control strategy can be utilized with component dynamometers, and the hardware reactions can be compared with simulation results.
Continuing validation of the models and the process will support efficient component validation. Previously validated models can be used to emulate the powertrain for validating new components and models. For example, validation of the models of the pretransmission parallel hybrid drivetrain with a CVT leads to the next step in the process – installation of an engine on a low-inertia dynamometer – which will be controlled to emulate the validated configuration. This project will allow us to:
• Validate the engine models, • Study emissions reduction from a control system perspective, and • Demonstrate the benefits of diesel engine in a hybrid configuration.
4 References [1] Michael Duoba, Henry Ng, Robert Larsen. In-Situ Mapping and Analysis of the Toyota Prius
HEV Engine, SAE 2000-01-3096, International Congress & Exposition Detroit MI, 2000.
[2] Ward W. Wiers, Terry D. Hostletter. Techniques of Measurement, variations and Effects of Vehicle friction Losses on Electric Dynamometers, SAE Technical Paper Series #830436, International Congress & Exposition Detroit MI, 1983.
[3] Aymeric Rousseau, Maxime Pasquier. Validation of a Hybrid Modeling Software (PSAT) Using Its Extension for Prototyping (PSAT-PRO), Global Powertrain Congress, 2001
5 Authors Maxime Pasquier, Michael Duoba, Aymeric Rousseau, Research Engineer Research Engineer Research Engineer 9700 South Cass Avenue, Bldg 362 9700 South Cass Avenue, Bldg 362 9700 South Cass Avenue, Bldg 362 Argonne, IL, 60439-4815, USA Argonne, IL, 60439-4815, USA Argonne, IL, 60439-4815, USA Phone: (630) 252-9717 Phone: (630) 252-6398 Phone: (630) 252-4815 E-mail: [email protected] E-mail: [email protected] E-mail: [email protected]
6 Acknowledgments This work was supported by the U.S. Department of Energy, under contract W-31-109-Eng-38. The authors are grateful for the support of and guidance by the Partnership for a New Generation of Vehicle (PNGV) and USCAR.
The submitted manuscript has been created by the University of Chicago as Operator of Argonne National Laboratory (“Argonne”) under Contract No. W-31-109-ENG-38 with the U.S. Department of Energy. The U.S. Government retains for itself, and others acting on its behalf, a paid-up, nonexclusive, irrevocable worldwide license in said article to reproduce, prepare derivative works, distribute copies to the public, and perform publicly and display publicly, by or on behalf of the Government.