validating regulatory analysis - archives
TRANSCRIPT

Validating Regulatory Analysis:2005 Report to Congress on the
Costs and Benefits of Federal Regulationsand Unfunded Mandates on
State, Local, and Tribal Entities
2005
Office of Management and BudgetOffice of Information and Regulatory Affairs

Validating Regulatory Analysis: 2005 Report to Congress on the Costs and Benefits of
Federal Regulations and Unfunded Mandates on State, Local, and Tribal Entities
EXECUTIVE SUMMARY ....................................................................................................................1
PART I: 2005 REPORT TO CONGRESS ON THE COSTS AND BENEFITS OF FEDERAL REGULATIONS..................................................................................................................................3
Chapter I: The Costs and Benefits of Federal Regulations......................................................... 5 A. Estimates of the Total Benefits and Costs of Regulations Reviewed by OMB..... 7 B. Estimates of the Benefits and Costs of This Year’s Major Rules ........................ 11 C. Regulations Implementing Federal Budgetary Programs .................................... 16 D. Major Rules for "Independent" Regulatory Agencies ......................................... 18 E. Response to Peer Reviews and Public Comments on the Accounting Statement 19 F. The Impact of Federal Regulation on State, Local, and Tribal Government, Small Business, Wages, and Economic Growth ................................................................. 24 G. Response to Peer Review and Public Comments on Economic Growth and Related Macroeconomic Indicators........................................................................................ 34
Chapter II: Trends in Federal Regulatory Activity ................................................................... 35 Chapter III: Validation of Benefit and Cost Estimates Made Prior to Regulation ................... 41
A. Summary of the Validation Literature ................................................................. 42 B. Nature and Limitations of the Sample of Rules Examined .................................. 47 C. Discussion of Validity Estimates ......................................................................... 48 D. Response to Peer Review and Public Comments on Validation of Benefit and Cost Estimates ................................................................................................................... 50 E. References ............................................................................................................ 52
Chapter IV: Implementation of the Information Quality Act ................................................... 55 A. Correction Requests Processed by Agencies in FY03 and FY04 ........................ 56 B. General Evaluation: Perceptions and Realities .................................................... 63 C. Legal Developments under the Information Quality Act..................................... 67 D. Increasing Transparency under the Information Quality Act .............................. 68 E. Characteristics of an Effective Correction Request.............................................. 70 F. Role of OMB’s New Peer Review Policy ............................................................ 71 G. Response to Peer Reviews and Public Comments on the Information Quality Chapter................................................................................................................................... 72
Appendix A: Calculation of Benefits and Costs ....................................................................... 79 Appendix B: Valuation Estimates for Regulatory Consequences ............................................ 99
A. Adjustment for Differences in Time Frame across These Analyses.................. 101 B. Further Caveats .................................................................................................. 101
Appendix C: The Benefits and Costs of 1992-1994 Major Rules .......................................... 103 Appendix D: Regulatory Reform in the Bush Administration ............................................... 107
A. Update on Regulatory Reforms Initiated During the 2001-2004 Period ........... 107 B. Update on Regulatory Reforms of the U.S. Manufacturing Sector ................... 117
Appendix E: FY04 Information Quality Reports.................................................................... 127 A. Department of Interior: Minerals Management Service .................................... 128 B. Department of the Treasury................................................................................ 130
i

Appendix F: Peer Review and Public Comments................................................................... 135
PART II: TENTH ANNUAL REPORT TO CONGRESS ON AGENCY COMPLIANCE WITH THE UNFUNDED MANDATES REFORM ACT........................................................................................137
Introduction............................................................................................................................. 139 Chapter I: Impacts on State, Local, and Tribal Governments................................................. 141 Chapter II: A Review of Significant Regulatory Mandates.................................................... 143
A. Department of Agriculture ................................................................................. 143 B. Department of Health and Human Services ....................................................... 144 C. Department of Labor .......................................................................................... 144 D. Department of Transportation............................................................................ 145 E. Environmental Protection Agency ..................................................................... 147
Appendix: Agency Consultation Activities Under the Unfunded Mandates Reform Act of 1995......................................................................................................................................... 149
A. Department of Agriculture ................................................................................. 149 B. Department of Commerce .................................................................................. 157 C. Department of Education ................................................................................... 158 D. Department of Health and Human Services....................................................... 159 E. Department of Homeland Security ..................................................................... 163 F. Department of Justice ......................................................................................... 165 G. Department of Labor .......................................................................................... 166 H. Department of Transportation............................................................................ 168 I. Environmental Protection Agency....................................................................... 172
ii

EXECUTIVE SUMMARY
This Report to Congress provides a statement of the costs and benefits of Federal regulations and recommendations for regulatory reforms. A key feature of this report is the estimates of the total costs and benefits of "major" regulations (e.g., rules likely to have an annual effect on the economy of $100,000,000 or more) reviewed by the Office of Management and Budget (OMB). Similar to previous reports, Chapter 1 includes a 10-year look-back of major Federal regulations reviewed by OMB to examine their quantified and monetized benefits and costs:
• OMB reviewed 88 "major" final Federal regulations from October 1, 1994 to
September 30, 2004, for which a substantial portion of the total costs and benefits could be monetized. The estimated annual benefits from these rules range from $69.6 billion to $276.8 billion, while the estimated annual costs range from $34.8 billion to $39.4 billion. A significant portion of both benefits and costs is attributable to a handful of Environmental Protection Agency clean-air rules that reduce public exposure to fine particulate matter.
• During the past year, 11 “major” final rules with quantified and monetized benefits
and costs were adopted. These rules added $12.6 billion to $108.5 billion in annual benefits compared to $3.8 billion to $4.1 billion in annual costs.
• In the past year, there were an additional 15 final “major” rules that did not have
quantified and monetized estimates of both benefits and costs. Seven of these 15 rules implemented homeland security programs where the benefits of improved security are, though real, difficult to quantify and monetize.
In Chapter 2, we report the latest results of our ongoing historical examination of trends
in Federal regulatory activity. Last year's report included preliminary estimates of the overall costs of major rules issued by Federal agencies each year from 1987 to 2003, and also suggested that a better measure of the overall impact of regulation on the economy would be net benefits; that is, benefits minus costs. This year, the cost estimates are extended back to 1981, the beginning of the regulatory review program at OMB. Furthermore, this Report presents both benefit and cost estimates for the years 1992 to 2004. The expanded analysis reveals that we have made great strides towards "smarter" regulation in the past four years:
• Over the last 24 years, the 190 major regulations reviewed by OMB have added at least $117 billion to the overall yearly costs of regulations on the U.S. economy. However, the average yearly cost of the major regulations issued between 2001 and 2004 is about 70 percent less than over the previous 20 years.
• The benefits of the major regulations issued from 1992 to 2004 exceed the costs by
over three fold. Furthermore, the average yearly net benefit of the major regulations issued between 2001 and 2004 is over double the yearly average for the previous
1

eight years. In Chapter 3, we compare the projected benefits and costs of 47 Federal regulations with
benefit and cost information obtained after promulgation and implementation. Our results concerning accuracy of projected estimates indicate that analyses of Federal regulation in our sample tend to overestimate both benefits and costs, but they have a significantly greater tendency to overestimate benefits than costs. Specifically, we found:
• Eighteen rules with accurate benefit estimates, 19 rules with overestimates and two rules with underestimates.
• Twelve rules with accurate cost estimates, 16 with overestimates, and 12 with
underestimates. • Eleven cases of accurate benefit to cost ratios, 22 overestimates, and 14
underestimates. Since the 47 rules are a convenience sample, more research is necessary to determine if these results are generalizable.
In this report, we also include an update of our FY 2003 Information Quality: A Report to Congress. This update includes discussion of the information quality correction requests received by agencies in FY 2003 and FY 2004. This chapter also includes discussion of the perceptions and realities related to some of the major concerns we have heard about Government-wide information quality initiatives. Additionally, we share progress that has been made in increasing agency transparency as well as helpful tips for stakeholders interested in writing an effective correction request.
In addition, we provide an update on the Bush Administration’s regulatory reform activities. We include a progress report on selected regulatory reforms initiated from 2001 to 2004, with a focus on important regulations that agencies have acted on since the final 2004 Report. OMB is also reporting on the progress agencies are making on the 76 reform initiatives identified in OMB’s March 2005 report, Regulatory Reform of the U.S. Manufacturing Sector. In the first year of the manufacturing initiative, agencies reached over 70 percent of their reform milestones.
This final Report was issued in draft form in March of this year and was, as a matter of policy, submitted for and revised in response to public comment, external peer review, and interagency review. OMB has already begun to prepare the 2006 Report to Congress on the Costs and Benefits of Federal Regulations.
2
PART I: 2005 REPORT TO CONGRESS ON THE COSTS AND BENEFITS OF FEDERAL REGULATIONS

I: The Costs and Benefits of Federal Regulations
CHAPTER I: THE COSTS AND BENEFITS OF FEDERAL REGULATIONS
Section 624 of the Treasury and General Government Appropriations Act of 2001, often called the “Regulatory Right-to-Know Act,” (Public Law 106-554, 31 U.S.C. 1105 note) calls for the Office of Management and Budget (OMB) to submit "an accounting statement and associated report" including:
(A) an estimate of the total annual costs and benefits (including quantifiable and nonquantifiable effects) of Federal rules and paperwork, to the extent feasible:
(1) in the aggregate; (2) by agency and agency program; and (3) by major rule;
(B) an analysis of impacts of Federal regulation on State, local, and tribal government, small business, wages, and economic growth; and (C) recommendations for reform.
Since the statutory language does not further define "major," for the purposes of this
Report, we were broadly inclusive in defining "major" rules. We have included all final rules promulgated by an Executive branch agency that meet any one of the following three measures:
• Rules designated as “major” under 5 U.S.C. 804(2);1 • Rules designated as meeting the analysis threshold under 2 U.S.C. 1532;2 and • Rules designated as “economically significant” under section 3(f)(1) of Executive
Order 12866.3
This chapter consists of two parts: the accounting statement, and a brief report on regulatory impacts on State, local, and tribal governments, small business, wages, and economic growth. Part A revises the benefit-cost estimates in last year’s Report by updating the estimates to the end of fiscal year 2004 (September 30, 2004). Like the 2004 Report, this chapter uses a 1 A "major rule" is defined in Subtitle E of the Small Business Regulatory Enforcement Fairness Act of 1996: Congressional Review of Agency Rulemaking (5 U.S.C. 804(2)) as a rule that is likely to result in: "(A) an annual effect on the economy of $100,000,000 or more; (B) a major increase in costs or prices for consumers, individual industries, Federal, State, or local government agencies, or geographic regions; or (C) significant adverse effects on competition, employment, investment, productivity, innovation, or on the ability of United States-based enterprises to compete with foreign-based enterprises in domestic and export markets." 2 A written statement containing a qualitative and quantitative assessment of the anticipated costs and benefits of the Federal mandate is required under the Section 202(a) of the Unfunded Mandates Reform Act of 1995 (2 U.S.C. 1532(a)) for all rules that may result in: "the expenditure by State, local, and tribal governments, in the aggregate, or by the private sector, of $100,000,000 or more (adjusted annually for inflation) in any 1 year." 3 A regulatory action is considered “economically significant” under Executive Order 12866 3(f)(1) if it is likely to result in a rule that may have: "an annual effect on the economy of $100 million or more or adversely affect in a material way the economy, a sector of the economy, productivity, competition, jobs, the environment, public health or safety, or State, local, or tribal governments or communities."
5

2005 Report to Congress on the Costs and Benefits of Federal Regulations
10-year look-back: estimates are based on the major regulations reviewed by OMB from October 1, 1994 to September 30, 2004.4 This means that 9 rules reviewed from October 1, 1993 to September 30, 1994 were included in the totals for the 2004 Report but are not included in the 2005 Report. A list of these rules can be found in Appendix C. Appendix C also includes a summary of 32 rules included in the 2003 Report but not included in the 2004 Report. All of the estimates presented in this chapter are based on agency information or transparent modifications of agency information performed by OMB.5 We also include in this chapter a discussion of major rules issued by "independent" regulatory agencies, although OMB does not review these rules under Executive Order 12866.6 This discussion is based on data provided by these agencies to the Government Accountability Office (GAO) under the Congressional Review Act.
4 All previous Reports are available at: http://www.whitehouse.gov/omb/inforeg/regpol-reports_congress.html. 5 OMB used agency estimates where available. If an agency quantified but did not monetize estimates, we used standard assumptions to monetize them, as explained in Appendix A. Inflation adjustments are performed using the latest available GDP deflator and all amortizations are performed using a discount rate of 7%, unless the agency has already presented annualized, monetized results using a different explicit discount rate. 6 Section 3(b) of Executive Order 12866 excludes "independent regulatory agencies as defined in 44 U.S.C. 3502(10)".
6

I: The Costs and Benefits of Federal Regulations
A. Estimates of the Total Benefits and Costs of Regulations Reviewed by OMB Table 1-1 presents an estimate of the total costs and benefits of 88 regulations reviewed
by OMB over the ten-year period from October 1, 1994 to September 30, 2004 that met two conditions.7 Each rule generated costs or benefits of at least $100 million in any one year, and a substantial portion of its costs and benefits were quantified and monetized by the agency or, in some cases, monetized by OMB. The estimates are therefore not a complete accounting of all the costs and benefits of all regulations issued by the Federal government during this period.8 As discussed in previous Reports, OMB has chosen a 10-year period for aggregation because pre-regulation estimates prepared for rules adopted more than ten years ago are of questionable relevance today. The estimates of the costs and benefits of Federal regulations over the period October 1, 1994 to September 30, 2004 are based on agency analyses subject to public notice and comments and OMB review under E.O. 12866.
The aggregate benefits reported in Table 1-1 are substantially larger than the aggregate benefits presented in the 2004 Report, while the aggregate costs are roughly comparable to the last Report’s totals. This is due primarily to the addition of two Environmental Protection Agency (EPA) rulemakings: a final rule limiting emissions of air pollution from nonroad diesel engines ($28.6 billion in annual benefits and $1.3 billion in annual costs), and a final rule implementing National Emission Standards for Hazardous Air Pollutants from industrial, commercial, and institutional boilers and process heaters ($17 billion in annual benefits and $900 million in annual costs). As can be seen in Tables 1-1 and 1-2, EPA rules continue to be responsible for the majority of costs and benefits generated by Federal regulation during this time period.
7 OMB discusses, in this report and in previous reports the difficulty of estimating and aggregating the costs and benefits of different regulations over long time periods and across many agencies using different methodologies. Any aggregation involves the assemblage of benefit and cost estimates that are not strictly comparable. In part to address this issue, the 2003 Report included OMB’s new regulatory analysis guidance, OMB Circular A-4, which took effect on January 1, 2004 for proposed rules and January 1, 2005 for final rules. The guidance recommends what OMB defines as “best practice” in regulatory analysis, with a goal of strengthening the role of science, engineering, and economics in rulemaking. The overall goal of this guidance is a more competent and credible regulatory process and a more consistent regulatory environment. OMB expects that as more agencies adopt our recommended best practices, the costs and benefits we present in future reports will become more comparable across agencies and programs. OMB is working with the agencies to ensure that their impact analyses follow the new guidance. 8 In many instances, agencies were unable to quantify all benefits and costs. We have conveyed the essence of these unquantified effects on a rule-by-rule basis in the columns titled “Other Information” in the various tables reporting agency estimates in this and previous Reports. The monetized estimates we present necessarily exclude these unquantified effects.
7

2005 Report to Congress on the Costs and Benefits of Federal Regulations
Table 1-1: Estimates of the Total Annual Benefits and Costs of Major Federal Rules, October 1, 1994 to September 30, 2004 (millions of 2001 dollars)
Agency Number
of Rules Benefits Costs
Department of Agriculture 5 2,837-5,923 1,586-1,608 Department of Education 1 632-786 349-589 Department of Energy 6 5,194-5,260 2,958 Department of Health and Human Services
17 10,226-19,714 3,817-3,992
Department of Homeland Security (Coast Guard)*
2 60 869
Department of Housing and Urban Development
1 190 150
Department of Labor 4 1,138-3,440 349 Department of Transportation 11 4,979-7,742 3,591-5,617 Environmental Protection Agency
41 44,381-233,730 21,166-23,284
Total 88 69,638-276,846 34,836-39,416 *Presented here are the costs and benefits of two Coast Guard rules that pre-date the establishment of DHS. These totals do not include the 7 major homeland security regulations adopted in 2004 by DHS and HHS. These regulations imposed costs of approximately $1.8 billion to $3.7 billion per year, and are presented in more detail in Table 1-5.
Table 1-2 provides additional information on aggregate benefits and costs for specific
agency programs. In order for a program to be included in Table 1-2, the program needed to have finalized 3 or more rules in the last 10 years with monetized costs and benefits. The Center for Medicare and Medicaid Services (CMS) in the Department of Health and Human Services (HHS) is a new entry on this table, due to the final rule published in the Federal Register on January 23, 2004 implementing requirements for a standard unique health care provider identifier.
The ranges of costs and benefits presented in Tables 1-1 and 1-2 are not necessarily
correlated. In other words, when interpreting the meaning of these ranges, the reader should not assume that low benefits are associated with low costs and that high benefits are associated with high costs. Thus, for example, it is possible that the net benefits of EPA’s water programs, taken together, could range from negative $2.5 billion to positive $5.1 billion per year.
8

I: The Costs and Benefits of Federal Regulations
Table 1-2: Estimates of Annual Benefits and Costs of Major Federal Rules: Selected Programs and Agencies, October 1, 1994-September 30, 2004 (millions of 2001 dollars)
Agency Number of
Rules Benefits Costs
Department of Energy Energy Efficiency and Renewable Energy 6 5,194-5,260 2,958 Department of Health and Human Services
Food and Drug Administration 12 3,348-12,399 985-1,160 Center for Medicare and Medicaid Services
3 5,634 2,538
Department of Labor Occupational Safety and Health Administration
4 1,138-3,440 349
Department of Transportation National Highway Traffic Safety Administration
7 4,154-6,917 2,267-4,292
Environmental Protection Agency Office of Air 29 41,292-217,721 15,171-16,765 Office of Water 9 1,165-8,307 3,160-3,684
Based on the information contained in this and previous Reports, the total costs and
benefits of all Federal rules now in effect (major and non-major, including those adopted more than 10 years ago) may be significantly larger than the sum of the costs and benefits reported in Table 1-1. More research is necessary to provide a stronger analytic foundation for comprehensive estimates of total costs and benefits by agency and program.
In order for comparisons or aggregation to be meaningful, benefit and cost estimates
should correctly account for all substantial effects of regulatory actions, not all of which may be reflected in the available data. Any comparison or aggregation across rules should also consider a number of factors that our presentation does not address. To the extent that agencies have adopted different methodologies —for example, different monetized values for effects, different baselines in terms of the regulations and controls already in place, different rates of time preference, different treatments of uncertainty—these differences remain embedded in Tables 1-1 and 1-2. While we have relied in many instances on agency practices in monetizing costs and benefits, our citation of, or reliance on, agency data in this Report should not be taken as an OMB endorsement of all the varied methodologies used to derive benefit and cost estimates.
Many of these major rules have important non-quantified benefits and costs, which may
have been a key factor in an agency’s decision to promulgate a rulemaking. These qualitative issues are discussed in the agency rulemaking documents, in previous versions of this Report, and in Table A-1 of this Report.
9

2005 Report to Congress on the Costs and Benefits of Federal Regulations
The majority of the large estimated benefit of EPA rules is attributable to reduction in public exposure to a single air pollutant: fine particulate matter. Thus, the favorable benefit-cost results for EPA regulation should not be generalized to all types of EPA rules or even to all types of clean-air rules. In addition, the ranges of costs and benefits presented in Tables 1-2 need to be treated with some caution. To the extent that the reasons for uncertainty differ across individual rules, aggregating high- and low-end estimates can result in totals that are extremely unlikely. In the case of the EPA rules reported here, however, a substantial portion of the uncertainty is similar across several rules: uncertainty in the reduction of premature deaths associated with reduction in particulate matter and the monetary value of reducing mortality risk. We continue to work with EPA to revise these ranges to more fully reflect the uncertainty in these estimates.
As Table 1-2 indicates, the degree of uncertainty in benefit estimates for clean air rules is large. In addition, the wide range of benefits estimates for particle control does not capture the full extent of the scientific uncertainty. The five key assumptions in the benefits estimates are as follows:
• Inhalation of fine particles is causally associated with a risk of premature death at
concentrations near those experienced by most Americans on a daily basis. While no definitive studies have yet established any of several potential biological mechanisms for such effects, the weight of the available epidemiological evidence supports an assumption of causality.
• All fine particles, regardless of their chemical composition, are equally potent in causing premature mortality. This is an important assumption, because fine particles formed from power plant SO2 and NOx emissions are chemically different from fine particles emitted directly from both mobile sources and other industrial facilities, but no clear scientific grounds exist for supporting differential effects by particle type.
• The concentration-response function for fine particles is approximately linear within the range of outdoor concentrations under policy consideration. Thus, the estimates include health benefits from reducing fine particles in both attainment and non-attainment regions.
• The forecasts for future emissions and associated air quality modeling are valid. • The valuation of the estimated reduction in mortality risk is largely taken from studies of
the tradeoff associated with the willingness to accept risk in the labor market.
In response to recent recommendations from a committee of the National Research Council/National Academy of Sciences, EPA is working with OMB to improve methods to quantify the degree of technical uncertainty in benefits estimates.9
9 For more information on this study, please see Estimating the Public Health Benefits of Proposed Air Pollution Regulations, National Academy of Sciences, 2003. Available at http://books.nap.edu/catalog/10511.html.
10

I: The Costs and Benefits of Federal Regulations
B. Estimates of the Benefits and Costs of This Year’s Major Rules
In this section, we examine in detail the benefits and costs of the 45 major final rules for which OMB concluded review during the 12-month period beginning October 1, 2003, and ending September 30, 2004. These major rules represent approximately 12 percent of the 364 final rules reviewed by OMB during this period, and approximately one percent of the 4,088 final rules published in the Federal Register during this period. OMB believes, however, that the costs and benefits of major rules capture the vast majority of the total costs and benefits of all rules subject to OMB review.10
Of the 45 rules, 26 regulations were “social regulations,” which may require substantial
additional private expenditures as well as provide new social benefits.11 Of the 26 “social regulations,” we are able to present estimates of both monetized costs and benefits for 11 rules. The estimates are aggregated by agency in Table 1-3, and each rule is summarized in Table 1-4. Seven of the rules for which we were not able to present estimates of both costs and benefits implemented homeland security programs where the benefits of improved security are very difficult to quantify and monetize.12 All seven of these rules did estimate costs, and these costs, as well as the available information on benefits, are summarized in Table 1-5. The 8 other final rules did not include monetized or quantified estimates for both costs and benefits, thus we did not include those rules in the totals in Tables 1-1 through 1-3. We attempt to summarize the available information on the impact of these rules in the “other information” column of Table A-1.
The remaining 19 implemented Federal budgetary programs, which primarily caused income transfers, usually from taxpayers to program beneficiaries. Although rules that facilitate Federal budget programs are subject to E.O. 12866 and OMB Circular A-4, and are fully reviewed by OMB, this Report is focused on regulations that impose costs primarily through private sector mandates.
10 We discuss the relative contribution of major rules to the total impact of Federal regulation in detail in the “response-to-comments” section on pages 26-27 of the 2004 report. In summary, our evaluation of a few representative agencies found that major rules represented the vast majority of the costs and benefits of all rules promulgated by these agencies and reviewed by OMB. 11 The Federal Register citations for these major rules are found in Table A-1 in Appendix A. 12 See Chapter 4 in the 2003 Report (pp 64-80) for a more detailed discussion of this issue.
11

2005 Report to Congress on the Costs and Benefits of Federal Regulations
Social Regulation
Of the 45 economically significant rules reviewed by OMB, 26 regulations require substantial private expenditures or provide new social benefits. Of the 26 rules, we are able to present estimates of both monetized costs and benefits for 11 rules. Table 1-3 presents total benefits and costs by agency of these major rules reviewed by OMB over the past year and Table 1-4 provides a summary of each regulation. These tables are the basis for the totals in the accounting statement in Section A of this chapter.
In assembling these tables of estimates of benefits and costs, OMB has applied a uniform format for the presentation of benefit and cost estimates in order to make agency estimates more closely comparable with each other (for example, annualizing benefit and cost estimates); and has monetized quantitative estimates where the agency has not done so. For example, we have converted agency projections of quantified benefits, such as estimated injuries avoided per year or tons of pollutant reductions per year, to dollars using the valuation estimates discussed in Appendix A. Table A-1 in Appendix A also reports the available impact information, as reported by the agencies, on all 26 of the social regulations reviewed by OMB in the time period of this Report.
Table 1-3: Estimates of the Total Annual Benefits and Costs of Major Federal Rules, October 01, 2003 to September 30, 2004 (millions of 2001 dollars)
Agency Number of Rules Benefits Costs Department of Health and Human Services
3 1,567-7,686 812-893
Department of Transportation* 2 94 -32 Environmental Protection Agency
6 10,935-100,703 3,060-3,211
Total 11 12,596-108,483 3,840-4,073 *Department of Transportation rules include the final rule reducing the vertical separation minimum in domestic U.S. airspace. Since this is a deregulatory action, we have subtracted the cost savings from the costs imposed by other rulemakings.
12

I: The Costs and Benefits of Federal Regulations
Table 1-4: Estimates of the Total Annual Benefits and Costs of Major Rules Issued Between October 1, 2003 to September 30, 2004 (millions of 2001 dollars per year)
Rule Agency Benefits Costs Explanation of OMB Calculations Bar Code Label Requirements for Human Drug Products and Blood Products
HHS/ FDA
1,352-7,342
647 The range of benefits reported in this table is based on the sensitivity analysis reported by FDA which assumed higher or lower interception rates of medical errors due to the rulemaking. This range encompassed the range of most of the other sensitivity analyses performed by FDA.
Final Rule Declaring Dietary Supplements Containing Ephedrine Alkaloids Adulterated Because They Present an Unreasonable Risk
HHS/ FDA
0-130 7-89 No adjustments to agency estimates.
Health Insurance Reform: Standard Unique Health Care Provider Identifier
HHS/ CMS
214 158 We annualized the reported stream of impacts over 5 years at 7%.
Pipeline Integrity Management in High Consequence Areas (Gas Transmission Pipelines)
DOT/ RSPA
154 288 We annualized the reported stream of costs over 20 years at 7%.
Reduced Vertical Separation Minimum in Domestic United States Airspace
DOT/ FAA
-60 -320 We annualized the reported present value impacts over 15 years at 7%. We subtracted the impacts of this rulemaking from total costs and benefits because it is deregulatory.
Control of Emissions of Air Pollution From Nonroad Diesel Engines and Fuel
EPA/ Air
6,853-59,401
1,336 We annualized the reported stream of impacts over 32 years at 7%. We also calculated an uncertainty interval for benefits using a method explained in Appendix B.
National Emission Standards for Hazardous Air Pollutants: Industrial/ Commercial/ Institutional Boilers and Process Heaters
EPA/ Air
3,752-38,714
876 We calculated an uncertainty interval for benefits using a method explained in Appendix B.
National Emission Standards for Hazardous Air Pollutants: Plywood and Composite Wood Products
EPA/ Air
152-1,437
155-291
No adjustments to agency estimates.
National Emission Standards for Hazardous Air Pollutants: Stationary Reciprocating Internal Combustion Engines.
EPA/ Air
105-1,070
270 We calculated an uncertainty interval for benefits using a method explained in Appendix B. Note that EPA did present a monetized central estimate for benefits in this rulemaking of $265 million per year (see Table A-1), which is somewhat lower than the midpoint of the uncertainty range presented here.
Establishing Location, Design, Construction, and Capacity Standards for Cooling Water Intake Structures at Large Existing Power Plants
EPA/ Water
72 383 No adjustments to agency estimates.
Effluent Guidelines and Standards for the Meat and Poultry Products Point Source Category (Revisions)
EPA/ Water
0-10 41-56 Although the annualized impact for this rule did not reach the economic significance threshold, this rule did have startup costs exceeding $100 million in any one year.
Total 12,596-108,483
3,840-4,073
13

2005 Report to Congress on the Costs and Benefits of Federal Regulations
Homeland Security Regulations
Table 1-5 presents the available impact information on the 7 major homeland security regulations adopted in 2004 by DHS and HHS. Because the benefits of homeland security regulations are a function of the likelihood and severity of a hypothetical future terrorist attack, they are very difficult to forecast, quantify, and monetize. For the purposes of this Table, we have annualized and converted the cost estimates to 2001 dollars in a manner similar to Table 1-4. We have also summarized the available information on how the agencies feel each of the rules will improve security or otherwise prevent or mitigate the consequences of a terrorist attack.
Table 1-5: Estimates of the Total Annual Benefits and Costs of Major Federal Rules: Major Homeland Security Regulation, October 1, 2003-September 30, 2004
(millions of 2001 dollars) Rule Agency Benefits Costs Other Information
Prior Notice of Imported Food Under the Public Health Security and Bioterrorism Preparedness and Response Act of 2002
HHS-FDA
FDA will know in advance what articles of food are being imported or offered for import, before they arrive at the port of entry into the U.S. In the event of a credible threat, FDA will be able to mobilize and assist in the detention and removal of specific products that may pose a serious health threat to human or animals.
263 No adjustments to agency estimates.
Registration of Food Facilities Under the Public Health Security and Bioterrorism Preparedness and Response Act of 2002
HHS-FDA
In the event of an actual or threatened bioterrorist attack on the U.S. food supply or other food-related emergency, this information will help FDA and other authorities determine the source and cause of the event, and communicate with potentially affected facilities.
187 - 305
We annualized the reported present value costs over 20 years at 7%
Required Advance Electronic Presentation of Cargo Information
DHS-CBP
The rule’s primary benefit would be to improve cargo security. Once implemented, this rule will give CBP more time to analyze cargo data, thereby enabling it to target attention on high-risk cargo or carriers. In addition to improving the effectiveness of inspections, improved targeting may act as a deterrent.
334 - 2,094
No adjustments to agency estimates.
Area Maritime Security
DHS-USCG
This final rule, along with the Vessel Security and Facility Security final rules, was published jointly as part of the implementation of the National Maritime Security Initiative. This initiative is designed to reduce the risk and impact of a transportation security incident
66 Annualized costs derived from reported present value calculated over 10 years at 7%. Start-up costs estimated to be $106 million in 2004.
14

I: The Costs and Benefits of Federal Regulations
Table 1-5: Annual Benefits and Costs of Major Homeland Security Regulations, Cont.
Rule Agency Benefits Costs Other Information Vessel Security DHS-
USCG Reduce the risk and impact of a transportation security incident
188 Annualized costs derived from reported present value calculated over 10 years at 7%.
Facility Security DHS-USCG
Reduce the risk and impacts of a transportation security incident
743 Annualized costs derived from reported present value calculated over 10 years at 7%.
Authority To Collect Biometric Data From Additional Travelers and Expansion to the 50 Most Highly Trafficked Land Border Ports of Entry (US-VISIT)
DHS-BTS
The anticipated benefits of this rule include: (1) Improving identification, through the use of biometric identifiers, of travelers who may present threats to public safety; (2) enhancing the government’s ability to match an alien’s fingerprints and photographs to other law enforcement or intelligence data; (3) improving the ability to identify individuals who may be inadmissible to the United States; (4) improving cooperation across international, Federal, State and local agencies through better access to data on foreign nationals who may pose a threat; (5) improving facilitation of legitimate travel and commerce by improving the timeliness and accuracy of the determination of a traveler’s immigration status and admissibility; (6) enhancing enforcement of immigration laws; (7) reducing fraud, undetected impostors, and identity theft; and, (8) increasing integrity within the Visa Waiver Program through better data collection, tracking, and identification.
27 DHS estimated a start-up cost of $155 million in 2004, which they annualized over 7 years at 7%.
Total 1,808 – 3,686
15

2005 Report to Congress on the Costs and Benefits of Federal Regulations
C. Regulations Implementing Federal Budgetary Programs
Of the 45 economically significant rules reviewed by OMB, Table 1-6 lists the 19 that implement Federal budgetary programs. The budget outlays associated with these rules are “transfers” from taxpayers to program beneficiaries (or fees collected from program beneficiaries); therefore in past reports OMB has referred to these rules as “transfer” rules. The totals are: USDA, 2 rules; Department of Defense (DOD), 2 rules; DOC, 1 rule; HHS, 9 rules; DHS, 1 rule; DOI, 2 rules; and DOT, 2 rules.
Table 1-6: Agency Rules Implementing Federal Budgetary Programs,
October 1, 2003 to September 30, 2004
Department of Agriculture 2002 Farm Bill: Conservation Reserve Program 2001 Agriculture, Rural Development, Food & Drug Administration and Related Agencies Appropriation Act: Vehicle and Maximum Excess Shelter Expense Deduction Provisions Department of Commerce Fishing Capacity Reduction Program for the Crab Species Covered by the Fishery Management Plan for the Bering Sea/Aleutian Islands King and Tanner Crabs Department of Defense Programmatic Regulations for the Comprehensive Everglades Restoration Plan TRICARE; CHAMPUS; Appeals and Hearings Procedures Department of Health and Human Services Medicare Program: Revisions to Payment Policies Under the Physician Fee Schedule for CY 2004 Medicare Program: Changes to the Hospital Outpatient Prospective Payment System (OPPS) and CY 2004 Payment Rates Medicare Program: Changes to Medicare Payment for Drugs and Physician Fee Schedule Payments for CY 2004 Medicare Program: Hospital Outpatient Prospective Payment System Payment Reform for CY 2004—CMS-1371-IFC Medicare Program Changes to the Criteria for Being Classified as an Inpatient Rehabilitation Facility Prospective Payment System for Long-Term Care Hospitals: Annual Payment Rate Updates and Policy Changes Medicare Program: Continuation of Medicare Entitlement When Disability Benefit Entitlement Ends Because of Substantial Gainful Activity – CMS-4018-F Medicare Program: Medicare Ambulance MMA Temporary Rate Increases Beginning, July 1, 2004 – CMS-1492-IFC Medicare Program Changes to the Hospital Inpatient Prospective Payment Systems and FY 2005 Rates – CMS-1428-F Department of Homeland Security Adjustment of the Immigration Benefit Application Fee Schedule Department of Interior Indian Roads Reservation Program Oil and Gas and Sulphur Operations in the Outer Continental Shelf; Relief or Reduction in Royalty Rates, Deep Gas Provisions Department of Transportation Automotive Fuel Economy Manufacturing Incentives for Alternative Fueled Vehicles Maritime Security Program
16

I: The Costs and Benefits of Federal Regulations
In addition, there are 8 HHS/CMS “Notices” which are used to set parts of their payment
systems such as premiums and annual deductibles. These notices are not final rules, since they implement changes to CMS payment systems driven by statutory formula and are not subject to notice and comment. We nonetheless list these notices below since they are considered "major" under (5 U.S.C. 804(2) and are reported to the GAO:
• Prospective Payment System for Inpatient Rehabilitation Facilities for FY 2005 -- CMS-1360-N
• Medicare Program; Part A Premium for 2004 for the Uninsured Aged and for Certain Disabled Individuals Who Have Exhausted Other Entitlement --CMS-8018-N
• Medicare Program: Part A Premiums for Calendar Year 2005 for the Uninsured Aged and for Certain Disabled Individuals Who Have Exhausted Other Entitlement --(CMS-8022-N)
• Medicare Part B Monthly Actuarial Rates and Premium Rate Beginning January 1, 2005 CMS-8020-N
• Inpatient Hospital Deductible and Hospital and Extended Care Services Coinsurance Amounts for Calendar Year 2005 (CMS-8021-N)
• Monthly Actuarial Rates and Monthly Supplementary Medical Insurance Premium Beginning January 1, 2004 -- CMS-8017-N
• Medicare Program: Notice of One-Time Appeal Process for Hospital Wage Index Classification
• Inpatient Hospital Deductible and Hospital and Extended Care Services Coinsurance Amounts for 2004 -- CMS-8016-N
Please note that rules that transfer Federal dollars often have opportunity costs or benefits
in addition to the budgetary dollars spent. Including budget programs in the overall totals would, however, overwhelm the incremental new regulatory impacts identified by this Report and would confuse the distinction between rules that impose costs primarily through the imposition of taxes, and rules that impose costs primarily through mandates on the private sector. We also caution the reader not to assume that these rules were subject to less stringent analytical and review requirements based on our less-detailed presentation of Federal budget rules in this Report. In fact, agencies thoroughly analyze and OMB thoroughly reviews all significant Federal budget rules under E.O. 12866. If economically significant, these rules must be accompanied by regulatory impact analyses that comply with OMB Circular A-4.
17

2005 Report to Congress on the Costs and Benefits of Federal Regulations
D. Major Rules for "Independent" Regulatory Agencies
The congressional review provisions of the Small Business Regulatory Enforcement Fairness Act (SBREFA) (Public Law 104-121) require the GAO to submit reports on major rules to the committees of jurisdiction, including rules issued by agencies not subject to Executive Order 12866, the so-called "independent" regulatory agencies. We reviewed the information on the costs and benefits of major rules contained in GAO reports for the period of October 1, 2003 to September 30, 2004. GAO reported that 4 of these agencies issued 4 major rules during this period.13
In comparison to the agencies subject to E.O. 12866, these agencies provided in their
analyses relatively little quantitative information on the benefits of major rules: of the 19 economically significant rules reviewed by OMB that did not implement homeland security related regulations, about 60 percent (11) reported monetized benefits, whereas only 25 percent (1 of 4) of the rules finalized by independent agencies reported monetized benefits. As Table 1-7 indicates, most of the rules included some discussion of benefits and costs, and reported monetized costs. OMB does not know whether the rigor and extent of the analyses conducted by these agencies are similar to those of the analyses performed by agencies subject to the Executive Order, since OMB does not review rules from these agencies.
Table 1-7: Major Rules for "Independent" Regulatory Agencies, October 1, 2003 to September 30, 2004
Agency Rule Information
on Benefits or Costs
Monetized Benefits
Monetized Costs
Federal Communications Commission
Promoting Efficient Use of Spectrum Through Elimination of Barriers to the Development of Secondary Markets [68 FR 66252]
Yes No Yes
Federal Reserve Availability of Funds and Collection of Checks [69 FR 47289]
Yes No No
Nuclear Regulatory Commission
Revision of Fee Schedules; Fee Recovery for FY 2004 [69 FR 22664]
Yes No Yes
Securities and Exchange Commission
Alternative Net Capital Requirements for Broker-Dealers that are Part of Consolidated Supervised Entities [69 FR 34428]
Yes Yes Yes
13 Rules promulgated by the Federal Communications Commission (FCC) under the authority of the Telecommunications Act of 1996 are exempt from the definition of "major rule" (5 U.S.C. 804). However, no FCC rules that would otherwise meet the criteria for "major rule" were identified for this period.
18

I: The Costs and Benefits of Federal Regulations
E. Response to Peer Reviews and Public Comments on the Accounting Statement
Many commenters supported OMB’s general approach to the regulatory accounting statement. Several commenters (1, 4, 5, and E) stated that the accounting statement is a useful tool for informing the public and policymakers on the scope and impact of the Federal regulatory system.14 For example, peer reviewer 4 stated that the Report “improves incrementally on prior reports and lays out plans to make further improvements in the future. For the public it provides a useful window into the important, but obscure, world of regulation. For OMB and the agencies, as well of for Congress, it advances the state of the art and helps to institutionalize the process of evaluating regulatory benefits and costs.” Other commenters, however, doubted the overall approach, stating that the accounting statement is highly misleading by its nature, and provides a false pretense of accuracy and objectivity (B, O). Comments on Scope/Coverage
Commenters (1, C, and D) questioned OMB’s decision to include only major rules in our benefit and cost totals. They questioned whether this practice led OMB to neglect reporting the impact of many important rules and therefore to underestimate the total costs and benefits of Federal rulemaking. Peer reviewer 1 stated that “it is not clear that a look at the handful of rules that qualify as ‘major rules’ can fully characterize the state of regulatory activity at the Federal level.”
In the Draft Report, we stated that we included only information on the benefits and costs
of major rules because we believe that these costs and benefits capture the vast majority of the total costs and benefits of all rules subject to OMB review. A comprehensive reassessment of every significant rulemaking is beyond the scope of this Report. In the final 2004 Report, we reassessed the relative importance of major versus non-major rules for a selected group of agencies (OSHA, FDA, and NHTSA) and found that the costs and benefits of their significant, non-major rulemakings reviewed by OMB were a small fraction of the costs and benefits of their major rulemakings. Peer reviewer 1 agreed that an annual assessment of all rulemakings was “impractical,” and suggested that we focus on a particular agency each year in order to provide this more in-depth analysis. We do see merit in periodically providing in-depth focus on individual agencies in order to continually test our assumptions regarding the relative importance of major rules.
One commenter (C) also stated that since Federal agencies themselves determine which
rules are major, using that screen for including rules in our Report is questionable. This characterization of the designation process is not correct. Under E.O. 12866, Section 6, the agencies must submit a list of planned regulatory actions to OIRA, and the agencies and OIRA jointly determine which of these actions are economically significant and major.
Other commenters (4, E, O) criticized the limitation of our accounting statement to final
rules put in place over the previous 10 years. They stated that it is misleading to simply let
14 See appendix F for a listing of all the written comments we have received, and the numbers or letters we have assigned to their comments. The public and peer review comments are available for review at http://www.whitehouse.gov/omb/inforeg/regpol-reports_congress.html.
19

2005 Report to Congress on the Costs and Benefits of Federal Regulations
regulatory programs drop off the radar screen after ten years, since some of them continue to have substantial economic effects. Furthermore, comment O claims that we did not address this criticism in previous years.
As we stated in the final 2004 Report in response to similar comments (see page 28), we
continue to believe that the 10-year window is the appropriate time period for which to limit this accounting statement, since we do not believe that the pre-regulation estimates of the costs and benefits of rules issued over ten years ago are very reliable or useful for informing current policy decisions. In Chapter II, we discuss the many reasons why ex-ante estimates of regulations may not be accurate, and that inaccuracy almost certainly increases with time. We will continue, however, to document the estimated costs and benefits of rules outside of this time period in appendices and other analyses where we believe appropriate. Also, in order to provide transparency, we have expanded Appendix C to include all rulemakings that have been omitted because of our decision to limit our accounting statement to 10 years. In addition, in Chapter II, we present an analysis of the new yearly regulatory burden imposed by several administrations over the past 24 years. Although this analysis by necessity includes rules promulgated outside of the 10-year window, we believe it is a very useful study of the different burden administrations imposed on the private sector to realize regulatory benefits.
Several commenters (2, 4, B, O) criticized our treatment of homeland security
regulations. Peer reviewer 4 stated that OMB should not automatically exclude the costs of any regulation, and homeland security regulations, in particular, for which agencies do not develop monetized estimates. Peer reviewer 2 suggested that OMB provide guidelines for how DHS should quantify and monetize the benefits of antiterrorism regulation, and peer reviewer 4 suggested that OMB encourage DHS to develop suitable analytical methods.
OMB encourages DHS and any other agency with a substantial focus on security to
develop more systematic ways of judging the efficacy of their regulations. For example, we devoted a chapter in the 2003 Report to discuss the challenges in measuring anti-terrorism benefits and the direct and indirect costs of anti-terrorism rules. We also agree that homeland security regulations should be given a more prominent place and explanation in the Report, since security is such an important goal of government regulation. We disagree, however, with adding the costs of rulemakings that do not have monetized benefits to the accounting statement itself. We feel this would introduce bias into the presentation of the costs and benefits. Therefore, we have added to Chapter 1 a new Table, 1-5, which summarizes the annualized costs of the 7 major homeland security regulations finalized between October 1, 2003 and September 30, 2004. We also include a qualitative description of the expected benefits of these rulemakings.
Several commenters (3, 4, B, E, K, and O) criticized our treatment of rules that
implemented Federal budgetary programs, including our practice of excluding rules of this type from the cost and benefit totals. Many of these comments point out that rules designed to spend budget dollars also generate costs and benefits. Costs include the opportunity costs of tax revenue, and benefits are derived from the behavioral changes caused by the spending programs. Peer reviewer (3) stated that there is no reason to suspect that benefits will equal costs, as OMB claims. Peer reviewer (3) also believes that the analysis that is performed on these budget rules is not nearly as systematic and comprehensive as the requirement for analyzing regulations.
20

I: The Costs and Benefits of Federal Regulations
Comment O claimed that we did not address this criticism in last year’s Report, and comment B claimed that our treatment of these budgetary rules is not consistent with our own policies.
As we also stated in the response to comments in the final 2004 Report (see page 29), we
agree that rules that transfer Federal budgetary programs often have opportunity costs or benefits in addition to the budgetary dollars spent. Our statement that the benefits and costs of budget rules would be equal referred to the transfer portion of the rule, or the actual budget expenditures associated with the rule, and not to the opportunity costs or behavioral changes caused by those budget expenditures. We have attempted to clarify the language on this point in Chapter 1.
Several commenters also seem to have assumed from our less detailed presentation of
Federal budget rules in this Report that these rules were subject to less stringent analytical and review requirements. In fact, agencies thoroughly analyze and OMB thoroughly reviews all significant Federal budget rules under E.O. 12866. If economically significant, these rules must be accompanied by regulatory impact analyses that comply with OMB Circular A-4.
We continue to believe that our approach of separately identifying budgetary rules has
merit. In this regard, we agree with peer reviewer (4) that perhaps the best argument for our separate treatment of budgetary rules is a “division of labor.” OMB feels this Report is properly focused on regulations that impose costs primarily through private sector mandates, and not those regulations that facilitate Federal budget programs. We do see merit in providing more information about these rules, and we are considering feasible ways of providing this information.
Several commenters (2, 4, E) encourage us to present more detailed information on the
costs and benefits of independent agency rulemakings. Commenter (E) stated that not including independent agency rulemakings causes the Report to underestimate the total regulatory burden imposed by the government. OMB agrees that it is important to assess the benefits and costs of independent agency regulatory actions, and we do encourage independent agencies to conduct benefit-cost analyses that conform to our regulatory analysis guidance, and to submit those analyses of major rules to OMB. Commenter (I) stated that Table 1-7 should either not include NRC’s rule revising fee schedules as a “major rule” or at least clearly state NRC’s rule is a “statutorily required rule.” OMB is required by statute to include all major rules in this Report.
Two commenters (K and O) claim that OMB arbitrarily excludes deregulatory actions
from review. Commenter (K) claims that OMB manipulates the process to declare deregulatory actions non-major in order to mask their effect. Commenter (K) cites an MSHA rule regulating diesel emissions as evidence of this. Comment (O) states that “OMB’s single-edged sword fails to count lost benefits suffered by the public when safeguards are weakened or blocked.” Comment (O) cites our treatment of an EPA rulemaking on the New Source Review program under the Clean Air Act. Comment (O) also states that we did not respond to a similar criticism in our 2004 report.
OMB disagrees with these commenters. As we stated in the response to comments in the
final 2004 Report (see page 29), OMB does not exclude deregulatory actions from this Report. This Report includes all major final rules reviewed by OMB over a ten-year period from October
21

2005 Report to Congress on the Costs and Benefits of Federal Regulations
1, 1994 to September 30, 2004, whether or not they are regulatory or deregulatory. The 2005 Report discusses two deregulatory rulemakings both promulgated by DOT (liberalizing Computer Reservation System regulations and reducing the vertical separation minimum in domestic U.S. airspace). The MSHA rule cited by Commenter (K) fails to meet the objective criteria to be considered major; it did not have an estimated impact of $100 million in any one year. In addition, the final 2004 Report stated we do not include information on EPA’s Prevention of Significant Deterioration and Nonattainment New Source Review: Routine Maintenance and Repair Final Rule (68 FR 61247), because on December 24, 2003 the Court of Appeals for the District of Columbia Circuit stayed the effective date of the rule. As a result, the rule did not become effective on December 26, 2003, as originally intended by the Agency (see page 6). It is OMB's practice in these Reports to Congress to not include rulemakings that have been stayed or invalidated by a Court, as they no longer impose costs or generate benefits.
A peer reviewer (2) suggested that we include a discussion of the costs and benefits of
anti-trust activities in the Report. OMB feels that a discussion of the costs and benefits of anti-trust activities is beyond the scope of this Report. Comments on the Overall Quality of Analysis
Several comments (1, 4, B, G, E, and O) stated that costs and benefits of different regulations are difficult or impossible to compare due to methodological differences across agency analyses. Peer reviewer 4 is concerned with “inconsistent assumptions and baselines”; however, he also stated that aggregated costs and benefits are useful to “monitor trends, gauge general magnitudes, set priorities, and suggest directions for reform.” Other commenters (B, K, and O) stated that they believed the methodologies so unsound that any attempt to add the results together in an accounting statement was inherently misleading. Most of these commenters suggest that we stress the limited nature of the statistics in the executive summary as well as throughout the Report.
Two commenters (2 and E) also suggest that OMB summarize agency compliance with
OMB guidance. A commenter (G) suggested that OMB should encourage and provide technical assistance to agencies to develop a standardized methodology to account for substantial effects of regulations.
OMB agrees that we should emphasize the limitations of aggregating the costs and
benefits of different regulations; we continue throughout these Reports to point out the inherent drawbacks of aggregating costs and benefits. We do not believe, however, that agency methodologies are so different that comparison across agencies is useless. For example, almost all agencies report results with a 7% discount rate, long required by OMB. Almost all agencies use similar methodologies for valuing fatalities avoided due to health and safety regulations. In addition, where benefits are primarily due to gains in economic efficiency, the market analysis that leads to an estimate of efficiency gains is fairly standardized.
We further note that in limited cases, as explained in the draft Report, OMB does adjust
agency cost and benefit estimates to help ensure consistency in the context of this annual Report. First, all values were adjusted to 2001 dollars; next, quantified but non-monetized estimates
22

I: The Costs and Benefits of Federal Regulations
were monetized; and finally, estimates of net present values were annualized to provide a yearly stream of benefits and costs. Nevertheless, OMB agrees with the goal of further standardization of agency analyses, and believes the best way to promote this is through the application of the OMB Circular A-4, which was designed to promote consistent analytical approaches.
In addition to the uncertainties introduced by the aggregation of costs and benefits across
regulations, some comments (1, B, E, and O) discussed the inherent uncertainty of regulatory analysis. Peer reviewer 1 stated that “the report does a good job presenting the available data and noting the areas where there is uncertainty and a need for further refinement.” Commenters (B and O), however, stated that the Report “provide a false pretense of accuracy and objectivity,” and “obscures the considerable uncertainty underlying its numbers.”
OMB disagrees with commenters B and O. We discuss throughout the Report the many
sources of uncertainty within individual rulemakings and the difficulty and uncertainty of aggregating different estimates of costs and benefits. For EPA rulemakings, which these comments (B and O) discuss, the draft Report explained that the wide range of benefits estimates for clean air rules on controlling particulates does not capture the full extent of the scientific uncertainty.
Two commenters (B and O) suggest that the use of cost-benefit analysis has a major
shortcoming. They state that cost-benefit analysis is inherently biased against regulation because it causes agencies to grossly overestimate the real cost to the economy and systematically underestimate the benefits of regulation. A major reason why benefits are underestimated, they contend, is that cost-benefit analysis de-emphasizes important benefits that are non-quantifiable.
OMB does not agree that cost-benefit analysis is inherently biased for or against
regulation. Estimates are inherently uncertain, and we are aware of retrospective analyses that have found both ex-ante costs and benefits to be both under and over estimated.15 In addition, we explain in the Report that these major rules have important non-quantified benefits and costs, which may have been a key factor in an agency’s decision to promulgate a rulemaking. Table A-1 in the Report thoroughly describes the important non-quantified costs and benefits associated with particular rulemakings. Moreover, 15 of the 26 social regulations (reviewed by OMB between October 1, 2003 and September 30, 2004) did not quantify either benefits or costs, but these regulations were nonetheless finalized.
Several commenters made useful recommendations on the presentation of the Report.
Peer reviewer (3) suggested that we switch Table 1-4 with Appendix Table A-1, since the latter table presents the annualized, 2001 dollar impact estimates that are the basis for the other tables presented in Chapter 1, Section A. We agree, and have made this modification. Peer reviewers (3 and 5) suggested that we present more systematic information on the non-quantified costs and
15 For example, Harrington et al (2000), in an analysis of a sample of EPA and OSHA regulatory impact analyses, found that ex-ante per-unit abatement costs were overestimated about as often as underestimated. They also found that ex-ante total abatement costs were more likely to be overestimated than underestimated. Overestimation of total costs was primarily due to errors in estimating the quantity of benefits achieved by the rule, which suggests that the benefits of these rulemakings were overestimated as well, and to unanticipated technological change. Chapter III discusses this and other retrospective studies of the impact of regulations in more detail.
23

2005 Report to Congress on the Costs and Benefits of Federal Regulations
benefits in what is now Table A-1. We agree, and have attempted to standardize and clarify this information. Peer reviewer (5) also suggested that we include a link to an electronic version of each rulemaking’s Regulatory Impact Analysis. Oftentimes an agency will include their entire impact analysis in a final rule’s Federal Register publication; we have indicated the rulemakings where this is the case in Table A-1. If the impact analysis is not published in full in the Federal Register, but is otherwise available on-line, we have added an electronic link to the analysis in the “other information” column in Table A-1.
F. The Impact of Federal Regulation on State, Local, and Tribal Government, Small Business, Wages, and Economic Growth
Sec. 624 (a)(2) of the Regulatory Right-to-Know Act (Public Law 106-554, 31 U.S.C. 1105 note) calls on OMB to present an analysis of the impacts of Federal regulation on State, local, and tribal governments, small business, wages, and economic growth. Impacts on State, Local, and Tribal Governments
Over the past 10 years, 6 rules have imposed costs of more than $100 million per year (adjusted for inflation) on State, local, and tribal governments (and thus have been classified as public sector mandates under the Unfunded Mandates Act of 1995).16
1. EPA’s Rule on Standards of Performance for Municipal Waste Combustors and Emissions Guidelines (1995): This rule set standards of performance for new municipal waste combustor (MWC) units and emission guidelines for existing MWCs under sections 111 and 129 of the Clean Air Act [42 U.S.C. 7411, 42 U.S.C. 7429]. The standards and guidelines apply to MWC units at plants with combustion capacities greater than 35 mega grams per day (Mg/day) (approximately 40 tons per day) of municipal solid waste (MSW). The EPA standards require sources to achieve the maximum degree of reduction in emissions of air pollutants that the Administrator determined is achievable, taking into consideration the cost of achieving such emissions reduction, and any non-air quality health and environmental impacts and energy requirements. EPA estimated the annualized costs of the emissions standards and guidelines to be $320 million per year (in constant 1990 dollars) over existing regulations. While EPA estimated the cost of such standards for new sources to be $43 million per year, the cost to existing sources was estimated to be $277 million per year. The annual emissions reductions achieved through this regulatory action include, for example, 21,000 Mg. of
16 We note that EPA’s proposed rules setting air quality standards for ozone and particulate matter may ultimately lead to expenditures by State, local, or tribal governments of $100 million or more. However, Title II of the Unfunded Mandates Reform Act provides that agency statements of compliance with Section 202 must be conducted “unless otherwise prohibited by law”. The conference report to this legislation indicates that this language means that the section “does not require the preparation of any estimate or analysis if the agency is prohibited by law from considering the estimate or analysis in adopting the rule.” EPA has stated, and the courts have affirmed, that under the Clean Air Act, the primary air quality standards are health-based and EPA is not to consider costs.
24

I: The Costs and Benefits of Federal Regulations
sulfur dioxide; 2,800 Mg. of particulate matter (PM); 19,200 Mg of nitrogen oxides; 54 Mg. of mercury; and 41 Kg. of dioxins/furans.
• EPA’s Standards of Performance for New Stationary Sources and Guidelines for Control of Existing Sources: Municipal Solid Waste Landfills (1996): This rule set performance standards for new municipal solid waste landfills and emission guidelines for existing municipal solid waste landfills under section 111 of the Clean Air Act. The rule addressed non-methane organic compounds (NMOC) and methane emissions. NMOC include volatile organic compounds (VOC), hazardous air pollutants (HAPs), and odorous compounds. Of the landfills required to install controls, about 30 percent of the existing landfills and 20 percent of the new landfills are privately owned. The remaining landfills are publicly owned. The total annualized costs for collection and control of air emissions from new and existing MSW landfills are estimated to be $100 million.
• EPA’s National Primary Drinking Water Regulations: Disinfectants and Disinfection
Byproducts (1998): This rule promulgates health-based maximum contaminant level goals (MCLGs) and enforceable maximum contaminant levels (MCLs) for about a dozen disinfectants and byproducts that result from the interaction of these disinfectants with organic compounds in drinking water. The rule will require additional treatment at about 14,000 of the estimated 75,000 covered water systems nationwide. The costs of the rule are estimated at $700 million annually. The quantified benefits estimates range from zero to 9,300 avoided bladder cancer cases annually, with an estimated monetized value of $0 to $4 billion per year. Possible reductions in rectal and colon cancer and adverse reproductive and developmental effects were not quantified.
• EPA’s National Primary Drinking Water Regulations: Interim Enhanced Surface Water
Treatment (1998): This rule establishes new treatment and monitoring requirements (primarily related to filtration) for drinking water systems that use surface water as their source and serve more than 10,000 people. The purpose of the rule is to enhance health protection against potentially harmful microbial contaminants. EPA estimated that the rule will impose total annual costs of $300 million per year. The rule is expected to require treatment changes at about half of the 1,400 large surface water systems, at an annual cost of $190 million. Monitoring requirements add $96 million per year in additional costs. All systems will also have to perform enhanced monitoring of filter performance. The estimated benefits include average reductions of 110,000 to 338,000 cases of cryptosporidiosis annually, with an estimated monetized value of $0.5 to $1.5 billion, and possible reductions in the incidence of other waterborne diseases.
• EPA’s National Pollutant Discharge Elimination: System B Regulations for Revision of
the Water Pollution Control Program Addressing Storm Water Discharges (1999): This rule expands the existing National Pollutant Discharge Elimination System program for storm water control. It covers smaller municipal storm sewer systems and construction sites that disturb one to five acres. The rule allows for the exclusion of certain sources from the program based on a demonstration of the lack of impact on water quality. EPA estimates that the total cost of the rule on Federal and State levels of government, and on the private sector, is $803.1 million annually. EPA considered alternatives to the rule,
25

2005 Report to Congress on the Costs and Benefits of Federal Regulations
including the option of not regulating, but found that the rule was the option that was “most cost effective or least burdensome, but also protective of the water quality.”
• EPA’s National Primary Drinking Water Regulations; Arsenic and Clarifications to
Compliance and New Source Contaminants Monitoring (2001): This rule reduces the amount of arsenic that is allowed to be in drinking water from 50 ppb to 10 ppb. It also revises current monitoring requirements and requires non-transient, non-community water systems to come into compliance with the standard. This rule may affect either State, local or tribal governments or the private sector at an approximate annualized cost of $206 million. The monetized benefits of the rule range from $140 to $198 million per year. The EPA selected a standard of 10 ppb because it determined that this was the level that best maximizes health risk reduction benefits at a cost that is justified by the benefits, as required by the Safe Drinking Water Act.
Although these 6 EPA rules were the only ones over the past 10 years to require
expenditures by State, local and Tribal governments exceeding $100 million, they were not the only rules with impacts on other levels of governments. For example, 14 percent, 9 percent, and 6 percent of rules listed in the April 2001 Unified Regulatory Agenda cited some impact on State, local, or tribal governments, respectively. Impact on Small Business
The need to be sensitive to the impact of regulations and paperwork on small business was recognized in Executive Order 12866, “Regulatory Planning and Review.” The Executive Order calls on the agencies to tailor their regulations by business size in order to impose the least burden on society, consistent with obtaining the regulatory objectives. It also calls for the development of short forms and other efficient regulatory approaches for small businesses and other entities. Moreover, in the findings section of the Small Business Regulatory Enforcement Fairness Act of 1996 (SBREFA), Congress stated that “... small businesses bear a disproportionate share of regulatory costs and burdens” (Section 202(2) of Public Law 104-121). Each firm has to determine whether a regulation applies, how to comply, and whether it is in compliance. As firms increase in size, fixed costs of regulatory compliance are spread over a larger revenue and employee base resulting in lower unit costs.
The Office of the Chief Counsel for Advocacy of the Small Business Administration
(hereafter "Advocacy") recently sponsored a study (Crain and Hopkins 2001) that estimated the burden of regulation on small businesses.17 That study found that regulatory costs per employee decline as firm size—as measured by the number of employees per firm—increases. Crain and Hopkins estimate that the total cost of Federal regulation (environmental, workplace, economic, and tax compliance regulation) was 60 percent greater per employee for firms with under 20 employees compared to firms with over 500 employees.
17 Crain, W.M. and T.D. Hopkins 2001. “The Impact of Regulatory Costs on Small Firms.” Report prepared for the Office of Advocacy, U.S. Small Business Administration. Available at http://www.sba.gov. Please note that during the publication of this final Report, the Office of Advocacy released an updated version of this study, which is also available on SBA’s website. Although we were unable to incorporate the findings of the new study into this section, we will do so in future Reports.
26

I: The Costs and Benefits of Federal Regulations
Because of this relatively large impact of regulations on small businesses, President Bush
issued Executive Order 13272, which reiterates the need for agencies to assess the impact of regulations on small businesses under the Regulatory Flexibility Act (RFA) (5 U.S.C. 601-612). Under the RFA, whenever an agency comes to the conclusion that a particular regulation will have a significant economic impact on a substantial number of small entities, the agency must conduct both an initial and final regulatory flexibility analysis. This analysis must include an assessment of the likely burden of the rule on small entities, and an analysis of alternatives that may afford relief to small entities while still accomplishing the regulatory goals.
The Advocacy (2004) report summarizes the overall performance of agency compliance
with the RFA and Executive Order 13272, and Advocacy efforts to improve the analysis of small business impacts and to persuade agencies to afford relief to small businesses.18 This comprehensive report contains four main sections. Section one provides a brief overview of the RFA, as amended by SBREFA. Section two details the role of Advocacy. This section also breaks down Advocacy activities in Fiscal Year 2003. Section three provides a snapshot of several of the rulemakings in which Advocacy effectively represented the interests of small entities. Section four of this annual report provides a brief overview and update on the report submitted to OMB on agency compliance with E.O. 13272 for Fiscal Year 2003. Please visit Advocacy’s website at http://www.sba.gov/advo to learn more about Advocacy, review regulatory comment letters, and obtain useful research relevant to small entities.
Impact on Wages
The impact of Federal regulations on wages depends upon how “wages” are defined and on the types of regulations involved. If we define “wages” narrowly as workers’ take-home pay, social regulation usually decreases average wage rates, while economic regulation often increases them, especially for specific groups of workers. If we define “wages” more broadly as the real value or utility of workers’ income, the directions of the effects of the two types of regulation can sometimes be reversed.
1. Social Regulation
Social regulation—defined as rules designed to improve health, safety, and the
environment—creates benefits for workers, consumers, and the public. Compliance costs, however, must be paid for by some combination of workers, business owners, and/or consumers through adjustments in wages, profits, and/or prices. This effect is most clearly recognized for occupational health and safety standards. As one leading textbook in labor economics suggests: “Thus, whether in the form of smaller wage increases, more difficult working conditions, or inability to obtain or retain one’s first choice in a job, the costs of compliance with health standards will fall on employees.”19
18 Office of Advocacy, U.S. Small Business Administration 2004. Report on the Regulatory Flexibility Act, FY 2003: The Annual Report of the Chief Counsel for Advocacy on Implementation of the Regulatory Flexibility Act and Executive Order 13272. Available at: http://www.sba.gov. 19 From Ehrenberg, R. and R. Smith 1991. Modern Labor Economics, 4th Edition. HarperCollins, p. 279.
27

2005 Report to Congress on the Costs and Benefits of Federal Regulations
In the occupational health standards case, where the benefits of regulation accrue mostly to workers, workers are likely to be better off if health benefits exceed compliance costs and such costs are not borne primarily by workers.20 Although wages may reflect the cost of compliance with health and safety rules, the job safety and other benefits of such regulation can compensate for the monetary loss. Workers, as consumers benefiting from safer products and a cleaner environment, may also come out ahead if regulation produces significant net benefits for society.
2. Economic Regulation
For economic regulation, defined as rules designed to set prices or conditions of entry for specific sectors, the effects on wages may be positive or negative. Economic regulation can result in increases in income (narrowly defined) for workers in the industries targeted by the regulation, but decreases in broader measures of income based on utility or overall welfare, especially for workers in general. Economic regulation is often used to protect industries and their workers from competition. These wage gains come at a cost in inefficiency from reduced competition, a cost which consumers must bear. Workers wages do not go as far when prices for goods that are inefficiently produced are relatively higher. Moreover, growth in real wages, which are limited generally by productivity increases, will not grow as fast without the stimulation of outside competition.21
These statements are generalizations of the impact of regulation in the aggregate or by
broad categories. Specific regulations can increase or decrease the overall level of benefits accruing to workers depending upon the actual circumstances and whether net benefits are produced.
20 Based on a cost benefit analysis of OSHA’s 1972 Asbestos regulation by Settle (1975), which found large net benefits, Ehrenberg and Smith cite this regulation as a case where workers’ wages were reduced, but they were made better off because of improved health (p. 281). 21 Winston (1998) estimates that real operating costs declined 25 to 75 percent in the sectors that were deregulated over the last 20 years—transportation, energy, and telecommunications. See Winston, C. (1998), “U.S. Industry Adjustment to Economic Deregulation”, Journal of Economic Perspectives 12(3): 89-110.
28

I: The Costs and Benefits of Federal Regulations
Economic Growth and Related Macroeconomic Indicators
The strongest evidence of the impact of smart regulation on economic growth is the differences in per capita income growth and other indicators of well being experienced by countries under different regulatory systems. A well-known example is the comparison of the growth experience of the present and former Communist state-controlled economies with the more market-oriented economies of the West and Pacific Rim. State-controlled economies may initially have had growth advantages because of their emphasis on investment in capital and infrastructure but, as technology became more complex and innovation a more important driver of growth, the state-directed economies fell behind the more dynamic and flexible market-oriented economies. Less well known are the significant differences in growth rates and indicators of well being, perhaps for the same reasons, seen among economies with smaller differences in the degree of government control and the quality of regulation.22
Several groups of researchers have developed indicators of economic freedom to rank countries and compare their economic performance. Since 1995, the Heritage Foundation and the Wall Street Journal have published jointly a yearly index of economic freedom for 161 countries. They find a very strong relationship between the index and per capita GDP.23 The index, based mostly on subjective assessments by in-house experts, is composed of 50 independent variables divided into 10 broad factors that attempt to measure different aspects of economic freedom: trade policy, fiscal burden, government intervention, property rights, banking and finance, wages and prices, regulation, and informal market activity. A correlation between degrees of economic freedom and per capita GDP does not prove that economic freedom causes economic growth. Economic growth could cause economic freedom or both could be correlated with an unknown third factor. More suggestive is the data on changes in these indicators. The authors examine the relationship between the change in the index since 1995 and the average GDP growth rate over seven years. After grouping the 142 countries (for which they had complete data) into quintiles, they find a very strong association between improvement in the index and growth rates. The first quintile of countries grew at a rate of 4.9% per year, almost twice the 2.5% growth rate of the fifth quintile.
Since 1997, the Fraser Institute of Vancouver, B.C. has published the Economic Freedom of the World index for 123 countries.24 The rank of the top ten economies is Hong Kong (1), Singapore (2), New Zealand, Switzerland, the United Kingdom, and the United States (3), Australia and Canada (7), and Ireland and Luxembourg (9). The index, which is based on 38 variables, many of them from surveys published by other institutions, measures five major concepts: size of government, legal structure and security of property rights, access to sound money, freedom of exchange with foreigners, and regulation of credit, labor, and business. The latest report finds that the index is highly correlated not just with per capita income and economic growth, but with other measures of well being, including life expectancy, the income 22 A new discipline has developed to examine these differences. See S. Djankov, E. Glaeser, R. La Porta, F. Lopez-de-Salinas, and A. Shleifer, “The New Comparative Economics,” Journal of Comparative Economics (December, 2003) Vol. 31.4, pp 595-619. 23 Marc A. Miles, Edwin J. Feulner, Jr., Mary Anastasia O’Grady, and Ana I. Eiras, 2004 Index of Economic Freedom. (Heritage Foundation/WallSteet Journal). 24 James Gwartney and Robert Lawson, Economic Freedom of the World: 2004 Annual Report. Fraser Institute, Vancouver, BC.
29

2005 Report to Congress on the Costs and Benefits of Federal Regulations
level of the poorest 10%, adult literacy, corruption-free governance, civil liberties, the United Nations’ Human Development Index, infant survival rates, and the absence of child labor. Economic growth does not appear to come at the expense of these other measures of well being. This is reassuring because GDP and other economic measures do not capture all the costs and benefits produced by regulation.
Although these statistical associations provide broad support for the claim that excessive and poorly designed regulation reduces economic growth and other indicators of well being, they have several drawbacks. First, the data are based largely on subjective assessments and survey results. In addition, they include non-regulatory indicators as well as indicators of direct regulatory interventions, such as measures of fiscal burden and soundness of monetary policy.
In an attempt to provide less subjective measures of regulatory quality, the World Bank recently began a multi-year project to catalogue differences in the scope and manner of regulations among 155 countries based on objective measures of regulatory burden – such as the number of procedures required to register a new business and the time and costs of registering a new business, enforce a contract, or go through bankruptcy. The first volume (Doing Business in 2004, Understanding Regulation) of the annual series examines five of the fundamental aspects of a firm’s life cycle: starting a business, hiring and firing workers, enforcing contracts, obtaining credit, and closing a business.25 The second volume (Doing Business in 2005, Removing Obstacles to Growth) updates these measures and adds data about registering property and protecting investors.26 The third volume (Doing Business in 2006, Creating Jobs) updates the previous measures, expands the number of countries to 155, and adds three more sets of indicators: dealing with licenses, paying taxes, and trading across borders. 27 The first volume contained three major conclusions:
• Regulation varies widely around the world; • Heavier regulation of business activity generally brings bad outcomes, while clearly
defined and well-protected property rights enhance prosperity; and • Rich countries regulate business in a consistent manner. Poor countries do not.
The second volume added three more main findings:
• Businesses in poor countries face much larger regulatory burdens than those in rich countries.
• Heavy regulation and weak property rights exclude the poor from doing business. • The payoffs from reform appear large.
The World Bank also finds that rich countries regulate less in all respects covered in the
report and that common law and Nordic countries regulate less than countries whose legal systems are based on socialist principles. The top ten countries ranked on the ease of doing business based on the ten indicators are in order: New Zealand, Singapore, the United States,
25 World Bank. Doing Business in 2004: Understanding Regulation. Oxford Press. Washington, DC. 26 World Bank. Doing Business in 2005: Removing Obstacles to Growth. Oxford Press. Washington, DC. 27 Word Bank. Doing Business in 2006: Creating Jobs. Washington, DC.
30

I: The Costs and Benefits of Federal Regulations
Canada, Norway, Australia, Hong Kong (China), Denmark, the United Kingdom, and Japan.28 Like the studies based on broader and more subjective indicators, the World Bank study
finds that both labor productivity and employment are positively correlated with less regulation. The World Bank study also finds that heavier regulation is associated with greater inefficiency of public institutions and more corruption. The result is that regulation often has a perverse effect on the people it is meant to protect. Overly stringent regulation of business creates strong incentives for businesses to operate in the underground or informal economy. The study cites the example of Bolivia, one of the most heavily regulated economies in the world, where an estimated 82% of business activity takes place in the informal sector. The study also found that women’s share of private sector employment was also correlated with less rigid regulation of labor markets.
Third, the study finds that rich countries tend to regulate consistently across the five
indicators, as measured by the statistical significance of their 15 cross correlations compared to the cross correlations of poor countries. The World Bank suggests that poor countries have made some progress in some reform areas but not others and that this finding suggests some optimism that these reforms may spread. The study estimates that if the countries in the bottom three quartiles were able to move up to the top quartile in the “doing business” indicator rankings, they would be able to realize a 2% increase in annual economic growth.
Based on its analysis of the impact of regulation on economic performance, the World
Bank concludes that countries that have performed well have five common elements to their approach to regulation:
1. Simplify and deregulate in competitive markets. 2. Focus on enhancing property rights. 3. Expand the use of technology. 4. Reduce court involvement in business matters. 5. Make reform a continuous process.
It is interesting to note that these principles correspond fairly closely to the principles of regulatory reform that the U.S. has attempted to follow over the last 25 years.29
The strong relationship between excess regulation and economic performance persists even when the sample of countries is confined to the 30 mostly high-income democracies in the Organization for Economic Cooperation and Development (OECD). The OECD also has
28 See Doing Business in 2006, p. 3. There is a high degree of association between this ranking, which is based on objective measures, and the ranking from the Gwartney and Lawson study, which was based on subjective assessments. 29 For a description of the United States’ regulatory reform program, see Executive Order 12291, Federal Regulation, (February 17, 1981), Executive Order 12866, Regulatory Planning and Review, (September 30, 1993) and Chapter 1 of Stimulating Smarter Regulation:2002 Report to Congress on the Costs and Benefits of Regulations and Unfunded Mandates on State, Local, and Tribal Entities. Office of Management and Budget and OMB Circular A-4, Regulatory Analysis, reproduced as Appendix D in Informing Regulatory Decisions: 2003 Report to Congress on the Costs and Benefits of Regulations and Unfunded Mandates on State, Local, and Tribal Entities, Office of Management and Budget.
31

2005 Report to Congress on the Costs and Benefits of Federal Regulations
underway major work on this subject. A recent report by Giuseppe Nicoletti summarizes the findings of the OECD work as follows:
“The empirical results suggest that regulatory reforms have positive effects not only in product markets, where they tend to increase investment, innovation and productivity, but also for employment rates.”30
According to the OECD’s database of objective measures assembled in 2001, the OECD countries with least restrictive regulation in order are: the United States, the United Kingdom, Canada, Ireland, and New Zealand and the five with the most restrictive regulation in order are: Portugal, Greece, Italy, Spain, and France.31 One of the most interesting findings of the OECD work is that the least regulated countries tended to show the greatest improvement in their rates of multifactor productivity growth over the 1990s compared to the 1980s. Those countries also tended to show both the largest increase in the number of new small and medium-sized firms and in the rate of investment in research and development in manufacturing. These factors are thought to be important in increasing the growth rate of productivity and per capita income.
The major efforts to determine the effect of regulatory policies on economic performance described all use quite different indicators of regulatory quality and include different types of regulation, yet reach very similar conclusions. Nicoletti and Pryor examined three different indices of regulation, one objectively estimated and two based on subjective surveys of businessmen; one that just examined product markets, one that examined product and labor markets and one that includes financial and environmental regulations. The paper found statistically significant correlations among the three indices despite the differences in coverage and methodologies.32 A second group of researchers, who have done work for the World Bank, also finds a strong correlation between regulation of entry into markets and the regulation of labor. They attribute this to their finding that the legal origin of regulation explains regulatory style. As they put it … “countries have regulatory styles that are pervasive across activities and shaped by the origin of their laws.”33 Thus, countries with good records on entry regulation (which they point out includes some environmental regulation) also have good records on labor regulation.34
A more recent body of literature, which combines the data sets of regulatory indicators discussed above as well as others, provides additional support to the supposition that excess regulation tends to reduce growth. Several papers by Loayza, Ovieda, and Serven use instrumental variable techniques to isolate the exogenous variation in regulation and determine the causal impact of regulation on economic growth, thereby reducing the reverse causality
30 Giuseppe Nicoletti, “The Economy-Wide Effects of Product Market Reform”. (OECD. Paris, December 2003). Also see Nicoletti and Stefano Scarpetta, “Regulation, Productivity, and Growth: OECD Evidence,” World Bank Policy Research Paper 2944 (January 2003). 31 See Giuseppe Nicoletti and Frederic Pryor, “Subjective and Objective Measures of the Extent of Government Regulation,” Journal of Economic Behavior and Organization (forthcoming), Table 3. 32 Ibid. 33 Juan Botero, Simeon Djankov, Rafael La Porta, Florencio Lopez-de-Salinas, and Andrei Shleifer, “The Regulation of Labor,” The Quarterly Journal Of Economics (2004). 34 Ibid.
32

I: The Costs and Benefits of Federal Regulations
problem discussed above.35 These studies also find that when the quality of regulation as measured by indicators of better governance (such as democratic accountability and absence of corruption) increases, the regulatory burden effect is smaller. These studies also find that both the volatility of economic growth and the size of the informal sector increase with regulation.
This pattern of findings provides strong support for policies that pursue “Smarter” or “Better” regulation36 -- whether the country is a high-income OECD country or a developing country. The results are also consistent with economic theory, which predicts that economic growth is enhanced by regulatory policies that promote competitive markets, secure property rights, and intervene to correct market failures rather than to increase state influence.37
The World Bank measures of regulation, in particular, are weighted toward economic
policy, although the recent inclusion of licensing requirements in Doing Business 2006 reduces that tendency. The ease of getting construction permits, which are mainly justified as safety measures, is used as the regulatory indicator. It is important to point out that these findings likely hold for social as well as economic regulation.38 Both types of regulation, if poorly designed, harm economic growth as well as the social benefits that follow from economic growth. Our regulatory analysis guidelines (OMB Circular A-4) have a presumption against price and entry controls in competitive markets and thus deregulation is often appropriate.39 For social regulation, Circular A-4 requires an analysis of the costs and benefits of regulations and their alternatives. In this case, smarter regulation may cause rules that are more stringent, less stringent, or just better designed to be more cost-effective. Regulation that utilizes performance standards rather than design standards or uses market-oriented approaches rather than direct controls is often more cost-effective because it enlists competitive pressures for social purposes. Social regulation often clarifies or defines property rights so that market efficiency is enhanced. Regulation that is based on solid economic analysis and sound science is also more likely to provide greater benefits to society at less cost than regulation that is not.40 Thus a smarter or better regulation program relies on sound analysis and utilizes competition to improve economic
35 Norma Loayza, Ana Maria Oveiodo, Luis Seven, “Regulation and Macroeconmic Performance,” World bank Policy Research Paper No. 3469 (2005) and Norma Loayza, Ana Maria Oveiodo, Luis Seven. “The Impact of Regulation on Growth and Informality: Cross-Country Evidence” AEI-Brookings Joint Center (May 2005). 36 The US uses the term “Smarter Regulation” and the UK, Canada, Ireland and the EU all use the term “Better Regulation” to describe their reform programs. 37 See S. Djankov, E. Glaeser, R. La Porta, F. Lopez-de-Salinas, and A. Shleifer, “The New Comparative Economics,” Journal of Comparative Economics (December, 2003) Vol. 31.4, pp 595-619. 38 Note that there is no bright line between economic and social regulation. Social regulation often establishes entry barriers and protects the status quo through the use of stringent requirements for new plants, products, or labor. Perhaps for this reason researchers our now using the term product market and labor market regulation to describe the different types of regulation. 39 Although many of the rules reviewed by OMB are social regulation, OMB also reviews many economic regulations and many social regulations have economic components. For example, OMB recently reviewed a series of rules that deregulated the computer reservation system used by travel agents and airlines due to changes in the market structure and technology. OMB also reviews labor, housing, pension, agricultural, energy, and some financial regulations, which also may be viewed as economic regulation. 40 The benefits of such a regulatory program will not show up just as an increase in measured GDP but will also show up as improvements in health, safety, and the environment. First, the regulations are designed to provide such public goods in the most cost-effective way, and second, the higher economic growth provided by a well-run regulatory reform program will increase the demand for, and the ability of the economy to supply, such public goods.
33

2005 Report to Congress on the Costs and Benefits of Federal Regulations
growth and individual well-being in similar ways for both economic and social regulation. It is not surprising that countries that do well with one type of regulation tend to do well with the other. Nevertheless, more research is needed to determine how different types of regulation (e.g., economic versus social rules or product market versus labor market regulations) influence economic growth and well being. G. Response to Peer Review and Public Comments on Economic Growth and Related Macroeconomic Indicators Several commenters mentioned the concern that different types of regulation can have different impacts on economic performance and therefore one should be careful in drawing inferences about the relationship between regulation and economic growth (3, 5, B). However, they differed on how well we took these differences into account. One peer reviewer (3), states that:
“This (section) is a concise, thoughtful and fair-minded review of a rapidly growing and important literature. It takes great pains to point out (in the final paragraph of the section) that most of the empirical results in this literature are concerned with economic and not social regulation, while most (but not all) of the regulation discussed in this report and that falls under OMB oversight is social regulation.”
This peer reviewer also pointed out that “it is also true that most social regulation is also ‘economic’ regulation in a larger sense for many of these regulations… have economic consequences.” The reviewer suggests that a more detailed break down than social and economic should be used. In response to this comment and the possible confusion of other readers, we have added a discussion of how the “social” and “economic” regulation distinction has become blurred and why recent researchers are using more detailed categories such as product and labor market regulation. Another concern expressed by several commenters is that our discussion was “anti-regulatory” and that we concluded that social regulation was harmful to growth (5, B). It was our intent to emphasized that these findings implied that economic growth is enhanced by “smarter” or “better” regulation that relies on competition, when appropriate, and careful analysis to design cost-effective regulation when that is appropriate. In response to these comments, we have tried to clarify that regulatory reform to enhance growth and social welfare includes improving the quality (including sometimes the amount) of regulation. Finally, several commenters applauded the inclusion of this section in the report (3, 4, E). One suggested that it provides additional information useful to policy makers that goes beyond that provided by benefit-cost information since the benefits and costs of regulations can not always be measured (4).
34

CHAPTER II: TRENDS IN FEDERAL REGULATORY ACTIVITY
Since OMB began to compile records in 1981, Federal agencies have published 113,798 final rules in the Federal Register. Of these final rules, 20,393 were reviewed by OMB under Executive Order procedures. Of these OMB-reviewed rules, 1,119 were considered "major" rules, primarily due to their anticipated impact on the economy (e.g., estimated costs and/or benefits were in excess of $100 million annually). As discussed in Chapter I, many major rules implement budgetary programs and involve transfers from taxpayers to program beneficiaries. Since 1981, OMB has reviewed 190 major rules with estimated costs and/or benefits to the private sector or State and local governments of over $100 million annually. To the best of OMB's knowledge, most of these rules have never been subject to an "ex post" analysis to determine whether they worked as intended and what their actual benefits and costs were. There is no systematic and comprehensive requirement for Federal agencies to validate their pre-regulation estimates of benefits and costs based on actual experience with the rule.1
Last year’s Report presented some preliminary estimates of the overall costs of major
rules issued by Federal agencies from 1987 to 2003. The estimates are based on the ex ante cost estimates found in agency regulatory impact analyses reviewed by OMB under EO 12291 prior to September 1993 and EO 12866 since then. The Report pointed out some of the concerns we had with these estimates, including the concern that because they are prospective, they might not present an accurate picture of these regulations' actual impacts. Chapter III surveys what we know about the validation of ex ante estimates of costs and benefits of Federal regulation by ex post studies.
Last year’s Report also suggested that a theoretically superior measure of the overall
value of regulation would be net benefits; that is, benefits to society minus costs to society. We said we would explore the feasibility of constructing such a measure. Below we present cost and benefit measures for the years 1992 to 2004 for 111 rules. In addition, we extend the cost estimates back to 1981, the beginning of the regulatory review program at OMB.2
In exploring the impact of rulemaking on the economy in the early 1980’s, we found that
several important de-regulatory actions resulted in a net decrease in compliance costs in the first two years of the Reagan Administration. We include the net cost savings generated by these regulations as “negative costs” for those years. To be consistent, we have also modified our estimates for later years to include regulatory actions that reduced net costs. In 2004, DOT issued two regulations that resulted in net cost savings: one rule reduced minimum vertical separation for airspace and the second increased competition in the computer reservation system for airline travel. In addition, OSHA’s ergonomics rule issued November 14, 2000 but repealed
1 Section 610 of the Regulatory Flexibility Act (5 USC 601 note) requires each Federal agency to develop a plan for a periodic review of its rules that have a significant economic impact on a substantial number of small businesses or entities and to publish a list of its intended reviews in the Federal Register. However, the Act does not require a validation study of the rule’s ex ante and ex post costs and benefits. 2 To present cost and benefit estimates by year, we generally used agency estimates of central tendency when available and took midpoints when not available.
35

2005 Report to Congress on the Costs and Benefits of Federal Regulations
by Senate Joint Resolution No. 6 passed by Congress and signed by the President in March 2001 (Public Law 107-5) is recorded as a $4.8 billion cost addition in 2000 and a $4.8 billion cost savings in 2001. This approach is consistent with treatment for earlier years. Another important change is the inclusion of DOT’s 1993 air bag rule, which had been left out of our calculations in 1993 because Congress had mandated the rule.3 We made this change to be consistent with OMB Circular A-4, Regulatory Analysis, issued September 2003. The Circular states that in situations where a rule simply restates statutory requirements, incremental costs and benefits should be measured relative to the pre-statute baseline.
Finally, EPA adopted significantly more stringent National Ambient Air Quality
Standards (NAAQS) for ozone and fine particulate matter (PM) in 1997. At that time, EPA estimated that the actions necessary to meet the revised standards would yield benefits ranging from $20 to $120 billion per year and would impose costs of $10 to $22 billion per year. In the five years following the promulgation of the 1997 ozone and fine PM NAAQS, EPA adopted several key rules that will achieve emission reductions and impose costs that account for a major portion of the benefit and cost estimates associated with the NAAQS rules. Thus, to prevent double-counting, we noted in our 2002 Report that in developing aggregate estimates of regulatory benefits and costs we had decided to exclude the estimates for the 1997 revisions of the ozone and fine PM NAAQS and use instead the estimates associated with the several "implementing" rules promulgated in subsequent years. Although the pattern of benefits and costs of the rules presented below is affected by the decision to focus on the actual implementing rules, the actual impacts and timing of those impacts is better measured by the cost and benefit estimates associated with the implementing regulations.
Figure 2.1 presents the new cost estimates from January 20, 1981 through September 30, 2004. Over the last 24 years, $117 billion of annual regulatory costs (2001 dollars) have been added by the major regulations issued by the executive branch agencies and reviewed by OMB. This means that, on average, almost $5 billion in annual costs have been added each year over this period. Several patterns are present. Note, in particular, the tendency for regulatory costs to be highest in the last year before a President leaves office (1988, 1992, and 2000). Note also that the annual average increase in regulatory costs in this Administration is lower than in any of the three previous Administrations. The average annual costs of the regulations issued during this Administration were 68% lower than the average annual costs of the regulations issued during the previous 20 years, and 76% lower than those issued during the previous eight years.
3 Our estimate of $4 billion in annual benefits and $3 billion in annual costs reflects the assumption that without the rule, 50% of the costs and benefits of airbags would have been provided by the market.
36

II: Trends in Federal Regulatory Activity
Figure 2-1: Costs of Major Rules (1981-2004)
-$5
$0
$5
$10
$15
$20
1981
1982
1983
1984
1985
1986
1987
1988
1989
1990
1991
1992
1993
1994
1995
1996
1997
1998
1999
2000
2001
2002
2003
2004
Billi
ons
of 2
001
dolla
rs
Figure 2-2 shows the costs and benefits of major rules issued from October 1, 1992 to
September 30, 2004. Benefit estimates for the rules (with two noted exceptions)4 that comprise the overall estimates are presented in various tables in the eight annual reports (including this draft report) that OMB has completed. Note that the two highest years for benefits, 1992 and 2004, are mostly explained by two EPA regulations, the 1992 acid rain permits regulation and the 2004 non-road diesel engine rule. Since more major rules had cost estimates than benefit estimates, it is likely that benefit estimates are understated relative to the cost estimates included in Figure 2. The figure also shows that, during its first 44 months in office, this Administration has issued regulations with average yearly benefits 25% greater than the average annual benefits of the rules issued during the previous eight years.
4 The two exceptions, as discussed above, are NHTSA’s 1993 airbag rule and OSHA’s 2000 ergonomics rule. We did not include benefit estimates for the ergonomics rule because of the speculative nature of the estimates and the difficulty of determining the cause and/or mitigation of the great majority of ergonomic injuries. After the rule was overturned under provisions of the Congressional Review Act, the number of muscular skeletal disorders (MSDs) declined significantly more than OSHA’s RIA predicted would occur under the standard. The RIA estimated that MSDs would decline from 647,344 to 517,344 after 10 years of compliance. Instead, three years after the standard (which had never gone into effect) had been overturned, MSDs declined to 435,180 in 2003 (the last year for which data is available). The reason that voluntary actions to reduce MSDs are effective may be that employers and employees alike have strong incentives, due to worker’s compensation costs and loss productivity, to reduce the incidence of MSDs.
37

2005 Report to Congress on the Costs and Benefits of Federal Regulations
Figure 2-2: Costs and Benefits of Major Rules (1992-2004)
-$10
$0
$10
$20
$30
$40
$50
$60
$70
$80
$90
1992
1993
1994
1995
1996
1997
1998
1999
2000
2001
2002
2003
2004
Billi
ons
s of
200
1 do
llars
Costs Benefits
The difference between cost and benefits shows the net benefits of major regulations from 1992 though September 2004. We were unable to go back beyond 1992 because of a lack of comparable data on benefits. Note that again the two end years dominate. The figure also shows that in no year were costs significantly greater than benefits, even though benefits are likely understated relative to the cost estimates since some rules had estimated costs but not estimated benefits.5 Figure 2-2 also shows that this Administration issued regulations with net benefits over its first 44 months at a yearly average rate that is more than double the rate of net benefits produced by the regulations issued during the previous Administration.
However, we wish to emphasize that (1) these estimates are preliminary (2) as discussed
in other sections of this Report (see Appendices A and B) as well as previous reports, the aggregate estimates of costs and benefits derived from different agency’s estimates and over different time periods are subject to methodological inconsistencies and differing assumptions, and (3) the groundwork for the regulations issued by one administration are often begun in a previous administration.6
5 In 1993 and 1995, costs exceeded benefits by about $400 million in each year. 6 For example, FDA’s trans fat rule was proposed by the previous Administration and issued by the Bush Administration while the groundwork for EPA’s 2004 non-road diesel engine rule was set by the NAAQS rules issued in 1997. Moreover, Congress and the Judiciary also play a role in the timing and outcomes of regulations.
38

II: Trends in Federal Regulatory Activity
Response to Peer Reviews and Public Comments on Trends in Regulatory Activity
Two peer reviewers expressed concern that the comparison of average annual costs and benefits of regulations issued during this Administration with previous years could be misleading. Both the dominance of several rules with large benefits and costs and the fact that Congress mandated or rescinded important rules influences the comparisons (3, 5).7 We agree and had pointed out this problem. We suggested that it is indeed difficult to attribute costs and benefits to any one administration. One reviewer suggested that a sensitivity analysis and a separation of congressionally mandated rules from administrative actions would be useful “…for determining whether it is Congress, or the agency, that tends to be irrational” (5). Given the interplay between Congress, the executive branch, and (we might add) the judiciary in our form of government, it would not be easy to determine which branch of government should be credited with which cost or benefit. In any case, this task is certainly beyond the scope of the present study. However, we have attempted in this final Report to make it clearer that one administration should not be completely credited or blamed for regulations that are a long time in the making or that are shaped in varying degree by statute or court order.
The same peer reviewer also wondered why we included the costs of OSHA’s ergonomics regulation but not its benefits (5). As discussed above, this rule was overturned in 2001 in unprecedented fashion using a provision of the Congressional Review Act, which has not been used since. In response to the reviewer, we have added an explanation that points out that the benefits that were predicted by the RIA to occur in ten years as a result of the regulation were exceeded without the regulation by over 50% within just three years. This evidence is strongly suggestive that the regulation if it had not been overturned would have been counter productive.
Another peer reviewer suggested that the three charts in the draft could be made visually clearer by superimposing costs and benefits on one chart (3). We have done that above. The same peer reviewer also suggested that we separate the regulatory trends discussion from the validation discussion in Chapter II into two chapters. We have also done that.
7 See appendix F for a listing of all the written comments we have received, and the numbers or letters we have assigned to their comments. The public and peer review comments are available for review at http://www.whitehouse.gov/omb/inforeg/regpol-reports_congress.html.
39


CHAPTER III: VALIDATION OF BENEFIT AND COST ESTIMATES MADE PRIOR TO REGULATION
When Federal agencies prepare regulatory impact analysis in support of major rules, they
are expected to include estimates of the benefits and costs of these rules. Since these estimates are prepared prior to issuance of the rule, they are "ex ante" estimates, or forecasts of what the agency expects will happen when the rule takes effect. However, an ex ante estimate is no more than an informed guess and, like other forms of prospective modeling, the estimates may or may not prove to be accurate, once real-world experience with the rule is accumulated and analyzed. The regulatory accounting data published in this annual Report -- such as the benefit and cost figures in Chapter 1 -- are based on ex ante estimates of benefits and costs that were prepared by Federal agencies and published in regulatory impact analyses.
When the benefits and costs of a rule are estimated after the rule has taken effect, they are considered "ex post" estimates, or retrospective evaluations of what has actually happened due to issuance of the rule. For major rules that are subject to ex post (retrospective) benefit-cost analysis, it may be feasible to determine whether the pre-regulation estimates were accurate. Where inaccuracies are discovered, it is useful to understand the direction and magnitude of estimation errors, including the nature and sources of those errors. Some of these errors may be due to poor estimation procedures that could be corrected and others due to unforeseeable circumstances (e.g., policy or enforcement changes after the rule was issued).
The analytic process of comparing ex post (post-regulation) to ex ante (pre-regulation)
estimates is considered a form of "validation" analysis because an effort is being made to determine the validity (accuracy) of the pre-regulation forecasts. Validation studies are useful in several ways. They can assist policy makers in determining how much weight to give to benefit-cost information compared to other kinds of information in the regulatory process. Validation studies can also help pinpoint ways to improve the accuracy of benefit-cost estimates in the future. Finally, validation studies can help identify specific rules that are ripe for regulatory reform, since their benefit-cost balance may be more or less favorable than originally expected.
It should be noted that a validation study designed to determine the accuracy of ex ante
estimates does not by itself provide full guidance on the desirability of reforming the existing regulation. For example, the costs and benefits of rescinding a regulation are not the inverse of the costs and benefits of promulgating a regulation. The compliance cost savings of rescinding an existing regulation will be lessoned by the sunk costs (e.g., one-time equipment costs). In addition, people may value actual lost benefits differently than anticipated benefits. In any case, the ex post analysis in its own right provides useful information about the desirability of modifying (including strengthening) or rescinding the regulation.
There is a small yet growing body of literature where analysts have attempted to validate pre-regulation estimates of benefits and costs. The Draft 2005 Report reproduced, without comment, abbreviated summaries, conclusions, and/or/abstracts from a variety of ex-post studies that have examined (or would enable a direct evaluation of) the validity of benefit and/or cost estimates of one or more individual rules. We sought public comment on this body of literature,
41

2005 Report to Congress on the Costs and Benefits of Federal Regulations
including any additional validation studies that OMB had not identified. We also requested that commenters address which institutions, both inside and outside of government, are best equipped to undertake objective, high-quality validation studies and what regulatory reforms would be appropriate to consider as the body of validation studies grows in the future. The purpose of this chapter is to summarize the findings from this validation literature, identify possible explanations for inaccuracies that are identified, and discuss possible ways that the validity of ex ante estimates of benefits and costs can be improved. A. Summary of the Validation Literature
Table 3-1 is a summary of 47 Federal rules where pre-regulation estimates of benefits and costs were made by Federal agencies and some post-regulation information was published by academics or government agencies. The pre-regulation information was extracted from formal regulatory impact analyses prepared by Federal agencies prior to issuance of the rules. The post-regulation information was extracted from subsequent reports published by academics or government agencies. All of the information used to construct Table 3-1 is already publicly available. The 47 rules are a compilation of all the specific rules that met the inclusion criteria1 and were either identified by OMB in the literature or were brought to our attention as a result of the public-comment and peer-review processes undertaken for this Report.
The 47 rules were issued during the 1975-1996 period: seven in the 1970s, 20 in the 1980's, and 20 in the 1990's. The rules were published by five Federal agencies: the Occupational Safety and Health Administration (13), the National Highway Traffic Safety Administration (8), the Environmental Protection Agency (18), the Department of Energy (6) and the Nuclear Regulatory Commission (2). OSHA rules are heavily represented because they were subject to systematic inquiry by the U.S. Office of Technology Assessment (OTA 1995), OMB (1998), and Seong and Mendeloff (2004). EPA regulations are heavily represented because 13 of the 18 EPA regulations are bans or restrictions of pesticide use, which were systematically studied by Gianessi (1999).
Table 3-1 contains summary information on benefits, costs and a “benefit-cost ratio”, the latter being a surrogate for net benefits (benefits - costs).2 Each pre-regulation estimate is considered to be "accurate," “over,” or “under.” For the purposes of this table, the term "accurate" means that the post-regulation estimate is within +/- 25 percent of the pre-regulation estimate. Although this standard of accuracy is arbitrary, it was applied consistently to all 47 rules and follows a convention established in the literature by a team of analysts from Resources for the Future (Harrington, Morgenstern and Nelson, 2000). Where the magnitude of the error was documented, Table 3-1 includes such information.
1 The criteria to be included are that a rule must be an individual U.S. Federal regulation, for which a Federal agency published cost and benefit estimates prior to promulgation and an academic or government agency published benefit and cost estimates after the regulation had been in effect for at least several years. 2 A ratio was used because in most cases benefits were not monetized and, in some cases, unit benefits were not projected for health or environmental improvements. This is not the classic benefit-cost ratio with all (or most) benefits and costs monetized. It is used here to compare ex ante and ex post estimates.
42

III: Validation of Benefit and Cost Estimates
Table 3-1: Summary of Validation Case Studies
Regulation Year Issued
Benefits Costs Benefit-Cost Ratio
Sources
OSHA Coke Ovens (engineering controls)3
1975 Over Under Over Mendeloff (1988)
Cotton Dust (textile sector)
1978 Over (more than a factor of 5)
Over (factor of 5)
Accurate Morrall (1981), OSHA (1983), Viscusi (1992)
Cotton Dust (non-textile sectors)4
1978 Over (significantly)
Under Over OSHA (1985)
Lead (engineering controls for smelters)5
1978 Over Under Over OTA (1995)
Ethylene Oxide (hospitals)
1984 Accurate Accurate Accurate OTA (1995)
Formaldehyde (metal foundries)6
1987 Over (factor of at least 10)
Over (factor of 2)
Over (factor of at least 5)
OTA (1995), Morrall (2003)
Powered Platforms7
1989 Not Estimated Under Over Harrington et al. (2000), OMB (1998)
Electrical Work Practices
1990 Over (factor of at least 5)
Not estimated Over Seong and Mendeloff (2004)
Process safety Management
1991 Over (factor of 10)
Not estimated Over Seong and Mendeloff (2004)
Confined Spaces
1993 Over (factor of 2)
Not estimated Over Seong and Mendeloff (2004)
3 Engineering controls found to be not feasible, therefore the rule was not fully implemented. 4 Later deregulated because it was determined that there was no significant risk. 5 Engineering controls found to be not feasible, therefore the rule was not fully implemented. 6 A substitute was found, which lowered costs, but the initial cancer risk overestimated. 7 Our findings on this rule differ from Harrington et al (2000), which stated that benefits were overestimated, costs were underestimated, and the benefit-cost ratio was accurate. We believe this an inaccurate description of the ex-post findings. OMB analyzed this rule, which allowed for an alternative compliance strategy, in our 1998 report. OSHA assumed ex-ante that the benefits of the regulation would be identical under both compliance strategies, but did not otherwise analyze benefits. After adoption, voluntary uptake of the alternative was lower than OSHA assumed, implying that the ex-ante cost of the alternative compliance investment was too low, the ex-ante cost savings of the alternative investment were too high, or both. Therefore, we believe that “not estimated” benefits and an “overstated” benefit-cost ratio is a more accurate description of the ex-post findings than the Harrington et al description.
43

2005 Report to Congress on the Costs and Benefits of Federal Regulations
Table 3-1: Summary of Validation Case Studies Regulation Year
Issued Benefits Costs Benefit-Cost
Ratio Sources
Electric Power Generation8
1994 Over Not estimated Over Seong and Mendeloff (2004)
Logging9 1994 Over Not estimated Over Seong and Mendeloff (2004)
Scaffolds in Construction10
1996 Over Not estimated Over Seong and Mendeloff (2004)
Nuclear Regulatory Commission Station Blackout Rule
1988 Accurate (under by factor of 1.2)
Not estimated Accurate NRC (2003a)
Anticipated Transient Without Scram Rule
1984 Not estimated Over (factor of 2.1)
Under NRC (2003b)
Department of Energy Room Air Conditioner Energy Efficiency: Small size
1990 Not estimated Over (factor of 6.2)
Under Dale et al. (2002)
Room Air Conditioner Energy Efficiency: Medium size
1990 Not estimated Over (factor of 7.3)
Under Dale et al. (2002)
Central Air Conditioner Energy Efficiency: Small size
1982 Not estimated Over (factor of 1.6)
Under Dale et al. (2002)
Central Air Conditioner Energy Efficiency: Large size
1982 Not estimated Accurate (over by a factor of 1.1)
Accurate Dale et al. (2002)
Refrigerator Energy Efficiency
1995 Not estimated Accurate (over by a factor of 1.2)
Accurate Dale et al. (2002)
8 Ex post analysis showed no benefits from regulation. 9 Ex post analysis showed no benefits from regulation. 10 Ex post analysis showed no benefits from regulation.
44

III: Validation of Benefit and Cost Estimates
Table 3-1: Summary of Validation Case Studies Regulation Year
Issued Benefits Costs Benefit-Cost
Ratio Sources
Clothes Washer Energy Efficiency
1990 Not estimated Over (factor of 1.3)
Under Dale et al. (2002)
NHTSA Center High- Mounted Stop Lamp11
1983 Over (factor of 8)
Under (factor of 2)
Over (factor of 16)
NHTSA (1998), OMB (1998)
Head Restraints in Light Trucks
1989 Over (factor of 2.1)
Over (factor of 1.5)
Over (factor of 1.4)
NHTSA (2001b)
Side Impact Protection for Light Trucks
1991 Under (factor of 2)
Accurate (under by (factor of 1.2)
Under (factor of 1.7)
NHTSA (2004)
Bumper Standard12
1982 Over (factor of about 2)
Over (factor of about 2)
Accurate
NHTSA (1987)
Retroreflective tape on heavy trucks
1992 Under (factor of 2 to 3)
Accurate Under (factor of 2 to 3)
NHTSA (2001a)
Rear Seat Lap-Shoulder Belts
1989 Accurate (under by a factor of 1.1)
Over (factor of 1.9)
Under (factor of 2.1)
NHTSA (1999)
Air Bags: Driver only
1984 Over (factor of 2.5)
Accurate Over (factor of 2.4)
Thompson et al (2002)
Air Bags: Dual13
1984 Over (factor of 4.1)
Under (factor of 1.4)
Over (factor of 5.5)
Thompson et al (2002)
EPA DBCP (beans, okra, peas)
1977 Accurate Under (factor of 1.4)
Over (factor of 1.4)
Gianessi (1999)
DBCP (cotton) 1977 Accurate Accurate Accurate Gianessi (1999) DBCP (grapes) 1977 Accurate Over (factor of
20) Under (factor of 20)
Gianessi (1999)
CDEC (lettuce) 1884 Accurate Under Over Harrington et al (2000)
Nitrofen (broccoli)
1984 Accurate Over Under Harrington et al (2000)
Dinoseb ban (peanut crop) 14
1986 Accurate Under Over Harrington et al (2000)
11 The cost-effectiveness was found to decline over time, but now thought to be stable. In absolute terms, it is still very cost-effective. 12 NHTSA concluded that both the installation cost savings per car and the increased property damage per car were overestimated by roughly a factor of two, leaving the ratio of benefits to costs unchanged. The analysis estimated that the net benefits per car dropped from $15 to $8 13 Dual airbag estimates are incremental to driver-only. 14 Our findings on this rule differ from Harrington et al (2000), which stated that benefits were accurate, costs were overestimated, and the benefit-cost ratio was underestimated. We believe this an inaccurate description of the ex-post findings. EPA granted an emergency exemption for the use of paraquat, as a substitute for Dinoseb, on peanut farms after this rule went into effect. Paraquat is less expensive than Dinoseb, but it is not necessarily more cost
45

2005 Report to Congress on the Costs and Benefits of Federal Regulations
Table 3-1: Summary of Validation Case Studies Regulation Year
Issued Benefits Costs Benefit-Cost
Ratio Sources
Dinoseb ban (potatoes)
1986 Accurate Under (factor of 1.3)
Over (factor of 1.3)
Gianessi (1999)
Aldicarb ban 1988 Over Under Over Harrington et al. (2000)
CFCs 1988 Accurate Accurate Accurate Harrington et al. (2000)
Chlordimeform (cotton)
1989 Accurate Over (factor of 10)
Under (factor of 10)
Gianessi (1999)
SO2 Phase I15 1990 Accurate Accurate Under Harrington et al. (2000)
NOx 1990 Accurate Accurate Accurate Harrington et al. (2000)
Ethyl Parathion (almonds)
1991 Accurate Under (factor of 1.5)
Over (factor of 1.5)
Gianessi (1999)
Ethyl Parathion (peaches)
1991 Accurate Over (factor of 1.5)
Under (factor of 1.5)
Gianessi (1999)
I/M vehicles 1992 Over Accurate Over (factor of 2.9)
McConnell and Ando (2000)
Reformulated gas
1993 Over Over Accurate Harrington et al. (2000)
Mephinvos (artichokes)
1995 Accurate Accurate Accurate Gianessi (1999)
Propargite (strawberries)
1996 Accurate Over (factor of 24)
Under (factor of 24)
Harrington et al (2000)
With a few exceptions, the accuracy of the benefits estimates refers to the physical quantities of benefits (e.g., the number of lives saved or tons of pollution prevented by the rule). Any errors in the monetary valuation of the benefits are not disclosed. "Costs" generally refer to the monetary value of the resources (labor and capital) consumed in regulatory compliance activities and do not include indirect costs or the costs to Federal agencies of developing the rules. "Benefits to Cost" refers to the rule's ratio of estimated benefits to estimated cost (e.g., lives saved vs. cost or tons of pollution averted vs. cost). Table 3-1 typically refers to average benefit-to-cost ratios that were computed compared to a "do nothing" alternative. Since a large ratio of benefit to cost is good, an overestimate of the ratio means the rule is worse than expected while an underestimate means that the rule is better than expected.
Table 3-2 provides a tabulation of the characteristics of the case studies. Ex post
information was missing for 8 benefit and 7 cost estimates across 15 rules. In cases where benefits and costs are “not estimated,” we have assumed that they were “accurate” for the purposes of calculating the benefit-cost ratio in Table 3-1 and reporting the totals in Table 3-2. effective, as the decline in crop yields from switching to this less effective, but cheaper pesticide was not estimated. We also concluded that the emergency exemption was granted in the face of evidence that the cost-effectiveness of the original ban was overestimated, therefore creating a need for an additional alternative. 15 The ability to bank pollution credits increased the benefit-cost ratio.
46

III: Validation of Benefit and Cost Estimates
With regard to the validity of the benefit estimates, there were 18 rules with accurate
estimates, 19 rules with overestimates and two rules with underestimates. Twelve of the accurate estimates were due to pesticide bans by EPA that by definition achieved accurate physical unit reductions.16 On the cost side of the ledger, there were 12 rules with accurate estimates, 16 with overestimates, and 12 with underestimates. Since errors in benefit and cost estimates may offset each other, the validity of the benefit-cost ratio is considered to be especially important in regulatory analysis. There were 11 cases of accurate ratios, 22 overestimates and 14 underestimates.
Table 3-2: Tabulation of the 47 Case Studies
Benefits Costs Benefits-Cost Ratio Accurate 18 (38%) 12 (26%) 11 (23%) Over 19 (40%) 16 (34%) 22 (47%) Under 2 (4%) 12 (26%) 14 (30%) Not Estimated 8 (17%) 7 (15%) 0 (0%)
As a sensitivity analysis, we assumed that the accuracy of the benefit-cost ratio was not
calculable in cases where the either the benefits or costs were not validated. This alternative treatment would impact the six OSHA cases where benefit validity was determined but not cost validity, the six DOE cases where cost validity was determined but not benefit validity, two NRC cases, one of which validated only costs and the other of which validated only benefits, and one OSHA rulemaking where we determined that the benefits were not validated. Of the 32 rules remaining, 8 (25%) had accurate ratios, 15 (47%) had overestimates, and 9 (28%) had underestimates. In addition, because of the large number of pesticide cases (28% the total) and their relatively small economic costs, we evaluated the impact of excluding them from the full sample. Harrington et al. (2000) also noted several unique features that influence the evaluation of the accuracy of the pesticide ex ante analyses.17 However, if we exclude these case studies our findings are not changed. Of the 34 rules remaining, 9 (26%) had accurate ratios, 16 (47%) had overestimates, and 9 (26%) had underestimates. B. Nature and Limitations of the Sample of Rules Examined
Compared to the overall volume of Federal regulatory activity, it is remarkable how few rules have been subject to validation analysis. Since 1980 alone, OMB has reviewed over 1,100 major rules that were estimated to impact the economy by more than the $100 million threshold (about 400 of which were non-budgetary rules that mandated costs on state and local
16 In one case, Aldicarb, the ban was relaxed and ex ante benefits were, therefore, overestimated. 17 The authors explained that: (1) unique "safety valves" are available such as granting use of otherwise prohibited substitutes if cost burdens of a pesticide ban is much greater than anticipated, (2) pesticide are generally banned such that the benefits (i.e.. the quantity reduction) is almost always accurate, and (3) a cost-benefit test is required by statute so analysis is not limited to large regulations.
47
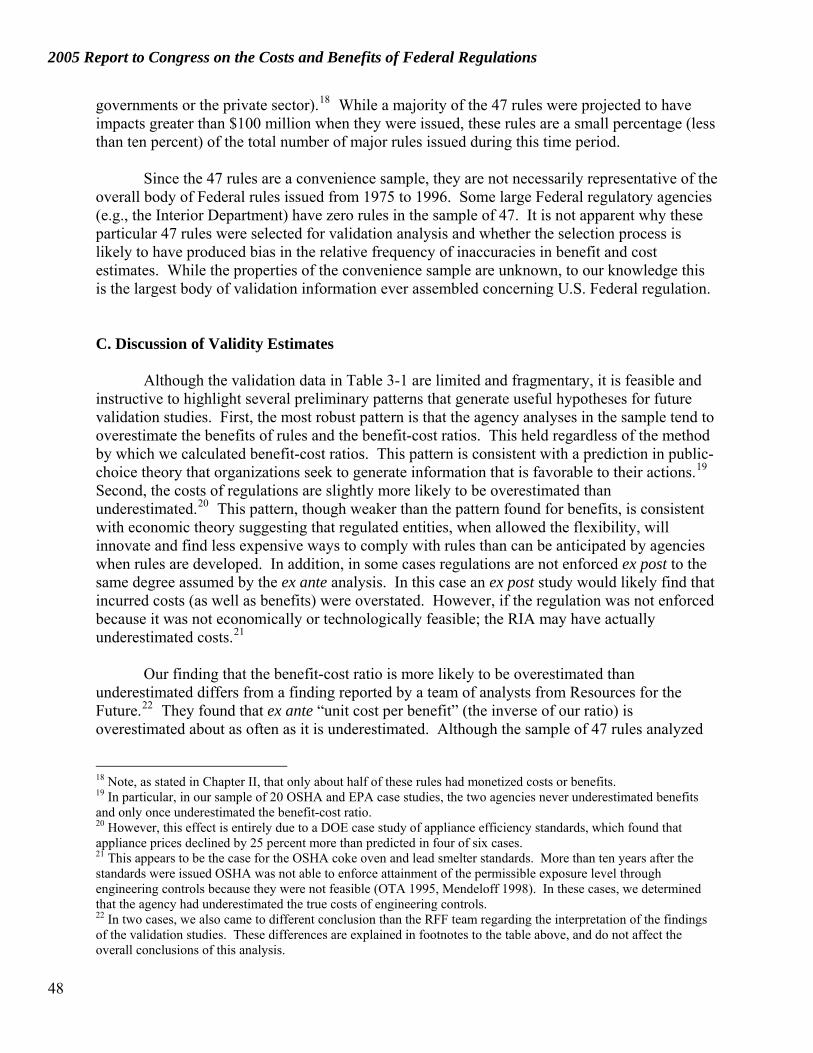
2005 Report to Congress on the Costs and Benefits of Federal Regulations
governments or the private sector).18 While a majority of the 47 rules were projected to have impacts greater than $100 million when they were issued, these rules are a small percentage (less than ten percent) of the total number of major rules issued during this time period.
Since the 47 rules are a convenience sample, they are not necessarily representative of the overall body of Federal rules issued from 1975 to 1996. Some large Federal regulatory agencies (e.g., the Interior Department) have zero rules in the sample of 47. It is not apparent why these particular 47 rules were selected for validation analysis and whether the selection process is likely to have produced bias in the relative frequency of inaccuracies in benefit and cost estimates. While the properties of the convenience sample are unknown, to our knowledge this is the largest body of validation information ever assembled concerning U.S. Federal regulation. C. Discussion of Validity Estimates
Although the validation data in Table 3-1 are limited and fragmentary, it is feasible and instructive to highlight several preliminary patterns that generate useful hypotheses for future validation studies. First, the most robust pattern is that the agency analyses in the sample tend to overestimate the benefits of rules and the benefit-cost ratios. This held regardless of the method by which we calculated benefit-cost ratios. This pattern is consistent with a prediction in public-choice theory that organizations seek to generate information that is favorable to their actions.19 Second, the costs of regulations are slightly more likely to be overestimated than underestimated.20 This pattern, though weaker than the pattern found for benefits, is consistent with economic theory suggesting that regulated entities, when allowed the flexibility, will innovate and find less expensive ways to comply with rules than can be anticipated by agencies when rules are developed. In addition, in some cases regulations are not enforced ex post to the same degree assumed by the ex ante analysis. In this case an ex post study would likely find that incurred costs (as well as benefits) were overstated. However, if the regulation was not enforced because it was not economically or technologically feasible; the RIA may have actually underestimated costs.21
Our finding that the benefit-cost ratio is more likely to be overestimated than
underestimated differs from a finding reported by a team of analysts from Resources for the Future.22 They found that ex ante “unit cost per benefit” (the inverse of our ratio) is overestimated about as often as it is underestimated. Although the sample of 47 rules analyzed
18 Note, as stated in Chapter II, that only about half of these rules had monetized costs or benefits. 19 In particular, in our sample of 20 OSHA and EPA case studies, the two agencies never underestimated benefits and only once underestimated the benefit-cost ratio. 20 However, this effect is entirely due to a DOE case study of appliance efficiency standards, which found that appliance prices declined by 25 percent more than predicted in four of six cases. 21 This appears to be the case for the OSHA coke oven and lead smelter standards. More than ten years after the standards were issued OSHA was not able to enforce attainment of the permissible exposure level through engineering controls because they were not feasible (OTA 1995, Mendeloff 1998). In these cases, we determined that the agency had underestimated the true costs of engineering controls. 22 In two cases, we also came to different conclusion than the RFF team regarding the interpretation of the findings of the validation studies. These differences are explained in footnotes to the table above, and do not affect the overall conclusions of this analysis.
48

III: Validation of Benefit and Cost Estimates
here includes 15 of the 28 rules analyzed by the RFF team, there are important differences in the rules considered. We only considered rules where a U.S. Federal agency generated and published the ex ante estimate.23 The RFF team included nine cases where ex ante estimates were not performed by U.S. Federal agencies.24 Seven of those nine cases indicate that benefit-cost ratios were underestimated.
In summary, for this limited sample our results indicate that U.S. Federal agencies tend to
overestimate both benefits and costs, but they have a significantly greater tendency to overestimate benefits than costs. Perhaps the one exception to that generalization is NHTSA.25 It has the best validation record among the agencies. Although it still shows a slight tendency to overestimate benefits and benefit to cost ratios, its overall record is significantly more accurate than the other agencies. NHTSA overestimated costs three times, underestimated costs twice, and was accurate three times. It was the only agency to underestimate benefits, which it did twice.26 On the other hand, EPA’s record estimating costs is excellent: six accurate, six overestimated and six underestimated.
Given the high frequency of errors in pre-regulation estimates of benefits, costs and cost-effectiveness, some readers may be tempted to conclude that benefit-cost information is of dubious value or should no longer be generated or relied upon. The information in Table 3-1 does not justify such a pessimistic conclusion. The regulatory alternative selected by the agency may have been unchanged, even if the agency had possessed the ex post information prior to making the rulemaking decision. An error of +/- 25 percent, the standard of "accuracy" used in this chapter, is a very demanding standard for prospective modeling of this type. Even when there are large errors made in ex ante estimates of benefit or cost, the key conclusion of an analysis may remain unchanged. For example, ex post analysis of NHTSA's mandatory airbag rule found that the ex ante estimates of lifesaving effectiveness were overstated by a factor of three or more. When this error was corrected in an ex post benefit-cost analysis, it was shown that airbags remained a relatively good investment in safety.27
Many real-world decisions, particularly those made when only a few key alternatives are
feasible and lawful, will not be sensitive to even large errors in estimates of benefit and cost. Once a regulatory agency has produced a rough estimate of a rule's benefits and costs, it may be a poor use of taxpayer dollars to invest the analytic resources to develop a more accurate and precise estimate prior to issuing the rule. Future validation studies need to address the question of whether the magnitudes of errors in the ex ante benefit and cost estimates are sufficiently large to suggest changes in the recommended regulatory alternatives.
23 This eliminated several OSHA case studies (asbestos in 1972 and vinyl chloride in 1974) that relied on industry cost estimates. RIAs were not required by Executive Order until 1975 and not formally reviewed by OMB until 1981. 24 They included case studies done for regulations issued by foreign as well as State governments. 25 For purposes of this generalization, we did not count EPA’s benefit estimates for pesticides since, as explained above, pesticide bans if not later relaxed, are by definition accurate. 26 Mendeloff (2004) compares the evaluation traditions of OSHA and NHTSA and finds the latter’s program is far less politicized and much more useful to its policy officials. 27 See Thompson, Segui-Gomez, and Graham (2002).
49

2005 Report to Congress on the Costs and Benefits of Federal Regulations
D. Response to Peer Review and Public Comments on Validation of Benefit and Cost Estimates
In this section we summarize -- and respond to -- the major comments provided on the draft Report that relate to validation of benefit and cost estimates contained in agency regulatory impact analyses. We address both specific comments and some of the background and supporting materials supplied by commenters.
Overall, OMB is pleased that the vast majority of comments were enthusiastic about OMB's focus on the need for more validation of benefit and cost estimates. It was remarkable how broadly this sentiment was shared, even among commenters who historically have disagreed on a wide range of regulatory policy issues (e.g., B, C, and E).28
One peer reviewer (3) cautioned that the word "validation" implies that the ex post
estimates "sit in judgment" of the ex ante estimates contained in the RIA. However, the reviewer stated that the ex post figures are also "estimates" and are subject to error because they are computed relative to a hypothetical baseline: what would have happened if the rule had not been issued. Since this hypothetical baseline was not (and cannot be) observed, one should expect some errors in -- and disputes about -- the ex post estimates as well. As several commenters pointed out, it is sometimes more difficult to prepare a high-quality ex post analysis than to prepare the ex ante estimates of benefit and cost. OMB agrees with these important caveats.
The same reviewer (3) also cited some situations where it may be technically reasonable for the ex post estimates to deviate from the ex ante estimates. For example, the ex ante estimates may have been generated for the proposed rule while the ex post estimates were made for the final rule. If the final rule differs from the proposed rule, and if the final regulatory impact analysis was not revised to reflect those changes, then it can be expected that ex ante and ex post estimates will differ. In some RIAs the ex ante estimates are intended as upper bounds rather than best estimates, in which case it would be expected that the ex post estimates would be smaller than the ex ante estimates, assuming the ex post estimates are best estimates. If a rule is not strictly enforced after it is issued, then the ex post estimates of both benefits and costs are likely to be smaller than predicted when the rule was issued. Moreover, another reviewer (5) notes that some rules are accompanied by complicated waiver and variance provisions which can exert substantial influence on the costs and benefits of a rule, as applied. When the ex ante estimates of benefit and cost are prepared, it is very difficult to account for how waiver and variance provisions are applied.
OMB generally agrees with these points and, as our discussion above indicates, we think these considerations may have affected past RIAs and validation studies. However, we emphasize that agencies are expected to refine their final regulatory impact analysis to reflect the provisions in the final rule rather than republish the analysis of the proposed rule. Moreover, agencies are expected, whenever feasible, to provide best estimates of costs and benefits in addition to any bounding estimates. When an agency produces a range of ex ante estimates as
28 See appendix F for a listing of all the written comments we have received, and the numbers or letters we have assigned to their comments. The public and peer review comments are available for review at http://www.whitehouse.gov/omb/inforeg/regpol-reports_congress.html.
50

III: Validation of Benefit and Cost Estimates
well as a best estimate, the validation analysis becomes more refined because it can be determined whether the ex post estimates fall within the range of ex ante estimates. If less than 100% compliance with a rule is expected to be a significant concern, or if significant numbers of waivers are anticipated, the agency is expected to incorporate those contingencies into regulatory analysis. Incomplete compliance is an issue that is already being addressed in some agency analyses.
In order to promote more and high-quality validation studies, reviewer (3) urges more investment in post-rule monitoring and data collection, including integration of data from multiple states and localities involved in implementation of rules. Two reviewers (3, 5) argued it was worth considering a requirement that major rules contain a provision requiring agencies, and possibly the regulated entities, to establish data collection systems that would facilitate ex post analysis of the rule at some point in the future. One commenter (L) suggested that validations studies could be undertaken in conjunction with their mandatory Section 610 reviews of existing rules under the Regulatory Flexibility Act. Another possibility suggested by a reviewer (4) is to tie agency budgets for regulation to demonstrated metrics of performance that include ex post validation studies. OMB agrees that these suggestions are worthy of consideration.
One reviewer (3) considered which institutions, inside and outside of government, are best equipped to undertake objective, high-quality validation studies. This reviewer suggests consideration of technical advisory committees to agencies as a possible vehicle for supervision of periodic validation studies. Those advisory committees could be convened by the National Research Council/National Academy of Sciences or organized as formal advisory committees to agencies under the Federal Advisory Committee Act (FACA). OMB agrees that either of these arrangements, or direct work by agencies, universities and think tanks, may be appropriate in certain circumstances.
Commenter (B) expresses a concern that OMB has overlooked studies and data showing that ex ante estimates of regulatory compliance cost made by agencies tend to be overestimated. However, the supporting materials cited by the commenter are primarily secondary reviews of primary literature already included in the 36 rules reviewed by OMB. In some cases the supporting material supplied by the commenter refers to compliance cost estimates made by regulated industries and their consultants rather than official estimates made by the Federal regulatory agency.
Reviewer (3) expressed a concern that the data collection necessary to support validation studies may be made more difficult by "OMB rules under the Paperwork Reduction Act limiting data collection from firms and individuals." OMB's view is that even validation studies must be adequately designed and justified, with an opportunity for public comment, which is what the Paperwork Reduction Act requires.
Another reviewer (5) makes the point that ex ante estimates of benefit and cost need to more routinely labeled as such, in order to stimulate public support for more ex post studies of benefit and cost. There may be some confusion, for example, about whether the regulatory accounting estimates in OMB's annual Report to Congress are ex ante or ex post estimates.
51

2005 Report to Congress on the Costs and Benefits of Federal Regulations
OMB agrees that it should be clear that these regulatory accounting estimates are generated before a rule is actually issued. E. References
Dale, Larry, Camille Antinori, Micahel McNeil, and James McMahon. (2002). “Retrospective Evaluation of Declining Prices for Energy Efficient Appliances.” Paper supported by contract from the Department of Energy for Lawrence Berkeley National Laboratory.
Gianessi, L.P.(1999).“Measuring the Economic Impacts of Pesticide Regulation: Thirty-one Case Studies.” Washington, DC: National Center for Food and Agricultural Policy.
Gianessi, L.P., and Mark Phillips. (1998). “Measuring the Economic Impacts of Pesticide Regulation.” Washington, DC: National Center for Food and Agricultural Policy.
Harrington, Winston, Richard Morgenstern, and Peter Nelson. (2000). Journal of Policy Analysis and Management 19(2): 297-332.
Harrington, Winston, Virginia McConnell, and Amy Ando. (2000). “Are Vehicle Emission Programs Living Up to Expectations.” Transportation Research Part D 5: 153-172.
Mendeloff, John. (1988). The Dilemma of Toxic Substance Regulation. Cambridge, MA: MIT Press.
Morrall, John. (1981). “Cotton Dust: An Economist’s View,” in Robert Crandall and Lester Lave. The Scientific Basis of Health and Safety Regulation. Washington, DC: The Brookings Institution.
Morrall, John. (2003). “Saving Lives: A Review of the Record.” Journal of Risk and Uncertainty 27:3, 221-237.
National Highway Traffic Safety Administration (1998). “The Long-Term Effectiveness of Center High Mounted Stop Lamps in Passenger Cars and Light Trucks”, Washington, DC: NHTSA Publication DOT HS 808 696.
National Highway Traffic Safety Administration (1999). “Effectiveness of Lap/Shoulder Belts in the Back Outboard Seating Positions”, Washington, DC: NHTSA Publication DOT HS 808 945.
National Highway Traffic Safety Administration (2001a). “The Effectiveness of Retroreflective Tape on Heavy Trailers”, Washington, DC: NHTSA Publication DOT HS 809 222.
National Highway Traffic Safety Administration (2001b). “The Effectiveness of Head Restraints in Light Trucks”, Washington, DC: NHTSA Publication DOT HS 809 247.
Nuclear Regulatory Commission (2003a). “Regulatory Effectiveness of the Station Blackout Rule”, Washington, DC: Office of Nuclear Regulatory Research (NUREG-1776.
Nuclear Regulatory Commission (2003b). “Regulatory Effectiveness of the Anticipated Transient Without Scram Rule”, Washington, DC: Office of Nuclear Regulatory Research NUREG-1780.
52

III: Validation of Benefit and Cost Estimates
National Highway Traffic Safety Administration (2004). “Evaluation of FMVSS 214 Side Impact Protection for Light Trucks: Crush Resistance Requirements for Side Doors”, Washington, DC: NHTSA Publication DOT HS 809 719.
Occupational Safety and Health Administration (1983) “Preliminary Regulatory Impact and Regulatory Flexibility Analysis of the Cotton Dust Revision.” Washington, DC.
Occupational Safety and Health Administration (1985). “Occupational Exposure to Cotton Dust; Final Rule” Federal Register 50 (240): 51120-51179.
Office of the Management and Budget (1998). Report to Congress on the Costs and Benefits of Federal Regulations. Washington, DC.
Seong, Si Kyeung and John Mendeloff. (2004). “Assessing the Accuracy of OSHA’s Projected Benefits of New Safety Standards.” American Journal of Industrial Medicine 45(4): 313-328.
Thompson, Kimberly M., Maria Segui-Gomez, and John D. Graham. (2002). “Validating Benefit and Cost Estimates: The Case of Airbag Regulation.” Risk Analysis 22(4): 803-811.
Office of Technology Assessment (OTA) (1995). Gauging Control Technology and Regulatory Impacts in Occupational Safety and Health: An Appraisal Of OSHA’s Analytical Approach. Washington, DC: U.S. Congress.
Viscusi, W. Kip. (1992). Fatal Tradeoffs: Public and Private Responsibilities for Risk. New York: Oxford University Press.
53


CHAPTER IV: IMPLEMENTATION OF THE INFORMATION QUALITY ACT Section 515 of the Treasury and General Government Appropriations Act, 2001 (Public
Law 106-554, 31 U.S.C. 3516 note), commonly known as the "Information Quality Act", requires OMB to develop government-wide standards “for ensuring and maximizing the quality of information disseminated by Federal agencies.
To implement the Information Quality Act, OMB issued final government-wide guidelines on February 22, 2002 (67 FR 8452) and each Federal agency was charged with promulgating its own Information Quality Guidelines. OMB facilitated the development of these agency guidelines, working with the agencies to ensure consistency with the principles set forth in the government-wide guidelines. By October 1, 2002, almost all agencies had released their final guidelines, which became effective immediately.
The OMB government-wide guidelines impose three core responsibilities on the agencies. First, agencies must embrace a basic standard of “quality” as a performance goal, and build quality into their information-dissemination practices. OMB’s guidelines explain that “quality” encompasses “utility” (usefulness to its intended users), “integrity” (security), and “objectivity.” “Objectivity” focuses on whether the disseminated information is accurate, reliable and unbiased as a matter of presentation and substance. Second, agencies must develop quality assurance procedures that are applied before information is disseminated. The practice of peer review plays an important role in the guidelines, particularly in establishing a presumption that peer-reviewed information is “objective.” Third, the OMB guidelines require that each agency develop an administrative mechanism whereby affected parties can request correction of poor quality information that has been or is being disseminated. Furthermore, if the public is dissatisfied with the initial agency response to a correction request, an administrative appeal opportunity must be provided.
The scope of the OMB Information Quality Guidelines is broad. “Information” is defined as “any communication or representation of knowledge such as facts or data” in any medium, including information related to regulatory, statistical, research, and benefits programs. It covers all Federal agencies subject to the Paperwork Reduction Act, including the independent regulatory commissions. OMB did provide a variety of exemptions from the guidelines to protect individuals’ privacy and commercial secrets, and to facilitate press releases, third party submissions in public filings, archival records, personal articles by agency employees, testimony, and subpoenas and adjudicative determinations. OMB also provided agencies with the discretion to reject correction requests that are groundless, made in bad faith, or reflect only a difference of opinion.
OMB recognized that information quality can be costly and encouraged agencies to consider the social value of better information in different contexts. Ordinary information is distinguished from “influential” information -- that is, scientific, financial and statistical information having a clear and substantial impact on important public policies or important private sector decisions. “Influential” information is subject to higher standards of quality. With
55

2005 Report to Congress on the Costs and Benefits of Federal Regulations
several important exceptions and qualifications (e.g., privacy, intellectual property rights, and other confidentiality protections), influential information must be reproducible by qualified third parties.
The OMB guidelines also require that agencies report annually to OMB on the number and nature of information quality correction requests received and how such requests were handled. The first annual reports, the FY03 agency Information Quality Reports, were due to OMB on January 1, 2004. The second annual reports, the FY04 Information Quality Reports, were due to OMB on January 1, 2005. These reports are summarized, discussed, and evaluated throughout this chapter.
The Bush Administration is committed to vigorous implementation of the Information Quality Act. We believe it provides an excellent opportunity to enhance both the competence and accountability of government. At a July 20, 2005 oversight hearing organized by the Subcommittee on Regulatory Affairs for the Committee on Government Reform of the House of Representatives, the Chair of that committee, Representative Candice Miller, referred to the Information Quality Act as a “sunshine” in government law that is designed to provide greater transparency to the process that produces research and regulation.1 Representatives from the Department of Health and Human Services (HHS), the Environmental Protection Agency (EPA), and the Fish and Wildlife Service (FWS) provided support for the objectives of the Information Quality Act and noted that the Information Quality Act allows them to strengthen the quality and sound science frameworks that are already in place. Additionally, the FWS commented that the Act has been providing benefits to the public.2 A. Correction Requests Processed by Agencies in FY03 and FY04
On April 30, 2004, OMB released the Information Quality Report to Congress FY03.3
That report provided a summary of the first year of implementation of the Information Quality Act. Additionally, the appendix of that report contained all of the FY03 Information Quality Reports from the departments and agencies that received correction requests. FY04 annual agency reports on Information Quality were due to OMB on January 1, 2005. Below is an overview, which in some cases provides clarifications, of information presented in the Information Quality Report to Congress FY03 and of information OMB received in agency FY04 Information Quality Reports.
Based on agency FY03 and FY04 Information Quality Reports, Table 4-1 below lists the departments and agencies that received requests for corrections and appeals in either FY03 or FY04, or in both years.
1 See http://reform.house.gov/RA/Hearings/EventSingle.aspx?EventID=29622 for full testimony of Representative Miller. 2 See http://reform.house.gov/RA/Hearings/EventSingle.aspx?EventID=29622 for full testimony. 3 Information Quality, A report to Congress, FY 2003, OMB http://www.whitehouse.gov/omb/inforeg/fy03_info_quality_rpt.pdf
56
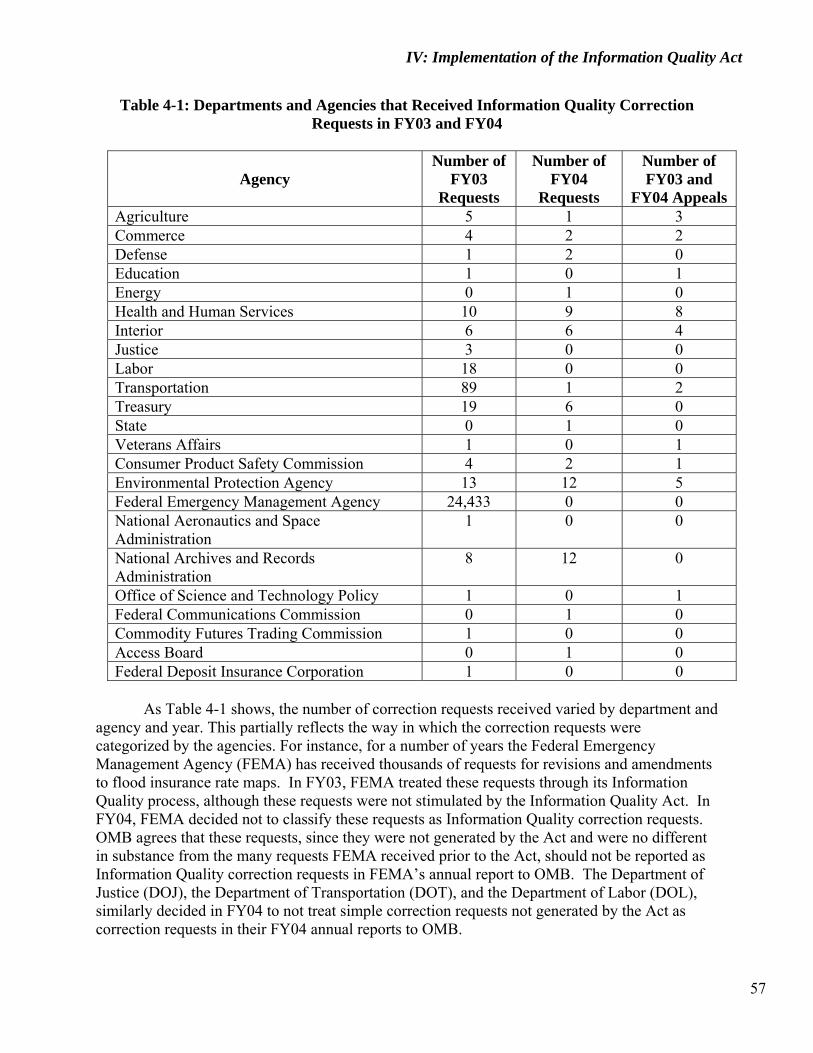
IV: Implementation of the Information Quality Act
Table 4-1: Departments and Agencies that Received Information Quality Correction Requests in FY03 and FY04
Agency Number of
FY03 Requests
Number of FY04
Requests
Number of FY03 and
FY04 Appeals Agriculture 5 1 3 Commerce 4 2 2 Defense 1 2 0 Education 1 0 1 Energy 0 1 0 Health and Human Services 10 9 8 Interior 6 6 4 Justice 3 0 0 Labor 18 0 0 Transportation 89 1 2 Treasury 19 6 0 State 0 1 0 Veterans Affairs 1 0 1 Consumer Product Safety Commission 4 2 1 Environmental Protection Agency 13 12 5 Federal Emergency Management Agency 24,433 0 0 National Aeronautics and Space Administration
1 0 0
National Archives and Records Administration
8 12 0
Office of Science and Technology Policy 1 0 1 Federal Communications Commission 0 1 0 Commodity Futures Trading Commission 1 0 0 Access Board 0 1 0 Federal Deposit Insurance Corporation 1 0 0
As Table 4-1 shows, the number of correction requests received varied by department and
agency and year. This partially reflects the way in which the correction requests were categorized by the agencies. For instance, for a number of years the Federal Emergency Management Agency (FEMA) has received thousands of requests for revisions and amendments to flood insurance rate maps. In FY03, FEMA treated these requests through its Information Quality process, although these requests were not stimulated by the Information Quality Act. In FY04, FEMA decided not to classify these requests as Information Quality correction requests. OMB agrees that these requests, since they were not generated by the Act and were no different in substance from the many requests FEMA received prior to the Act, should not be reported as Information Quality correction requests in FEMA’s annual report to OMB. The Department of Justice (DOJ), the Department of Transportation (DOT), and the Department of Labor (DOL), similarly decided in FY04 to not treat simple correction requests not generated by the Act as correction requests in their FY04 annual reports to OMB.
57

2005 Report to Congress on the Costs and Benefits of Federal Regulations
Agency interpretation of such submissions, however, has not been consistent. In FY03, eight requests were received by the National Archives and Records Administration (NARA) that were requests to correct individual data items such as picture captions, the year an event occurred, or web-links. In FY04 this number was 12. Although these requests are of the type NARA has always received and are not generated by the Act, NARA continues to treat them as Information Quality correction requests because in the NARA ‘contact us’ form, requestors chose to identify their requests as relating to the information quality of a NARA product over other topic options. Similarly, the requests received by the Department of the Treasury (Treasury) are no different in substance than the type of simple correction requests Treasury has always received. As the Information Quality Act is still relatively new and agency procedures for classifying correction requests are evolving, OMB cautions readers against drawing any conclusions about trends or year-to-year comparisons. For this reason, this chapter presents analyses that group together the FY03 and FY04 correction requests.
Although the total number of correction requests reported by agencies in FY03 was 24,619, for the purposes of this report OMB will further evaluate only 48 of them. We will not be including discussion of the requests to FEMA, DOT − particularly those to Federal Motor Carrier Safety Administration (FMCSA), NARA, DOL, DOJ, Treasury, the National Aeronautics and Space Administration (NASA), the Commodity Futures Trading Commission (CFTC), and the Federal Deposit Insurance Corporation (FDIC). These requests seem to be no different in substance from the simple web page fixes or technical corrections that agencies have always received. In the Information Quality Report to Congress FY03, we stated that the number of requests that appeared to be generated by the Information Quality Act was approximately 35.4 The number presented here (48) is slightly higher. In cases where all of an agency’s correction requests were not generated by the Act, we did not include them here (e.g., FEMA, NARA, and FMCSA). However, in cases where an agency report included both requests we believe to be generated by the Act and requests that were not, to be fully transparent we have included all the requests in our analysis here, despite the fact that some arguably are not generated by the Act. For instance, EPA did not include in its FY03 report the types of correction requests received through its internet technical support links or through its integrated error correction process, but did include two correction requests that were very similar in nature to these types of requests. Because EPA chose to include them, along with other correction requests that were substantive, we have included them in our analysis. In cases like this, OMB did not want to introduce a layer of subjectivity by picking and choosing which requests to include and which to exclude. The details of the correction requests received by the agencies in FY03 are available in the Appendix of the Information Quality Report to Congress FY03. This appendix includes all FY03 reports submitted from agencies that received correction requests. Reports from departments and
4 A Washington Post analysis of government records found 39 petitions with potentially broad economic, policy, or regulatory impact. See Rick Weiss, “‘Data Quality’ Law is Nemesis of Regulation,” Washington Post, Aug. 16, 2004, p.A-1. An analysis by OMB Watch found that 98 substantive requests were received. See OMB Watch “The Reality of Data Quality Act’s First Year: A Correction of OMB’s Report to Congress”, July 2004 (available at: http://www.ombwatch.org/info/dataqualityreport.pdf). The OMB Watch total included all requests except those received by FEMA and FMCSA. This number includes requests which OMB did not consider substantive or generated by the Information Quality Act. Summaries of correction requests received by agencies in FY03 are available for review in the Appendix of the Information Quality Report to Congress FY03 (available at: http://www.whitehouse.gov/omb/inforeg/fy03_info_quality_rpt.pdf).
58

IV: Implementation of the Information Quality Act
agencies that did not receive correction requests are not included, as each report simply stated that no correction requests were received by the agency.
Similarly, although the total number of correction requests reported by agencies in FY04 was 57, OMB considers only 37 of these to be generated by the Information Quality Act and different in substance from the simple web page fixes or technical corrections that agencies have always received. As we did for the FY03 requests, in cases where all of an agency’s correction requests were not generated by the Act, we did not include them here. Thus, we will not be including discussion of the requests to NARA, Treasury, State, Department, and Energy. Further details on these correction requests are available on agency Information Quality web pages or Appendix E of this report.
For this analysis, as recommended by one of our external peer reviewers, OMB has
decided not to differentiate among requests that agencies classified as “influential,” “non-influential,” or “undetermined.” As mentioned in the Information Quality Report to Congress FY03, agencies have been reluctant to classify requests as “influential.” This has been due to reasons including concerns from legal staff, lack of clarity throughout the department or agency regarding the influential definition, and potential implications of classifying a correction request as influential. However, we have not found any evidence that the lack of an “influential” designation has altered how the agency actually treats its correction requests.
Summary statistics for FY03 (48 requests) and FY04 (37 requests) combined are shown in Figure 4-1 below. For all details relating to specific requests, readers are encouraged to visit agency Information Quality web sites that provide links to Information Quality correspondence, including full agency responses.
59

2005 Report to Congress on the Costs and Benefits of Federal Regulations
Figure 4-1: The status of the FY03 and FY04 correction requests at the end of FY045
85 Requests
10 Corrected/ Partially Corrected
45 Denied 17 Pending 13 Other Processes/Mechanisms
28 Appeals
13 Denied
6 Granted/ Partial Corrections
7 Pending
2 Withdrawn
As is seen above, only a modest number (12 percent) of requests were corrected or partially corrected in the agency’s initial response. Many of these corrections were quite straightforward and did not necessarily have significant policy implications. For example, HHS fixed a link on a webpage regarding gonorrhea and also clarified some press and fact sheet information regarding styrene. EPA clarified information in a 2002 air quality status and trends report, and also added clarifying language and a disclaimer to an air program web page.
Just over 50 percent of the correction requests received were denied by agencies.
Compared to the requests that were corrected, the majority of these requests were more substantive in nature (requiring more than a simple web page fix, technical correction, or name change). For instance, the Forest Service (FS) did not find that publications related to
5 This analysis includes 48 correction requests from FY03 and 37 correction requests from FY04. Note that although about 35 were ‘substantive’ in FY03 and appeared to be generated by the Act, 48 were considered here as some agencies included both ‘substantive’ requests and requests that appeared to not be generated by the Act in their FY03 reports. For agencies that submitted a report that included only requests that did not appear to be generated by the Act, these requests were not considered. See text for further details.
60

IV: Implementation of the Information Quality Act
management recommendations for the Northern Goshawk were in error, and the National Oceanic and Atmospheric Administration (NOAA) did not find that its interpretation of a study regarding Atlantic Salmon genetics was flawed or required a change in its biological opinion.
It is important to recognize that some of the requests were denied because the
Information Quality guideline processes were not seen as the appropriate venue for addressing the concern. These denials do not necessarily imply that the agency believes that the information meets agency Information Quality standards. For instance, EPA did not find that draft perchlorate documents that were released for review should be counted as official agency disseminations under the EPA information quality guidelines. EPA did note, however, that it would treat the request as comments on the draft documents as they underwent review. Similarly, HHS did not find that a draft abstract, released for public comment, describing anthraquinone toxicity was an official dissemination under its information quality guidelines and did not therefore require correction. However, HHS did note that the agency would consider the comments under its existing procedures for obtaining public comment.
Approximately 15 percent of the requests were handled through other processes or mechanisms. By this we mean that the agency concluded that another process existed or provided a better venue to address the requestors’ concerns, or the agency put in place another process to address the concerns. In some cases, this is similar to granting a partial correction, in other cases, it is quite similar to denying a request as described above. OMB acknowledges that there is subjectivity in classifying a response as a correction, partial correction, denial, or as being referred to another process. For instance, to address a concern about EPA's ratio utility billing systems, EPA sought public comment on a range of options; to address a requestor’s concerns regarding a proposed endangered species listing for slickspot peppergrass, FWS extended its deadline for making a determination, and re-opened the public comment period to solicit additional information on the interpretation of available data; and to address concerns regarding salt intake and blood pressure, HHS informed the requestor that the proper channel for information responsive to the concerns expressed was through a FOIA request.
Of the requests that were denied, 28 (62 percent) were appealed, and seven of these are still pending. Table 4-1 shows the number of appeals received by each agency. Of the appeals that were completed, 13 were denied, 6 were granted full or partial corrections and 2 were withdrawn by the requestors before the agency responded. Compared to the requests that were granted by the agencies before an appeal was sent, the appeal process has led to the granting of more correction requests (21 percent of appeals were granted while only 12 percent of original requests were granted) that are of a more substantive nature. For instance, although EPA did not grant a correction request regarding the toxicity of barium (because the agency found that the request did not show that EPA had violated its information quality guidelines regarding objectivity and reproducibility), after receiving the appeal EPA did put in place a process by which external reviewers would evaluate barium toxicity, including the alternative endpoint suggested by the requestor. As a result of this process, the toxicity level for barium was subsequently changed. Similarly, upon first request, HHS did not conclude that draft abstracts characterizing anthraquinone toxicity needed to be withdrawn and instead added clarifying statements to its webpage. Upon appeal, HHS decided to remove the abstracts completely until further testing was completed. Upon first request, FWS did not find that information presented
61

2005 Report to Congress on the Costs and Benefits of Federal Regulations
in the request led to a conclusion that trumpeter swans should not be listed within the meaning of the Endangered Species Act. Upon appeal, the director of FWS requested that a peer review process be put in place to evaluate the findings in a paper submitted by the requestor. The peer reviewers did not ultimately support the requestor’s point of view, but the creation of an external process to fully evaluate the information is characterized by OMB as a partial correction. We also note that when FWS received an appeal regarding scientific information relating to the Florida Panther, FWS ceased dissemination of a draft Landscape Conservation Strategy and has accelerated its schedule for several corrective actions that include updating a Multi-Species Recovery Plan and making it available for public comment. Although this appeal was granted in FY05, we mention it here as FWS issued a press release and engendered a fair amount of press coverage. Further details regarding this appeal are available on the FWS web page.
Agencies have implemented varying processes for handling appeal requests. The Occupational Safety and Health Administration (OSHA) and HHS have used a single senior official to review each appeal. The Department of the Interior (DOI) has used a panel approach involving several senior managers from two agencies within DOI. For the appeal that went to Education, three subject matter experts and an attorney reviewed the appeal. The Department of Agriculture (USDA) has used independent panel review and EPA has used executive panel review.
As was seen in FY03, the requests submitted in FY04 have been extremely diverse. Twenty-three departments and agencies have reported receiving one or more correction requests; within the individual departments and agencies, many different program offices have received correction requests. For instance, 7 distinct programs within HHS and 6 distinct programs within EPA had received correction requests. Compared to FY03, 4 new departments and agencies received correction requests (DOE, State, FCC and Access Board) in FY04. On the other hand, 6 agencies (Education, Veterans Affairs, NASA, OSTP, CFTC, and FDIC) that received requests in FY03 did not receive requests in FY04. Additionally, FEMA, DOJ, and DOL did not report any correction requests in FY04, though this appears to be due to an overall change in the way these agencies classify correction requests.
Implementing a new process has not been without challenges as the agencies endeavor to create oversight mechanisms that are responsive, yet not overly bureaucratic and time consuming. Whereas most of the departmental and agency guidelines state that correction requests will typically be responded to within 60 to 90 days, OMB has noticed that many of the agencies take significantly longer to respond. In fact, it took the agencies more than five months to respond to correction requests in at least eight different cases. HHS, EPA, USDA, and the Department of Transportation (DOT) are agencies that have had difficulties responding within 60 to 90 days. OMB has worked with the agencies to try to gain a better understanding of why response times are lengthy. OMB anticipates that once the program offices have worked through their first correction requests and appeals, they will be able to process and respond to future requests more rapidly. The fact that the requests have been so diverse and have required tapping into many areas of expertise within the agencies, may contribute to the length of response times.
It is also too early to make a determination as to whether or not the agencies are making appropriate judgment calls and using adequate processes to respond to correction requests and
62

IV: Implementation of the Information Quality Act
appeals. Seventeen of the 85 correction requests evaluated here are still pending, and 7 of the 28 appeals are still pending. Given the relatively small number of completed responses at the end of FY04, it is premature to make broad statements about both the impact of the correction request process, the appeals process, and the overall responsiveness of the agencies. B. General Evaluation: Perceptions and Realities
Some complexities have arisen in implementing the Information Quality Act. For instance, we have learned that the notion of what constitutes a “dissemination” is not straightforward. Agencies have had to figure out if an oral statement made by a regional employee at a public meeting, or if statements in an email to a citizen, constitute a dissemination. Similarly, determining when an agency-commissioned study becomes subject to the Information Quality Guidelines raises complex questions.
When one agency’s dissemination is used by another agency, determinations become more complicated. The Department of Education grappled with this issue when it received a correction request regarding information in one of the Secretary’s commission reports that claimed the report relied on a study that was flawed. The study in question was produced by the United States Government Accountability Office (GAO). Deciphering the best answer to questions such as these has been challenging.
In contrast to the Department of Education example, many of the “non-influential” Information Quality correction requests have identified and described clear corrections for specific information disseminations. These corrections usually have been made by the agencies (see agency web pages for details on the correction requests).
OMB has also learned that improving the quality of information may involve multiple judgments. Often correction requests hinge on interpretations of science or analyses. When dealing with uncertain scientific issues, it is possible to draw several reasonable inferences depending on the perspective of the reviewer. Thus, more than one plausible answer or methodology may exist. We are learning that it is possible for neither the agency nor the requestor to be incorrect. In FY03 and FY04, the majority of non-frivolous correction requests have been denied, usually on the basis that a reasonable scientist could interpret the available information the way the agency had. Such correction requests might have been better focused if they had addressed the agency’s inadequate treatment of uncertainty rather than the accuracy of information.
OMB has heard some concerns about the Information Quality Act and the implementation process. Some of those concerns, as well as the perceptions and the realities that have come to be associated with them, are presented below.
Perception #1: "Information Quality Act was a last minute addition to the appropriations bill"
Though not subject to a congressional hearing, Section 515 was not a last-minute addition to the Treasury and General Government Appropriations Act, 2001 (Public Law 106-554).
63

2005 Report to Congress on the Costs and Benefits of Federal Regulations
Previously, language in the House Report on the Treasury, Postal Service, and General Government Appropriations Bill, 1999 (House Report No. 105-592) had urged OMB to develop "rules providing policy and procedural guidance" for ensuring the quality of information disseminated by Federal agencies. Later, the version of the Treasury and General Government Appropriations Bill, FY2001 approved by the House Subcommittee contained a requirement for OMB to issue rules on information quality. In response, a June 18, 2000 letter from the OMB Director to the Chairman of the House Committee on Appropriations included a discussion of support for certain changes in the information quality language.6 The Treasury and General Government Appropriations Act, 2001 (Public Law 106-554) enacted on December 21, 2000 called for OMB to issue guidance. Perception #2: “Agencies might be inundated with requests for corrections.”
The assumption that certain agencies would be overwhelmed by the volume of correction requests was one of the most common early perceptions. To the surprise of many, that has not been the case. In FY03, the agencies received about 35 substantive correction requests that appeared to be stimulated by the Information Quality Act.7 In FY04, this number was 37. Our analysis in this chapter has focused on a total of 85 correction requests.8 However, at some of the agencies, particularly in FY03 and less so in FY04, the Information Quality websites and email addresses have been used for correction requests for types of information that had previously been addressed through a different mechanism at the agency. Thus, although the use of the Information Quality process is novel, these types of correction requests are not new to the agencies and were not generated by the Information Quality Act. For instance, as mentioned previously, in FY03 there was a large volume of requests (over 24,000) to the FEMA regarding requests for map correction changes as part of the national flood insurance program, and a large volume of requests (about 90) to the FMCSA regarding the incorrect reporting of individual accidents. Like the 8980 data errors reported to the EPA, in FY03, through their Integrated Error Correction Process, these types of correction requests were commonplace prior to the Information Quality Act. Of the approximately 85 distinctive correction requests, the Environmental Protection Agency (EPA), Health and Human Services (HHS), and Interior have received the majority of the requests. In FY03, the total number of Freedom of Information Act/Privacy Act access requests received by all Federal departments and agencies was
6 Letter from Jacob J. Lew, OMB to The Honorable C. W. Bill Young, June 18, 2000 (copies also sent to the Honorable David R. Obey, the Honorable Jim Kolbe, and the Honorable Steny H. Hoyer). 7 A Washington Post analysis of government records found 39 petitions with potentially broad economic, policy, or regulatory impact. See Rick Weiss, “‘Data Quality’ Law is Nemesis of Regulation,” Washington Post, Aug. 16, 2004, p.A-1. An analysis by OMB Watch found that 98 substantive requests were received. See OMB Watch “The Reality of Data Quality Act’s First Year: A Correction of OMB’s Report to Congress”, July 2004 (available at: http://www.ombwatch.org/info/dataqualityreport.pdf). The OMB Watch total included all requests except those received by FEMA and FMCSA. This number includes requests which OMB did not consider substantive or generated by the Information Quality Act. Summaries of correction requests received by agencies in FY03 are available for review in the Appendix of the Information Quality Report to Congress FY03 (available at: http://www.whitehouse.gov/omb/inforeg/fy03_info_quality_rpt.pdf). 8 This analysis includes 48 correction requests from FY03 and 37 correction requests from FY04. Note that although about 35 were ‘substantive’ in FY03 and appeared to be generated by the Act, 48 were considered here as some agencies included both ‘substantive’ requests and requests that appeared to not be generated by the Act in their FY03 reports. For agencies that submitted a report that included only requests that did not appear to be generated by the Act, these requests were not considered. See text in Section A for further details.
64

IV: Implementation of the Information Quality Act
3,266,394.9 Compared to this value, the aggregate number of correction requests received under the Information Quality Act is quite small. Perception #3: “The Information Quality correction process is a review mechanism that would be used only by industry.”
OMB is pleased to report that the Information Quality Act has been used by virtually all sectors of society. Correction requests have been filed by private citizens, corporations, farm groups, trade organizations, and a variety of non-governmental organizations as well as by government agencies and U.S. Senators.
Analysis by The Washington Post of the data provided in the Information Quality Report
to Congress FY03 found that of the 39 petitions with potentially broad economic, policy or regulatory impact, 32 were filed by regulated industries, business or trade organizations or their lobbyists.10 OMB Watch found that, excluding FEMA, industry accounted for 72 percent of all requests for correction.11 These numbers are not surprising, as one would expect that private-sector groups most affected by disseminations would be active users of the correction request process. Unevenness in the use of the correction process may also stem from the fact that some nonprofit groups are apparently boycotting the Act, as reported in The Washington Post.12
Perception #4: “The Information Quality Act could result in slowing down the regulatory process and chilling agency disseminations.”
To our knowledge, the Information Quality Act has not affected the pace or length of rulemakings. We have no evidence at this time to determine whether or not the Act has led to a reduced number of agency disseminations, nor has anyone provided such evidence. Compared to the number of items in the Federal Regulatory Agenda, which is approximately 4,000, the number of information quality correction requests received is quite small. Thus the aggregate impact, if we were to very conservatively assume that each request has an impact, of the Information Quality Act, on the overall level of regulatory actions and information disseminations appears would appear to be quite minor.
As discussed previously, OMB believes that less than 85 of the requests received by agencies were of a substantive nature or stimulated by the Information Quality Act. Although the total number may differ due to interpretation, OMB believes that only 8 correction requests were directly related to a rulemaking. The list includes: two correction request to USDA (Forest Service) regarding a proposed rulemaking for National Forest System Land and Resource Management Planning; one request to DOT regarding the age 60 rule; four requests to EPA, one regarding a proposed rule on National Pollutant Discharge Elimination System Permit deadlines, another request regarding concerns about the bromate maximum contaminant level, a third regarding a proposal to add diisononyl phthalate to a list of chemicals reported under section 313
9 See http://www.usdoj.gov/oip/foiapost/2004foiapost22.htm for more information. 10 See Rick Weiss, “‘Data Quality’ Law is Nemesis of Regulation,” Washington Post, Aug. 16, 2004, p.A-1. 11 See OMB Watch “The Reality of Data Quality Act’s First Year: A Correction of OMB’s Report to Congress”, July 2004 (available at: http://www.ombwatch.org/info/dataqualityreport.pdf). 12 See Rick Weiss, “‘Data Quality’ Law is Nemesis of Regulation,” Washington Post, Aug. 16, 2004, p.A-1.
65

2005 Report to Congress on the Costs and Benefits of Federal Regulations
of the Emergency Planning and Community Right-to-Know Act, and a forth requesting correction of information supporting EPA’s Ozone Model Rule; and one request to DOI (Fish and Wildlife Service) regarding a proposed rulemaking related to manatees. We do acknowledge however, that there were other correction requests that, although not directly related to a rulemaking, may still have an impact on a rulemaking in the future. For instance, correction requests related to toxicity values of chemicals or correction requests related to endangered species listings may later become inputs into a rulemaking. Determining an exact number of correction requests that may later have an impact on a rulemaking is quite subjective. Readers are encouraged to look at agency web pages for more information on the details of the correction requests that have been received. As noted above, compared to the number of items in the Federal Regulatory Agenda, we believe that any overall impact would be quite minor.
The small number of correction requests related to rulemakings is not surprising. Additionally, none of the correction requests received related to a regulatory impact analysis. The genesis of the Information Quality Act was a concern not necessarily about agency rulemakings, but rather a concern about the widespread dissemination of agency information on web pages. Most of this information exists in the form of reports, notices, and guidance documents. The Administrative Procedure Act already exists to address the rulemaking process, so it is not surprising that the majority of Information Quality correction requests are not related to rulemakings. Perception #5: “The appeals process, the public’s opportunity to ask for reconsideration of a correction request, will not improve anything.”
As is seen in Figure 4-1, over 60% of the responses to requests for correction that were denied in FY03 and FY04 have subsequently been appealed. The appeals process requires an independent agency review of the reconsideration request, its justification, and its validity. For FY03, the majority of the appeals were still in the process of being answered; thus, it was too early to assess the value added in our Information Quality Report to Congress FY03. By the end of FY04, only 25% of the total appeals were still outstanding. Although we do still believe that the number of appeals is too low to make any broad statements about overall value, this added step appears to have fostered more corrections. As noted previously, compared to the requests that were granted by the agencies before an appeal was sent, the appeal process has led to the granting of more correction requests that are of a more substantive nature; 21% of appeals were granted while only 12% of original requests were granted. We recently saw this process play out at HHS where, upon appeal, a correction request to the National Toxicology Program resulted in the discontinuation of the webpage dissemination of a draft abstract that contained results that were flawed (the compound tested contained a contaminant that was believed to have influenced the test results). In this situation, the appeals step was critical in order for the agency to recognize that a correction was needed. Other similar examples are provided in section A of this chapter. Perception #6: “The Information Quality Act is only about numerical data.”
If one thinks that the word “data”, as defined by Webster, includes “information organized for analysis or used as the basis for decision-making,” then there has been no
66

IV: Implementation of the Information Quality Act
misperception.13 However, if one believes that data covered by the Information Quality Act must be numerical information, that is incorrect. The Information Quality Act has been used to address complex issues and analyses that go beyond correcting errors entered into a spreadsheet. For instance, whether or not the Trumpeter Swans (native North American swans characterized by their unmistakable trumpet-like call) constitute a distinct population around the Yellowstone area, and whether or not the nickel section of the 10th edition of the HHS Report on Carcinogens is representative of the full body of scientific studies, are not questions that can be answered solely by looking at numerical inputs. These are just two examples of the types of correction requests that deal with the information and analyses used in the decision-making process. Perception #7: “Colleges and universities are regulated by the Information Quality Act.”
OMB has heard claims that college professors and their students, if funded by the Federal government, are covered by the Information Quality Act and agency guidelines. However, it is clear that the Information Quality Act covers only disseminations by Federal agencies, specifically those agencies covered by the Paperwork Reduction Act. The law covers only agency disseminations, not disseminations made by third parties (e.g., academics, stakeholders and the public). If third-party submissions are to be used and disseminated by Federal agencies, it is the responsibility of the Federal Government, under the Information Quality Act, to make sure that such information meets relevant information quality standards. The agency guidelines establish performance goals and procedures to assist in the agency’s evaluation of all information for which agency dissemination is under consideration, whether that information was generated by the agency or by third parties.
C. Legal Developments under the Information Quality Act
Two court decisions have held that judicial review is not available under the Information Quality Act. On June 21, 2004, the U.S. District Court for the District of Minnesota issued a memorandum opinion, In re: Operation of the Missouri River System Litigation,14 briefly holding that the Information Quality Act does not provide a private cause of action in Federal court and that there is no cause of action under the Administrative Procedure Act (Chapter 7 of Title 5, United States Code) because the Information Quality Act lacks meaningful standards a court could use to assess agency conduct.
On November 15, 2004, the U.S. District Court for the Eastern District of Virginia dismissed the first case to focus extensively on the potential for judicial review of claims under the Information Quality Act in Salt Institute v. Thompson.15 In this case, the Salt Institute and the U.S. Chamber of Commerce filed suit against the Department of Health and Human Services (HHS), alleging that HHS, and the National Institutes of Health (NIH) in particular, violated the Information Quality Act and the applicable agency information quality guidelines because NIH declined to obtain, and release to plaintiffs, the raw data of grant-funded studies that NIH cited in public health messages concerning salt intake and hypertension, and because NIH disseminated
13 Websters II New Riverside Dictionary, Houghton Mifflin Company, Boston MA, 1984. 14 In re: Operation of the Missouri River System, No. 03-MD-1555, 2004 WL 1402563 (D. Minn. June 21, 2004). 15 345 F.Supp.2d 589 (E.D.Va. 2004).
67

2005 Report to Congress on the Costs and Benefits of Federal Regulations
such health messages, which were alleged to lack sufficient scientific quality.
The Court held that the injuries arising from the alleged errors in NIH’s public health messages were insufficient to confer constitutional standing to sue. In addition, the court held that the Information Quality Act does not provide a private right of action and that the Administrative Procedures Act does not provide an independent basis for judicial review of the agency’s public health messages. In January 2005, the plaintiffs appealed the district court’s decision to the U.S. Court of Appeals for the Fourth Circuit. D. Increasing Transparency under the Information Quality Act
In the Information Quality Report to Congress FY03, OMB made suggestions for future improvements in implementation of the Information Quality Act. Due to the relatively small number of substantive correction requests received by the agencies in FY03 and FY04, OMB is not prepared to make suggestions for legislative changes. As is seen in Figure 4-1, 17 (or 20 percent) of the correction requests were still pending at the end of FY04, and although 68 were completed, appeals were still pending on seven of them. Additionally, the types of correction requests received by agencies have been extremely diverse. We still believe that the agencies have not yet received and responded to a sufficient number of correction requests to allow us to confidently suggest changes that would improve implementation of the Information Quality Act. Agencies are still learning from their early experiences in FY03 and FY04, and OMB plans to continue to work with the agencies to help improve agency processes. However, in the Information Quality Report to Congress FY03, we did point out a few actions that would help improve those processes. These recommendations included: increasing transparency, increasing timeliness of agency responses, increasing engagement of agency scientific and technical staff, and earlier consultation with OMB.
Consistent with these recommendations, in August 2004 the OIRA Administrator issued a memorandum to the President's Management Council requesting that agencies post all Information Quality correspondence on agency web pages to increase the transparency of the process. 16 OMB requested that these web pages be operational by December 1, 2004. In their FY04 Information Quality Reports to OMB, agencies provided OMB with the specific links to these web pages. Below is a list of Agency web pages that are compliant with the August 2004 memorandum. Alphabetical list of Agencies currently known to have OMB compliant Information Quality Websites:
Access Board: http://www.access-board.gov/about/policies/infoquality.htmACE: http://www.hq.usace.army.mil/ceci/informationqualityact/CFTC: http://www.cftc.gov/cftc/cftcquality.htmCNCS: http://www.nationalservice.gov/home/site_information/quality.aspCPSC: http://www.cpsc.gov/library/correction/correction.html
16 See http://www.whitehouse.gov/omb/inforeg/info_quality_posting_083004.pdf
68

IV: Implementation of the Information Quality Act
CSB: http://www.csb.gov/index.cfm?folder=legal_affairs&page=index DNFSB: http://www.dnfsb.gov/about/information_quality.html DOC: http://www.osec.doc.gov/cio/oipr/info_qual.htmlDOE: http://cio.doe.gov/informationquality/index.html DOL: http://www.dol.gov/cio/programs/InfoGuidelines/IQCR.htmDOS: http://www.state.gov/misc/49492.htm DOT: http://dms.dot.gov/cfreports/dataQuality.cfmED: http://www.ed.gov/policy/gen/guid/infoqualguide.html EEOC: http://www.eeoc.gov/policy/guidelines/index.html EPA: http://epa.gov/quality/informationguidelines/iqg-list.htmlFCA: http://www.fca.gov/informationquality.htm FCC: http://www.fcc.gov/omd/dataquality/requests2004.htmlFDIC: http://www.fdic.gov/about/policies/#information FERC: http://www.ferc.gov/help/how-to/file-correct.asp FMC: http://www.fmc.gov/reading/IntroInformationQualityGuidelines.aspFRB: http://www.federalreserve.gov/GeneralInfo/Section515/mechanism.htmFS: http://www.fs.fed.us/qoi/disclosure.shtmlFTC: http://www.ftc.gov/ogc/sec515/index.htmFWS: http://informationquality.fws.gov/GSA: http://www.gsa.gov/Portal/gsa/ep/channelView.do?pageTypeId=8199&
channelPage=%2Fep%2Fchannel%2FgsaOverview.jsp&channelId=-13349
HHS: http://aspe.hhs.gov/infoquality/requests.shtmlHUD: http://www.hud.gov/offices/adm/grants/qualityinfo/qualityinfo.cfmIMLS: http://www.imls.gov/about/abt_guidelines.htmIRS: http://www.irs.gov/irs/article/0,,id=131585,00.htmlMSPB: http://www.mspb.gov/mspb_library.html#Informationqualityguidelines NARA: http://www.archives.gov/about/info-qual/requests/index.htmlNASA: http://www.sti.nasa.gov/qualinfo.htmlNCUA: http://www.ncua.gov/data/InfoQuality/InfoQuality.htmNEA: http://www.arts.gov/about/infoquality.html NEH: http://www.neh.gov/whoweare/index.htmlNRC: http://www.nrc.gov/public-involve/info-quality.htmlNSF: http://www.nsf.gov/policies/infoqual.jspNTSB: http://www.ntsb.gov/info/quality.htm NWTRB: http://www.nwtrb.gov/plans/plans.html OGE: http://www.usoge.gov/pages/about_oge/info_quality.html OHFEO: http://www.ofheo.gov/information.asp?section=17OMB: http://www.whitehouse.gov/omb/inforeg/info_quality/information_quali
ty.htmlOPIC: http://www.opic.gov/SiteInfo/GuidelinesIntro.htm
69

2005 Report to Congress on the Costs and Benefits of Federal Regulations
OSC: http://www.osc.gov/InfoQuality.htm PBGC: http://www.pbgc.gov/media/key-resources-for-the-
press/content/page5274.htmlPeace Corps: http://www.peacecorps.gov/index.cfm?shell=pchq.policies.docsSBA: http://www.sba.gov/aboutsba/integrity.html SSA: http://www.ssa.gov/515/requests.htmTVA: http://www.tva.gov/infoquality/USAID: http://www.usaid.gov/about/info_quality/USITC: http://www.usitc.gov/policies/index.htmVA: http://www.va.gov/OIT/CIO/s515/Information_Quality.asp
Of the 14 departments and agencies that received correction requests in FY04, only DOI (MMS) and Treasury do not yet have fully transparent web pages. Because these agency Information Quality correction requests are not publicly available, Appendix E of this report provides their FY04 Information Quality Reports. E. Characteristics of an Effective Correction Request
During the first two years of implementation, OMB has been working with agencies on implementation of the correction-request process. In the course of this work, OMB has observed that affected parties take a variety of different approaches to making correction requests and has observed agencies in the response process. Based on this multi-agency experience, OMB has listed below a few tips that will bolster the quality of correction requests and make them easier for agencies to address in a rigorous and timely fashion.
Use Traditional Comment Processes When Available: When a party is concerned about
draft information that is currently under public review (e.g., as part of a rulemaking or technical comment process), the party is encouraged to submit the correction request as part of the traditional mechanism for public participation. In these situations, OMB and agency guidelines suggest that agencies should use the traditional mechanism to address the concerns in the correction request. Parties submitting correction requests in this manner can expect that agencies will provide a substantive response to the concerns raised in the correction request (e.g., agency responses in a "response to comment" document). If the agency makes no substantive response, the appeals process exists under OMB and agency guidelines to ensure responsiveness by the agency. It is important to note that the currently ongoing process which the agency uses should provide a response to the comments submitted; if no response to requestors’ comments will be provided through this process, then the Information Quality correction process would not be considered redundant.
Provide Peer-reviewed Evidentiary Support for the Correction Request Whenever Feasible: We have found that agencies are most responsive when the requestor supplies specific, peer-reviewed references to scientific sources that support their viewpoint.
70

IV: Implementation of the Information Quality Act
Go Beyond Criticism and Suggest A Specific Correction or Series of Corrections: As a starting point, it is critical that requestors be as specific as possible in pinpointing what information (e.g., paragraphs, tables or figures) needs to be corrected. Moreover, requests are most useful when they go beyond technical criticism and suggest an operational change in language, figures or numbers.
Focus on Substantive Quality of Information Rather than Agency Procedures: While agencies should be open to suggestions on how their Information Quality procedures can be improved in the future, the correction process is aimed at improving the substantive quality of specific disseminations. Correction requests should focus on the substance of information quality, not agency procedures.
Request Complete Withdrawal of a Dissemination Only as a Last Resort: When considering what kind of correction to request, one option is to request complete withdrawal of a dissemination (e.g., terminating dissemination of a report). However, it is a rare case where all of the information in a report is flawed. Describing a specific fix to the information that has been disseminated (e.g., an addendum or substitute paragraph or table) may prove to be more helpful to the agency.
Explain How the Requestor is Affected by the Dissemination: It is helpful to agencies when requestors provide a clear discussion of how they have been affected by the dissemination or how they may be affected in the future. F. Role of OMB’s New Peer Review Policy
Whereas the correction request and appeals processes are designed to address information quality after dissemination, the Information Quality Guidelines also recognize the importance of pre-dissemination quality assurance measures such as peer review. Specifically, OMB's guidelines say that information that has been peer reviewed carries with it the presumption of objectivity. Peer review is a highly regarded procedure used in the scientific community to promote independent review and critique by qualified experts and which is respected by the courts.17. In keeping with the goal of improving the quality of government information, on December 16, 2004, OIRA issued a Final Information Quality Bulletin on Peer Review.18
This Bulletin, which benefited from two rounds of public comment, a National Academy of Sciences workshop, and an interagency process, is designed to enhance the practice of peer review of government science documents. The Bulletin, which is available at http://www.whitehouse.gov/omb/memoranda/fy2005/m05-03.pdf describes the factors that should be considered in choosing an appropriate peer review mechanism and stresses that the rigor of the review should be commensurate with how the information will be used. Agencies are directed to choose a peer review mechanism that is adequate, giving due consideration to the novelty and complexity of the science to be reviewed, the relevance of the information to decision making, the extent of prior peer reviews, and the expected benefits and costs of 17 See Daubert v. Merrell Dow Pharmaceuticals, Inc., 509 U.S. 579 (1993). 18 http://www.whitehouse.gov/omb/memoranda/fy2005/m05-03.pdf
71

2005 Report to Congress on the Costs and Benefits of Federal Regulations
additional review. Highly influential scientific assessments require much more rigorous review than does other scientific information.
OMB is confident that the requirements of the Final Peer Review Bulletin will assist in improving the accuracy and transparency of agency science. Additionally, the peer review planning process described in the Bulletin, which includes posting of plans on agency websites, will enhance the ability of OMB and the public to track influential scientific disseminations made by agencies.
On June 16, 2005, the peer review bulletin became effective for all influential scientific
information, including highly influential scientific assessments. Agencies are currently posting on their web pages peer review agendas for highly influential scientific assessments. On December 16, 2005, agencies will begin posting peer review agendas for influential scientific information.
These postings will allow the public to participate in the peer review process by
providing data and comments to the sponsoring agencies as well as to external peer reviewers. Readers are encouraged to visit the peer review websites for agencies of interest. In addition, readers may find of interest several peer review agendas for highly influential scientific assessments that we believe are exemplary in form; links for these agendas at USGS, DOT and FSIS are:
USGS: http://www.usgs.gov/peer_review/#plans DOT: http://www.dot.gov/highlyinfluential.htmFSIS: http://www.fsis.usda.gov/Information_Quality/Peer_Review/index.asp
G. Response to Peer Reviews and Public Comments on the Information Quality Chapter General Comments
Comments on this chapter spanned a range that included applauding OMB for incorporating discussion of the Information Quality Act into the report (2 and N), and the suggestion that OMB reassess support for (J) or repeal (B) the Act.19 Specific comments are discussed below.
One commenter (B) suggested that the Act should be repealed as it is being used by industry to delay and derail important environmental, health and safety measures. OMB disagrees with this statement and, as discussed in the introduction of this chapter, we believe the Act provides an excellent opportunity to enhance both the competence and accountability of government.
19 See appendix F for a listing of all the written comments we have received, and the numbers or letters we have assigned to their comments. The public and peer review comments are available for review at http://www.whitehouse.gov/omb/inforeg/regpol-reports_congress.html.
72

IV: Implementation of the Information Quality Act
Comments on Analyses
One commenter (1) suggested that it would be useful to provide information for all the correction requests that have been filed. This commenter also suggested that the distinction between “influential” and “non-influential” data did not appear to make a difference in how agencies responded to correction requests. OMB agreed with these comments and we have revised our analysis so that there is not longer a separate analysis for “influential”, “non-influential” and “undetermined” correction requests. We have also provided an expanded discussion and rationale explaining which correction requests were included and which were excluded from our analysis.
One commenter (2) suggested that OMB should try to quantify the impact of the Act on regulatory outcomes and, as a first step, determine how many correction requests pertained to problems in a regulatory impact analysis. Thus far, OMB has found that none of the correction requests have pertained to a regulatory impact analysis. If a request of this type is submitted in the future, OMB will consider the suggestion to provide an expanded discussion of how the request was handled by the agency.
One commenter (N) suggested that it would be useful to discuss why agencies have denied such a high percentage of agency requests. OMB agrees that this information is useful. Many agencies have provided this information in their FY03 and FY04 Information Quality Reports to OMB. Readers are encouraged to look at these reports, most of which are available on-line at agency information quality websites (see links provided in section D of this chapter). FY03 reports are also available in the appendix of the OMB Information Quality Report to Congress FY03 (http://www.whitehouse.gov/omb/inforeg/fy03_info_quality_rpt.pdf). Comments on Perceptions and Realities:
Concerning Perception #1, one commenter (J) suggested that the Information Quality Act was in fact a last minute addition to the appropriations bill and was never debated by Congress. The commenter suggested that this section be eliminated from the report. OMB continues to believe that this section of the report is useful and provides readers with information regarding the history of the Information Quality Act.
Concerning Perception #2, one commenter (J) suggested that OMB miscalculates the number of correction requests received and suggested that this section be re-written to include a more accurate and complete accounting of requests received. OMB also believes that an accurate and complete accounting of requests is necessary. We believe that this section, as well as section A of the chapter, provides a transparent accounting of received correction requests. We have tried to be very transparent in describing which correction requests are included in our analyses and report and which are not. We also believe that in this chapter we have provided a clear rationale for inclusion and exclusion. Additionally, we include a footnote which cites the commenter’s analysis of the number of correction requests received.
One commenter (1) suggested that it was worth noting that the universe of correction
requests filed thus far is quite small when considered in the context of the number of other
73

2005 Report to Congress on the Costs and Benefits of Federal Regulations
information-related actions or regulatory actions that the Federal government undertakes in any given year. OMB agrees with this comment and when discussing Perception #2 we have added language that provides a comparison to the number of Freedom of Information Act/Privacy Act access requests that were received by the Federal government. In FY03 these requests numbered 3, 266,394.
Concerning Perception #3, one commenter (J) suggested that OMB emphasize that use of
the Act has been primarily by industry and requests that OMB provide a specific accounting for the level of use by different stakeholder groups. OMB believes that this section accurately provides information about the types of users of the correction request process. We have also cited two outside analyses that provide further detail on the percentages of different types of users. As these analyses are as we expected, at this time we did not feel it was necessary to conduct another analysis of these data.
One commenter (B) stated that our explanation why Information Quality petitions tend to
be disproportionately filed by private sector groups most affected by the disseminations, displays an insensitivity to the collective action dynamic. The commenter argues that concentrated effects experienced by regulated industries tend to promote the formation of political pressure groups where as collective action problems prevent members of the public from exercising influence commensurate with their interests. Though we agree that industry specific interests can be well organized, we note that much of regulation is no longer industry specific and the affinity groups that support regulation may benefit more from the dynamics of collective action. For example, Djankov et al. (2002) finds that democratic countries with limited and transparent governments such as the U.S. have been able to reduce the influence of narrow interests to the benefit of the public interest.20
Concerning Perception #4, one commenter (J) suggested that OMB better acknowledge
that the impact of the Act on the regulatory process and on information disseminations remains unknown. OMB agrees with the commenter and we have modified some of the language in this section to reflect the commenters concern. For instance, we state that “We have no evidence at this time to determine whether or not the Act has led to a reduced number of agency disseminations.” Additionally, as was suggested by two commenters (1 and J), we do acknowledge that correction requests that are not directly related to a rulemaking may still have an impact on a rulemaking in the future.
Concerning Perception #5, one commenter (J) suggested that we revise this section to
accurately describe the infrequent use of the appeals process and the results of these appeals. OMB agrees that it is important to be clear about the use of the appeals process. The chapter and analyses have been revised since the draft version and this version accurately reflects the percent of appeals that were submitted on the correction requests we evaluated in this analysis. Table 4-1 shows that of the 45 correction requests that were denied, 28 were appealed. Additionally, in discussion of Perception #5, we state that of the correction requests we examined, 21% of the appeals were granted while only 12% of original requests were granted.
20 Djankov S.; La Porta R.; Lopez-De-Silanes F.; Shleifer A. (2002), "The Regulation of Entry," The Quarterly Journal of Economics, 117(1), 1-37.
74

IV: Implementation of the Information Quality Act
One commenter (1) suggested that OMB add to this section the FWS appeals
determination regarding the Florida panther. We agree that this is an important decision to mention and have added discussion of this appeal to section A of the chapter where we discuss the agency handling of appeal requests. The discussion in Perception #5 then refers back to section A of the chapter.
Concerning Perception #6, one commenter (J) suggests that the perception that the
Information Quality Act is only about numerical data is not a common perception. OMB is pleased to hear this; however, we do think that this is an important point worth reiterating in the chapter. The commenter also suggested that OMB better describe what information is and is not covered by the Act and provide a complete listing of the types of information and forms of disseminations are not covered by the Information Quality Act. In addressing this comment, it is important to recognize that the Federal Agencies produce and disseminate many different types of information products. Each agency, in their agency-specific Information Quality Guidelines, has listed the types of information products that are covered and not covered by their Information Quality Guidelines. We encourage readers to look at the agency-specific guidelines of the Agencies of interest to see the specific inclusions and exclusions. The commenter has suggested that, after two years of implementation, a list should be provided. OMB believes, due to the relatively small number of substantive correction requests received, that any list created at this point in time would likely be incomplete. However, this is something we will consider in the future.
Concerning Perception #7, one commenter (J) suggests that OMB has ignored the fact
that the Information Quality Act establishes new information standards for any data supporting agency actions, which may unintentionally alter or influence prominent colleges and universities’ research practices. The commenter suggested that we further emphasize the fact that the Act does not apply to colleges and universities. OMB believes that this section makes it very clear that the Act covers only agency disseminations and, if an agency wishes to disseminate an information product produced by a third-party, it is the responsibility of the Federal Government to make sure that the information meets relevant information quality standards. When creating an information product that it hopes the Federal Government may disseminate, a third-party should keep in mind the quality standards that each agency would like to see met. Many agencies have outlined these standards in their agency-specific Information Quality Guidelines and in other agency documents as well. For instance, EPA has produced a document, entitled A Summary of General Assessment Factors for Evaluating the Quality of Scientific and Technical Information. This document, available at: http://www.epa.gov/OSA/spc/pdfs/assess2.pdf, was published by EPA as part of an effort to enhance the transparency about EPA’s quality expectations for information that is voluntarily submitted to or gathered or generated by the Agency for various purposes. The document is intended to inform information-generating scientists about quality issues that should appropriately be taken into consideration at the time information is generated. OMB believes that documents such as this one help third-parties understand agency quality standards that should be kept in mind when generating information that third-parties would like the Federal Government to use.
75

2005 Report to Congress on the Costs and Benefits of Federal Regulations
Comments on Judicial review:
Two commenters (M and N) suggested that because OMB has primary authority for implementing the Information Quality Act, OMB should advise DOJ and the public that final agency actions under the Information Quality Act are judicially reviewable under the APA. The issue of judicial review is currently under review by the court. DOJ speaks for the government on issues of judicial review. Comments on Transparency:
One commenter (J) noted that the report template sent to agencies for use when submitting their reports to OMB was inadequate. This commenter would like to see inclusion of staff hours, program costs, and budget allocation used to respond to correction requests. It was also suggested that the template ask for an estimate of benefits yielded from information changes that may result from the correction request. OMB will consider this comment as we design future templates for agency reporting. We also welcome suggestions regarding how to quantify benefits yielded from information changes.
One commenter (J) applauded the agencies for providing on-line access to correction requests to help ensure transparency. OMB was pleased to see this comment and this final chapter provides an updated and expanded list of agency Information Quality web-page links that allow the public to view agency correction requests and responses on-line.
One commenter (1) suggested that although blending of Information Quality Act procedures with other agency procedures may work well in some circumstances, OMB should note that there will be some situations where it does not. OMB agrees with this comment and is aware that in some cases, for instance in the rulemaking process, an agency response may not be generated in as timely manner as is intended by the Information Quality Act.
One commenter (J) suggested that OMB should not recommend that agencies increase the timeliness of their responses until OMB has better information regarding the burden the Act places on Agency resources. As mentioned above, OMB will consider collecting further information on agency burden and resources; however, we still feel that it is important for agencies to continue to strive to respond to correction requests in a timely manner.
One commenter (J) suggested that OMB should not recommend early consultation between agencies and OMB. This commenter suggested that the Act did not assign OMB any monitoring authority that would allow OMB to engage in agency consultation. OMB continues to be believe that we can play a valuable role in providing agencies with advice and information as implementation of the Act is still new to many agency staff. Comments on Peer Review:
One commenter (J) suggested that OMB should collect information on the impacts of the Bulletin on the agencies’ ability to develop and disseminate information in a timely manner and report these impacts to Congress. OMB will consider this suggestion for the future and
76

IV: Implementation of the Information Quality Act
welcomes suggestions on not only how to collect this information but also on what values should be used as a baseline against which to make comparisons.
77


APPENDIX A: CALCULATION OF BENEFITS AND COSTS
Chapter I presents estimates of the annual costs and benefits of selected major final regulations reviewed by OMB between October 1, 1994 and September 30, 2004. OMB presents more detailed explanation of these regulations in several documents. The explanation of the calculations for the major rules reviewed by OMB between April 1, 1995 and March 31, 1999 can be found in Chapter IV of our 2000 Report. Table 19, Appendix E, of the 2002 Report presents OMB's estimates of the benefits and costs of the 20 individual rules reviewed between April 1, 1999 and September 30, 2001. Tables 18 and 19 in Appendix A in the 2003 Report present the results for October 1, 1993 to March 31, 1995 (Table 18), and October 1, 2001 to September 30, 2002 (Table 19). Table 12 in Appendix A of the 2004 Report presents the rules from October 1, 2002 to September 30, 2003. Tables 1-4 and A-1 of this Report present the rules from October 1, 2003 to September 30, 2004. All benefit and cost estimates were adjusted to 2001 dollars.
In assembling estimates of benefits and costs presented in Table 1-4, OMB has: (1) applied a uniform format for the presentation of benefit and cost estimates in
order to make agency estimates more closely comparable with each other (for example, annualizing benefit and cost estimates); and
(2) monetized quantitative estimates where the agency has not done so (for example, converting Agency projections of quantified benefits, such as estimated injuries avoided per year or tons of pollutant reductions per year, to dollars using the valuation estimates discussed below).
All inflation adjustments are performed using the latest available GDP deflator. In instances where the nominal dollar values the agencies use for their benefits and costs is unclear, we assume the benefits and costs are presented in nominal dollar values of the year before the rule is finalized. In periods of low inflation such as the past few years, this assumption does not impact the overall totals. All amortizations are performed using a discount rate of 7%, unless the agency has already presented annualized, monetized results using a different explicit discount rate. OMB discusses, in this Report and in previous reports, the difficulty of estimating and aggregating the costs and benefits of different regulations over long time periods and across many agencies. In addition, where OMB has monetized quantitative estimates where the agency has not done so, we have attempted to be faithful to the respective agency approaches. The adoption of a uniform format for annualizing agency estimates allows, at least for purposes of illustration, the aggregation of benefit and cost estimates across rules; however, the agencies have used different methodologies and valuations in quantifying and monetizing effects. Thus, an aggregation involves the assemblage of benefit and cost estimates that are not strictly comparable. In part to address this issue, the 2003 Report included OMB’s new regulatory analysis
79

2005 Report to Congress on the Costs and Benefits of Federal Regulations
80
guidance, also released as OMB Circular A-4, which took effect on January 1, 2004, for proposed rules and January 1, 2005 for final rules. The guidance recommends what OMB considers to be “best practice” in regulatory analysis, with a goal of strengthening the role of science, engineering, and economics in rulemaking. The overall goal of this guidance is a more competent and credible regulatory process and a more consistent regulatory environment. OMB expects that as more agencies adopt our recommended best practices, the costs and benefits we present in future reports will become more comparable across agencies and programs. The 2006 Report will be the first Report that includes final rules subject to OMB Circular A-4. OMB will work with the agencies to ensure that their impact analyses follow the new guidance. Table A-1 below presents the unmodified information on the impacts of 26 major rules reviewed by OMB from October 1, 2003 through September 30, 2004, and includes additional explanatory text on how agencies calculated the impacts for these rulemakings. Table 1-4 in Chapter 1 of this Report presents the adjusted impact estimates for the 11 rules finalized in 2004 that were added to the Chapter 1 accounting statement totals.

Table A-1: Summary of Agency Estimates for Final Rules October 1, 2003 to September 30, 2004 (As of Date of Completion of OMB Review)
Rule [FR Cite] Agency Benefits Costs Other Information Prohibition of the Use of Specified Risk Materials (SRM), and Meat/Bone Separation Machinery and Meat Recovery (AMR) Systems requirements. [69 FR 1862]
USDA-FSIS
Not quantified $110.3 million to $149.1 million annually
Benefits: The benefits of the SRM and AMR interim final rules are primarily those resulting from the reduction in human exposure to BSE infectivity and the restoration of beef exports. USDA modified a model of BSE risk originally created by Harvard and Tuskegee University, which is commonly known as the Harvard model. USDA estimates, if 5 BSE-positive cows were introduced into the United States, that the rule would reduce the number of ID50s available in the food supply from 18.5 to 4 (90% confidence interval of 0-20 ID50s). An ID50 is the amount of BSE infectious agent that can cause an exposed bovine to become infected with 50 percent probability. Because the exact quantitative relationship between human exposure to the BSE agent and the likelihood of human disease is unknown, USDA did not evaluate the quantitative likelihood that humans will develop variant Creutzfeldt Jakob Disease (vCJD) if exposed to the BSE agent. Costs: The agency performed one analysis for both rules. The primary annual costs of the SRM interim final rule are the exclusion of SRMs from use in the human food supply, the prohibition on non-ambulatory disabled cattle, and modifications of safety programs and record keeping requirements. The primary impacts of the AMR interim final rule are restrictions on incorporating certain non-meat components in AMR products, testing AMR products, and revisions to safety plans and bookkeeping requirements. The annualized cost of the AMR interim final rule is estimated at $11-12 million, the annualized cost of the SRM rule is estimated at $97-$134 million, and the annual cost of additional inspection, testing, and surveillance by FSIS is estimated at $3 million. The Regulatory Impact Analysis (RIA) is available online at http://www.fsis.usda.gov/OPPDE/rdad/FRPubs/Docs_03-025IF.htm
81 Appendix A

82 2005 Report to Congress on the Costs and Benefits of Federal Regulations
Table A-1: Summary of Agency Estimates for Final Rules, Cont.
Rule [FR Cite] Agency Benefits Costs Other Information General Order Implementing Syria Accountability and Lebanese Sovereignty Act of 2003 [69 FR 26766]
DOC-BIS Not estimated Approximately $140 million per year in lost exports
Costs: In calendar year 2003, U.S. exports to Syria, excluding food and medicine, totaled approximately $140 million. DOC assumed this amount would have continued into the future in the absence of this rulemaking.
Bar Code Label Requirements for Human Drug Products and Blood Products [69 FR 9120]
HHS-FDA $5.2 billion per year (7%), $4.9 billion per year (3%).
Direct regulatory costs per year: $8 million (7%), $7 million (3%). Anticipated hospital costs of $660 million (7%), $600 million (3%).
Benefits: FDA estimates that the primary benefits of the rulemaking would be fewer medication errors. FDA also estimated a range of possible efficiencies in hospital activities associated with accelerated adoption of technology of $360-$600 million per year, although the benefits reported here do not include estimated hospital efficiencies as FDA considered these estimates very uncertain. Costs: FDA estimates two components of costs: a small direct cost imposed on drug labelers to add bar codes to their products, and the estimated opportunity costs of the expected accelerated investment in bar coding systems by the hospitals. These investment expenditures are necessary to achieve the societal benefits expected from the rule. Other details: FDA also anticipated income transfers because of reduced awards for medical malpractice; however, these estimated transfers were not quantified. The model used by FDA assumes an accelerated technology adoption curve for bar-code readers. Because the model assumes that bar-code readers would eventually be adopted after 20 years even in the absence of this rulemaking, the model estimates an annualized cost over 20 years but assumes that there are no costs and benefits thereafter. A summary of the RIA was published in the FR notice. The full RIA is on display in the Division of Dockets Management.
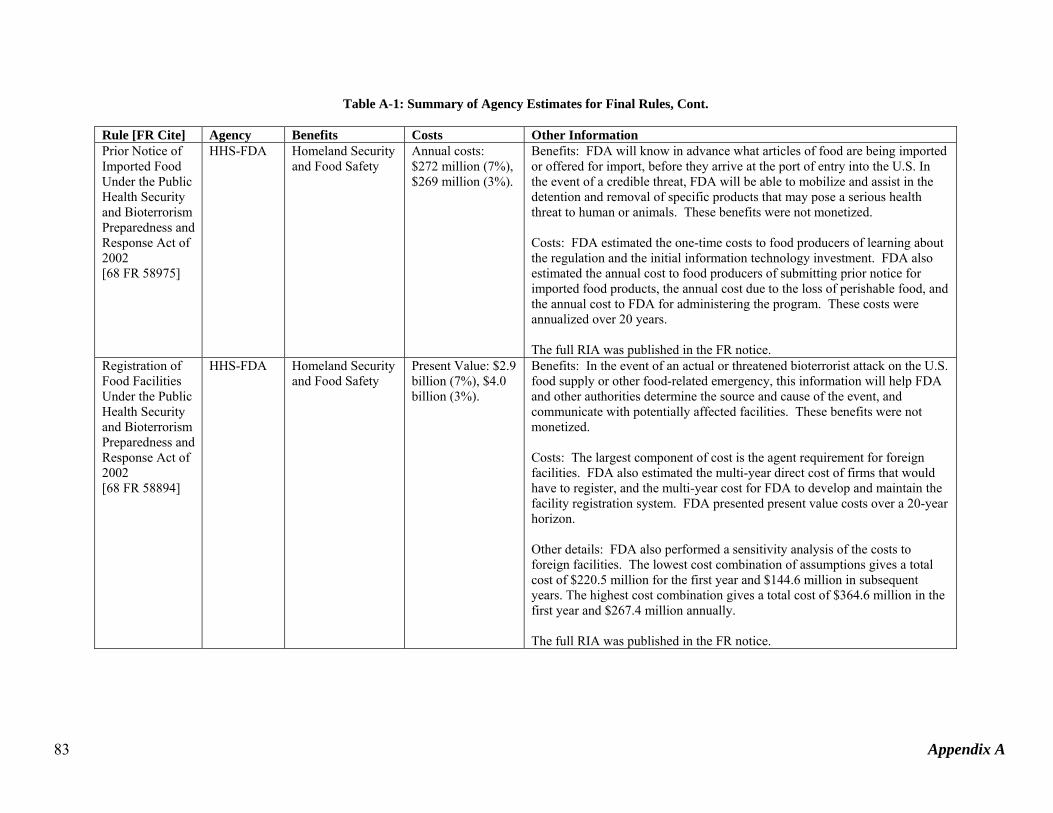
Table A-1: Summary of Agency Estimates for Final Rules, Cont.
Rule [FR Cite] Agency Benefits Costs Other Information
Prior Notice of Imported Food Under the Public Health Security and Bioterrorism Preparedness and Response Act of 2002 [68 FR 58975]
HHS-FDA Homeland Security and Food Safety
Annual costs: $272 million (7%), $269 million (3%).
Benefits: FDA will know in advance what articles of food are being imported or offered for import, before they arrive at the port of entry into the U.S. In the event of a credible threat, FDA will be able to mobilize and assist in the detention and removal of specific products that may pose a serious health threat to human or animals. These benefits were not monetized. Costs: FDA estimated the one-time costs to food producers of learning about the regulation and the initial information technology investment. FDA also estimated the annual cost to food producers of submitting prior notice for imported food products, the annual cost due to the loss of perishable food, and the annual cost to FDA for administering the program. These costs were annualized over 20 years. The full RIA was published in the FR notice.
Registration of Food Facilities Under the Public Health Security and Bioterrorism Preparedness and Response Act of 2002 [68 FR 58894]
HHS-FDA Homeland Security and Food Safety
Present Value: $2.9 billion (7%), $4.0 billion (3%).
Benefits: In the event of an actual or threatened bioterrorist attack on the U.S. food supply or other food-related emergency, this information will help FDA and other authorities determine the source and cause of the event, and communicate with potentially affected facilities. These benefits were not monetized. Costs: The largest component of cost is the agent requirement for foreign facilities. FDA also estimated the multi-year direct cost of firms that would have to register, and the multi-year cost for FDA to develop and maintain the facility registration system. FDA presented present value costs over a 20-year horizon. Other details: FDA also performed a sensitivity analysis of the costs to foreign facilities. The lowest cost combination of assumptions gives a total cost of $220.5 million for the first year and $144.6 million in subsequent years. The highest cost combination gives a total cost of $364.6 million in the first year and $267.4 million annually. The full RIA was published in the FR notice.
83 Appendix A

84 2005 Report to Congress on the Costs and Benefits of Federal Regulations
Table A-1: Summary of Agency Estimates for Final Rules, Cont.
Rule [FR Cite] Agency Benefits Costs Other Information
Final Rule Declaring Dietary Supplements Containing Ephedrine Alkaloids Adulterated Because They Present an Unreasonable Risk [69 FR 6787]
HHS-FDA Annual health benefits of $43 million to $132 million.
Annual utility losses for consumers: $6 million to $81 million. Product Reformulation $1 million to $9 million.
Benefits: The benefits of this final rule stem from the reduction of risks brought about by removing dietary supplements containing ephedrine alkaloids from the market. FDA measures the risk reduction, for the purpose of estimating benefits, as the number of illnesses and deaths averted. Costs: FDA estimated that the primary cost of this rule is a loss of consumer surplus from these products no longer being on the market. They also estimated that the rulemaking would lead to the reformulation of some products that remained on the market. Other details: The uncertainty range in benefits and costs reflects the fact that FDA could not determine whether consumer behavior already incorporated the health risks posed by these products; FDA estimates net effects would be between -$47 million and $125 million per year from this rule, if consumer behavior does not already incorporate the health risks, and between -$90 million and -$7 million per year, if consumer behavior already incorporates the health risks. The full RIA was published in the FR notice for the final rule and the FR notice for the 1997 proposed rule [62 FR 30678].

Table A-1: Summary of Agency Estimates for Final Rules, Cont.
Rule [FR Cite] Agency Benefits Costs Other Information
Health Insurance Reform: Standard Unique Health Care Provider Identifier [69 FR 3433]
HHS-CMS Total savings (2007-2011): health care, $341 million, provider, $840 million.
Total costs (2007-2011): health care, $426 million; provider, $213 million; application and update, $15 million; national provider ID system, $128 million.
Benefits: CMS estimated that the unique National Provider Identification number (NPI) required by this rule would lead to approximately 5% savings for health plans, since they would not longer have to retain a separate system if identifiers that exist today. CMS also estimated that the NPI would lead to 10% savings for health care providers. They reap greater savings by not having to keep track of separate identifiers for each health plan and possibly for each location, address, or arrangement. Costs: CMS estimated that transiting to the NPI would increase the total costs of health plans by 10%. Health plans would need to make some system changes from their current identifiers to the NPI. The NPI would also increase the costs of health care providers by approximately 5%. Health care providers need only to substitute the NPI for their current identifier(s). The cost of administering the national provider system itself is a Federal budget cost that was not estimated separately. Other details: In summary, CMS estimated the transition environment for health plans and health care providers and concluded that adoption of an NPI would be a net cost to health care plans but a net savings to health care providers. The figures have been adjusted to reflect 2007 dollars. The RIA was published in the FR notice. The May 7, 1998, proposed rule for the National Provider Identifier (NPI) contained a more detailed cost-benefit analysis based on the aggregate impact of all the HIPAA administrative simplification standards for electronic data interchange (EDI). The HIPAA Transactions Rule (at 65 FR 50350) also includes an updated impact analysis.
85 Appendix A

86 2005 Report to Congress on the Costs and Benefits of Federal Regulations
Table A-1: Summary of Agency Estimates for Final Rules, Cont.
Rule [FR Cite] Agency Benefits Costs Other Information
Medicare Prescription Drug Discount Card [68 FR 69839]
HHS-CMS Maximum additional revenue from fees per endorsed sponsor: $13 million in 04, $13 million in 05, none in 06.
Administrative costs: $10-18 million in 04, $4 - $7 million in 05, $600 - $900 thousand in 06.
Benefits: Since this rulemaking facilitates a new market, the surplus firms will receive in this new market are benefits of this rulemaking. CMS proxies this surplus by estimating the additional revenue from the fees charged by a firm that is an endorsed drug card sponsor. Costs: Since this rulemaking facilitates a new market, the administrative costs firms must incur to enter this market are costs of this rulemaking. Other details: CMS estimates transfers based on the savings to beneficiaries from discount card activities, including negotiated prices on prescription drugs and education about generic substitution by endorsed sponsors. Transfer estimates range from $1.4 billion to $1.8 billion for 2004 (assuming for the purposes of this impact analysis implementation beginning second quarter 2004), $2.0 billion to $2.7 billion in 2005, and $0.4 billion to $0.6 billion in the first four and one-half months of 2006. This impact would be a transfer of money due to a decrease in the revenues of entities providing the supply of drugs to consumers. This represents at most 1.18 percent of projected total retail prescription drug spending during the respective periods of analysis. In addition to savings from discount card activities, a subset of discount card enrollees—those who qualify for transitional assistance—are projected to save $2.6 billion in 2005 and up to $0.1 billion in 2006 due to the annual $600 transitional assistance. Beneficiary savings from transitional assistance are funded through the Federal budget, so these savings are a transfer from budget revenue to beneficiaries. The full RIA was published in the FR notice.

Table A-1: Summary of Agency Estimates for Final Rules, Cont.
Rule [FR Cite] Agency Benefits Costs Other Information
Required Advance Electronic Presentation of Cargo Information [68 FR 68139]
DHS-CBP Homeland Security $1.1 billion per year central estimate, with a range of $0.3 billion to $2.2 billion per year.
Benefits: CBP stated that the rule’s primary benefit would be to improve cargo security. This benefit was not monetized. Once implemented, this rule will give CBP more time to analyze cargo data, thereby enabling it to target attention on high-risk cargo or carriers. In addition to improving the effectiveness of inspections, improved targeting may act as a deterrent. Costs: The economic analysis focused on those sectors where shippers or carriers are likely to have to change current practices to come into compliance. For air, the rule will impose substantial new costs, mandating electronic data entry at a level of detail not currently required prior to arrival and causing operational changes to meet the filing requirements for flights into the U.S. from airports north of the equator in the western hemisphere. For trucking, the costs are offset by the time savings gained by faster clearance across the border. Other details: The uncertainty interval presented by CBP was based on a series of sensitivity analyses of the level of traffic, information technology investment, and business practice changes required from the air carriers by the rule. The faster movement across the border also provides benefits to other traffic at the border, which the analysis quantified. The costs reported here are annualized over 5 years at a 7% discount rate. The RIA is available online at http://www.cbp.gov/linkhandler/cgov/import/communications_to_industry/advance_info/ria_electronic_filing.ctt/ria_electronic_filing.pdf
87 Appendix A

88 2005 Report to Congress on the Costs and Benefits of Federal Regulations
Table A-1: Summary of Agency Estimates for Final Rules, Cont.
Rule [FR Cite] Agency Benefits Costs Other Information
Area Maritime Security [68 FR 60472]
DHS-USCG Reduced risk and impact of a transportation security incident
$477 million (present value) for the period 2003 to 2012
Benefits: This final rule, along with the Vessel Security and Facility Security final rules, was published jointly as part of the implementation of the National Maritime Security Initiative. This initiative is designed to reduce the risk and impact of a transportation security incident. Costs: The Coast Guard’s estimated costs include the direct compliance costs of additional security for the ports (e.g. guards, perimeter security), as well as more indirect costs such as committee meetings, travel, and security drilling. The cost estimates were annualized over 10 years. Other details: Benefits are estimated in “risk points reduced,” a qualitative measure designed to help estimate the overall increase in security many different activities would produce. The area maritime security rule had an estimated cost per risk point reduced of $469 (present value, 2003–2012) (68 FR 39288). This final rule superseded the area maritime security interim rule discussed in last year’s Report. The Coast Guard published a series of six temporary Interim Final Rules, the three which are listed in this report are the economically significant rules in this series, in order to promulgate requirements mandated by the Maritime Transportation Security Act (MTSA) of 2002 (Public Law 107-295). These were effective from July 1, 2003, until November 25, 2003. The full joint RIA for all three Coast Guard final rules was published in the FR notice for the final rules and the FR notice for the interim rules [68 FR 39272].

Table A-1: Summary of Agency Estimates for Final Rules, Cont.
Rule [FR Cite] Agency Benefits Costs Other Information
Vessel Security [68 FR 60483]
DHS-USCG Reduced risk and impact of a transportation security incident
$1.368 billion (present value) for the period 2003 to 2012
Benefits: This final rule, along with the Area Security and Facility Security final rules, was published jointly as part of the implementation of the National Maritime Security Initiative. This initiative is designed to reduce the risk and impact of a transportation security incident. Costs: The Coast Guard’s estimated costs include purchasing, installing, and maintaining security-related equipment; hiring security officers, and preparing paperwork. The cost estimates were annualized over 10 years. Other details: Benefits are estimated in “risk points reduced,” a qualitative measure designed to help estimate the overall increase in security many different activities would produce. The vessel security rule had an estimated cost per risk point reduced of $233 (present value, 2003–2012) (68 FR 39299). This final rule superseded the vessel security interim rule discussed in last year’s Report. The full joint RIA for all three Coast Guard final rules was published in the FR notice for the final rules and the FR notice for the interim rules [68 FR 39272].
89 Appendix A

90 2005 Report to Congress on the Costs and Benefits of Federal Regulations
Table A-1: Summary of Agency Estimates for Final Rules, Cont.
Rule [FR Cite] Agency Benefits Costs Other Information
Facility Security [68 FR 60515]
DHS-USCG Reduced risk and impact of a transportation security incident
$5.399 billion (present value) for the period 2003 to 2012
Benefits: This final rule, along with the Area Security and Vessel Security final rules, was published jointly as part of the implementation of the National Maritime Security Initiative. This initiative is designed to reduce the risk and impact of a transportation security incident. Costs: The Coast Guard’s estimated costs include purchasing, installing, and maintaining security-related equipment; hiring security officers, and preparing paperwork. The cost estimates were annualized over 10 years. Other details: Benefits are estimated in “risk points reduced,” a qualitative measure designed to help estimate the overall increase in security many different activities would produce. The facility security rule had an estimated cost per risk point reduced of $1,517 (present value, 2003–2012) (68 FR 39319). This final rule superseded the facility security interim rule discussed in last year’s Report. The full joint RIA for all three Coast Guard final rules was published in the FR notice for the final rules and the FR notice for the interim rules [68 FR 39272].

Table A-1: Summary of Agency Estimates for Final Rules, Cont.
Rule [FR Cite] Agency Benefits Costs Other Information
Authority To Collect Biometric Data From Additional Travelers and Expansion to the 50 Most Highly Trafficked Land Border Ports of Entry (US-VISIT) [69 FR 53318]
DHS-BTS Homeland Security $155 million for all 50 ports during 2004, or approximately $3.1 million at each of the ports.
Benefits: The anticipated benefits of this rule include: (1) Improving identification, through the use of biometric identifiers, of travelers who may present threats to public safety; (2) enhancing the government’s ability to match an alien’s fingerprints and photographs to other law enforcement or intelligence data; (3) improving the ability to identify individuals who may be inadmissible to the United States; (4) improving cooperation across international, Federal, State and local agencies through better access to data on foreign nationals who may pose a threat; (5) improving facilitation of legitimate travel and commerce by improving the timeliness and accuracy of the determination of a traveler’s immigration status and admissibility; (6) enhancing enforcement of immigration laws; (7) reducing fraud, undetected impostors, and identity theft; and, (8) increasing integrity within the Visa Waiver Program through better data collection, tracking, and identification. These benefits are not monetized. Costs: The costs associated with implementation of this interim rule for travelers not otherwise exempt from US–VISIT requirements include an increase of approximately 15 seconds in inspection processing time per applicant over the current average inspection time of one minute, whether at a land, air, or sea port-of-entry. The cost estimates were annualized over 7 years. A summary of the RIA was published in the FR notice for the final rule and the FR notice for the interim final rule [69 FR 468]. The full RIA is not available online.
91 Appendix A

92 2005 Report to Congress on the Costs and Benefits of Federal Regulations
Table A-1: Summary of Agency Estimates for Final Rules, Cont.
Rule [FR Cite] Agency Benefits Costs Other Information
Early-Season Migratory Bird Hunting Regulations [69 FR 52970; 53564; 53990]
DOI Consumer surplus lost without duck hunting regulations: $734 million to $1.1 billion (2003$) annually, with a mid-point estimate of $899 million.
Not Estimated Benefits: The listed benefits represent estimated consumer surplus. Data to estimate producer surplus are not available; producer surplus is likely minimal compared to consumer surplus, but would also be a benefit of the rule if monetized. Costs: The economic model did not produce a separate estimate of the costs of the rulemaking. Other details: DOI performed an economic impact analysis to jointly estimate the impact of all of early and late season migratory bird hunting regulations for the 2004-2005 season. DOI finalized a total of three Early Season regulations, the Final Framework (69 FR 52970), the Bag and Possession Limits (69 FR 53564), and the Regulations on Certain Federal Indian Reservations and Ceded Lands (69 FR 53990). This analysis looks at the economic effects of duck hunting, the major component of all migratory bird hunting. Sufficient data exists for duck hunting to generate an analysis of hunter behavior in response to regulatory alternatives. The analysis for all migratory bird hunting is not possible because of data limitations, but can be inferred from the results of the duck hunting analysis presented here.
Late-Season Migratory Bird Hunting Regulations [69 FR 57140; 57752; 58236]
DOI See “Early Season” benefits above.
Not Estimated Benefits: The listed benefits represent estimated consumer surplus. Data to estimate producer surplus are not available; producer surplus is likely minimal compared to consumer surplus, but would also be a benefit of the rule if monetized. Costs: The economic model did not produce a separate of estimate the costs of the rulemaking. Other details: DOI performed an economic impact analysis to jointly estimate the impact of all of early and late season migratory bird hunting regulations for the 2004-2005 season. DOI finalized a total of three Late Season regulations, the Final Framework (69 FR 57140), the Bag and Possession Limits (69 FR 57752), and the Regulations on Certain Federal Indian Reservations and Ceded Lands (69 FR 58236). See above for a summary of the impacts of hunting regulations.

Table A-1: Summary of Agency Estimates for Final Rules, Cont.
Rule [FR Cite] Agency Benefits Costs Other Information
Defining and Delimiting the Exemptions for Executive, Administrative, Professional, Outside Sales, and Computer Employees [69 FR 22122]
DOL-ESA Not Quantified First-year implementation costs to employers are estimated to be $738.5 million, of which $627.1 is related to reviewing the regulation and revising overtime policies, and $111.4 million is related to conducting job reviews.
Benefits: More efficient litigation of FLSA disputes generates real resource savings that are unquantified. This is due to fewer scarce resources being devoted to lawsuit resolution, and less of a need for sophisticated time motion studies to determine eligibility. Costs: ESA estimates an upfront cost due to a significant reconsideration of overtime policies. The major unquantified cost is the additional inefficiency introduced into the labor market, which may lead to some dead weight loss. Other details: This rule has major distributional effects. DOL estimated transfers due to payroll impacts and decreases in liquidated damages. Transfers from employers to employees, in the form of greater overtime pay or higher base salaries, are estimated to be $375 million per year. The rule also may lead to decreased payrolls, which were unquantified, due to a less strict test for high income workers. The rule also will lead to less litigation, which will generate transfers and benefits. The decrease in liquidated damages is based on less back wages being paid out because the employees were correctly paid overtime in the first place; this is likely to save businesses at least $252 million a year. The full RIA was published in the FR notice.
Pipeline Integrity Management in High Consequence Areas (Gas Transmission Pipelines) [68 FR 69777]
DOT-RSPA Over 20 years: accident reduction, $1.1 billion; supply disruption, $1 billion; replacement waivers, $1 billion.
$4.7 billion over 20 years.
Benefits: quantified benefits include a reduction in accidents that result in injury and death, avoiding economic impacts associated with supply disruption, and giving RSPA a basis to waive current replacement requirements designed to reduce operating stresses in pipelines when population near them increases. Unquantified benefits include an improved ability to site pipelines in certain critical markets. Inability to site future pipelines could affect the Nation's ability to use the increased quantities of natural gas that the Energy Information Administration estimates will be needed to fuel our economy over the next 20 years. Costs: are direct implementation costs. The full RIA is available online at http://dmses.dot.gov/docimages/pdf89/295030_web.pdf
93 Appendix A

94 2005 Report to Congress on the Costs and Benefits of Federal Regulations
Table A-1: Summary of Agency Estimates for Final Rules, Cont.
Rule [FR Cite] Agency Benefits Costs Other Information
Reduced Vertical Separation Minimum (RVSM) in Domestic United States Airspace [68 FR 61303]
DOT-FAA Fuel savings of $5.3 billion for 2005 to 2016, or $3 billion discounted.
Equipment upgrade of $869.2 million for 2002-2016, or $764.9 million discounted.
Benefits: The principal benefit of this rulemaking is direct fuel savings. Other operational benefits that were not fully monetized are (1) An increase in the number of available flight levels; (2) enhanced airspace capacity; (3) greater opportunities to operate more time efficient routes and altitudes; and (4) enhanced air traffic controller flexibility by increasing the number of available flight levels, while maintaining an equivalent level of safety. Costs: FAA assumed that that operators would choose to upgrade almost all of their aircraft to meet RVSM standards. The costs reported here are based on that upgrade. The full RIA is available online at: http://dmses.dot.gov/docimages/pdf88/257486_web.pdf
Computer Reservations System Regulations [69 FR 976]
DOT-OST Not Estimated Not Estimated Benefits: Computer reservations systems (CRSs) provide software to travel agents to allow them to book airfares posted from air carriers. The 20-year-old CRS rules were intended to prevent carriers from using the CRS systems they owned at that time from undermining other carriers' ability to compete. After a comprehensive review, DOT concluded that the rules are no longer necessary and existing enforcement mechanisms can address any anticompetitive or consumer deception problems. Other details: According to two industry studies, allowing the rules to sunset will lead to savings between $200 million and $666 million per year. The full RIA is available online at: http://dmses.dot.gov/docimages/pdf89/277889_web.pdf

Table A-1: Summary of Agency Estimates for Final Rules, Cont.
Rule [FR Cite] Agency Benefits Costs Other Information
Effluent Guidelines and Standards for the Meat and Poultry Products Point Source Category (Revisions) [69 FR 54475]
EPA $0-$10 million $41-$56 million Benefits: Monetized benefits include recreational and non-use benefits from improved water quality in freshwater rivers, lakes and streams. Other benefits may be reductions in pathogens, oil and grease, and nutrients. These were not monetized due to limitations in water quality modeling. In addition, the benefits from reduced eutrophication due to reductions in nutrient discharges may not be fully captured in monetized estimates. Costs: Compliance costs to industry and lost government revenues from tax shields. Since all facilities already have permits, no incremental administrative costs were incurred. The full RIA is available on-line at EPA Edockets: http://www.epa.gov/edocket. Docket OW–2002–0014, document numbers 2484 and 2485.
Establishing Location, Design, Construction, and Capacity Standards for Cooling Water Intake Structures at Large Existing Power Plants [69 FR 41575]
EPA $82.9 million $389.2 million Benefits: include monetized use benefits such as increased fish catch to commercial and recreational fisherman. Ecological and other non-use benefits were not monetized. Costs: Include direct facility compliance costs and State and Federal administrative costs. The costs were annualized based on the expected useful life of each cost component. The full RIA is available on-line at http://www.epa.gov/waterscience/316b/econbenefits/final.htm.
95 Appendix A

96 2005 Report to Congress on the Costs and Benefits of Federal Regulations
Table A-1: Summary of Agency Estimates for Final Rules, Cont.
Rule [FR Cite] Agency Benefits Costs Other Information
National Emission Standards for Hazardous Air Pollutants (NESHAP) for Stationary Reciprocating Internal Combustion Engines [69 FR 33473]
EPA $265 million (7%); $280 million (3%)
$248 million Benefits: Monetized benefits are based on health effects of reducing PM10, and the effect of NOx reductions on reducing PM10 and O3. The estimated annual tons reductions are the following: 5,600 HAP; 234,400 Carbon Monoxide; 167,900 NOx; 3,700 PM10. Costs: Include estimated control, administrative, and recordkeeping and reporting costs. The estimated total cost of the rule also takes into account the impact on affected producers and consumers of affected product in response to the imposition of compliance costs. The full RIA is available on-line at EPA Edockets: http://www.epa.gov/edocket. Docket OAR-2002-0059, document numbers 0678, 0679, and 0680.
NESHAP: Plywood and Composite Wood Products [69 FR 45943]
EPA 11,000 tons per year reduction of HAP; 27,000 tons per year in VOC (as total HC); 13,000 tons per year of PM10; 11,000 tons per year of CO
143 million per year in 2001 dollars. 4,000 tons per year increase in both NOx and SO2.
Benefits: The tons of emissions reduced are reported in the benefits section to the left. EPA could not monetize the benefits of these reductions due to a lack of sufficient air quality modeling data to indicate where emission changes and human health effects would occur. Costs: Compliance costs include the costs of controlling and monitoring, recordkeeping, and reporting requirements. Costs also include the increases in emissions due to the increased electricity required to operate the control systems. The total cost takes into account the behavioral response of consumers and producers to higher pollution control costs. EPA estimates that the costs could result in price increases nationally of 0.9 to 2.5 percent for products affected by this rule, and a reduction in output of 0.1 to 0.7 percent nationally for the affected industries. Other details: To the extent facilities can demonstrate eligibility of some sources for the low-risk subcategory and forego installing pollution control devices, both benefits and costs would be reduced. The full RIA is available on-line at EPA Edockets: http://www.epa.gov/edocket. Docket OAR-2003-0048, document numbers 0158 and 0159.

Table A-1: Summary of Agency Estimates for Final Rules, Cont.
Rule [FR Cite] Agency Benefits Costs Other Information
NESHAP: Industrial/ Commercial/ Institutional Boilers and Process Heaters [69 FR 55218]
EPA $15 billion per year (7%), $16 billion per year (3%).
$863 million per year for existing sources, $19 million per year for new sources.
Benefits: The rule leads to a reduction in pollutants from existing plants (in tons per year) of: HAP - 59,000; PM10 - 560,000; SO2 - 113,000. The rule also leads to a reduction in pollutants from new plants (in tons per year) of: HAP – 73, and PM10 – 65. Unquantified benefits include health benefits from Hg and other heavy metals, reduced threat to fish, wildlife, and ecosystems. Costs: Compliance costs were separately estimated for existing sources and new sources. Other details: To the extent facilities can demonstrate eligibility of some sources for the low-risk subcategory and forego installing pollution control devices, both benefits and costs would be reduced relative to the estimates presented here. The full RIA is available on-line at EPA Edockets: http://www.epa.gov/edocket. Docket OAR–2002–0058, document number 0610.
NESHAP: Surface Coating of Automobiles and Light-Duty Trucks [69 FR 22601]
EPA Reductions in tons per year: HAP - 6000 (toluene, xylene, glycol ethers, MEK, MIBK, ethylbenzene,& methanol); VOC - 12,000 to18,000
$154 million per year.
Benefits: EPA concluded that there is no scientifically supportable method for placing value on Volatile Organic Compound (VOC) reductions; therefore these benefits were not monetized. Costs: The total costs of the rule including the estimated compliance costs associated with the rule and the predicted changes in prices and production in the affected industry. The full RIA is available on-line at EPA Edockets: http://www.epa.gov/edocket. Docket OAR-2002-0093, document numbers 0043, and 0044.
97 Appendix A

2005 Report to Congress on the Costs and Benefits of Federal Regulations
Table A-1: Summary of Agency Estimates for Final Rules, Cont.
Rule [FR Cite] Agency Benefits Costs Other Information
Control of Emissions of Air Pollution From Nonroad Diesel Engines and Fuel [69 FR 38958]
EPA Total annual benefits in 2030 are estimated to be $83 billion (3%) for premature mortality and non-fatal myocardial infarctions ($78 billion at 7%). The present value of benefits over the period from 2004 to 2036 is $805 billion (3%), $350 billion (7%).
Total annual costs are estimated to be $53 million in 2008. Total annual costs are expected to increase to $2,059 million in 2030 and $2,239 million in 2036. The present value of costs over the period from 2004 to 2036 is estimated to be $27.1 billion (3%), $13.8 billion (7%).
Benefits: The benefits are based on the reduction in emissions of NOx, PM, and SO2. Unquantified benefits include reduced sulfur in home heating oil and the benefits from pollution reduction in Alaska and Hawaii. Costs: EPA estimated costs to refiners and to engine producers and users. The standards will generally require that refiners add hydrotreating equipment and possibly new or expanded hydrogen and sulfur plants in their refineries. The standards will also generate some additional distribution costs and cost of lubricity additives, as hydrotreating tends to reduce the natural lubricating quality of diesel fuel. Engine redesign costs include research and development, retooling, certification, new hardware, assembly time, and lifecycle operating costs. Engine costs will be offset somewhat by savings due to reduced engine wear and oil degradation. Other details: In order to characterize the benefits, the analysis used a benefits transfer method to scale the benefits of the modeled control options from the Proposed Nonroad Diesel Engines standards. The scaling procedure reflects the differences in emission reductions achieved under the final standards compared to the proposed standards. The final rule did not quantify a minimum and maximum monetized benefit estimate around the primary estimate of benefits. The final regulatory analysis, however, does present a range of benefits based on the analysis of the proposed rule. The estimates provided in these appendixes have not been scaled to the Final Rule’s stringency level, as the scaling methodology adds a new element of uncertainty that cannot be appropriately characterized. The full RIA is available on-line at http://www.epa.gov/nonroad-diesel/2004fr.htm#ria.
98

APPENDIX B: VALUATION ESTIMATES FOR REGULATORY CONSEQUENCES1
Agencies continue to take different approaches to monetizing benefits for rules that affect small risks of premature death. As a general matter, we continue to defer to the individual agencies’ judgment in this area. Except where noted, in cases where the agency both quantified and monetized fatality risks, we have made no adjustments to the agency’s estimate. In cases where the agency provided a quantified estimate of fatality risk, but did not monetize it, we have monetized these estimates in order to convert these effects into a common unit.
The following is a brief discussion of OMB’s valuation estimates for effects which agencies identified and quantified, but did not monetize. As a practical matter, the aggregate benefit and cost estimates are relatively insensitive to the values we have assigned for these rules because the aggregate benefit estimates are dominated by those rules where EPA provided quantified and monetized benefit and cost estimates.
Injury. For NHTSA rules, we adopted NHTSA’s approach of converting nonfatal injuries to “equivalent fatalities.” These ratios are based on NHTSA’s estimates of the value individuals place on reducing the risk of injury of varying severity relative to that of reducing risk of death.2 For OSHA rules, we monetized only lost workday injuries using a value of $50,000 per injury averted.
1. Change in Gasoline Fuel Consumption. We valued reduced gasoline consumption at
$0.80 per gallon pre-tax. This equates to retail (at-the-pump) prices in the $1.10 - $1.30 per gallon range.
2. Reduction in Barrels of Crude Oil Spilled. OMB valued each barrel prevented from being spilled at $2,000. This is double the sum of the most likely estimates of environmental damages plus cleanup costs contained in a published journal article3
3. Change in Emissions of Air Pollutants. Please see the following paragraphs for an explanation of these values. All values are in 2001 dollars.
Hydrocarbon: $600 to $2,700 per ton Nitrogen Oxide (stationary): $370 to $3,800 per ton Nitrogen Oxide (mobile): $1,100 to $11,600 per ton Sulfur Dioxide: $1,700 to $18,000 per ton Particulate Matter: $10,000 to $100,000 per ton
The estimates for reductions in hydrocarbon emissions were obtained from EPA’s RIA for the 1997 rule revising the primary National Ambient Air Quality Standards (NAAQS) for 1 The following discussion updates the monetization approach used in previous reports and draws on examples from this and previous years. 2 National Highway Traffic Safety Administration, The Economic Cost of Motor Vehicle Crashes, 1994, Table A-1. http://www.nhtsa.dot.gov/people/economic/ecomvc1994.html Note that the light truck average fuel economy rule NHTSA finalized in 2003 did present quantified and monetized costs and benefits, which we did not adjust. 3 Brown and Savage, “The Economics of Double-Hulled Tankers,” Maritime Policy and Management, Volume 23(2), 1996, pages 167-175.
99

2005 Report to Congress on the Costs and Benefits of Federal Regulations
ozone and fine particulate matter (PM).
EPA believes that there are a number of reasons to expect that reductions in NOx emissions from ground-level mobile sources achieve different air quality improvements relative to reductions from electric utilities and other stationary sources with “tall stacks”. In response, OMB has adopted different benefit transfer estimates for NOx reductions from stationary sources (e.g., electric utilities) and from mobile sources.4 For the central estimate of NOx emissions for mobile sources, we used estimates from the Tier II/Gasoline Sulfur rule RIA, while recognizing that the Tier II analysis was based on an air quality fate and transport model that had limited treatment of atmospheric chemistry.5 Based on the final Tier 2/Gasoline Sulfur RIA, EPA estimated that NOx reductions would yield benefits of $4900 (1999$) per ton. Analysis of recent EPA rules yield several estimates for the central estimate of NOx benefits per ton from stationary electric utility sources (See the Regulatory Impact Analyses for the “NOx SIP Call” and the Section 126 rules, available on the web at http://www.epa.gov/ttn/ecas/econguid.html. In addition, see Memo to NSR Docket from Bryan Hubbell, Senior Economist, Innovative Strategies and Economics Group, EPA). Based on these studies, the mortality-based benefits of NOx reductions from stationary sources (electric utilities) are estimated to be $1,300 (1999$) per ton.6 New results based on EPA's ongoing analyses supporting the suite of Clean Air Rules (including the Clean Air Interstate Rule, Clean Air Visibility Rule, and Clean Air Mercury Rule) may provide better estimates for future reports. NOx benefit estimates are difficult to transfer to other applications, however. The location of reductions, reductions in other PM precursors, air chemistry, meteorology, emission release heights, baseline conditions, etc. can have dramatic effects on the relationship between NOx emission reductions and ambient PM concentrations. Further, the understanding of the atmospheric chemistry characterizing PM formation, and photochemical air quality modeling are rapidly evolving.
EPA also developed central estimates for the benefits associated with reductions in SO2 from electric utilities. Based on an analysis outlined in a June 20, 2001 EPA memo to the file,
4 There are several key assumptions underlying the benefit estimates for reductions in NOx emissions, including:
1. Inhalation of fine particles is causally associated with premature death at concentrations near those experienced by most Americans on a daily basis. While no definitive studies have yet established any of several potential biological mechanisms for such effects, the weight of the available epidemiological evidence supports an assumption of causality. 2. All fine particles, regardless of their chemical composition, are equally potent in causing premature mortality. This is an important assumption, because fine particles formed from power plant SO2 and NOx emissions are chemically different from directly emitted fine particles from both mobile sources and other industrial facilities, but no clear scientific grounds exist for supporting differential effects estimates by particle type. 3. The concentration-response function for fine particles is approximately linear within the range of outdoor concentrations under policy consideration. Thus, the estimates include health benefits from reducing fine particles in both attainment and non-attainment regions. 4. The forecasts for future emissions and associated air quality modeling are valid. 5. The valuation of the estimated reduction in mortality risk is largely taken from studies of the tradeoff associated with the willingness to accept risk in the labor market.
5 Additional details on the Tier II benefits analysis are available in the Tier II/Sulfur Final Rulemaking RIA, available on the web at http://www.epa.gov/oms/fuels.htm.6 This memo reported that: "Based on previous EPA analyses, the average mortality-related benefits per ton of NOx reduced are around $1300 and the average benefits per ton of SO2 reduced are around $7300 for electricity-generating units."
100

Appendix B
“Benefits Associated with Electricity Generating Emissions Reductions Realized Under the NSR program,” we used $7,300 per ton. We also developed ranges around these central estimates of the per-ton value of benefits of emission reduction in nitrogen oxides and sulfur dioxide. EPA calculated ratios of the high and low benefits estimates to the central estimate for the four fairly recent rules for which there was sufficient information to do so. Those rules are Tier 2, Section 126/Ozone Transport, Heavy-Duty Diesel Engines, and Non-Road Diesel Engines. The mean ratio of the low benefit estimates to the corresponding central estimates for these four rules was .22. The mean ratio of the high benefit estimates to the mean was 2.27. This implies an average ratio of high to low benefit estimates of approximately 10 (2.27/.22). Therefore we applied this factor of 10 as an uncertainty range in our presentation of the benefits of several rules regulating mobile and stationary sources of emissions. These rule are: Deposit Control Gasoline, Federal Test Procedures, and Marine Engines (1996-1997); New Locomotives (1996-1997); Non-Road Diesel Engines II and Non-Handheld Engines (1998-1999); Hand-Held Engines Phase II (1999-2000); 2004 Heavy Duty Engines (2000-2001); Municipal Waste Combustors (1995-1996); Acid Rain NOx Phase II (1996-1997); Steam Generating Units (1998-1999); National Emission Standards for Hazardous Air Pollutants (NESHAP) for Stationary Reciprocating Internal Combustion Engines; and NESHAP for Plywood and Composite Wood Products.
As mentioned above, OMB only monetized benefits estimates for rules that were not
otherwise monetized by the agencies. Therefore, these per ton benefits estimates were only applied to EPA rules in which emission impacts were quantified but not monetized by EPA. We will continue to work with EPA on updating the range of benefits in order to more accurately represent the magnitude and the substantial range of uncertainty inherent in these estimates. In order to help address the uncertainty and difficulty inherent in the benefit transfer approach, we have asked EPA to provide us with the Agency’s estimates of the benefits per ton using the Agency’s air quality models and other tools for all air rules that were finalized without such an estimate. We hope to be able to use these estimates in future Reports to Congress, thereby reducing somewhat the uncertainty and providing a more consistent approach to benefits.
A. Adjustment for Differences in Time Frame across These Analyses Agency estimates of benefits and costs cover widely varying time periods. The differences in the time frames used for the various rules evaluated generally reflect the specific characteristics of individual rules, such as expected capital depreciation periods or time to full realization of benefits. In order to allow us to provide an aggregate estimate of benefits and costs, we developed benefit and cost time streams for each of the rules. Where agency analyses provide annual or annualized estimates of benefits and costs, we used these estimates in developing streams of benefits and costs over time. Where the agency estimate provided only annual benefits and costs for specific years, we used a linear interpolation to represent benefits and costs in the intervening years. B. Further Caveats
101
2005 Report to Congress on the Costs and Benefits of Federal Regulations
In order for comparisons or aggregation to be meaningful, benefit and cost estimates should correctly account for all substantial effects of regulatory actions, including potentially offsetting effects, which may or may not be reflected in the available data. OMB has not made any changes to agency monetized estimates. To the extent that agencies have adopted different monetized values for effects—for example, different values for a statistical life—these differences remain embedded in the tables. Any comparison or aggregation across rules should also consider a number of factors which our presentation does not address. For example, these analyses may adopt different baselines in terms of the regulations and controls already in place. In addition, the analyses for these rules may well treat uncertainty in different ways. In some cases, agencies may have developed alternative estimates reflecting upper- and lower-bound estimates. In other cases, the agencies may offer a midpoint estimate of benefits and costs. In still other cases the agency estimates may reflect only upper-bound estimates of the likely benefits and costs. While OMB has relied in many instances on agency practices in monetizing costs and benefits, citation of, or reliance on, agency data in this Report should not be taken as an OMB endorsement of all the varied methodologies used to derive benefits and cost estimates.
102

APPENDIX C: THE BENEFITS AND COSTS OF 1992-1994 MAJOR RULES
Tables C-1 and C-2 list the rules that were omitted from the 10-year running totals presented in Chapter 1 of our Reports to Congress. Table C-1 consists of the annualized, monetized costs and benefits of rules included in Chapter 1 of the 2004 Report as part of the 10-year totals of costs and benefits, but not included in Chapter 1 of the 2005 Report. Table C-2 consists of the annualized, monetized costs and benefits of rules included in Chapter 1 of the 2003 Report as part of the 10-year totals, but included in neither the 2004 nor the 2005 Report. Please note that since publication of the 2004 Report, we have updated the benefits per ton ranges based on a new analysis of the sources of uncertainty in EPA air regulations. This analysis is explained in more detail in Appendix B above. In order to be consistent with Chapter 1 impacts, for rules presented in Table C-1 where OMB monetized EPA estimates of the tons of pollutants avoided, we updated the impact estimates to reflect the new benefits per ton ranges.
We continue to believe that the 10-year window is the appropriate time period for which
to limit the Chapter 1 accounting statement, since we do not believe that the pre-regulation estimates of the costs and benefits of rules issued over ten years ago are very reliable or useful for informing current policy decisions. In order to provide transparency, however, we have included in this Appendix all rulemakings that have been omitted because of our decision to limit our accounting statement to 10 years.
103

2005 Report to Congress on the Costs and Benefits of Federal Regulations
Table C-1: Estimates of Annual Benefits and Costs of Nine Major Federal Rules, October 1, 1993 to September 30, 1994
(millions of 2001 dollars per year)
REGULATION AGENCY BENEFITS COSTS EXPLANATION Occupational Exposure to Asbestos
DOL-OSHA 92 448 We assumed a 20-year latency period between exposure and the onset of cancer or asbestosis and valued each death and each case of asbestosis at $5 million.
Controlled Substances and Alcohol Use and Testing
DOT – FHWA 1,539 114 No adjustments to agency estimates.
Prevention of Prohibited Drug Use in Transit Operations
DOT
107 37 We amortized the agency’s present value estimates over 10 years.
Phase II Land Disposal Restrictions
EPA 26 240-272 We valued each cancer case at $5 million.
Phase-out of Ozone-Depleting Chemicals and Listing of Methyl Bromide
EPA 1,260-3,993 1,681 We amortized the agency’s present value estimates over 16 years.
Reformulated Gasoline EPA 122-947 1,085-1,395 Estimates are for Phase II, which include Phase I benefits and costs. We used the benefit estimates that assume the enhanced I/M program is in place. We valued VOC reductions at $600-$2,700 per ton and NOx reductions at $1,100-$11,600 per ton. We valued each cancer case at $5 million. We assumed the phase II aggregate costs are an additional 25 percent of the Phase I costs based on EPA’s reported per-gallon cost estimates.
Acid Rain NOx Title IV CAAA
EPA 433-4,446 297 The costs and benefits of Acid Rain NOx regulations are divided between the Phase I and Phase II rulemakings. This is the Phase I rule. We valued NOx reductions at $370 - $3,800 per ton.
Hazardous Organic NESHAP
EPA 593-2,628 295-333 We valued VOC emissions at $600-$2700 per ton and NOx emissions (which are a cost in this instance) at $370 - $3,800 per ton. We did not value changes in CO emissions.
Non-Road Compression Ignition Engines
EPA 647 – 6,821 29-70 We annualized the NOx emissions which yielded an average annual emission reduction of 588,000 tons beginning in 2000. We valued NOx emissions at $1,000 - $11,600 per ton.
104

Appendix C
Table C-2: Estimates of Annual Benefits and Costs of Ten Major Federal Rules, October 1, 1992 to September 30, 1993
(millions of 2001 dollars per year)
REGULATION AGENCY BENEFITS COSTS EXPLANATION Nutrition Labeling of Meat and Poultry Products
USDA/FSIS 205
25-32 We amortized the agency’s present value estimates over 20 years.
Food Labeling (combined analysis of 23 individual rules)
HHS/FDA 438-2,637 159-249 We amortized the agency’s present value estimates over 20 years.
Real Estate Settlement Procedures
HUD 258-332 135 No adjustments to agency estimates.
Manufactured Housing Wind Standards
HUD 103 63 No adjustments to agency estimates.
Permit Required Confined Spaces
DOL/OSHA 540 250 We valued each fatality at $5 million and each lost-workday injury at $50,000. We did not value non-lost-workday injuries.
Vessel Response Plans DHS/USCG 9 295 We amortized the agency’s present value estimates over 30 years. We valued each barrel of oil not spilled at $2,000.
Acid Rain Permits Regulations
EPA 78,454-78,806 1,109-1,871 We valued SO2 reductions at $7,800 per ton.
Vehicle Inspection and Maintenance (I/M)
EPA 247-1,120 671 We used the estimates of cost and emission reductions of the new I/M program compared to the baseline of no I/M program. We valued VOC reductions at $600-$2,700 per ton. We did not assign a value to CO reductions.
Evaporative Emissions from Light-Duty Vehicles, Light-Duty Trucks, and Heavy-Duty Vehicles.
EPA 274-1,246 161-248 We assumed the VOC emission reductions began in 1995 and rise linearly until 2020, after which point they remain at the 2020 level. Annualizing this stream results in an average of 468,000 tons per year. We valued these tons at $600-$2,700 per ton.
Onboard Diagnostic Systems
EPA 702-3,423 226 We amortized the agency’s emission reduction and cost estimates over 15 years. We valued VOC reductions at $600-$2,700 per ton and NOx reductions at $1,100-$5,500 per ton.
105


APPENDIX D: REGULATORY REFORM IN THE BUSH ADMINISTRATION
The Bush Administration has taken steps to strengthen the analytic foundation of new Federal regulations through better regulatory impact analysis, improved information quality, and more systematic peer review. The Bush Administration has also devoted significant effort to the reform and improvement of existing regulations. Last year’s Report to Congress provided a progress report on 103 regulatory reforms initiated during the 2001-2004 period. These included reforms nominated by the public at OMB’s request in previous Draft Reports to Congress, as well as reforms initiated by agencies, reforms suggested in “prompt” letters sent by OIRA to agencies, and significant paperwork burden reductions achieved by Federal agencies.
The 2004 Report to Congress also described the public’s response to OMB’s most recent request for regulatory reform nominations. In 2004, OMB sought public suggestions for reducing unnecessary costs, increasing effectiveness, enhancing competitiveness, reducing uncertainty, and increasing flexibility through the reform of regulations, guidance documents, and paperwork requirements. In its request for nominations, we asked commenters to focus on those burdens that were particularly problematic for small and medium-sized manufacturers. On March 9, 2005, OMB issued a Report entitled “Regulatory Reform of the U.S. Manufacturing Sector,” which summarized agency responses to the 189 reform nominations we received from the public, and identified the 76 nominations that agencies and OMB determined had potential merit and justified further action.
This Appendix provides a status report on the Administration’s ongoing regulatory reform initiatives. Specifically, we are providing an update on selected regulatory reforms initiated from 2001 to 2004, which were described in Chapter III of the final 2004 Report to Congress. Our update on these reforms focuses on noteworthy regulations that agencies have acted on since the final 2004 Report. In most cases, this has involved concrete progress in achieving reform objectives. We are also reporting on the progress agencies are making on the 76 manufacturing reform initiatives. A. Update on Regulatory Reforms Initiated During the 2001-2004 Period
In the final 2004 Report to Congress, OMB divided the 103 regulatory reforms started
during the 2001-2004 period into two categories: 75 “regulatory reform accomplishments” and another 28 “promising regulatory-reform proposals.” In addition, OMB determined that another 12 topics should be considered by agencies as possible regulatory-reform proposals (i.e., “unfinished business”). Tables D-1 through D-3 below summarize and provide status reports for these regulatory reforms. Specifically, Table D-1 provides an update of the “accomplishments” from Table 9 of the 2004 Report, Table D-2 provides an update for the “promising” reforms from Table 10 of the 2004 Report, and Table D-3 provides an update for the “unfinished business” from Table 11 of the 2004 Report. Agency actions since the final 2004 Report are underlined in the "Summary/Status" column of these tables.
107

2005 Report to Congress on the Costs and Benefits of Federal Regulations
The status reports in the following tables are not intended to provide a comprehensive update on all of the reforms discussed in the final 2004 Report. Rather, we have selected a sample of agency actions to provide a sense of what agencies have accomplished in the roughly one year since our last Report to Congress. OMB will continue to scrutinize agency efforts to advance and complete all of their ongoing regulatory reforms, and will provide more complete assessments in future Reports to Congress.
Table D-1: 2005 Update on Regulatory Reform Accomplishments
Issue Area Agency/Rule Summary/Status Environment EPA: Reform of the
New Source Review Program: Routine Maintenance, Repair, and Replacement Activities
This October 2003 rule clarified what component replacement activities are “routine maintenance, repair, and replacement” and therefore exempt from NSR requirements. The rule exempts from cumbersome case-by-case review certain “identical” or “like-kind” component replacements costing less than 20% of the affected process unit. This will promote routine component replacements and facility upgrades. To help ensure that adverse environmental effects will not occur, the rule contains safeguards, including the cutoff for equipment replacements costing more than 20% of the affected process unit, a requirement that the basic design parameters of the unit cannot be changed, and a bar on exceeding applicable emissions limitations. In addition, the full panoply of Clean Air programs that are the primary means for achieving emissions reductions from existing sources will continue to protect and improve the nation’s air quality. In June 2005, EPA published its final response on the reconsideration of certain aspects of the 2003 rule and concluded that no additional changes to the equipment replacement provision are necessary.
Environment EPA: Effluent Guidelines for Concentrated Animal Feedlots
In December 2000, EPA published a proposed rule expanding the Clean Water Act permitting requirements for concentrated animal feeding operations (CAFOs) and strengthening the effluent guidelines for those facilities. The proposed rule would have affected 35,000 farms, including many smaller farms, and cost about $900 million annually. In February 2003, EPA published the final rule on CAFOs. The final rule focuses on 15,000 large farms that account for most of the pollution from this sector. For the first time, these large farms will be required to control runoff of manure from their fields. Smaller farms are generally addressed through a voluntary USDA program that provides grants and technical assistance to address runoff and other environmental concerns. However, they may be subject to regulatory controls in cases where their runoff is linked to specific water quality problems. EPA estimated the cost of the final rule at $360 million annually, of which about $300 million would fall on large CAFOs. Fresh water benefits from reduced runoff at large CAFOs were estimated in the range of $200 to $350 million annually. Additional non-monetized benefits include reduced runoff from small and medium CAFOs and reduced impacts on marine waters. EPA will be issuing a proposed rule responding to court remands of certain provisions of the CAFO rule.
108

Appendix D
Table D-1: 2005 Update on Regulatory Reform Accomplishments, Cont.
Issue Area Agency/Rule Summary/Status Financial Treasury/OCC: Fair
Credit Reporting Rules
Treasury issued two regulations addressing consumer protection provisions of the Fair and Accurate Transactions Act of 2003 (FACT Act). (1) On March 28, 2004, OCC issued a proposed rule that would implement provisions of the FACT Act restricting the circumstances in which consumer reporting agencies may furnish consumer reports containing medical information. The FACT Act prohibits creditors from obtaining or using medical information pertaining to a consumer in connection with any determination of eligibility for credit, and restricts the sharing of medical information and related lists or descriptions among affiliates. (2) On July 15, 2004, the OCC published for comment, a proposed regulation to implement the affiliate marketing provisions in section 214 of the FACT Act. The proposal generally prohibits an institution from using certain information about a consumer it receives from an affiliate to make a solicitation to them unless the consumer has been given the opportunity to opt out of the solicitation. An institution that has a pre-existing business relationship with the consumer would not be subject to this marketing limitation. On June 9, 2005, Treasury issued interim final rules on the FACT Act’s limitations on the sharing of medical information and on the use of medical information in determining eligibility for credit.Listeria monocytogenes is a pathogen that can cause listeriosis, an uncommon but potentially fatal disease in immunocompromised persons. Listeriosis is also a major concern in pregnant women because the illness can cause fetal death. Listeriosis outbreaks have been traced to both contaminated hot dogs and lunch meats. On June 6, 2003, USDA published an interim final rule, “Control of Listeria monocytogenes in Ready-to-Eat Meat and Poultry Products,” that requires establishments that produce ready-to-eat meat and poultry products to establish controls that prevent products from Listeria monocytogenes contamination. According to USDA, the rule imposed costs on firms of approximately $16.6 million per year, while the rule generated benefits, in the form of fewer cases of listeriosis, of approximately $44 million to $154 million per year. This rule was nominated as a manufacturing regulatory reform in 2004. See Table D-4 for further information.
Health and Safety
USDA: Reducing Listeria monocytogenes in Ready-to-Eat Meat and Poultry Products
Homeland Security
DHS: United States Visitor and Immigrant Status Indicator Technology (US VISIT) Program
DHS published two interim final rules for the US VISIT Program, an integrated, automated entry-exit system that records the arrival and departure of aliens; verifies aliens’ identities, and authenticates aliens’ travel documents through comparison biometrics. The first rule established US VISIT for arrivals at air and sea ports of entry and authorized a limited number of pilot exit programs. The second rule expanded US-VISIT to the 50 busiest land ports of entry and expanded coverage to include travelers from Visa Waiver Program countries. In a further expansion of US-VISIT, on August 4, 2005 DHS issued a notice announcing a limited test of passive radio frequency identification (RFID) technology to document automatically the exits and any subsequent re-entries of nonimmigrant travelers at five U.S. land border ports of entry.
109

2005 Report to Congress on the Costs and Benefits of Federal Regulations
Table D-1: 2005 Update on Regulatory Reform Accomplishments, Cont.
Issue Area Agency/Rule
Summary/Status Labor DOL: Birth and
Adoption Unemployment Compensation
The Department of Labor removed regulations allowing States to provide partial wage replacement through unemployment compensation, for parents taking approved leave to care for a newborn or newly adopted child. This rule, issued on October 9, 2003, will protect the availability of already scarce unemployment trust funds for the involuntarily unemployed by preventing their use by individuals on voluntary leave. On July 22, 2005, DOL proposed to codify its longstanding interpretation that the Social Security Act and the Federal Unemployment Tax Act limit a state’s payment of unemployment compensation to individuals who are able and available for work.
Social Services
Faith Based Initiative The Faith-Based & Community Initiative has been active in implementing the principles of the Executive Order 13279 through regulations. Faith-Based centers at eight agencies (Ed., HHS, HUD, DOJ, DOL, VA, USDA, and USAID) have promulgated fifteen final rules, including general rules that cover the funding delivered by seven agencies, three regulations implementing Charitable Choice statutes, a DOL regulation implementing the amendment of EO 11246, and three regulations changing discriminatory language in specific HUD, VA, and DOL programs. Additionally, a ninth agency (DOC) has published an interim final rule that changes specific discriminatory language in one of its Federal programs.
Transportation DOT/FMCSA: Modernized Hours of Service For Truck Drivers (HOS)
The new HOS rules allow truck drivers to drive 11 hours after 10 consecutive hours off-duty. Also, drivers may not drive beyond the 14th hour after coming on duty, following 10 hours off duty. The old HOS rules allowed 10 hours of driving within a 15-hour on-duty period, after 8 hours of off-duty time. Similar to existing rules, drivers may not drive after 60 hours on duty within a consecutive 7-day period or 70 hours on duty in a consecutive 8-day period. The new, science-based rule makes significant strides in providing commercial drivers a 24-hour work/rest schedule in line with the body’s circadian rhythm. The longer off-duty time allows drivers to have more regular schedules and increases the opportunity for quality sleep. This is consistent with fatigue- and sleep-related studies considered in development of the rule that indicate the amount and quality of sleep a person receives has a strong influence on alertness. This rule was nominated as a manufacturing regulatory reform in 2004. See Table D-4 for further information.
110
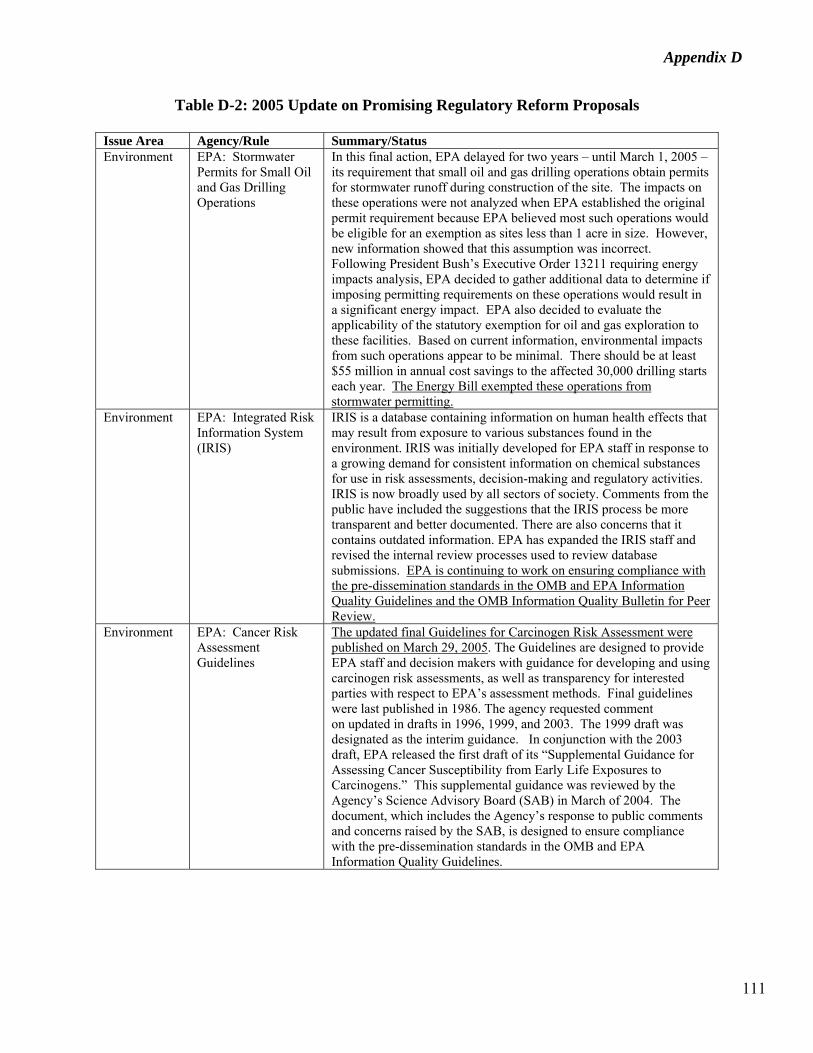
Appendix D
Table D-2: 2005 Update on Promising Regulatory Reform Proposals
Issue Area Agency/Rule Summary/Status Environment EPA: Stormwater
Permits for Small Oil and Gas Drilling Operations
In this final action, EPA delayed for two years – until March 1, 2005 – its requirement that small oil and gas drilling operations obtain permits for stormwater runoff during construction of the site. The impacts on these operations were not analyzed when EPA established the original permit requirement because EPA believed most such operations would be eligible for an exemption as sites less than 1 acre in size. However, new information showed that this assumption was incorrect. Following President Bush’s Executive Order 13211 requiring energy impacts analysis, EPA decided to gather additional data to determine if imposing permitting requirements on these operations would result in a significant energy impact. EPA also decided to evaluate the applicability of the statutory exemption for oil and gas exploration to these facilities. Based on current information, environmental impacts from such operations appear to be minimal. There should be at least $55 million in annual cost savings to the affected 30,000 drilling starts each year. The Energy Bill exempted these operations from stormwater permitting.
Environment EPA: Integrated Risk Information System (IRIS)
IRIS is a database containing information on human health effects that may result from exposure to various substances found in the environment. IRIS was initially developed for EPA staff in response to a growing demand for consistent information on chemical substances for use in risk assessments, decision-making and regulatory activities. IRIS is now broadly used by all sectors of society. Comments from the public have included the suggestions that the IRIS process be more transparent and better documented. There are also concerns that it contains outdated information. EPA has expanded the IRIS staff and revised the internal review processes used to review database submissions. EPA is continuing to work on ensuring compliance with the pre-dissemination standards in the OMB and EPA Information Quality Guidelines and the OMB Information Quality Bulletin for Peer Review.
Environment EPA: Cancer Risk Assessment Guidelines
The updated final Guidelines for Carcinogen Risk Assessment were published on March 29, 2005. The Guidelines are designed to provide EPA staff and decision makers with guidance for developing and using carcinogen risk assessments, as well as transparency for interested parties with respect to EPA’s assessment methods. Final guidelines were last published in 1986. The agency requested comment on updated in drafts in 1996, 1999, and 2003. The 1999 draft was designated as the interim guidance. In conjunction with the 2003 draft, EPA released the first draft of its “Supplemental Guidance for Assessing Cancer Susceptibility from Early Life Exposures to Carcinogens.” This supplemental guidance was reviewed by the Agency’s Science Advisory Board (SAB) in March of 2004. The document, which includes the Agency’s response to public comments and concerns raised by the SAB, is designed to ensure compliance with the pre-dissemination standards in the OMB and EPA Information Quality Guidelines.
111

2005 Report to Congress on the Costs and Benefits of Federal Regulations
Table D-2: 2005 Update on Promising Regulatory Reform Proposals, Cont.
Issue Area Agency/Rule Summary/Status Environment EPA: Utility
Mercury Reductions Rule
On May 18, 2005, EPA issued a final rule to cut substantially mercury emissions from coal-fired power plants. The rule would permanently cap emissions from coal-fired power plants and provide companies with flexibility to achieve early reductions of mercury using a cap-and-trade program. This is the first time EPA has proposed to regulate mercury from coal-fired power plants; when it is fully implemented, the rule will cut mercury emissions by nearly 70 percent.
Environment EPA: Metals Assessment Framework
In response to widespread concerns from stakeholders, EPA has been working for the past three years on a new framework for assessing the environmental hazards of metals. This effort reflects a growing consensus within the scientific community that the “persistent, bioaccumulative toxic” (PBT) approach has limited usefulness for inorganic metals for several reasons, including 1) bioaccumulation appears to be inversely related to ambient concentration in many cases, 2) the PBT framework does not adequately account for fate and transport, 3) trace amounts of metals are essential for many organisms, and 4) because elemental metals are naturally occurring, many organisms have developed mechanisms for sequestering them (e.g. in bone) that may not correlate well with hazard. EPA is about to launch a Science Advisory Board (SAB) review of the current draft of the framework, which will ultimately serve as the basis for hazard assessment for metals across EPA program areas. The SAB began its review in February 2005.
Environment EPA: Beach Act Pathogen Standards
In July of 2004, EPA issued a proposed regulation to improve standards for water quality monitoring at our nation’s beaches. The new rule will ensure that more protective, health-based standards for infections pathogens are in place in all coastal recreational waters nationwide, including both coastal and Great Lakes beaches. This will support improved beach monitoring programs, tougher permitting to prevent wet weather sewage overflows, and reduced transmission of waterborne diseases. EPA issued a final rule in November 2004.
Environment EPA: Definition of Solid Waste
EPA published a proposed rule on October 28, 2003, that would revise the definition of “solid waste” under the Resource Conservation and Recovery Act (RCRA). This rule would expand the universe of industrial wastes, including various spent solvents, sludge and other wastes that would be eligible for the recycling exemption under RCRA. Successfully expanding recycling of industrial wastes would be environmentally beneficial and yield large cost savings by reducing disposal costs. EPA also proposed an option that would allow a wider use of recycling. EPA estimated its primary option could save about $200-$300 million annually compared with current regulations. EPA is currently working to publish a final rule by November 2006.
112

Appendix D
Table D-2: 2005 Update on Promising Regulatory Reform Proposals, Cont.
Issue Area Agency/Rule
Summary/Status Environment EPA: Best Available
Retrofit Technology The Clean Air Act addresses visibility in national parks and wilderness areas, in part, by requiring best available retrofit technology (BART) on certain major sources emitting pollutants that impair visibility. In 2001, EPA proposed BART guidelines to assist states in identifying BART-eligible sources, determining which sources may be anticipated to contribute to visibility impairment, and conducting a technical analysis of possible controls. EPA’s 1999 regional haze rule allows States the option of implementing an emissions trading program or other alternative measure instead of requiring BART. In 2004, in response to a court ruling, EPA re-proposed its BART guidelines to provide States with greater flexibility in determining which sources may be anticipated to impair visibility, and to require states to consider visibility improvement when making a BART determination. On July 6, 2005, EPA issued a final rule establishing guidelines to be used by the States in implementing the Best Available Retrofit requirements of the Clean Air Act. EPA also stated in the rule that the final Clean Air Interstate Rule (CAIR) will satisfy the BART requirements for affected electrical generating units (EGUs). EPA believes that such an approach will increase net benefits over source-specific BART.
Environment EPA: Disinfection Byproducts Rule and Long Term Surface Water Treatment Rule
These rules, proposed on August 18, 2003, will reduce exposure to potentially harmful disinfection byproducts (DBPs) in drinking water, while at the same time maintaining and enhancing protection against pathogens, particularly cryptosporidium. Under the new rules, drinking water systems will be required to monitor for cryptosporidium in their source water, and depending on results, increase their removal rate by up to 300 fold. They will also have to ensure that customers in all parts of the distribution system receive water that meets standards for DBPs, rather than only ensuring that water meets the standards on average, as is currently the case. This is important because harmful DBPs can form disproportionately in parts of the distribution system, after water leaves the treatment plant. The rules reflect consensus recommendations of a broad range of drinking water stakeholders including environmental groups, consumer advocates, drinking water utilities, and State and local governments. EPA plans to issue a final rule in late 2005.
Environment EPA: Interstate Clean Air Rule: Reducing Pollution from Coal-Fired Powerplants
On May 12, 2005, EPA issued a final rule requiring the largest air pollution reductions since the passage of the Clean Air Act Amendments of 1990. The rule would establish a cap-and-trade system to cut power plant emissions of SO2 by 70% and NOx by 65% in 30 states (mostly located East of the Mississippi River.) The rule will reduce the interstate transport of pollutants that contribute to unhealthy levels of particulate matter and ozone. EPA estimates that the final CAIR rule will yield benefits of $80 billion per year – with reductions of 13,000 premature deaths, 18,000 non fatal heart attacks – and impose costs on the electric utility sector of $2.5 to $4 billion per year.
113

2005 Report to Congress on the Costs and Benefits of Federal Regulations
Table D-2: 2005 Update on Promising Regulatory Reform Proposals, Cont.
Issue Area Agency/Rule
Summary/Status Environment EPA: Paperwork
Burden Reduction in the Toxic Release Inventory Program
EPA has undertaken several initiatives to streamline and strengthen the TRI reporting program. These include an enhanced version of its award winning TRI Made Easy (TRI-ME) software; a white paper soliciting comment on various burden reduction approaches, including enhanced use of Form A, higher reporting thresholds for some classes of chemicals and facilities, and “no significant change” certification in lieu of comprehensive annual reporting; and revisions to its instruction, guidance and Q&A documents. EPA published a final TRI Forms Modification rule in July 2005. This was Phase 1 of EPA’s Burden Reduction Initiative.
Environment DOE: Greenhouse Gas Guidelines
As part of the Administration’s effort to encourage proactive, voluntary reductions of greenhouse gas emissions, DOE’s Guidelines for Voluntary Greenhouse Gas Reporting will strengthen the process for entities to assess, calculate and report greenhouse gas reductions to DOE. DOE will then process and disseminate the data in a publicly available database. An interim final rule, published on March 24, 2005, increases the requirements that the voluntary participants must meet with respect to data quality, and thereby strengthens the credibility of the emission reduction claims.
Health and Safety
USDA: Animal Identification
Currently the U.S. does not have a comprehensive system that can quickly and effectively identify individual animals or groups; the premises where they are located; and the date of entry to that premise. Such information enhances disease preparedness by allowing the U.S. to identify and locate any animals exposed to disease and will facilitate stopping the spread of that disease. On Dec. 30, 2003 the USDA announced that they would expedite the implementation of a national animal identification system for all species after the discovery of a BSE positive cow in Washington State. On April 27, 2004, USDA announced the framework for implementation and initiated phase I of their plan for a National Animal Identification System (NAIS). In July 2004, USDA and FDA published a joint ANPRM seeking further comment on the implementation of a national animal ID system. Implementation of the system is prioritized to address cattle first, then moving to other types of livestock. While much has been done, more remains. In May 2005, USDA published the NAIS strategic plan and draft program standards.
Health and Safety
HHS and USDA: Update of the Dietary Guidelines for Americans and the Food Guide Pyramid
Dietary Guidelines for Americans provide science-based advice to promote health and to reduce risk for major chronic diseases through diet and physical activity. By law, the Secretaries of the Department of Health and Human Services (HHS) and the Department of Agriculture (USDA) issue a report at least every 5 years that “shall contain nutritional and dietary information and guidelines for the general public.” On May 23, 2003, OMB sent a prompt letter to HHS and USDA concerning trans fat. The 2005 Dietary Guidelines report issued on January 12, 2005 includes recommendations on reducing consumption of foods high in trans fatty acids.
114

Appendix D
Table D-2: 2005 Update on Promising Regulatory Reform Proposals, Cont.
Issue Area Agency/Rule
Summary/Status Labor DOL/Vets:
Uniformed Services Employment Reemployment Rights Act (USERRA)
This rule would set forth regulations for the USERRA program, in operation since 1994 through technical assistance and operating guidance. Under USERRA, eligible service members who leave their civilian jobs for military service are entitled to return to their jobs with the seniority, status, and rate of pay they would have attained had they not been on duty. USERRA also assures they will not suffer discrimination in employment because of military service or obligations. This is a rule that should ease the transition home for service members currently in the field. It should be received neutrally by employers, who should already be aware of its obligations and have been seeking clarification to the current implementation framework. DOL published a proposed rule on September 20, 2004 and expects to issue a final rule in December 2005.
Land Management
USDA: Roadless Rule
On May 13, 2005, USDA issued a rule governing the management of inventoried roadless areas in the National Forest Service lands in the lower 48 states. This rule will replace the 2001 Roadless rule which prohibited, with certain exemptions, all road construction and reconstruction in National Forests. The new rule allows state governors to petition USDA to issue state-specific rules addressing roadless area management. This rule responds to criticism that USDA failed to consider states’ concerns when it promulgated the 2001 rule – in particular, the difficulty of tailoring a national rule to address unique local conditions.
Land Management
USDA/NFS: Forest Planning
Commenter recommended the 2000 Forest Planning rule be revised to avoid polarizing the public and wasting agency resources. The Forest Service issued a new planning rule in January 2005. The new rule focuses on adaptive management and monitoring and will streamline the planning process to result in more timely agency actions.
Transportation DOT/NHTSA: Reform of Corporate Average Fuel Economy (CAFE) Standards
The Administration earlier had asked Congress to provide broader authority to reform and improve the CAFE program. In the absence of Congressional action, NHTSA has focused its efforts on reforms that can be achieved with existing authority and has used as guidance the recommendations of a National Academy of Science report. NHTSA published in December 2003 an ANPRM seeking comment on possible ways to improve the CAFE program. For model years 2008 and beyond, NHTSA is considering reforms of the program that will facilitate even greater fuel savings, without risk to passenger safety or jobs in vehicle manufacturing. The ANPRM discussed several options for restructuring the program for light trucks (i.e., SUVs, vans, and pickup trucks). On August 23, 2005, DOT issued a proposed rule to reform the CAFE program by making the fuel economy requirement applicable to a particular light truck dependent on its size, as measured by its footprint (i.e., the area bounded by the four wheels). This proposal would require manufacturers to meet manufacturer-specific standards that will depend on the particular mix of light trucks that they sell. NHTSA estimates that its proposal will save 10 billion gallons of gasoline in future years.
115

2005 Report to Congress on the Costs and Benefits of Federal Regulations
Table D-3: 2005 Update on Unfinished Business: Additional Regulatory Reforms
Issue Area Agency/Rule Summary/Status Environment EPA: New Source
Review (NSR) New Source Review (NSR) is a Clean Air Act program that requires major stationary sources to install state-of-the art air pollution controls whenever an owner or operator of such a source undertakes a major modification that would result in a significant increase in one or more of the criteria pollutants. Commenters argued that the regulations are too vague and complex, making it difficult to determine when a facility triggers the NSR permitting process. EPA has already published two rules to address some of the problems with the NSR program, including the final Equipment Replacement rule (see descriptions above in Table D-1). EPA is continuing to work on changes to the NSR program to simplify and clarify the requirements of the program. In October 2005, EPA announced publication of a proposed rule that would establish a uniform nationwide emissions test for existing powerplants based on the test currently used under the Clean Air Act’s New Source Performance Standards. In addition, EPA is working on a proposal to address questions concerning the treatment of “de-bottlenecking” projects and the procedures for “aggregation” of multiple projects.
Environment EPA: Drinking Water Affordability
Under the Safe Drinking Water Act, EPA may authorize States to grant variances to small drinking water systems for specific regulatory requirements, but only if EPA first determines based on a national level analysis, that the requirements are not affordable for small systems, and that granting the variances will not endanger public health. EPA’s current threshold for determining that a standard is not affordable is that the average incremental cost of achieving the standard at small systems should not exceed $500 per household per year. This is based on specific assumptions about income, baseline water bills, and compliance costs that may be valid on a national average basis, but do not reflect the situation of economically disadvantaged systems. As a result, no drinking water standard has ever been identified by EPA as “unaffordable” at a national level, and small systems variances have never been authorized, even though several recently promulgated standards have imposed very high per household costs on some small systems. EPA should revise its affordability approach to allow States an opportunity to judge the economic circumstances of individual systems and grant variances where compliance with standards is not affordable. EPA expects to issue for public comment draft revised affordability criteria that addresses these concerns by December 2005.
Health and Safety
NHTSA – High-Speed Frontal Offset Crash Test
In response to a 2001 prompt letter from OMB, the National Highway Traffic Safety Administration has established offset frontal crash protection as one of its highest rulemaking priorities. Such a rule has substantial potential for cost-effective improvements in highway safety. About 3,000 people are killed and 400,000 injured annually in these types of crashes. In February, 2004, NHTSA published a request for comments on this issue. Information that NHTSA obtained from public comments and further testing convinced the agency that (1) test data were too limited to estimate safety benefits and (2) vehicle design changes to improve occupant safety would increase vehicle weight and “stiffness,” which would increase risks to occupants of struck vehicles. NHTSA therefore decided to terminate this rulemaking. NHTSA will continue to study this issue and seek to address these risks as part of its effort to improve compatibility between small and large vehicles.
116
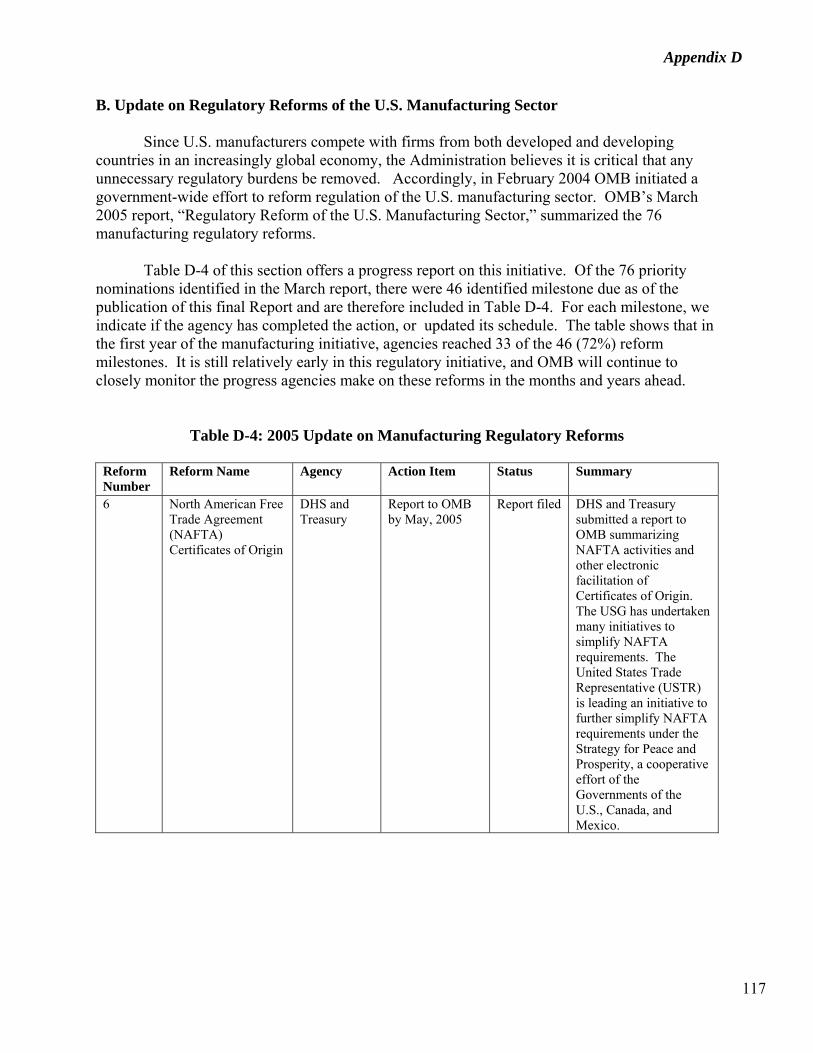
Appendix D
B. Update on Regulatory Reforms of the U.S. Manufacturing Sector
Since U.S. manufacturers compete with firms from both developed and developing countries in an increasingly global economy, the Administration believes it is critical that any unnecessary regulatory burdens be removed. Accordingly, in February 2004 OMB initiated a government-wide effort to reform regulation of the U.S. manufacturing sector. OMB’s March 2005 report, “Regulatory Reform of the U.S. Manufacturing Sector,” summarized the 76 manufacturing regulatory reforms.
Table D-4 of this section offers a progress report on this initiative. Of the 76 priority nominations identified in the March report, there were 46 identified milestone due as of the publication of this final Report and are therefore included in Table D-4. For each milestone, we indicate if the agency has completed the action, or updated its schedule. The table shows that in the first year of the manufacturing initiative, agencies reached 33 of the 46 (72%) reform milestones. It is still relatively early in this regulatory initiative, and OMB will continue to closely monitor the progress agencies make on these reforms in the months and years ahead.
Table D-4: 2005 Update on Manufacturing Regulatory Reforms
Reform Number
Reform Name Agency Action Item Status Summary
6 North American Free Trade Agreement (NAFTA) Certificates of Origin
DHS and Treasury
Report to OMB by May, 2005
Report filed DHS and Treasury submitted a report to OMB summarizing NAFTA activities and other electronic facilitation of Certificates of Origin. The USG has undertaken many initiatives to simplify NAFTA requirements. The United States Trade Representative (USTR) is leading an initiative to further simplify NAFTA requirements under the Strategy for Peace and Prosperity, a cooperative effort of the Governments of the U.S., Canada, and Mexico.
117

2005 Report to Congress on the Costs and Benefits of Federal Regulations
Table D-4: 2005 Update on Manufacturing Regulatory Reforms, Cont.
Reform Number
Reform Name Agency Action Item Status Summary
7 Maritime Security DHS COAST GUARD
Report to OMB by May, 2005
Report Filed
DHS/CG submitted a report to OMB on this issue in May, 2005.
12 Motor Vehicle Brakes
DOT FMCSA
Proposed Rule by September, 2005
Updated Schedule
DOT now expects this proposed rule to be published by November, 2005. This slight delay should not affect the timeline for publication of the final rule, which is scheduled for publication in September 2006.
14 Hours of Service DOT FMCSA
Final Rule by August, 2005
Done FMCSA issued a final rule on August 19, 2005 in response to a court decision that overturned the new HOS rules issued in 2003. The 2005 final rule implemented a less stringent regulatory regime for vehicles between 10,000 and 26,000 pounds. This provision leads to savings of approximately $280 million per year, relative to the 2003 rule, in the short-haul trucking sector.
22 Vehicle Compatibility Standard
DOT NHTSA
Report to OMB by June, 2005
Report Filed
Report submitted to OMB in June 2005. The report summarized current research and next steps.
26 EEO-1 EEOC Final Notice by June, 2005
Updated Schedule
OMB review of the final guidance was not finished as of the publication of this report. .
118

Appendix D
Table D-4: 2005 Update on Manufacturing Regulatory Reforms, Cont.
Reform Number
Reform Name Agency Action Item Status
Summary
28 Document AP-42: "Coke Production" Emission Factors (EF)
EPA Model software by June, 2005
Done August 4 update: EPA stated that this project is a comprehensive reform not limited to emission factors for coke production facilities. For example, it includes the consideration of the comments on reform 30 below.
Revise EF development process by September, 2005
Updated Schedule
New deadline of December, 2005
Report on EF uncertainty assessment by September, 2005
Updated Schedule
This report is now expected in October, 2005.
30 Document AP-42: Science and Site-Specific Conditions
EPA Model software by June, 2005
Done Please see the update on reform 28, above.
Revise EF development process by September, 2005
Updated Schedule
This report is now expected in October, 2005.
Report on EF uncertainty assessment by September, 2005
Updated Schedule
This report is now expected in October, 2005.
33 Clean Up Standards for PCBs
EPA Report to OMB by September, 2005
Report Filed
Report submitted to OMB in September, 2005.
34 Common Company Identification Number in EPA Databases
EPA Ensure Underground Injections and Institutional Controls database utilizes the Facility Registration System identification number by September, 2005
Done
35 ECHO Website EPA Improve text explanations by June, 2005
Done
119

2005 Report to Congress on the Costs and Benefits of Federal Regulations
Table D-4: 2005 Update on Manufacturing Regulatory Reforms, Cont.
Reform Number
Reform Name Agency Action Item Status
Summary
36 Electronic Formats for Agency Forms
EPA Identify what existing regulatory form formats are currently available by June, 2005
Done
43 Lead Reporting Burdens Under the Toxic Release Inventory
EPA Report to OMB on the status of applying the metals framework to lead and lead compounds by September, 2005
Updated Schedule
SAB has delayed submitting a final report to EPA on this review.
45 PCB Remediation Wastes
EPA Internal Review and Stakeholder Consultations by May, 2005
Done EPA completed its internal review in April, 2005.
Report to OMB by September, 2005
Report Filed
EPA submitted a report to OMB in September, 2005.
47 Pretreatment Streamlining Rule
EPA Final Rule by June, 2005
Done EPA Administrator signed September 27, 2005.
52 Reporting and Paperwork Burden in the Toxic Release Inventory
EPA Final Rule (forms modification) by June, 2005
Done EPA published the final rule on July 12, 2005.
Proposed Rule (burden reduction) by August, 2005
Done EPA published the proposed rule on October 4, 2005.
120

Appendix D
Table D-4: 2005 Update on Manufacturing Regulatory Reforms, Cont.
Reform Number
Reform Name Agency Action Item Status
Summary
54-58 Spill Prevention Control and Countermeasures (SPCC) Rule
EPA Implementation Guidance to Inspectors by July, 2005
Updated Schedule
Guidance documents submitted for OMB review; however, review of the guidance was not finished as of the publication of this report. Publication of the guidance documents expected in November 2005.
Proposed Rule (related to NODA) by August, 2005
Updated Schedule
Proposed rule submitted for OMB review on August 4, 2005. Publication of the proposed rule expected in November 2005. This delay should not affect the remaining schedule for this nomination (final rule in February 2006, more comprehensive proposed rule in June 2006).
59 Water Permit Rules (mass-based standards, direct dischargers)
EPA Review as part of biennial plan by August, 2005
Done EPA published the 304(m) Preliminary 2006 Effluent Guidelines Program Plan on August 29, 2005. The plan discusses possible rulemaking on this issue.
61 Annual Reporting of Pesticide Information
EPA Post revised policy on website by March, 2005
Done
90 Prohibit Use of Mercury in Automobile Manufacturing
EPA Conduct Preliminary Analysis by June, 2005
Done
Discuss Regulatory options with stakeholders by September, 2005
Done EPA is currently discussing this reform with the automobile and the iron and steel industries.
97 Reportable Quantity (RQ) Threshold for Nitrogen Oxide and Dioxide at Combustion Sources
EPA Proposed Rule by September, 2005
Done EPA published this proposed rule on October 4, 2005
121

2005 Report to Congress on the Costs and Benefits of Federal Regulations
Table D-4: 2005 Update on Manufacturing Regulatory Reforms, Cont.
Reform Number
Reform Name Agency Action Item Status
Summary
101 Sulfur and Nitrogen Monitoring at Stationary Gas-Fired Turbines
EPA Report to OMB on the status of discussions with Commenter to determine whether rule promulgated April 2004 addresses commenter's concerns by May, 2005
Done EPA consulted National Association of Manufacturers (NAM). NAM has reviewed 2004 final rule and concluded that it does address their concerns.
108 Deferral of Duplicative Federal Permitting
EPA Proposed Rule by March, 2005
Done
Final Rule by August, 2005
Updated Schedule
The final rule is now expected by November, 2005.
110 SARA Title 312, 313 Programs
EPA Final Rule (TRI forms modification) by June, 2005
Done This reform was incorporated into final forms modification rule (reform 52), which was published on July 12, 2005
Proposed Rule (TRI burden reduction) by August, 2005
Done OMB concluded review on this proposed rule on September 19, 2005.
112 Vapor Recovery at Gasoline Stations
EPA Report to OMB on cost-effectiveness by September, 2005
Done EPA submitted a report to OMB in September, 2005.
116 Publicly Owned Treatment Work (POTW) removal credits
EPA Internal Issue Paper by March, 2005
Done The paper addresses two issues: which pollutants are eligible for removal credits and how rigorously must a POTW demonstrate "consistent removal" of a pollutant before it can grant dischargers a less stringent standard based on those removals.
122

Appendix D
Table D-4: 2005 Update on Manufacturing Regulatory Reforms, Cont.
Reform Number
Reform Name Agency Action Item Status
Summary
117 Categorical Wastewater Sampling and Testing
EPA Final Rule by June, 2005
Done Part of Pretreatment Streamlining final rule. EPA Administrator signed the final rule on September 27, 2005
118 Definition of Volatile Organic Compound
EPA ANPRM by May, 2005
Updated Schedule
EPA released its interim guidance on September 13, 2005.
121 Do Not Fax Rule FCC Resolution of petition for reconsideration of rulemaking pending by July 2005,(effective date for the final rule)
Done The Commission has stayed the effective date of its rules requiring faxers to receive written permission from the recipients until Jan. 9, 2006. The Junk Fax Prevention Act of 2005 was signed by the President on July 9, 2005. The Act directs the Commission to issue regulations to implement the amendments made by the legislation within 270 days of enactment of the Act. FCC is currently in the process of drafting a Notice of Proposed Rulemaking to comply with this directive.
123

2005 Report to Congress on the Costs and Benefits of Federal Regulations
Table D-4: 2005 Update on Manufacturing Regulatory Reforms, Cont.
Reform Number
Reform Name Agency Action Item Status
Summary
122 Broadband FCC Resolution of rule following Supreme Court decision (July, 2005)
Done In July 2005, Supreme Court upheld the Commission’s ruling that broadband cable internet service is an “information service,” not a “telecommunications service,” and therefore is exempt from mandatory common carrier regulation under Title II of the Communications Act. On August 5, 2005, the Commission determined that Wireline broadband Internet access services (e.g., DSL) are "information services" with a functionally integrated telecommunications component, thus, these components are not required to be provided on a common carrier basis under Title II of the Communications Act.
134-137, 139, 141-144
Reform of the Family and Medical Leave Act
DOL ESA Proposed Rule in 2005
Updated Schedule
DOL is continuing its systematic study, including review of court decisions, on regulations issued under the authority of the Family Medical and Leave Act. DOL will finish analyzing this information and report to OMB on its plans in January 2007
145 Permanent Labor Certification
DOL Final Rule Done This goal was integrated into the Permanent Labor Certification final rule: published on December 27, 2004 and effective on March 28, 2005.
151 Annual Training Requirements for Separate Standards
DOL OSHA Report to OMB by May, 2005
Done Report sent to OMB in May, 2005.
124

Appendix D
Table D-4: 2005 Update on Manufacturing Regulatory Reforms, Cont.
Reform Number
Reform Name Agency Action Item Status
Summary
152 Coke Oven Emissions
DOL OSHA Final Rule Done Standards Improvement Project Phase II final rule, published on Jan 6, 2005, streamlined the Coke Oven Emissions standard. OSHA is considering a phase III rulemaking to further update many of their standards.
160 Guardrails Around Stacks of Steel
DOL OSHA Report to OMB by May, 2005
Done Report sent to OMB in May, 2005.
169 Walking and Working Surfaces
DOL OSHA Report to OMB by May, 2005
Done Report sent to OMB in May, 2005.
188 Ready to Eat Meat Establishments to Control for Listeria
USDA/FSIS Final Rule by June, 2005
Updated Schedule
USDA submitted a report to OMB updating milestones related to finalization of this rulemaking and other activities to streamline implementation. Final rule now expected in early 2006.
125


APPENDIX E: FY04 INFORMATION QUALITY REPORTS
This appendix contains the FY04 Information Quality Reports received from the two departments and agencies that received Information Quality correction requests and appeals and do not have fully transparent Information Quality web pages (DOI/MMS, and Treasury). Except for formatting changes, the FY04 reports have not been modified by OMB. Each report reflects the interpretations, experiences, and actions of the agency which submitted the report.
127

2005 Report to Congress on the Costs and Benefits of Federal Regulations
A. Department of Interior: Minerals Management Service Part 1: Requests for Correction Received FY 2004
Agency Name Number of Requests
Received Number Designated as Influential
Minerals Management Service
1 1
Total 1 1
[MMS Response issued October 5, 2004] Web page location of agency information quality correspondence: www.mms.gov/qualityinfo
Part 2: FY 2003 Requests Completed in FY 2004
Agency Name Number of requests received in FY03 which were responded to in FY04 or are still incomplete.
Number of appeals received in FY03 which were responded to in FY04 or are still incomplete
Total 0 0 Part 3: Summary of Requests Agency Receiving Correction Request: Department of the Interior, Minerals Management Service (“MMS”)
Requestor: Mr. Jim Tozzi Member, Board of Advisors Center for Regulatory Effectiveness (“CRE”) Type of Organization: Public Interest Group
Date Received: August 9, 2004, received electronically Summary of Request: The request concerned offshore oil and gas exploration activities in the Gulf of Mexico (“GOM”). MMS is currently petitioning the National Oceanic and Atmospheric Administration Fisheries to develop regulations that will specify how seismic operations must be conducted in the GOM. CRE requested that MMS defer dissemination of a non-extant “draft incidental take authorization” until the release of two studies currently underway on potential effects to marine mammals from seismic surveying. Description of Requested Correction: CRE contended that “pre-dissemination review requirements” (under the Information Quality Act) could not be satisfied until completion of two ongoing studies concerning acoustic criteria and the effects of seismic
128

Appendix E
activities on sperm whales. Specifically CRE requested that MMS defer disseminating a document CRE referred to as a “Draft ITA.” Influential: ____Yes __X__ No ____ Undetermined First Agency Response: ____ in progress __X__ completed [MMS Response, October 5, 2004] Resolution: MMS found no corrective action was warranted. There was no “Draft ITA” document. MMS is fully complying with the Information Quality Act and its own Information Quality Guidelines. Furthermore, the Act, and MMS guidelines, do “not provide a means for delaying or halting MMS’s efforts to support industry’s efforts to obtain ‘take’ authorization incidental to seismic activities in the Gulf pending the release of research related to this subject.” Judicial Review: __X__ none ____ yes ______ in progress Appeal Request: __X__ none ____ in progress ____ completed Summary of Request for Reconsideration: N/A Type of Appeal Process Used: N/A Appeal Resolution: N/A
129

2005 Report to Congress on the Costs and Benefits of Federal Regulations
B. Department of the Treasury Part 1: Requests for Correction Received FY 2004
Agency Name Number of Requests Received
Number Designated as Influential
IRS www.irs.gov/irs/article/0,,id=131585,00.html 0 0 Public Debt
www.publicdebt.treas.gov/bpd/bpdinfoquality.htm
0 0
OTS www.ots.treas.gov/docs/4/48914.html 0 0 OCC www.occ.treas.gov/customer.htm 0 0 U. S. Mint (no web address at this time) 3 0 BEP www.moneyfactory.com/section.cfm/2/431/5
152 0
TTB www.ttb.gov/contactus.htm 1 0 OIG www.oig.treas.gov 0 0 FMS www.fms.treas.gov/foia/section515.html 0 0 FinCEN www.fincen.gov/515procedures2.pdf 0 0 TIGTA www.treas.gov/tigta/important_foia_iqg.html 0 0 DO www.treas.gov/offices/cio/information-
management/infoqual.shtml0 0
Total 6 0 Part 2: FY 2003 Requests Completed in FY 2004
Agency Name Number of requests received in FY03 which were responded to in FY04 or are still incomplete.
Number of appeals received in FY03 which were responded to in FY04 or are still incomplete
Total 0 0
Three of the Department’s bureaus and offices the U. S. Mint, TTB and BEP, had a total of six requests for corrections; however, none of the six was deemed influential. With regard to the posting of requests for correction from FY 2004, as required by the OMB memorandum to the President’s Management Council, the Bureau of the Public Debt was the only organization within Treasury which had requests for correction which will be posted on their website. This posting will be for requests received in FY 2003 and will be done at the completion of the current reporting cycle.
In addition, each of the URLs provided by the bureaus and office was checked to validate the content of the addresses provided to the Department. Only six out of twelve bureaus and offices had pages or links to pages for Information Quality Procedures. Those which had posted procedures had extraordinary detail and were very thorough, while those which had no identifiable information quality content generally had no content concerning information quality.
130

Appendix E
Upon completion of this reporting cycle, we will begin to develop standardized
procedures for handling and processing requests for correction and posting influential requests on our web sites. Part 3. Summary of Requests Agency Receiving Correction Request: United States Mint
Requestor: Eric Buchanan, private citizen Date Received: E-mail to webmaster account on 07/28/04 Summary of Request: Error in a calculation on The United States Mint's H.I.P. Pocket Change website. Description of Requested Correction: "You have a web page that claims that there are 294 ways to make change for a dollar ("Can you make change for a dollar?" <http://www.usmint.gov/kids/index.cfm?FileContents=/kids/teachers/LessonView.cfm&LessonPlanId=39>). There are 293 combinations to make change for a dollar. Combination 16 and 31 are identical giving you one extra combination. Influential: ____Yes __X__ No ____ Undetermined First Agency Response: ____ in progress __X__ completed 07/28/04 Resolution: Changed the text on the website to read "293." Judicial Review: _X___none ____yes ______ in progress Appeal Request: __X__ none ____ in progress ____ completed Summary of Request for Reconsideration: n.a. Type of Appeal Process Used: n.a. Appeal Resolution: n.a.
Agency Receiving Correction Request: United States Mint
Requestor: Steve Kelem, private citizen Date Received: E-mail to webmaster account on 07/07/04 Summary of Request: Spelling error Description of Requested Correction: "Your web page, http://www.usmint.gov/index.cfm?flash=no contains a misspelling: Inspector Colector checks out a rare bird. "Collector" should have two "l"s." Influential: ____Yes __X__ No ____ Undetermined First Agency Response: ____ in progress __X__ completed 07/07/04 Resolution: Changed the spelling to "Collector." Judicial Review: _X___none ____yes ______ in progress Appeal Request: __X__ none ____ in progress ____ completed [date of response]
131

2005 Report to Congress on the Costs and Benefits of Federal Regulations
Summary of Request for Reconsideration: n.a. Type of Appeal Process Used: n.a. Appeal Resolution: n.a.
Agency Receiving Correction Request: United States Mint
Requestor: Matt Reidel, private citizen Date Received: E-mail to webmaster account on 02/12/04 Summary of Request: New Hampshire quarter content change. Description of Requested Correction: "You may want to update your web page regarding the New Hampshire quarter. The Old Man on the quarter has fallen off (as of last year).." Influential: ____Yes __X__ No ____ Undetermined First Agency Response: ____ in progress __X__ completed 02/19/04 Resolution: Changed the page to read in the past tense. (e.g., "The Old Man of the Mountain" was a distinctive rock formation on Mt. Cannon in the Franconia Notch gateway to northern New Hampshire." Judicial Review: _X___none ____yes ______ in progress Appeal Request: __X__ none ____ in progress ____ completed Summary of Request for Reconsideration: n.a. Type of Appeal Process Used: n.a. Appeal Resolution: n.a.
Agency Receiving Correction Request: Department of the Treasury, Bureau of Engraving and Printing, Office of External Relations
Requestor: Derek Moffitt Date Received: September 7, 2004; received via internet Summary of Request: The requestor wanted clarification on the August 2004 monthly production figures that are posted on our public website. The serial number ranges in the August figures didn’t continue where the July 2004 monthly production figures left off. Description of Requested Correction: “It looks like there may be a problem with the August 2004 monthly production figures that you recently posted. There are eight or nine serial number ranges listed there that don't pick up where the previous production left off-it looks like there are a whole lot of missing print runs. Has the BEP really started to skip serial numbers, or did something go wrong with the August report? Thanks for looking into this!” Influential: ____Yes _X_ No ____ Undetermined First Agency Response: ____ in progress _X_ completed September 8, 2004
132

Appendix E
Resolution: We responded by thanking the requestor for visiting the website and letting him know that we would look into the matter. It was determined that our office received an incorrect production report for August 2004. We acquired the correct production report and posted it on the website. Judicial Review: _X_ none ____yes ______ in progress Appeal Request: _X_ none ____ in progress ____ completed [date of response] Summary of Request for Reconsideration: N/A Type of Appeal Process Used: N/A Appeal Resolution: N/A
Agency Receiving Correction Request: Department of the Treasury, Bureau of Engraving and Printing, Office of External Relations
Requestor: Paper Money Col Thiel, PMCM Date Received: September 8, 2004; received via internet Summary of Request: The requestor wanted clarification on the August 2004 monthly production figures that are posted on our public website. The serial number ranges in the August figures didn’t continue where the July 2004 monthly production figures left off. Description of Requested Correction: “The BEP report for August no numbers continue on from the July report, the block are different.” Influential: ____Yes _X_ No ____ Undetermined First Agency Response: ____ in progress _X_ completed September 8, 2004 Resolution: We responded by thanking the requestor for visiting the website and letting him know that we would look into the matter. It was determined that our office received an incorrect production report for August 2004. We acquired the correct production report and posted it on the website. Judicial Review: _X_ none ____yes ______ in progress Appeal Request: _X_ none ____ in progress ____ completed Summary of Request for Reconsideration: N/A Type of Appeal Process Used: N/A Appeal Resolution: N/A
Agency Receiving Correction Request: Treasury, Alcohol and Tobacco Tax and Trade Bureau (TTB)
Requestor: Marc E. Sorini, Esquire McDermott, Will & Emery Partnership Including Professional Corporations
Date Received: October 21, 2003 Via hand delivery
133

2005 Report to Congress on the Costs and Benefits of Federal Regulations
Summary of Request: The law firm of McDermott, Will & Emery represents Diageo North America, Inc., a manufacturer of flavored malt beverages. According to Mr. Sorini of that firm, TTB Notice of Proposed Rulemaking No. 4, Flavored Malt Beverages and Related Proposals, “asserts that current labels on flavored malt beverages (‘FMBs’) confuse consumers with respect to both the source and amount of alcohol in the beverages” but “does not adequately ensure the quality of its assertions of consumer confusion and does not provide any supporting data for those assertions.” Description of Requested Correction: Diageo asks that TTB “(1) publish the data supporting Notice 4’s assertions of consumer confusion, if any, and permit Diageo and the public the opportunity to submit comments on the data, or (2) withdraw those assertions.” Influential: ____ Yes __X__ No __ __ Undetermined First Agency Response: ____ in progress __X__ completed TTB responded by letter to Mr. Sorini on December 23, 2003 Resolution: The issues Diageo raises are “inextricably linked to our ongoing rulemaking process with respect to flavored malt beverages.” Therefore, we will address Diageo’s concerns through the mechanisms of the Administrative Procedure Act, 5 U.S.C. § 553, rather than the procedures the Information Quality Act provides. Accordingly, we consider Diageo’s letter to be “a comment to our proposed rule on flavored malt beverages, and will respond to the issues … in the preamble to any final rule on this matter.” The final rule is under review at Main Treasury. Judicial Review: __X__ none _____yes _____ in progress. Appeal Request __X__ none ____ in progress ____ completed However, according to a McDermott, Will & Emery letter dated January 27, 2004, Diageo “reserves all its rights under the FDQA [Federal Data Quality Act], including the right to challenge a final rule as inconsistent with FDQA requirements” and “to seek a reconsideration” under certain circumstances. Summary of Request for Reconsideration: N/A. Type of Appeal Process Used: N/A Appeal Resolution: N/A
134

APPENDIX F: PEER REVIEW AND PUBLIC COMMENTS
OMB greatly appreciates all of the comments we received in response to the draft Report. In particular, we would like to thank our invited peer reviewers: Mark Greenwood (Ropes & Gray), Robert Hahn, Robert Litan and Rohit Malik (AEI-Brookings Joint Center for Regulatory Studies), Winston Harrington (Resources for the Future), Brian Mannix (Mercatus Center), and Richard Parker (University of Connecticut School of Law). Below is a listing of all the written comments we have received, and the numbers or letters we have assigned to their comments. The public and peer review comments are available for review at http://www.whitehouse.gov/omb/inforeg/regpol-reports_congress.html. Peer Reviewers 1. Mark Greenwood, Ropes & Gray 2. Robert Hahn, Robert Litan, and Rohit Malik, AEI-Brookings Joint Center for Regulatory
Studies 3. Winston Harrington, Resources for the Future 4. Brian Mannix, Mercatus Center 5. Richard Parker, University of Connecticut School of Law Public Comments A. Thomas Curtis, American Water Works Association B. Thomas McGarity and Amy Sinden, Center for Progressive Reform C. William Kovacs, Chamber of Commerce D. Barbara Kahlow E. Susan Dudley, Mercatus Center F. David Crowe, National Association of Home Builders G. Al Mansell, National Association of Realtors H. Alison Keane and David Darling, National Pain and Coatings Association I. Steve Crockett, Nuclear Regulatory Commission J. Sean Moulton and Cheryl Gregory, OMB Watch K. J. Robert Shull, OMB Watch L. Thomas Sullivan and Bruce Lundegren, SBA Office of Advocacy M. Jim Tozzi, Center for Regulatory Effectiveness N. John Engler, National Association of Manufacturers O. Joan Claybrook, Public Citizen
135


PART II: TENTH ANNUAL REPORT TO CONGRESS ON AGENCY COMPLIANCE WITH THE UNFUNDED MANDATES REFORM ACT


INTRODUCTION
This report represents OMB’s tenth annual submission to Congress on agency compliance with the Unfunded Mandates Reform Act of 1995 (the Act). It details agency actions to involve State, local, and tribal governments in regulatory decisions that affect them, including expanded efforts to involve them in agency decision-making processes. As has been done in recent years, this report is being included along with our annual report to Congress on the benefits and costs of Federal regulations. This is done because the two reports together address many of the same issues and both highlight the need for regulating in a responsible manner that accounts for the costs and benefits of rules and takes into consideration the interests of our intergovernmental partners. As OMB stated in previous reports, we intend to continue to publish these two reports together. This report on agency compliance with the Act covers the period of October of 2003 through September of 2004 (rules published before October of 2003 were described in last year’s report.) State and local governments have a vital constitutional responsibility to provide government services. They have the major role in providing domestic public services, such as public education, law enforcement, road building and maintenance, water supply, and sewage treatment. The Federal government contributes to that role by promoting a healthy economy and by providing grants, loans, and tax subsidies to State and local governments. However, over the past two decades, State, local, and tribal governments increasingly have expressed concerns about the difficulty of complying with Federal mandates without additional Federal resources. In response, Congress passed the Unfunded Mandates Reform Act of 1995 (the Act). Title I of the Act focuses on the Legislative Branch, addressing the processes Congress should follow before enactment of any statutory unfunded mandates. Title II addresses the Executive Branch. It begins with a general directive for agencies to assess, unless otherwise prohibited by law, the effects of their rules on the other levels of government and on the private sector (Section 201). Title II also describes specific analyses and consultations that agencies must undertake for rules that may result in expenditures of over $100 million (adjusted annually for inflation) in any year by State, local, and tribal governments in the aggregate, or by the private sector. Specifically, Section 202 requires an agency to prepare a written statement for intergovernmental mandates that describes in detail the required analyses and consultations on the unfunded mandate. Section 205 requires that for all rules subject to Section 202, agencies must identify and consider a reasonable number of regulatory alternatives, and then generally select from among them the least costly, most cost-effective, or least burdensome option that achieves the objectives of the rule. Exceptions require the agency head to explain in the final rule why such a selection was not made or why such a selection would be inconsistent with law. Title II requires agencies to “develop an effective process” for obtaining “meaningful and timely input” from State, local and tribal governments in developing rules that contain significant intergovernmental mandates (Section 204). Title II also singles out small governments for particular attention (Section 203). OMB’s guidelines assist Federal agencies in complying with
139

10th Report to Congress on Agency Compliance with the Unfunded Mandates Reform Act
the Act and are based upon the following general principles:
• intergovernmental consultations should take place as early as possible, beginning before issuance of a proposed rule and continuing through the final rule stage, and be integrated explicitly into the rulemaking process;
• agencies should consult with a wide variety of State, local, and tribal officials; • agencies should estimate direct costs and benefits to assist with these consultations; • the scope of consultation should reflect the cost and significance of the mandate being
considered; • effective consultation requires trust and significant and sustained attention so that all who
participate can enjoy frank discussion and focus on key priorities; and • agencies should seek out State, local, and tribal views on costs, benefits, risks, and
alternative methods of compliance, and whether the Federal rule will harmonize with and not duplicate similar laws in other levels of government.
The scope of consultation activities undertaken by Federal departments such as, Agriculture, Health and Human Services, Interior, Justice, Labor, Transportation, and the Environmental Protection Agency demonstrate this Administration’s commitment to building strong relationships with our intergovernmental partners based upon the constitutional principles of Federalism embodied in Title II of the Act. Federal agencies have been actively consulting with States, localities, and tribal governments in order to ensure that regulatory activities were conducted consistent with the requirements of the Act. For examples of agency consultation activities, please see the appendix to this report. Sections 206 and 208 of the Act direct OMB to send copies of required agency analyses to the Congressional Budget Office (CBO), and to submit an annual report to Congress on agency compliance with Title II. Section 207 calls for the establishment of pilot programs for providing greater flexibility to small governments. The remainder of this report discusses the results of agency actions in response to the Act between October 1, 2003 and September 30, 2004. Not all agencies take many significant actions that affect other levels of government; therefore this report focuses on the agencies that have regular and substantive interactions on regulatory matters that involve States, localities, and tribes, as well as the private sector. This report also lists and briefly discusses the regulations meeting the Title II threshold and the specific requirements of Sections 202 and 205 of the Act. Seven rules have met this threshold – none were intergovernmental mandates. The appendix to this report discusses agency consultation efforts. These include both those efforts required under the Act and the many actions conducted by agencies above and beyond these requirements, consistent with the spirit of the Act.
140

CHAPTER I: IMPACTS ON STATE, LOCAL, AND TRIBAL GOVERNMENTS
Over the past ten years, six rules have imposed costs of more than $100 million per year (adjusted for inflation) on State, local, and tribal governments (and thus have been classified as public sector mandates under the Unfunded Mandates Act of 1995).1
• EPA’s Rule on Standards of Performance for Municipal Waste Combustors and Emissions Guidelines (1995): This rule set standards of performance for new municipal waste combustor (MWC) units and emission guidelines for existing MWCs under sections 111 and 129 of the Clean Air Act [42 U.S.C. 7411, 42 U.S.C. 7429]. The standards and guidelines apply to MWC units at plants with combustion capacities greater than 35 mega grams per day (Mg/day) (approximately 40 tons per day) of municipal solid waste (MSW). The EPA standards require sources to achieve the maximum degree of reduction in emissions of air pollutants that the Administrator determined is achievable, taking into consideration the cost of achieving such emissions reduction, and any non-air quality health and environmental impacts and energy requirements. EPA estimated the annualized costs of the emissions standards and guidelines to be $320 million per year (in constant 1990 dollars) over existing regulations. While EPA estimated the cost of such standards for new sources to be $43 million per year, the cost to existing sources was estimated to be $277 million per year. The annual emissions reductions achieved through this regulatory action include, for example, 21,000 Mg. of sulfur dioxide; 2,800 Mg. of particulate matter (PM); 19,200 Mg of nitrogen oxides; 54 Mg. of mercury; and 41 Kg. of dioxins/furans.
• EPA’s Standards of Performance for New Stationary Sources and Guidelines for Control
of Existing Sources: Municipal Solid Waste Landfills (1996): This rule set performance standards for new municipal solid waste landfills and emission guidelines for existing municipal solid waste landfills under section 111 of the Clean Air Act. The rule addressed non-methane organic compounds (NMOC) and methane emissions. NMOC include volatile organic compounds (VOC), hazardous air pollutants (HAPs), and odorous compounds. Of the landfills required to install controls, about 30 percent of the existing landfills and 20 percent of the new landfills are privately owned. The remaining landfills are publicly owned. The total annualized costs for collection and control of air emissions from new and existing MSW landfills are estimated to be $100 million.
1 We note that EPA’s proposed rules setting air quality standards for ozone and particulate matter may ultimately lead to expenditures by State, local, or tribal governments of $100 million or more. However, Title II of the Unfunded Mandates Reform Act provides that agency statements of compliance with Section 202 must be conducted “unless otherwise prohibited by law”. The conference report to this legislation indicates that this language means that the section “does not require the preparation of any estimate or analysis if the agency is prohibited by law from considering the estimate or analysis in adopting the rule.” EPA has stated, and the courts have affirmed, that under the Clean Air Act, the primary air quality standards are health-based and EPA is not to consider costs.
141

10th Report to Congress on Agency Compliance with the Unfunded Mandates Reform Act
• EPA’s National Primary Drinking Water Regulations: Disinfectants and Disinfection Byproducts (1998): This rule promulgates health-based maximum contaminant level goals (MCLGs) and enforceable maximum contaminant levels (MCLs) for about a dozen disinfectants and byproducts that result from the interaction of these disinfectants with organic compounds in drinking water. The rule will require additional treatment at about 14,000 of the estimated 75,000 covered water systems nationwide. The costs of the rule are estimated at $700 million annually. The quantified benefits estimates range from zero to 9,300 avoided bladder cancer cases annually, with an estimated monetized value of $0 to $4 billion per year. Possible reductions in rectal and colon cancer and adverse reproductive and developmental effects were not quantified.
• EPA’s National Primary Drinking Water Regulations: Interim Enhanced Surface Water
Treatment (1998): This rule establishes new treatment and monitoring requirements (primarily related to filtration) for drinking water systems that use surface water as their source and serve more than 10,000 people. The purpose of the rule is to enhance health protection against potentially harmful microbial contaminants. EPA estimated that the rule will impose total annual costs of $300 million per year. The rule is expected to require treatment changes at about half of the 1,400 large surface water systems, at an annual cost of $190 million. Monitoring requirements add $96 million per year in additional costs. All systems will also have to perform enhanced monitoring of filter performance. The estimated benefits include average reductions of 110,000 to 338,000 cases of cryptosporidiosis annually, with an estimated monetized value of $0.5 to $1.5 billion, and possible reductions in the incidence of other waterborne diseases.
• EPA’s National Pollutant Discharge Elimination: System B Regulations for Revision of
the Water Pollution Control Program Addressing Storm Water Discharges (1999): This rule expands the existing National Pollutant Discharge Elimination System program for storm water control. It covers smaller municipal storm sewer systems and construction sites that disturb one to five acres. The rule allows for the exclusion of certain sources from the program based on a demonstration of the lack of impact on water quality. EPA estimates that the total cost of the rule on Federal and State levels of government, and on the private sector, is $803.1 million annually. EPA considered alternatives to the rule, including the option of not regulating, but found that the rule was the option that was “most cost effective or least burdensome, but also protective of the water quality.”
• EPA’s National Primary Drinking Water Regulations; Arsenic and Clarifications to
Compliance and New Source Contaminants Monitoring (2001): This rule reduces the amount of arsenic that is allowed to be in drinking water from 50 ppb to 10 ppb. It also revises current monitoring requirements and requires non-transient, non-community water systems to come into compliance with the standard. This rule may affect either State, local or tribal governments or the private sector at an approximate annualized cost of $206 million. The monetized benefits of the rule range from $140 to $198 million per year. The EPA selected a standard of 10 ppb because it determined that this was the level that best maximizes health risk reduction benefits at a cost that is justified by the benefits, as required by the Safe Drinking Water Act.
142
CHAPTER II: A REVIEW OF SIGNIFICANT REGULATORY MANDATES In FY2004, Federal Agencies issued 10 rules that were subject to Sections 202 and 205 of
the Unfunded Mandate Reform Act of 1995 because they require expenditures in any year by State, local or tribal governments, in the aggregate, or by the private sector, of at least $100 million in any one year (adjusted annually for inflation).
The Department of Agriculture issued one proposed rule, the Department of Health and
Human Services issued one interim final rule and one proposed rule, the Department of Labor issued one final rule and one proposed rule, the Department of Transportation issued one final rule and two proposed rules and the Environmental Protection Agency issued one final rule and two proposed rules. EPA’s “Establishing Location, Design, Construction, and Capacity Standards for Cooling Water Intake Structures at Large Existing Power Plants” was the only rule for which expected expenditures to State, local or tribal governments, and the private sector, in the aggregate, totaled more than $100 million. All of the other rules cited in this section were rules that required only private sector expenditures in any year, in the aggregate, to total more than $100 million.
OMB worked with the agencies to ensure that the selection of the regulatory option for
final rules fully complied with the requirements of Title II of the Act. For proposed rules, OMB often worked with the agency to ensure that they also solicited comment on alternatives. Descriptions of the rules in addition to agency statements regarding compliance with the Act are included in the following section.
A. Department of Agriculture
• Mandatory Country of Origin Labeling of Beef, Lamb, Pork, Fish, Perishable Agricultural Commodities, and Peanuts (Proposal):The Agricultural Marketing Services (AMS) issued a proposed rule on October 30, 2003, to implement a mandatory country of origin labeling program for covered commodities as mandated by the Farm Security and Rural Investment Act of 2002. The Farm Security and Rural Investment Act amended the Agricultural Marketing Act of 1946 to require retailers to notify their customers of the country of origin labeling program not later than September 30, 2004. Covered commodities include muscle cuts of beef (including veal), lamb, and pork; ground beef, ground pork; farm-raised fish and shellfish; wild fish and shellfish; perishable agricultural commodities (fresh and frozen fruits and vegetables); and peanuts. USDA estimates that the direct, incremental cost for firms to implement this proposed rule will total at least $582 million in the first year. This is the estimated incremental or marginal cost for firms to comply with the new recordkeeping requirements for mandatory country of origin labeling. Costs to producers are estimated at $235 million, costs to intermediaries such as handlers, processors and wholesalers are estimated at $123 million, and costs to retailers are estimated at $224 million.
143

10th Report to Congress on Agency Compliance with the Unfunded Mandates Reform Act
B. Department of Health and Human Services
• Prior Notice of Imported Food Under the Public Health Security and Bioterrorism Preparedness and Response Act of 2002 (Interim Final Rule): The Food and Drug Administration (FDA) issued an interim final rule that requires the submission to FDA of prior notice of food, including animal feed, that is imported or offered for import into the United States. The interim final rule implemented the Public Health Security and Bioterrorism Preparedness and Response Act of 2002 (the Bioterrorism Act), which requires prior notification of imported food to begin on December 12, 2003, even in the absence of a final regulation. The interim final rule requires that the prior notice be submitted to FDA electronically via either the Bureau of Customs and Border Protection (CBP) Automated Broker Interface (ABI) of the Automated Commercial System (ACS) or the FDA Prior Notice System Interface (FDA PN System Interface). The information must be submitted (and confirmed electronically as facially complete by FDA) for review no more than 5 days and no less than 8 hours (for food arriving by water), 4 hours (for food arriving by air or land/rail), or 2 hours (for food arriving by land/road) before the food arrives at the port of arrival. Food imported or offered for import without adequate prior notice is subject to refusal.
This rule imposes first year costs of $367 million and annual costs thereafter of $261 million. The present value of these costs is $3 billion at the 7 percent discount rate and $4 billion at the 3 percent discount rate over a 20 year period. FDA has determined that this interim final rule is significant under the Unfunded Mandates Reform Act.
• Use of Ozone Depleting Substances; Removal of Essential-Use Designations (Proposal):
The Food and Drug Administration (FDA) is proposing to amend its regulation on the use of ozone-depleting substances (ODS) in self-pressurized containers to remove the essential-use designations for albuterol used in oral pressurized metered-dose inhalers (MDI). Under the Clean Air Act, FDA, in consultation with the Environmental Protection Agency (EPA), is required to determine whether an FDA-regulated product that releases an ODS is an essential use of the ODS. Two albuterol MDIs that do not use an ODS are currently marketed. FDA has tentatively determined that the two non-ODS MDIs will be satisfactory alternatives to albuterol MDIs containing ODSs and are proposing to remove the essential-use designation for albuterol MDIs. If the essential-use designation is removed, albuterol MDIs containing an ODS could not be marketed after a suitable transition period. The proposed rule could result in increased health care expenditures of about a billion dollars for each year between the reintroduction of generic competition in this market and the selected year for removing the essential-use designation.
C. Department of Labor
• Defining and Delimiting the Exemptions for Executive, Administrative, Professional,
Outside Sales and Computer Employees (Final Rule): The Fair Labor Standards Act of
144

II: Review of Significant Regulatory Mandates
1938 implemented the exemption from minimum wage and overtime pay for executive, administrative, professional, outside sales and computer employees. These exemptions are often referred to as the ``white collar'' exemptions. To be considered exempt, employees must meet certain minimum tests related to their primary job duties and, in most cases, must be paid on a salary basis at not less than minimum amounts as specified in pertinent sections of these regulations.
The upper bound private sector cost estimate to employers for the rule ranges from $849.2 million to $1.5 billion. This includes one-time implementation costs ranging from $521.4 million to $660.3 million and recurring payroll costs ranging from $327.8 million to $871.6 million.
• Occupational Exposure to Hexavalent Chromium (Proposal): The Occupational Safety
and Health Administration (OSHA) proposes to amend its existing standard for employee exposure to hexavalent chromium (Cr(VI)). The basis for issuance of this proposal is a preliminary determination by OSHA that employees exposed to Cr(VI) face a significant risk to their health at the current permissible exposure limits and that promulgating this proposed standard will substantially reduce that risk. The information gathered so far in this rulemaking indicates that employees exposed to Cr(VI) well below the current permissible exposure limit are at increased risk of developing lung cancer. Occupational exposures to Cr(VI) may also result in asthma, and damage to the nasal epithelia and skin.
The NPRM proposes an 8-hour time-weighted average permissible exposure limit of one microgram of Cr(VI) per cubic meter of air (1 μg/m3) for all Cr(VI) compounds. OSHA also proposes other ancillary provisions for employee protection such as preferred methods for controlling exposure, respiratory protection, protective work clothing and equipment, hygiene areas and practices, medical surveillance, hazard communication, and recordkeeping. OSHA is proposing separate regulatory texts for general industry, construction, and shipyards in order to tailor requirements to the circumstances found in each of these sectors. In the NPRM, OSHA estimates that compliance with this proposal would require private-sector employers to expend about $223 million per year. In addition, OSHA estimates that employers will incur $67 million per year to comply with the personal protective equipment and hygiene requirements already present in existing generic standards.
D. Department of Transportation
• Tire Pressure Monitoring Systems (Proposal): DOT proposed to establish a new Federal motor vehicle safety standard mandating tire pressure monitoring systems (TPMS) capable of detecting when a tire is significantly under-inflated. A prior version of the standard, adopted by the agency in June 2002 in response to a mandate in the Transportation Recall Enhancement, Accountability and Documentation Act, was vacated by a decision issued by the U.S. Court of Appeals for the Second Circuit in August 2003.
145

10th Report to Congress on Agency Compliance with the Unfunded Mandates Reform Act
This NPRM, which is consistent with the Court's decision, proposes to require installation in new light vehicles (e.g., passenger cars and trucks) of a tire pressure monitoring system capable of four-tire, 25-percent under-inflation detection. This proposed rule differs from the final rule also in that it tentatively responds to issues raised in petitions for reconsideration of the June 2002 final rule and proposes to require a TPMS malfunction indicator. The highest costs for compliance would result if manufacturer installed direct TPMSs with an interactive readout of individual tire pressures that included sensors on all light vehicle wheels. Thus, the agency estimates that the average incremental cost for all light vehicles to meet the proposed requirement would range from $48.44 - $69.89 per vehicle, depending upon the specific technology chosen for compliance. Since approximately 17 million light vehicles are produced for sale in the U.S. each year, the total annual light vehicle cost would range from approximately $823 million - $1.188 billion per year. Section 202 of the Unfunded Mandates Reform Act of 1995 (UMRA) requires Federal agencies to prepare a written assessment of the costs, benefits, and other effects of proposed or final rules that include a Federal mandate likely to result in the expenditure by State, local, or tribal governments, in the aggregate, or by the private sector, of more than $100 million annually (adjusted for inflation with base year of 1995 (so currently about $109 million)). This proposed rule would not result in the expenditure by State, local, or tribal governments, in the aggregate, or more than $109 million annually, but it would result in an expenditure of that magnitude by vehicle manufacturers and/or their suppliers.
• Federal Motor Vehicle Safety Standards; Side Impact Protection; Side Impact Phase-In Reporting Requirements (Proposal): Two Federal motor vehicle safety standards (FMVSS) No. 201, "Occupant Protection in Interior Impact," and No. 214, "Side Impact Protection," specify requirements for side impact protection. At present, while the FMVSS No. 214 specifies a moving deformable barrier (MDB) test addressing mainly the chest injury problem, head impacts with exterior objects, such as trees, poles, and narrow rigid structures, are not addressed by the standard. The agency plans to address this safety problem by amending the side impact protection standard (FMVSS No. 214) to add a vehicle-to-pole test. NHTSA estimates that the combination air bag, 2-sensor system would be the least expensive side air bag system that would enable a vehicle to meet the standard. Accounting for the degree to which the MY 2003 fleet already has combination side air bags, the average vehicle incremental cost to meet the proposed requirements is estimated to be $91 per vehicle. If a window curtain, thorax side air bag system were installed with 4 sensors, the average incremental cost per vehicle would be $264. Given the number of vehicles in the MY 2003 fleet that now have wide curtains and wide thorax side air bags with four sensors, the average vehicle incremental cost to meet this proposal is estimated to be $208 per vehicle. This amounts to a range of $1.6 to $3.6 billion for the total incremental annual costs of this proposed rule.
146
II: Review of Significant Regulatory Mandates
• Pipeline Integrity Management in High Consequence Areas (Gas Transmission Pipelines) (Final Rule): This rule requires operators to develop integrity management programs for gas transmission pipelines that, in the event of a failure, could impact high consequence areas (HCA). These integrity management programs focus on requiring operators to evaluate their pipelines comprehensively, and take measures to protect pipeline segments located in HCAs. State regulators have participated in our meetings and conference calls with the industry and research institutions on various integrity management issue discussions and provided recommendations. This rule imposes unfunded mandates under the Unfunded Mandates Reform Act of 1995, because it may result in the expenditure by the private sector of $100 million or more in any one year.
E. Environmental Protection Agency
• Establishing Location, Design, Construction, and Capacity Standards for Cooling Water Intake Structures at Large Existing Power Plants (Final Rule): This final rule affects large existing electricity generating facilities that employ cooling water intake structures. Section 316(b) of the Clean Water Act provides that any standard established pursuant to sections 301 or 306 of the Clean Water Act and applicable to a point source shall require that the location, design, construction, and capacity of cooling water intake structures reflect the best technology available for minimizing adverse environmental impact. A primary purpose of the rulemaking is to minimize any adverse environmental impact that may be associated with the impingement and entrainment of fish and other aquatic organisms by cooling water intake structures. Impingement refers to trapping fish and other aquatic life on intake screens or similar devices where they may be injured or killed. Entrainment occurs when smaller aquatic organisms, eggs, and larvae are drawn into a cooling system, and then pumped back out, often with significant injury or mortality due to heat, physical stress or exposure to chemicals. EPA estimates that facilities subject to the preferred option would incur annualized post-tax compliance costs of approximately $265 million (at proposal, this estimate was $178 million). These costs include one-time technology costs of complying with the rule, a one-time cost of installation downtime, annual operating and maintenance costs and permitting costs.
• National Emission Standards for Hazardous Air Pollutants for Fossil Fuel-Fired Electric
Utility Steam Generating Units (Proposal): In December 2000, EPA determined that regulation of hazardous air pollutant emissions (HAP) from oil- and coal-fired electric utility steam generating units was necessary and appropriate. This finding was based on the results of the study mandated by the Clean Air Act, as amended. The rule will result in standards based on the use of maximum achievable control technology (MACT). The primary benefit will be the reduction of mercury emissions to the atmosphere from coal-fired units but other HAP will also be reduced.
147

10th Report to Congress on Agency Compliance with the Unfunded Mandates Reform Act
EPA has determined that this rule may result in expenditures of more than $100 million to the private sector in any single year.
148
APPENDIX: AGENCY CONSULTATION ACTIVITIES UNDER THE UNFUNDED MANDATES REFORM
ACT OF 1995
Sections 203 and 204 of the Act require agencies to seek input from State, local and tribal governments on new Federal regulations imposing significant intergovernmental mandates. This appendix summarizes consultation activities by agencies whose actions affect State, local and tribal governments.
Nine agencies (the Departments of Agriculture, Commerce, Education, Health and Human Services, Homeland Security, Justice, Labor, Transportation and the Environmental Protection Agency) have involved State, local and tribal governments not only in their regulatory processes, but also in their program planning and implementation phases. These agencies have worked to enhance the regulatory environment by improving the way in which the Federal government relates to its intergovernmental partners. In general, the Departments not listed here (including Veterans Affairs, Small Business Administration, General Services Administration, State, Energy, Treasury) do not often impose mandates upon States, localities or tribes and so have fewer occasions to consult with other levels of domestic government.
As the following descriptions indicate, Federal agencies are conducting a wide range of consultations. Agency consultations sometimes involve multiple levels of government, depending on the agency’s understanding of the scope and impact of the rule. OMB continues to work with agencies to ensure that consultation occurs with the appropriate level of government. A. Department of Agriculture Food and Nutrition Services (FNS) 1. School Breakfast Program: Eliminated Cost Accounting to Obtain Additional Funding for Operating the Severe Need Component of the School Breakfast Program
Schools operating the School Breakfast Program were required to maintain cost accounting records as one of three criteria to obtain additional funding commonly referred to as Severe Need funding. The Child Nutrition and WIC Reauthorization Act of 2004 (Act) changed the criteria for receiving severe need funding and omitted the requirement that the cost of producing the breakfast must exceed Federal reimbursement as a criterion to qualify for severe need funding. Accordingly, after consultation with affected parties, FNS issued a policy that allows State agencies and school food authorities to approve severe need funding without the need to consider the cost accounting criteria, thereby allowing for a simplified determination of which schools are eligible to receive severe need funding.
The affected parties are local school food authorities (school districts) operating or desiring to operate the School Breakfast Program. Groups included in consultations were the State agency staff administering the National School Lunch Program and School Breakfast
149

10th Report to Congress on Agency Compliance with the Unfunded Mandates Reform Act
Program.
State officials contacted regional FNS staff via telephone inquiring about the implementation of the Act. Regional FNS staff relayed the State agency concerns and appeals for guidance to FNS Headquarters staff. Concerns included a desire for immediate policy guidance prior to the issuance of a regulation. States expressed the need to have FNS explain how to implement the new procedures allowed by the Act.
FNS Headquarters staff issued a policy memorandum explaining the procedures that are allowed for approving a school for severe need funding in the School Breakfast Program. Specifically, States no longer have to evaluate cost accounting documentation in order to consider a school food authorities request for severe need funding. The policy memorandum implementing this change was issued July 6, 2004. 2. Permitting Flexibility in Setting Application Renewal Time Periods for Child and Adult Care Food Program (CACFP) Institutions, 7 CFR 226.6(b)(2)
This provision in the CACFP regulations requires that State agencies establish a time period from 12 months to 36 months for institutions to reapply to continue participating in the program. If State agencies determine that unusual circumstances exist, they may require an institution to reapply in less than a 12-month interval. This provision is contained in an interim final rule, Child and Adult Care Food Program: Improving Management and Program Integrity, published on September 1, 2004 in the Federal Register (69 FR 53502). The provision differs from that proposed on September 12, 2000 (65 FR 55101), which would not have allowed State agencies to set time intervals of less than 12 months.
State agencies that administer the CACFP and participating institutions (i.e., independent child or adult care centers or sponsoring organizations of child or adult care centers) are affected by this provision.
A 90-day comment period was provided for interested persons to submit comments on the proposed rule. Some State agencies that commented on the proposed rule requested to have the additional flexibility to respond to unusual circumstances that could arise in which a time frame of less than 12 months for reapplication should be permitted. As a result of these comments, FNS revised the provision in the interim final rule published on September 1, 2004. 3. Permanent agreements between State agencies and CACFP institutions, 7 CFR 226.6(b)(4)(ii)
This provision in the CACFP regulations permits State agencies to execute permanent agreements with the non-school institutions that participate in the program. This provision is contained in an interim final rule, Child and Adult Care Food Program: Improving Management and Program Integrity, published on September 1, 2004 in the Federal Register (69 FR 53502). The provision represents a change from the September 12, 2000 proposed rule (65 FR 55101) that would have continued the requirement that agreements would expire and need to be renewed at the same time as program applications by non-school CACFP institutions.
150

Appendix
State agencies that administer the CACFP and participating institutions (i.e., independent
child or adult care centers or sponsoring organizations of child or adult care centers) are affected by this provision.
A 90-day comment period was provided for interested persons to submit comments on the proposed rule. Commenters on this provision overwhelmingly (363 out of 369 commenters) asked FNS to allow State agencies to execute permanent agreements with CACFP institutions. These respondents noted that this change would represent a small but meaningful reduction of paperwork for State agencies and institution. In addition, some State agency commenters noted the potential difficulty of having as many as three different lengths of agreement in effect for different types of institutions.
As a result of the comments received, FNS revised the provision in the interim rule published on September 1, 2004, to allow for the use of permanent agreements between State agencies and non-school CACFP institutions. 4. Use of Annual Statewide Media Release Statement, 7 CFR 226.6(b)(1)(iii)
This provision allows State agencies the option of issuing an annual Statewide media release on behalf of all CACFP institutions. This provision is contained in an interim final rule, Child and Adult Care Food Program: Improving Management and Program Integrity, published on September 1, 2004 in the Federal Register (69 FR 53502). The provision represents a change from the September 12, 2000 proposed rule (65 FR 55101) that would have continued the requirement that CACFP institutions must annually issue a media release to inform the public about the Program’s availability and provide documentation of this to the State agency.
State agencies that administer the CACFP and participating institutions (i.e., independent child or adult care centers or sponsoring organizations of child or adult care centers) are affected by this provision.
A 90-day comment period was provided for interested persons to submit comments on the proposed rule. Commenters on this provision suggested the regulations explicitly provide State agencies with the option to issue a Statewide media release on behalf of all institutions in the State. Although this option had been made available to State agencies previously in written guidance, the option was not included in the proposed rulemaking.
As a result of the comments received, FNS revised the provision in the interim final rule published on September 1, 2004, to allow State agencies the option to either issue a Statewide media release on behalf of all CACFP institutions in the State or to require that CACFP institutions issue their own media release. 5. Exempting Outside-School-Hours Care Centers (OSHCCs) from CACFP Enrollment Requirements, 7 CFR 226.2 and 226.19(b)
This provision exempts centers providing child care outside of school hours from the
151

10th Report to Congress on Agency Compliance with the Unfunded Mandates Reform Act
enrollment requirements that apply to other types of child care centers and day care homes that participate in the CACFP. This provision is contained in an interim final rule, Child and Adult Care Food Program: Improving Management and Program Integrity, published on September 1, 2004, in the Federal Register (69 FR 53502). The provision represents a change from the September 12, 2000 proposed rule (65 FR 55101) that would have continued to include OSHCCs in the program’s annual enrollment requirements.
State agencies that administer the CACFP and participating institutions (i.e., independent child or adult care centers or sponsoring organizations of child or adult care centers) are affected by this provision.
A 90-day comment period was provided for interested persons to submit comments on the proposed rule. A total of 49 commenters, representing different spectrums of the CACFP community, suggested that OSHCCs be excluded from the regulatory enrollment requirements due to the drop-in nature of many afterschool care programs.
FNS agreed with the commenters on this issue. Although the regulations had treated OSHCCs the same as traditional child care centers in the enrollment requirements, section 17(a)(5)(C) of the Richard B. Russell School Lunch Act (42 U.S.C.1766(a)) requires only that institutions providing care to school age children outside of school hours must meet State or local health and safety standards, unless otherwise required by Federal, State, or local jurisdictions. As a result of the comments received, FNS revised the provision in the interim rule published on September 1, 2004, to exclude OSHCCs from enrollment requirements for child care centers. 6. Requirement for Daily Meal Counts by CACFP Day Care Home Providers, 7 CFR 226.15(E)(4)
This provision in the CACFP regulations requires that family day care home providers take daily meals counts, not point-of-service meal counts. The provision also specified circumstances in which State agencies could require point-of-service counts: in homes with more than 12 children enrolled for care and in homes that have had serious deficiency findings related to meal counts and claims. This provision is contained in an interim final rule, Child and Adult Care Food Program: Improving Management and Program Integrity, published on September 1, 2004 in the Federal Register (69 FR 53502). The provision represents a change from the September 12, 2000 proposed rule (65 FR 55101) that would have removed a requirement for point-of-service counts that was contained in FNS Instruction 796-2.
State agencies that administer the CACFP, sponsoring organizations, and day care home providers are affected by this provision.
A 90-day comment period was provided for interested persons to submit comments on the proposed rule. Commenters on this provision overwhelmingly (382 out of 393) reacted positively. Most of these commenters were day care home providers, who stated that this would make their job of providing child care easier, while still assuring that accurate meal counts would be taken. Some State agencies objected and commented that under certain circumstances, they
152

Appendix
ought to be able to require point-of-service counts to ensure compliance.
As a result of the comments received, FNS issued the interim final rule on September 1, 2004, requiring only daily meal counts but adding circumstances under which State agencies can impose point-of-service counts. 7. Food Distribution Program on Indian Reservations (FDPIR) Food Package Review
There is currently an ongoing review process for improving the appeal and nutritional profile of the food package provided under FDPIR.
Consultants are members of a work group that meets via conference calls and face-to-face meetings to discuss and recommend improvements to the FDPIR food package. Consultants include Tribal and State FDPIR Program Directors, USDA Agricultural Marketing Service, USDA Farm Service Agency, DHHS Indian Health Service and DHHS Center for Disease Control and Prevention. Concerns focused on improvements to the FDPIR food package that will appeal to program participants and will offer nutritional benefits to a population that has high rates of diabetes, obesity, and heart disease.
The Food and Nutrition Service is implementing food package changes recommended by the review work group. The changes involve the addition of new products, such as whole-wheat flour, and improvements to products currently offered in the FDPIR food package, such as replacing the current orange juice with a calcium/Vitamin D fortified orange juice. Animal and Plant Health Inspection Service (APHIS) 1. APHIS’ Biotechnology Regulatory Services (BRS) Program
APHIS is planning to revise its existing biotechnology regulations for genetically engineered (GE) plants and other organisms that are potential plant pests (7CFR340). One revision may include utilizing the expanded authority of the Plant Protection Act to broaden the scope of regulations beyond GE organisms that are potential plant pests to include GE biological control organisms and GE plants that may have the potential to be noxious weeds. Also under consideration is the development of a multi-tiered, risk-based permitting system to replace the current permit/notification system. APHIS’ Biotechnology Regulatory Services (BRS) program administers these regulations.
The regulations affect State Departments of Agriculture, biotechnology companies, public and academic research institutions, food processors, food marketers, food commodity exporters, crop associations, biotechnology industry associations, and other public entities.
APHIS-BRS makes continuous efforts to reach out to partners and affected parties to increase confidence in the effectiveness of its biotechnology regulatory system. In February and March 2004, APHIS-BRS held multiple public meetings with 22 stakeholder groups to discuss issues associated with the planned revisions to our regulations.
153

10th Report to Congress on Agency Compliance with the Unfunded Mandates Reform Act
In June 2004, BRS hosted a workshop with the National Association of State Departments of Agriculture (NASDA) to discuss the proposed revisions. BRS invited participants to provide input into the development of its new regulations, and provided information about how the regulatory system works and the safety of the products that are deregulated by BRS’ system. In addition, APHIS-BRS presented information to the Plant Board in August of 2004 concerning the process for revising the regulations and has since held several follow-up meetings with the Plant Board.
As a result of the workshop with NASDA, BRS received many helpful suggestions, though there is not a consensus on any one point. Though the feedback was very diverse, there are many suggestions that will be considered in the process of revising our regulations. For example, renewed concerns about how BRS handles Confidential Business Information will be addressed in its regulations. Another significant comment that BRS received and will be considering is the states’ need for assurance that the biotech regulations for imported commodities will not provide advantages for foreign verses domestic products. In addition to receiving valuable comments such as these, the workshop resulted in a renewed commitment and partnership with the State agencies.
A wide range of view points were elicited from the stakeholders during the meetings in February and March 2004, and APHIS clarified some of the objectives it hopes to achieve in revising the regulations. The meetings included the following organizations: Arborgen, Biotechnology Industry Organization (BIO), Center for Science in the Public Interest, Center for Food Safety, Chlorogen, Coalition for the Advancement of Biotechnology Based Perennials and Specialty Plants, Consumers Union, Control Pharming Ventures, Dow Agrosciences, Edmonds Institute, Friends of the Earth, Mead Westvaco, Monsanto, National Cotton Council of America, National Food Processors Association, National Grain and Feed Association, North American Millers Association, Oregon State University, ProdiGene, Public Interest Research Group, Union of Concerned Scientists, and Ventria Bioscience.
While the consultations with stakeholder groups, NASDA, and the Plant Board will not solely be responsible for the changes to the Agency’s biotechnology regulations, their comments and feedback will be considered by the Agency. 2. APHIS’ Plant Protection and Quarantine (PPQ) Program
APHIS’ Plant Protection and Quarantine (PPQ) program carries out numerous activities to detect, contain and, in some cases, manage or eradicate plant pests that are damaging to the agricultural and environmental resources of the United States. Specific pest programs include activities to detect, contain, manage, or eradicate Phytophthora ramorum (a fungus that attacks numerous plant species that is commonly known as Sudden Oak Death) and emerald ash borer (an exotic pest of ash trees).
These programs are conducted cooperatively with State agencies, which share the costs with APHIS. In cases where APHIS regulations could affect native American tribes, those tribes are included in its consultations.
154

Appendix
Operational plans are prepared jointly and reflect the respective roles of State and Federal partners. PPQ consults regularly and frequently (sometimes on a daily basis) on program strategies, methods, operations, and progress. PPQ cultivates consultations with State agencies through National Plant Board meetings, task forces, and special committees to resolve issues of mutual concern. PPQ contacts and consults with Tribal governments that may be affected by contemplated PPQ activities in order to resolve issues of mutual concern.
Concerns generally arise over the effects of APHIS regulations and policy on States, who are often largely responsible for enforcing the regulations under cooperative agreements. Points of concern may include availability of resources, practical obstacles to program success, coordinated national approach, and balancing the interests of stakeholders affected by quarantine actions with those who could be adversely affected by spread of the pest of concern. Tribal issues often concern the impact of regulation on Tribal businesses.
Emerald Ash Borer: Through continuous consultations with the States of Ohio, Indiana, Virginia, Maryland, and Michigan, APHIS has been able to devise regulatory strategies that protect against the interstate spread of this pest while being practical to enforce, given the affected industries. During 2004, APHIS and the States convened a Science Panel to review and modify the program strategy. APHIS is now working with the States to implement the new strategy. States are provided funds through cooperative agreements to assist in enforcement of the regulations.
Phytophthora ramorum: Through extensive consultations with the States of California, Oregon, and Washington, which produce a major portion of U.S. nursery stock, and with States that purchase nursery stock from California, Oregon and Washington, APHIS is able to devise regulatory strategies that protect against the interstate spread of this pest while being practical to enforce. These consultations successfully minimized the economic and operational costs to the States of implementing the regulatory program and helped to ensure that nursery stock could continue to move interstate. During 2004, APHIS also consulted with various tribes in Northern California to discuss possible effects of P. ramorum regulations. 3. National Animal Identification System (NAIS)
The Department is implementing a National Animal Identification System (NAIS). The implementation of NAIS will affect State and Tribal governments and livestock producers.
The consultation process consisted of discussions at meetings and other events with stakeholders including representatives from industry groups and other nongovernmental organizations, and State and Tribal officials. In addition, a series of listening sessions were held throughout the country to provide producers and other stakeholders further opportunity to comment on the implementation of the NAIS. Description of Issues/Concerns Raised by Public/Intergovernmental Partners:
• Financial – Producers are concerned about the costs of national identification. • Ability to Maintain Confidentiality – Producers want assurances about who will have
155

10th Report to Congress on Agency Compliance with the Unfunded Mandates Reform Act
access to the data and how the data will be used. Their concern is that someone could use the data to harm them or their businesses.
• Flexibility – It is important that the national system be flexible enough to accept data from existing identification systems (particularly branding systems). Also, the system needs to be flexible enough to allow producers to use it for their herd management needs.
• Liability – Some participants voiced concerns that the NAIS information would be used by individuals (other than animal health authorities) for food safety issues and that traceability of food products would increase the participants’ risk of liability and financial loss from food safety issues for which they are not responsible.
Public and private funding will be required for the NAIS to become fully operational.
The integration of animal identification technology standards (electronic identification, retinal scan, DNA, etc.) will be determined by industry to ensure that the most practical options are implemented, and that new ones can easily be incorporated into the NAIS. The NAIS will store a limited amount of essential information, just enough for animal health officials to be able to track an animal’s movements and identify any other animals it may have exposed. Animal heath officials must have immediate, reliable, and uninterrupted access to this information in the event of a disease concern. Based on producer concerns about confidentiality of data, USDA is pursuing legislation to establish a system for withholding or disclosing information obtained through the animal identification system. USDA also considered information gained through consultations in developing a draft strategic plan and draft program standards for the NAIS. 4. Brucellosis Greater Yellowstone Area (GYA) Bison and Elk
How best to eliminate brucellosis in bison and elk in the Greater Yellowstone Area (GYA) is an on-going issue. Affected parties include producers of domestic livestock, State governments, and Federal Agencies. Each of these entities is represented on the Greater Yellowstone Interagency Brucellosis Committee (GYIBC). Governmental representatives to the committee include the States of Wyoming, Montana, and Idaho, as well as the Animal and Plant Health Inspection Service (APHIS), the Forest Service, the National Park Service, and the Department of the Interior.
In April 2004, APHIS held a public meeting to discuss brucellosis elimination planning for bison and elk in the GYA. In addition, consultation was carried out through regular meetings of the committee, which had previously developed the Yellowstone Bison Management Plan. The issue of how to best approach brucellosis elimination planning, including research, was discussed. Public and intergovernmental partners worked with the Federal Government to determine what research should be done as part of the plan.
The GYIBC is drafting a new Memorandum of Understanding for the operation of the GYIBC with the focus toward brucellosis elimination planning. 5. Develop and implement a National Aquatic Animal Health Plan (NAAHP) for Aquaculture
The National Aquatic Animal Health Task Force has members from the U.S. Department of Agriculture’s Animal and Plant Health Inspection Service, U.S. Department of Commerce’s
156

Appendix
National Oceanic and Atmospheric Administration National Marine Fisheries Service, and U.S. Department of Interior’s U.S. Fish and Wildlife Service. This task force is commissioned under the auspices of the Joint Subcommittee on Aquaculture, National Science and Technology Council’s Committee on Science, Office of the Executive. The task force assembles working groups of representatives from Federal, State, Tribal, and private organizations to obtain input from as many perspectives as possible.
Working groups convene to assist in developing the NAAHP. In FY 2004, the following four working groups met: (1) Roles and Responsibilities of Aquatic Animal Health Professionals; (2) Pathogens and Surveillance; (3) Laboratory Methodologies; and (4) Salmonids. At the working group meetings, concerns were expressed about adequate Federal funding for the program, the need for industry involvement in the plan, laboratory certification, and privacy with regard to testing results. The three Federal agencies responsible for aquaculture implemented a Memorandum of Understanding on the issuance of health certificates for the export of live aquatic animals. The Memorandum of Understanding delineates the responsibility of each agency in issuing export certificates. It also establishes mutual recognition, collaboration, and cooperation among the agencies in the issuance of aquatic animal health certificates for export.
After the working groups meet, the task force incorporates the appropriate information into draft chapters for the plan that the Joint Subcommittee of Agriculture and stakeholders review. Chapters of the NAAHP are being drafted; four draft chapters of the plan are available for comment. The goal is to complete the plan by June 2007, and the agency is on target for that date. When the plan is completed, implementation by Federal agencies will follow. Federal agencies will implement the plan through new regulations, laws, policies, research, education, and other nonregulatory initiatives. B. Department of Commerce Marine Conservation Working Group (MCWG) of Olympic Coast National Marine Sanctuary (Sanctuary)
The Olympic Coast National Marine Sanctuary (Sanctuary) and its Advisory Council, made up of local representatives, formed a study group to make recommendations to the Sanctuary concerning the conservation of marine life in the intertidal zone of the Sanctuary and the Olympic Coast National Park. The study group was called the Marine Conservation Working Group (MCWG). The Marine Conservation Working Group recommended the Sanctuary adopt a policy of establishing “no take” zones --prohibitions against the collection of shellfish and other living organisms--in various intertidal areas of Washington’s Olympic Peninsula, including areas traditionally used by several Indian tribes.
All users of the intertidal areas of the Olympic Coast including four treaty tribes (Hoh, Makah, Quilleute and Quinault), local residents, residents of the State of Washington and tourists visiting the area would be affected by the establishment of “no-take” reserves or areas along the beaches and coasts of the Peninsula.
157

10th Report to Congress on Agency Compliance with the Unfunded Mandates Reform Act
After the issuance of the final report and recommendations of the Marine Conservation
Working Group, negative comments were received from all four Indian tribal governments. Although the MCWG did not recommend the Sanctuary attempt to regulate the treaty tribes or in any way suggest that the “no take” reserves would apply to tribal members, the tribes were very concerned about the composition of the panel making the recommendations and the sanctuary’s encroachment into regulatory areas related to fishing management. Several staff level consultations between the Sanctuary and treaty tribes were held. In July, 2004, a policy director level meeting was held with policy representatives of all four treaty tribes.
The tribal governments expressed significant concern that the MCWG recommendations exceeded the authority of the Sanctuary and were not based on sound information and scientific data. In addition, the tribal governments felt the MCWG had not made the appropriate efforts to consult with the tribal governments or seek the participation of the tribes prior to developing their recommendations. Finally, the tribal governments objected to the Sanctuary promulgating any prohibition against the harvest of shellfish and other living resources from the inter-tidal zone because it would exacerbate public misunderstanding of the tribes’ treaty rights and uses of their traditional shellfish gathering areas.
After the policy director met with the relevant policy counterparts of the four tribal governments in July 2004, a complete review of the MCWG process was conducted. In response to the concerns of the tribal governments and as a result of the policy level review, the Sanctuary decided to withdraw the MCWG report and its recommendations from consideration by the Sanctuary. In addition, the Sanctuary decided to revisit the entire scope of the issues presented by conservation needs in the inter-tidal zone through a broader and more inclusive process during sanctuary management plan review. The Sanctuary is presently negotiating a formal process for participation of the tribal governments in management plan review. C. Department of Education Title I of the Elementary and Secondary Education Act of 1965, as amended by the No Child Left Behind Act of 2001 (Final Rule)
On December 9, 2003 (68 FR 68698), the Department issued a final regulation under Title I of the Elementary and Secondary Education Act of 1965, as amended by the No Child Left Behind Act of 2001. This regulation offers flexibility in meeting the law’s goals for including students with disabilities in state assessment and accountability systems. Specifically, this new regulation permits states to develop alternate achievement standards to measure the progress of students with the most significant cognitive disabilities, and to use students’ scores based on those standards in determining the adequate yearly progress (AYP) of schools and school districts.
This regulation addressed an issue that was a significant challenge in implementing the No Child Left Behind Act, namely how to measure the academic progress of students with the most significant cognitive disabilities. This regulation affects state educational agencies, local
158

Appendix
school districts, public elementary and secondary schools, and students with the most significant cognitive disabilities. ED published two notices of proposed rulemaking on August 6, 2002 (67 FR 50986) and March 23, 2003 (68 FR 13796), and took public comments on the proposed regulations which were taken into consideration in developing the final regulations.
ED received many comments on various aspects of this regulation, including the use of alternative assessments, the definition of “students with the most significant cognitive disabilities,” and the one-percent cap and the relationship of this regulation to the Individuals with Disabilities Education Act (IDEA). In response to the public comments, ED made a number of changes and clarifications to this regulation. The Department removed the proposed definition of “students with the most significant cognitive disabilities,” but added new provisions to ensure that the flexibility to use alternate achievement standards for a small population of students is exercised appropriately. The Department also clarified how the one-percent cap is computed and how the regulation is consistent with the requirements of the IDEA. D. Department of Health and Human Services 1. Health Insurance Flexibility and Accountability (HIFA)
In August 2001, the President announced a new Medicaid section 1115 waiver approach called the Health Insurance Flexibility and Accountability (HIFA) initiative, which makes it easier for states to expand coverage to the uninsured. The HIFA initiative enables states to use Medicaid and unspent State Children’s Health Insurance Program (SCHIP) funds in concert with private insurance options to expand coverage to low-income uninsured individuals. The goal of the HIFA initiative is to create a Federal framework that encourages state innovation to improve health insurance options.
Waiver requests must be submitted by a state’s Medicaid/SCHIP agency. Thus, HHS’s Centers for Medicare and Medicaid Services (CMS) works primarily with state agencies on the HIFA initiative, although CMS requires states to consult with the public (including Tribes) in the development of HIFA proposals. CMS has designed a user friendly, electronic HIFA template that is available on the CMS website.
CMS has been involved in pre-application discussions with many states about HIFA proposals, and is currently reviewing three formal HIFA applications. CMS has approved eleven HIFA waivers. Consultation occurs through conference calls, concept papers, correspondence, and throughout the review of formal HIFA proposals.
In the midst of fiscal crises, some states have raised concerns about CMS’ policy that HIFA demonstrations must include some expansion to previously uninsured individuals. Concerns have also been raised by other partners about reducing benefits to persons previously eligible under the State’s Medicaid plan through a HIFA demonstration.
As of July 1, 2005, there are eleven approved HIFA initiatives. Through consultation and technical assistance provided throughout the approval process, states have been able to
159

10th Report to Congress on Agency Compliance with the Unfunded Mandates Reform Act
administer their Medicaid/SCHIP programs in more flexible ways to meet the needs of their citizens more effectively, at no additional cost to the Federal government. Through consultation and technical assistance, CMS has worked to expedite the review process and reach closure in a timely way about HIFA concepts and proposals. 2. Independence Plus (Medicaid Initiative)
Independence Plus is a Medicaid initiative, promoting individual or family choices regarding the selection of long-term care support and services provided in the home. Notice of the two Independence Plus template applications, for Section 1915 (c) Medicaid waivers and for Section 1115 demonstrations, appeared in the Federal Register on May 13, 2002. Public comment on the template applications was accepted until July 1, 2002.
The Independence Plus Initiative affects States, advocacy organizations, providers, elders and persons with disabilities of all ages. Between October 2002 and September 2003, input to the Independence Plus template applications and/or the Independence Plus Draft Technical Guide was received from all of these parties in response to the Federal Register notice, and also from surveys, technical assistance meetings and conferences.
CMS answered ongoing questions about the Independence Plus template applications after July 1, 2002 via two self-directed web sites. CMS received input to the Draft Independence Plus Technical Guide from stakeholders and continues to provide continuous technical assistance to states interested in pursuing Independence Plus applications, and the agency receives continuous feedback at meetings and conferences.
The various stakeholders desired more clarity and greater guidance with respect to the Independence Plus program requirements. As a result, CMS developed, effective in the Spring of 2005, a new waiver application and new instructional guidance materials in response to these public and intergovernmental comments. 3. Health Status Disparities Affecting American Indians and Alaska Natives
HHS and Indian Tribes share the goal of eliminating health and human service disparities among American Indians and Alaska Natives, and of ensuring that access to critical health and human services is maximized. To achieve this goal, and to the extent practicable and permitted by law, it is essential that Federally recognized Indian Tribes and HHS engage in open, continuous, and meaningful consultation. The importance of such consultation was affirmed through a 2004 Presidential Memorandum.
During Fiscal Year 2004, HHS leadership worked closely with Indian tribal governments
and tribal organizations, such as the National Congress of American Indians, the National Indian Health Board, the Tribal Self-Governance Advisory Committee, the American Indian Higher Education Consortium, the National Indian Child Welfare Association, and the National Council on Urban Indian Health, as well as a number of locally-based governmental and non-governmental tribal groups.
160

Appendix
Consultation with Indian tribes took the following diversity of forms at HHS during FY 2004:
• Annual Tribal Budget Consultation Sessions. HHS agencies engage Tribes in an annual conversation about budget priorities. Through this process, Tribes have been able to state their funding priorities to HHS. On May 12-13, 2004, HHS held its Sixth Annual Budget Consultation Session. This session was expanded to one and one-half days at the request of tribal leaders and provided the opportunity for Tribes to discuss their health and human services priorities with HHS officials. As a result, financial support for Tribal programming has increased by 5% each year for the past three years, and funding has been able to be targeted to those areas of greatest need, as defined by Tribes.
• Regional Tribal Consultation Sessions. In 2004, HHS Regional Directors coordinated
five regional Tribal consultation sessions. Some of these sessions were held concurrent with the Indian Health Service Area Budget Consultation Sessions and all were coordinated with IHS Area Directors and supported by IGA.
• Visits to Indian Country. In FY 2004, both Secretary Thompson and Deputy Secretary
Allen traveled to Indian County for a combined total of eight trips. Each has sought the opportunity to meet with tribal leaders and listen to their concerns and priorities. Trips included visiting tribes in Alaska, Montana, South Dakota, Arizona, Colorado, New Mexico, Florida, Maine, Mississippi and Alabama.
• Department-wide and IHS Consultation Policy Revision. In 2004, the Department’s
Office of Intergovernmental Affairs, in partnership with the Indian Health Service, undertook a review of the current Tribal Consultation Policies for the Secretary’s Department-wide guidance to all HHS Divisions and the IHS Tribal Consultation Policy. This review involved a Tribal Consultation Policy Revision Workgroup, comprised of Tribal leaders and representatives from throughout the country. During 2004, the Workgroup met a number of times in person and via conference call to review and recommend revisions to both policies. Former Secretary Thompson signed the revised HHS Tribal Consultation Policy in January, 2005, and Secretary Leavitt issued the policy in March, 2005. Divisions of the Department are now tailoring their own policies to be consistent with the revised consultation policy.
• ACF Consultation Sessions: All programs managed by the Department’s Administration
for Children and Families (ACF) participated in the a Tribal Consultation in Phoenix in December 2003. ACF invited all tribal communities, Native non-profits, and urban Indian centers to participate in this first-ever agency wide tribal consultation session.
• Administration on Aging (AoA) Listening Sessions: AoA held three Tribal Listening
Session consultation meetings during FY 2004 to provide an opportunity for Tribal leaders, health and human services program staff, and AoA to engage in discussions and consultation on issues that impact the lives of older American Indians, Alaska Natives and Native Hawaiians.
161
10th Report to Congress on Agency Compliance with the Unfunded Mandates Reform Act
• Centers for Medicare and Medicaid Services (CMS) Tribal Technical Advisory Committee (TTAG) During 2004, TTAG met in-person three times in Washington, D.C. at HHS Headquarters. Key issues discussed at these sessions included issues for TTAG operations with a major focus on implementation of the Medicare Modernization Act, as well as numerous Medicaid issues.
• Federal-Tribal-State Human Services Intergovernmental Collaboration In October
2003, the Secretary partnered with the National Congress of American Indians (NCAI) and the American Public Human Services Association (APHSA), to work collectively on human services priorities and issues and to share information, best practices and promising approaches for more efficient and effective service delivery.
The highest priority identified at all tribal consultation sessions was the need to increase
resources for Indian tribes. In addition, tribes sought increased access to HHS programs and health services, enhanced consultation and communication with HHS, and recruitment and retention of care providers. Tribes also expressed specific interest in health promotion and disease prevention, Medicare and Medicaid, emergency preparedness and homeland security, health and human service facilities construction, and reauthorization of the Indian Health Care Improvement Act.
• Improved Tribal Access to HHS Resources. In 2004, HHS resources that were provided to tribes or expended for the benefit of tribes increased to approximately $4.55 billion. This is an increase of approximately $195 million or 4.5% over the 2003 amount of $4.35 billion. The increase came in both appropriated funding as well as increased tribal access to non-earmarked funds and increases in discretionary set asides.
• Grant Access Study. HHS funded a study in September 2004 that was designed to
identify the barriers tribes experience when applying for HHS grants, and to provide recommendations on how to eliminate those barriers. The Intradepartmental Council on Native American Affairs (ICNAA) found Indian Tribes and Tribal organizations were not fully accessing programs for which they were eligible and instructed the Council staff to conduct further study of the barriers Indian tribes and tribal organizations were encountering to access HHS grants. The study was completed by a Council workgroup. In addition, the Office of Intergovernmental Affairs consulted with Indian tribes and tribal organizations and received a significant number of Tribal leaders’ comments regarding what they believed were barriers to HHS grants. The preliminary report from the ICNAA Workgroup verified that in-depth analysis was required, and it is currently underway.
• Tribal access to SAMHSA Grants. In September 2004, the Administrator of HHS’s
Substance Abuse and Mental Health Services Administration (SAMHSA) established a policy that tribal entities are to be eligible for all grants in which States are eligible unless there is a compelling reason to the contrary (such as legislative restrictions, as apply to the Agency's Block Grants). Any exclusion of tribal entities from grant eligibility needs to be justified and approved by the Administrator.
162

Appendix
• Final Rule for Tribal Child Support Enforcement (IV-D) Programs. On April 1, 2004, the Department issued a final rule for Tribal Child Support Enforcement. The rule provides guidance to Tribes and Tribal organizations on how to apply for and, upon approval, receive direct funding for the operation of Tribal IV-D programs. Under these regulations, Tribes exercise their inherent sovereignty by deciding whether to operate a Tribal IV-D program. Tribes that choose to administer a Tribal IV-D program must operate programs capable of meeting the statutory objectives of Title IV-D, but will have the opportunity to consider their unique circumstances, and to develop and administer programs consistent with Tribal laws and traditions. This responds to the Tribes’ desire to increase flexibility for addressing local community needs.
E. Department of Homeland Security 1. TSA Regulations for Commercial Drivers with Hazardous Materials Endorsements
During fiscal year 2005, the Transportation Security Administration (TSA) of the Department of Homeland Security (DHS) issued two regulations that require commercial drivers with hazardous materials endorsements to undergo security threat assessments. Because both rules had significant impact on individual state governments, TSA engaged in consultations with the States during the development of these regulations.
The Security Threat Assessment for Individuals Applying for a Hazardous Materials Endorsement for a Commercial Driver’s License rule was issued on November 24, 2004 and requires commercial drivers with hazardous materials endorsements to undergo security threat assessments. The Hazmat Fee Rule was issued on January 13, 2005 and funds the aforementioned threat assessment rule through user fees. The primary governmental entities affected by these rules are State Departments of Motor Vehicles (DMVs).
TSA held working group meetings with State Departments of Motor Vehicles throughout this rulemaking, a period of approximately 2 years. Some of the meetings took place in Washington, D.C. and some involved the TSA program staff visiting State DMV offices. In addition, TSA held conference calls periodically with the State DMVs. TSA continues to consult regularly with the States on how the program implementation is going, any difficulties they are having with the new computer and software systems, and interpretive questions about the rule.
States commented that they needed extra time to implement the requirements of the regulations, so the agency issued extensions of time for the start date of fingerprint-based criminal history records checks. Additionally, several States were concerned they would not be able to meet the requirements for fingerprint collection and transmission to TSA and the FBI, so the agency developed an alternative whereby States could opt to allow a representative of TSA to collect all fingerprints and fees to be transmitted to TSA. TSA also did not require State DMVs to develop new connectivity to TSA; instead, the agency allowed electronic transmission of fingerprints through the Commercial Drivers License Information System. TSA also accepted information in alternate forms for a short period of time after the interim rule was published. Additionally, after several State agencies and drivers requested flexibility for hazardous material
163

10th Report to Congress on Agency Compliance with the Unfunded Mandates Reform Act
endorsement (HME) holders who must transfer the HME to a new state of residence, TSA amended the rule to permit the States and a transfer HME applicant to complete one security threat assessment during the period that the HME is valid. This amendment obviated the requirement that drivers moving from state to state receive redundant security threat assessments. Additionally, States requested relief from a provision in the rule under which the State could not issue a 90-day extension for the expiration of an HME for drivers transferring from another State; in response, TSA issued an exemption under which States may issue an extension of the expiration of an HME for drivers transferring from another State. Additionally, several States asked TSA to review State criminal records that are not included in the Federal criminal history records and that TSA could not easily access in completing a security threat assessment; TSA agreed to consider State criminal records that are not part of the Federal criminal history database, if the State submits the records to TSA with the applicant information. 2. TSA Regulations for Commercial Drivers with Hazardous Materials Endorsements
The REAL ID Act of 2005 (Pub. Law 109-13) is intended to improve security for drivers’ licenses and personal identification cards issued by states that are intended for use for Federal identification purposes. The Act prescribes certain requirements for documents issued by States as drivers’ licenses and other identity documents that the Federal Government may accept for official purposes.
The REAL ID Act repeals an earlier statutory provision (section 7212 of the Intelligence Reform and Terrorism Prevention Act of 2004 (IRTPA), Pub. Law 108-458) that authorized the Department of Transportation (DOT) to promulgate standards for drivers’ licenses and state-issued identification cards. Under the IRTPA, DOT was required to implement the drivers’ license requirements through negotiated rulemaking, and had involved representatives from numerous state agencies in a working group. The working group was disbanded in May 2004 when the REAL ID Act was enacted.
The REAL ID Act now vests DHS with the authority to issue regulations, set standards, and issue grants as necessary to meet the requirements of the Act. DHS is directed to consult with DOT and the States in issuing any regulations, setting standards or providing grants under the Act.
All state motor vehicle agencies will be affected as will state homeland security offices. In the discussions which have been held thus far, state homeland security advisers emphasized the importance of consulting with the states. In addition, questions were raised about the costs which would be born by the states as the REAL ID Act is implemented.
DHS currently is conducting a working group to develop regulations to implement the drivers’ license standards under the REAL ID Act and will continue to consult with States on these regulations. The DHS Office of State and Local Government Coordination has held two separate conference calls with state homeland security advisors. During these calls, state officials were briefed on the REAL ID Act.
DHS is continuing internal discussions on how to proceed with the implementation of the
164

Appendix
REAL ID Act. In the near future, DHS plans to begin extensive consultations with state officials. DHS anticipates consulting with the many of the same state officials who were involved in the DOT process, as well as others. Moreover, DHS will rely heavily on these consultations and the views of the states as it works to carry out its mandate under the Act. F. Department of Justice Community Oriented Policing Services (COPS)
Information sharing between the COPS Office and state, local, and tribal law enforcement agencies promotes community policing knowledge and addresses emerging concerns within the law enforcement field.
State, local and tribal law enforcement agencies are all affected by the continuing demands placed on them with regard to community policing, crime prevention, homeland security, ethics and integrity. Gaining access to this information in the most efficient and cost effective way is of paramount importance.
COPS has a history of working closely with state, local, and tribal agencies. Since its inception in 1994 through the Violent Crime Control Act, COPS has consulted regularly with professional law enforcement organizations, such as the International Association of Chiefs of Police, National Sheriffs Association, the Police Executive Research Forum, and the Police Foundation on current issues facing law enforcement. COPS also maintains regular contact with intergovernmental organizations such as the U.S. Conference of Mayors, the National League of Cities, and the National Association of Counties, which provide the perspective of local government on law enforcement issues. Throughout the last ten years, COPS has conducted research and evaluations with local police departments to identify barriers and challenges to their implementation of community policing. COPS’ consultation with state and local government is reflected in the training provided through the Regional Community Policing Institutes, best practices publications and other problem-specific guides, and targeted initiatives. COPS Office representatives attend conferences, meetings and workgroups throughout the year, and host one-on-one meetings with law enforcement officials to remain current on the issues and concerns facing agencies today and to put in place any policies or programs that may help address such needs.
During conferences, meetings and workgroups, COPS has made efforts to reach more participants than can be represented on site at such events. In an effort to reach a broader audience of practitioners and interested parties, the COPS Office implemented a policy of providing information on a wide range of topics through electronic means. Webcasts and conference calls were established to address emerging needs and reach a maximum number of agencies with little or no cost to those agencies.
The 2004 COPS National Policing Conference provided valuable information to those who attended in person. However, if individuals or groups were unable to attend, they had the opportunity to participate in part of the conference. By logging into a designated webcast
165

10th Report to Congress on Agency Compliance with the Unfunded Mandates Reform Act
(similar to a TV show broadcast over the Internet), internet participants joined 1,500 law enforcement officers, local government leaders, and community members for a discussion on Use of Force issues and how they could affect departments’ relationships with the community. Based on the success of this webcast, the COPS Office has planned additional webcasts to address issues of ethics and integrity as well as hot topics identified by law enforcement practitioners.
In September 2004, the Office of Community Policing Services (COPS Office) hosted eight conference calls on the serious and growing problem of identity theft. COPS teamed with the Criminal Division of the U.S. Department of Justice, the Federal Trade Commission, and Johns Hopkins University in this important endeavor.
The COPS Office has continued conference calls and partners with other agencies, such as the National Sheriff’s Association, the Office of Victims of Crime, the Office of Violence Against Women and the National Center for Victims of Crime helping to expand and diversify the audiences reached. G. Department of Labor Defining and Delimiting the Exemptions for Executive, Administrative, Professional, Computer and Outside Sales Employees (Final Rule)
On April 23, 2004, the Department of Labor published revised final regulations 29 C.F.R. Part 541, “Defining and Delimiting the Exemptions for Executive, Administrative, Professional, Computer and Outside Sales Employees” (69 FR 22122). These regulations are issued pursuant to Section 13(a)(1) of the Fair Labor Standards Act (FLSA). This section exempts, from both minimum wage and overtime pay, bona fide executive, administrative, professional, and outside sales employees, and employees in certain computer-related occupations, as these terms are defined in regulations issued by the Secretary of Labor pursuant to the Administrative Procedure Act. To qualify for exemption, employees must meet minimum tests related to their primary job duties and, in most instances, must be paid on a salary basis at minimum amounts as specified in pertinent sections of the regulations. The revised regulations were effective on August 23, 2004. Employees who do not meet the exemption criteria (and any other FLSA exemption) must be paid in compliance with the FLSA’s minimum wage and overtime pay requirements.
Over 87,400 State and local governmental entities are potentially affected by this rule (3,043 county governments, 19,372 municipal governments, 16,629 township governments, 34,683 special district governments, and 13,726 school district governments). Nationwide, these entities receive more than $1.5 trillion in general revenues, including revenues from taxes, some categories of fees and charges, and intergovernmental transfers. Their direct expenditures exceed $1.6 trillion in the aggregate. State and local governments employ more than 16.7 million workers and their payrolls exceed $472.9 billion.
Stakeholder meetings to address concerns over these regulations occurred in 2002 prior to issuing the proposed rule in March 2003. The Department invited numerous organizations
166

Appendix
representing State, local and tribal governments to the Department’s stakeholder consultations but only some chose to respond or attend. The Department specifically requested that public comments be submitted on any issues of concern to public employees and public employers for consideration during the notice-and-comment rulemaking process.
The International Personnel Management Association, accompanied by the National Public Employers Labor Relations Association and the U.S. Conference of Mayors, suggested in stakeholder meetings that progressive discipline systems are common in the public sector (some collectively bargained) and the “salary basis” rule for exempt workers, which prohibits disciplinary deductions except for violations of safety rules of major significance, threatens such systems. The Interstate Labor Standards Association (ILSA) submitted written views suggesting that the minimum salary threshold for exemption should be indexed to the current minimum wage or some multiple thereof (e.g., three times the minimum wage for a 40 hour workweek or $618 per week). One additional idea was to relate the salary levels to those of the supervised employees.
Many State and local public employers and employees submitted public comments on particular aspects of the proposed rule. State and local governments expressed concern over their ability to absorb perceived increased costs that they attributed to the proposed revisions. Some were particularly concerned that they would be forced to reclassify currently exempt executive managers and supervisors as no longer exempt due to the regulatory stipulation that bona fide exempt executive employees must have the authority to hire or fire other employees, or have their suggestions and recommendations as to the change of status of other employees given “particular weight.”
In response to concerns that the “salary basis” rule adversely affected progressive discipline systems in the public sector, the Department proposed one additional exception to the no pay-docking rule to permit deductions from pay for full-day disciplinary suspensions for reasons such as sexual harassment or workplace violence (e.g., full-day suspensions without pay for serious misconduct in the workplace). The final rule retained the proposal with minor changes to indicate more clearly that the disciplinary policy must be applicable to all employees.
In response to public sector concerns expressed in the public comments, the preamble to the final rule explains how the “hire or fire” requirement for exempt executives applies in the public sector. Specifically, the final rule now clarifies that an exempt “executive” does not have to possess full authority to make the ultimate decision about an employee’s change in status. This authority could rest with a higher level manager or a personnel board. Also, the final rule explains that the “hire or fire” requirement includes other types of important employment actions (e.g., deciding not to promote an employee, or reassigning an employee to a different job with significantly different responsibilities). Because public sector supervisory employees provide recommendations that are given “particular weight” on hiring, firing or other important personnel decisions, these supervisors can continue to be classified as exempt.
167

10th Report to Congress on Agency Compliance with the Unfunded Mandates Reform Act
H. Department of Transportation Federal Motor Carrier Safety Administration’s (FMCSA) 1. Hazardous Materials Safety Permit Regulations: Transport of Hazardous Materials (Final Rule)
FMCSA’s hazardous materials safety permit regulations [49 CFR Part 385, Subpart E] establish requirements for obtaining and maintaining a Federal safety permit to transport certain hazardous materials in intrastate, interstate or foreign commerce.
By law (49 U.S.C. § 5109), FMCSA was required to institute a Federal hazardous materials safety permitting program. The affected parties are approximately 3,131 motor carriers that transport, or cause to be transported, certain high hazardous materials in intrastate, interstate or foreign commerce. States have a separate permitting process for motor carriers to transport hazardous materials within the State. Pursuant to 49 U.S.C. § 5119, the agency was also charged with establishing uniform procedures and forms for the State registration process.
The agency established The Alliance for Uniform HazMat Transportation Procedures (the Alliance) comprised of State and local government officials to make recommendations to DOT with respect to uniform forms and procedures for State hazardous materials safety permitting. The Alliance conducted a 2-year pilot project in four States (Minnesota, Nevada, Ohio and West Virginia) of a “base-State” reciprocal system called the Uniform Program for the registration and permitting of hazardous material transporters. In its July 9, 1996 notice, the agency: (1) summarized the Federal permit and registration requirements in the Federal hazardous material transportation law, (2) discussed the activities and recommendations of the Alliance, and (3) invited comments on the Alliance’s final report and recommendations. In a March 31, 1998, supplemental notice, the agency discussed the comments to the 1996 notice, directing a series of additional questions to State agencies and motor carriers. Eleven States responded to the notice but they did not reach a clear consensus on the direction the agency should take.
DOT has asked Congress to amend or repeal section 5109 three times since 1997 because many States have different permitting requirements for carriers of hazardous materials and because the agency believed it had appropriate safety monitoring systems in place to address unsafe carriers transporting these materials. Congress has not eliminated the statutory requirement for a Federal safety permit. Subsequently, the agency published and requested comments on another supplemental notice of proposed rulemaking announcing its Federal hazardous materials safety permitting process required under 49 U.S.C. 5109 (August 19, 2003). The agency considered comments from all of the above issuances in developing the June 30, 2004 final rule.
The Alliance’s pilot project raised additional concerns related to unnecessary preemption and expenses of a parallel Federal permitting system. Carriers complained the 2-hour communication requirement and the provision requiring a communications system to be installed on each motor vehicle used to transport high hazardous materials would present logistical problems and be overly burdensome to the industry.
168
Appendix
FMCSA recognizes the authority of States to implement hazardous materials permits.
For the materials covered by FMCSA’s safety permitting program, States are preempted only if implementing a program with more stringent operational requirements than prescribed under the Federal hazardous materials permitting program. If a State’s program is equivalent to the Federal program, then FMCSA will issue a safety permit based on the successful issuance of the comparable State permit. The Alliance States (IL, MI, MN, OH, OK, NV and WV) continue to use the Uniform Program developed under section 5119 for the registration and permitting of hazardous materials transporters. These States are amending aspects of their permitting program to attain equivalent status with the Federal hazardous materials safety permitting program. The target date for equivalency is January 2006.
In response to complaints regarding the communication requirements, FMCSA revised its policy to require companies to develop a communications plan requiring at least two calls per day. The requirement for an on-board communications system in each vehicle has been removed and may be revisited upon completion of the Field Operational Test initiative and the HM-232A rulemaking conducted by the Pipeline and Hazardous Materials Safety Administration. 2. Parts and Accessories Necessary for Safe Operation; Fuel Systems (Final Rule)
On June 3, 2004, FMCSA published its final rule entitled, “Parts and Accessories Necessary for Safe Operation; Fuel Systems.” The final rule revised the requirements concerning fuel tank fill rates for gasoline- and methanol-fueled light-duty vehicles contained in Subpart E of the Federal Motor Carrier Safety Regulations (FMCSRs).
FMCSA’s primary mission is to prevent commercial motor vehicle (CMV)-related fatalities and injuries. Agency activities contribute to ensuring safety in motor carrier operations through strong enforcement of safety regulations, targeting high-risk motor carriers and CMV drivers, improving safety information systems and CMV technologies, strengthening CMV equipment and operating standards, and increasing safety awareness. To accomplish these activities, the FMCSA works with Federal, State, and local government and enforcement agencies, the motor carrier industry, labor organizations, safety interest groups, and other interested parties. In this particular instance, the FMCSA coordinated with the Environmental Protection Agency (EPA), the National Highway Traffic Safety Administration (NHTSA), and two manufacturers of CMVs subject to the regulations of these three agencies.
The consultation process for this rule began in the late 1990s, when the agency was petitioned to grant relief from a provision of the FMCSRs requiring a minimum fuel fill rate for all CMVs subject to its jurisdiction. The fuel tanks of these vehicles are mounted between the frame rails and the fill pipe system is routed to minimize its exposure in the event of a crash. Because of the design characteristics of the fuel fill-pipe and system and the vapor generated when filling such tanks with gasoline, the two manufacturers found that the fuel systems in the gasoline versions of these light-duty vehicles could not meet the FMCSA requirement for the 20 gallon per minute fill rate, and thus also could not display a required certification label. Both companies filed applications for limited exemptions from these fuel system requirements in 1999. After opportunity for notice and comment, the agency granted those petitions for
169

10th Report to Congress on Agency Compliance with the Unfunded Mandates Reform Act
exemption. After a second pair of opportunities for notice and comment, the agency renewed the exemptions in 2001 and 2002.
During the process of reviewing the applications for the second renewal, the FMCSA learned that, between 1993 and 2000, the EPA had issued four final rules under title 40 of the Code of Federal Regulations (CFR) relevant to the fuel-tank fill rate issue. They address the reduction of emissions from vehicle fueling, through controls on the dispensing rate of gasoline and methanol pumps. The rules specify the rate at which gasoline and methanol fuels can be accepted into the tanks of certain vehicles, the ability of the vehicle fuel systems to safely handle vapors released during fueling, and the ability of the fuel systems to safely prevent any spitback of fuel during the fueling process. The changes in the EPA regulation created an inconsistency between the fuel tank fill rate requirements of FMCSA and those of the EPA.
In addition to the revision to the fuel tank fill rate requirements, FMCSA proposed to place in the FMCSRs previously published FMCSA regulatory guidance concerning the applicability of Federal Motor Vehicle Safety Standard (FMVSS) 301 (Fuel System Integrity) to CMVs that have a Gross Vehicle Weight Rating (GVWR) of 10,000 lbs or less. In addition to the concern raised about the vehicles manufactured by the two companies, there is another family of vehicles that fall under the definition of CMV: passenger vehicles designed or used to transport between 9 and 15 passengers (including the driver), in interstate commerce, and similar vehicles carrying placardable amounts of hazardous materials. The existing regulatory guidance, published on April 4, 1997 (65 FR 16369, at 16417), states that FMVSS 301 adequately addresses the fuel systems of such placarded motor vehicles with a GVWR of less than 10,001 pounds, and that compliance with Subpart E of part 393 would be redundant. However, CMVs that are not covered by FMVSS 301 must continue to comply with Subpart E of Part 393. Thus, motor vehicles that meet the fuel system integrity requirements of 49 CFR § 571.301 would be exempt from the requirements of FMCSA Subpart E of Part 393
When the FMCSA determined it would be appropriate to explore a regulatory approach to addressing these two matters, it consulted informally with EPA and NHTSA. The agency also solicited public comments in a notice of proposed rulemaking, published November 12, 2003.
The National Automobile Dealers Association supported the proposal, particularly the reference to the FMVSS 301 requirements. One of the vehicle manufacturers who had submitted the petition requested FMCSA consider a simplified reference to its vehicles that would be covered under the proposed rule. FMCSA revised its regulation, 49 CFR § 393.67 Liquid Fuel Tanks, to exempt from FMCSA’s requirement those motor vehicles that meet the fuel system integrity requirements of 49 CFR § 571.301 [NHTSA regulation]. The FMCSA also revised its regulations concerning fuel tank fill rates to bring them into conformity with the EPA regulations.
Overall, effective coordination of all interested parties involved in this process helped to ensure FMCSA’s safety regulations are in appropriate conformity with the safety and environmental regulations of other agencies.
170

Appendix
3. Environmental Procedures for Implementing the National Environmental Policy Act of 1969
On March 1, 2004, FMCSA published its final Order to establish environmental procedures for implementing the National Environmental Policy Act of 1969 (NEPA) (42 U.S.C. § 4321, et seq., as amended (See 69 FR 9680; effective March 30, 2004). The agency developed its own environmental procedures not only to comply with NEPA, but to correspond with the Council on Environmental Quality (CEQ) regulations (40 CFR parts 1500-1508), DOT Order 5610.1C, as amended, and other pertinent environmental regulations, Executive Orders, statutes, and laws for considering environmental impacts of FMCSA actions as well.
The agency consulted with several Federal agencies to develop its environmental procedures, such as CEQ, DOT, the Federal Highway Administration (FHWA), the Department of Justice (DOJ), the Environmental Protection Agency (EPA) and the Bureau of Indian Affairs. FMCSA also solicited comment on its draft environmental procedures (September 26, 2003; 68 FR 55713), where it addressed the concerns of Federal, State and local governments, Indian tribes, organizations, associations and private parties concerning its proposal. As a result of the consultation process, FMCSA addressed these concerns and adopted many of the suggested changes to the Order, where warranted, to reach a clear consensus on the form and content of the agency’s environmental procedures.
Public Citizen raised several questions regarding the outdated nature of FMCSA’s air quality analysis in Appendix 14. EPA suggested that FMCSA expand its list of affected parties who must be notified in writing and invited to participate in the NEPA process for all FMCSA actions not categorically excluded. EPA also suggested alternative wording for identifying extraordinary circumstances and sought clarification to the Order’s Appendix 2, entitled “Categorical Exclusions (CE).”
FMCSA revised and updated Appendix 14 to reflect current EPA regulations and guidance on air quality analyses. The agency revised the Order by restating the EPA regulations regarding applicable exemptions to the general conformity review requirement. FMCSA clarified its guidance so that conformity analyses will be shown for all National Ambient Air Quality Standards criteria pollutants and not be limited to carbon monoxide only. The agency also revised the procedures for developing conformity determinations, and offsets or mitigation, to reflect current EPA guidance and regulations.
In response to EPA’s request for change and clarification of the agency’s Environmental Documentation section, FMCSA adopted EPA’s suggestion to expand the list of affected parties who must be notified in writing and invited to participate in the NEPA process to “known affected private parties amongst the invitees.” FMCSA also adopted EPA’s suggested alternative wording for identifying extraordinary circumstances and removed two CEs because FMCSA had insufficient information to justify including them in the Order.
Overall, effective coordination of all interested parties involved in this process helped to ensure FMCSA actively incorporates environmental considerations into its decision-making process.
171

10th Report to Congress on Agency Compliance with the Unfunded Mandates Reform Act
I. Environmental Protection Agency Consultation Mechanisms, General Outreach Activities and Communication Aids
The Environmental Protection Agency uses several mechanisms to help State, local and Tribal officials learn about EPA’s regulatory plans and to let them know how they can engage in the rule-development process. For example, EPA distributes reprints of the semi-annual Regulatory Agenda to more than 300 State, local and Tribal government organizations and leaders. EPA also participates in a Federal government-wide State and local Governments Web site. In addition, it supports hotlines in both EPA Headquarters and the Regions where callers can get information on several topics, including regulatory and compliance information (further discussion of these communication aids below).
In 1993, EPA chartered a cross-media advisory body under Federal Advisory Committee Act, the Local Government Advisory Committee (LGAC). Supported by resources from the Office of Congressional and Intergovernmental Relations, the LGAC is composed primarily of elected and appointed local government officials from communities across the nation. Committee members provide advice and recommendations that assist the EPA in developing a stronger partnership with local governments – a partnership that ultimately yields improved state and local government capacity to provide environmental programs and services. Likewise, the Small Community Advisory Subcommittee (SCAS), an independently-appointed subcommittee of the LGAC, routinely advises the Agency on issues and concerns facing smaller U.S. communities, and provides recommendations on regulations, policies, and guidance affecting the environmental services they depend on.
The LGAC/SCAS meets approximately three times per year, and provides the Agency with recommendations and advice on:
• Changes needed to allow flexibility and innovation to accommodate local needs without compromising environmental performance, accountability or fairness;
• Ways to improve performance measurement and speed dissemination of new
environmental protection techniques and technologies among local governments;
• Improvements to program management and regulatory planning and development processes by involving local governments more effectively as partners in environmental management
• Projects to help local governments deal with the challenge of financing environmental
protection infrastructure
The Tribal Operations Committee similarly addresses Tribal interests. Program offices regularly work with groups of State, local, and Tribal officials to address specific environmental and programmatic issues. Examples include media-specific FACA committees, regulatory negotiation advisory committees, and policy groups.
172

Appendix
EPA and States share responsibility for implementing national environmental programs,
and success in meeting the nation’s environmental goals depends on effective EPA-State partnerships. Since 1995, EPA has been working with States to build the National Environmental Performance Partnership System (NEPPS), a collaborative, results-oriented system for environmental management that has become the predominant way in which EPA and States work together to deliver environmental programs. Under NEPPS, EPA and States set priorities and design and implement strategies for achieving environmental and public health goals together. The joint Partnership and Performance Work Group, comprised of EPA leaders and high-level State officials drawn from the membership of the Environmental Council of the States (ECOS), leads the effort to build performance partnerships and provides an ongoing forum for raising and resolving policy and implementation issues and improve joint planning. EPA also consults with ECOS, the only national organization representing the State environmental commissioners, on the full range of program and policy matters affecting States.
EPA continues to work with States under the National Environmental Performance Partnership System (NEPPS), principally through the Environmental Council of the States (ECOS) whose objective is to increase States' participation in Agency activities, particularly those affecting State-implemented programs. Committees consisting of both State and EPA members perform most of this work through forums that are open to other stakeholders. EPA and the ECOS have an active joint workgroup to address continuing implementation issues and to identify and remove remaining barriers to effective implementation of NEPPS. ECOS has also launched several other consultation projects with EPA including work on children's health issues, a partnership to build locally and nationally accessible environmental systems, and development of core performance measures. The Office of Prevention, Pesticides and Toxic Substances (OPPTS)
The Office of Prevention, Pesticides and Toxic Substances (OPPTS) has several continuing outreach mechanisms related to its mission that allow OPPTS routinely to secure State and Tribal insights and advice on issues related to the implementation of OPPTS' role in protecting public health and the environment from potential risk from toxic chemicals.
OPPTS' Office of Pollution Prevention and Toxics (OPPT) created the Forum on State Tribal Toxics Action (FOSTTA) in the early 1990s as a vehicle to encourage State and Tribal involvement in OPPT decision making. OPPT is working to ensure appropriate and adequate State and Tribal representation at the FOSTTA meetings. In recent years, OPPT established a Tribal program to communicate its programs and activities with Native American Indian Tribes more effectively, to build more productive partnerships with Tribes to safeguard and protect the environment from toxic hazards, and to promote pollution prevention in Indian country. Some major activities of the Tribal program include grants funding, internal training on Tribal issues, follow-up activities from EPA Tribal Operations Committee meetings, interagency coordination efforts, and stakeholder outreach. OPPT is committed to working in partnership with Tribal governments via appropriate and effective consultation.
In 2002, OPPT established the National Pollution Prevention and Toxics Advisory
173

10th Report to Congress on Agency Compliance with the Unfunded Mandates Reform Act
Committee (NPPTAC) as the national advisory body to provide advice, information and recommendations on the overall policy and operation of programs managed by OPPT, in performing its duties and responsibilities under the Toxics Substances Control Act (TSCA) and the Pollution Prevention Act (PPA). NPPTAC provides a forum for public discussion and the development of independent advice to EPA by leveraging the experience, strengths and responsibilities of a broad range of Agency constituents and stakeholders, including State and Tribal officials. NPPTAC provides policy advice and recommendations in areas such as assessment and management of chemical risk, pollution prevention, risk communication, and opportunities for coordination. OPPT also relies very heavily on its Regional programs to interact with States and Tribes on Regional specific and national issues to ensure adequate perspectives are included in its decision making processes.
In addition, for some time, OPPT has been considering a range of voluntary and regulatory options for addressing the risks from lead-based paint hazards that may be created during renovation and remodeling activities in buildings. If EPA chooses to establish a regulatory program under Section 402(c)(3) of TSCA, interested states and tribes could develop their own renovation and remodeling programs. Under Title IV of TSCA, state or tribal lead-based paint programs that are at least as protective as EPA’s regulations may be authorized by EPA to operate in lieu of the Federal program. EPA encourages states and tribes to administer their own lead-based paint programs, because this results in more effective and efficient risk reduction efforts. Currently, 38 states, the District of Columbia, and three tribes are operating lead-based paint training and certification programs.
To ensure that EPA’s state and tribal partners would be interested in developing renovation and remodeling programs, EPA consulted with them on a number of occasions. EPA asked for state and tribal input at various lead conferences, including a Lead Programs Meeting in September 2000, where renovation and remodeling issues were discussed in an open forum over a day and a half. EPA also discussed renovation and remodeling at FOSTTA meetings. EPA values the many comments and suggestions it has received from state and tribal governments and will carefully consider them in crafting any regulations for renovation and remodeling under TSCA § 402(c)(3). The Office of Pesticide Programs (OPP)
The Office of Pesticide Programs (OPP) in OPPTS uses the State Federal FIFRA Issues Research and Evaluation Group (SFIREG), established in 1974 by cooperative agreement between EPA and the American Association of Pesticide Control Officials (AAPCO), the association that represents State level pesticide regulatory officials. SFIREG identifies, analyzes and provides State comment on pesticide regulatory issues and provides a mechanism for ongoing exchange of information about EPA and State pesticide programs. With a full committee and two subcommittees, there are eight regularly scheduled meetings each year that offer State officials the opportunity to meet to discuss issues including regulations in progress. One example of results from consulting with SFIREG was the formation of joint EPA-State workgroup to address a number of issues and projects.
OPP expects to issue a final rule that will streamline the existing pesticide emergency
174

Appendix
exemption process based on recommendations from the States. Under section 18 of the Federal Insecticide, Fungicide, and Rodenticide Act (FIFRA), EPA may issue emergency exemptions that allow unregistered uses of pesticides to address emergency pest conditions for a limited time. Although Federal agencies may apply for emergency exemptions, the vast majority of requests are from individual States for use by farmers to avert a pest-related economic emergency. In 2002, AAPCO submitted three recommendations to EPA to streamline and improve the emergency exemption process. The final rule will address two of the three recommendations. This action is expected to reduce the burden to States in the application process, allow for quicker emergency response, and provide more consistently equitable determinations of Asignificant economic loss@ as the basis of an emergency, without compromising protections for human health and the environment.
OPP is proposing procedural regulations for conducting pesticide registration review under FIFRA sec. 18. Registration review will replace EPA’s one-time pesticide reregistration and tolerance reassessment programs starting in 2006, as those programs approach completion. The Agency will conduct a review of each pesticide every 15 years to ensure that registrations continue to meet statutory standards for registration. Over the past several years, EPA consulted with and received significant input from the Pesticide Program Dialogue Committee (PPDC) and other key stakeholders regarding the design of registration review. As recommended by these stakeholders, EPA tested the feasibility of an approach to registration review that gauges the scope and depth of a pesticide's review to the significance of the changes that have occurred since the last time the pesticide was reviewed.
Under the proposal, EPA would ask for public comment on the information it intends to review before it begins its analysis. The Agency would review the data and information it possesses at the close of this comment period. In general, it would assess any changes that have occurred since the Agency’s last registration decision on the pesticide to determine the significance of such changes and whether additional review is needed to determine whether the pesticide meets the FIFRA standard for registration. In this review, the Agency would take into account, among other things, changes in statutes or regulations, policy, risk assessment procedures or methods, or data requirements. The Agency would consider whether new data or information on the pesticide, including data or information submitted to the docket, warrant conducting a new risk assessment or new risk/benefit assessment. Deciding whether existing risk assessments meet current standards is a key task in registration review.
During the 90-day comment period for this proposal, the Agency will hold public
information meetings on the proposed rule. The Agency will announce these workshops in the Federal Register and on the OPP home page. Coinciding with publication of the proposed rule, the Agency is launching a new website on its home page regarding the proposed rule and the registration review program.
The OPP Tribal Program organized the Tribal Pesticide Program Council (TPPC) in late 1999. TPPC is a tribal technical resource –a program and policy dialogue and development group -- focused on pesticide issues and concerns. It meets twice a year and provides a vehicle through which tribes can voice opinions on national pesticide policies and raise tribal pesticide issues to Federal attention. The TPPC is a strong partner with the EPA to ensure that tribes will
175

10th Report to Congress on Agency Compliance with the Unfunded Mandates Reform Act
continue to provide a major impetus for the long-term strategic direction taken by the Office of Prevention, Pesticide, and Toxic Substances (OPPTS) Tribal Program as it strives to build tribal capacity and produce an Agency pesticide strategy that is responsive to tribal needs and concerns. In addition, the TPPC serves as a technical resource pool for tribes in Indian country. The TPPC is composed of authorized representatives from Federally-recognized tribes and Indian nations and intertribal organizations. Authorization must be in writing by a letter from either the Tribal Chairperson or a letter or resolution from the Tribal Council or similar governing body. At this time there are 42 authorized representatives, including some authorized alternates. Thirty-two tribes or Indian nations have authorized representatives. National Center for Environmental Innovation (NCEI), in the Office of Policy, Economics, and Innovation (OPEI)
EPA's National Center for Environmental Innovation (NCEI), in the Office of Policy, Economics, and Innovation (OPEI), routinely consults with States to promote regulatory efficiency and improved environmental results. Much of this consultation occurs through the Environmental Council of the States (ECOS), in particular through the ECOS Cross-media Committee, and it is often influenced by the issues and concerns that States bring from their interactions with local governments. In FY 2004, an expanded number of ECOS’s Cross Media Committee members were invited. These interactions led to EPA and ECOS continued work on their Joint Innovation Work Plan. Progress was made on two work plan pilot projects items ─ Total Maximum Daily Loads for impaired waters and a pilot process for “unsticking” innovative policy issues at EPA.
During FY 2004, NCEI continued to work as a partner with State regulatory agencies through a variety of mechanisms. NCEI continued its collaborative work with the States on approximately 30 projects under the Joint EPA/State Agreement to Pursue Regulatory Innovation. NCEI continued to expand its State Innovation Grants Program, selecting nine projects for funding from the 2004 competition. Three of the projects were funded with FY 2004 resources ($554K), while the six remaining projects were funded ($907K) in FY 2005. NCEI provided funding under a streamlined grants competition, responding to strong state interest in the program (22 proposals submitted totaling over $3M in requests). The funding provided support to States seeking to test and implement Environmental Results Programs, Environmental Management Systems, and watershed-based permitting.
Likewise, NCEI provided information and assistance to States interested in the Environmental Results Program (ERP). ERP is an alternative regulatory approach to improve environmental performance and facility management in specific industry sectors, particularly those made up of small businesses. ERP integrates compliance assistance, self-certification, compliance assurance and enforcement, and statistically-based inspections and measurement to assess the environmental performance of facilities and overall sectors. In FY 2004, twelve States pursued ERP in seven sectors overall. NCEI worked with interested States to adopt ERP or its components in the following ways: as a mandatory program requiring self-certification of all facilities in a sector; voluntarily, encouraging facilities to participate in order to obtain the benefits of compliance assistance and the certainty of knowing their compliance status; or in some cases, used as an alternative to formal permitting for large numbers of small facilities.
176

Appendix
Several NCEI programs engaged States in creating a more performance-based
environmental regulatory system. States were involved in the development of incentives for Performance Track, a voluntary program that rewards and recognizes members for top environmental performance. In addition, NCEI worked with States to provide recognition for Performance Track members through State environmental leadership programs. In FY 2003, NCEI also consulted with States to address regulatory issues that can hinder smart growth at the local level and improved environmental performance by specific industry sectors. Through the Sector Strategies Program, NCEI and other stakeholders focused on tailored approaches for 12 sectors that make up 23 percent of manufacturing revenue and employ 19 percent of workers in the United States.
These and other activities contributed to more efficient and effective regulation by reducing unnecessary regulatory burden, freeing up resources, and strengthening partnerships with States and other organizations that share environmental responsibilities. EPA materials intended to help small governments more easily understand Agency regulations:
• Profile of Local Government Operations: The Profile details all the environmental requirements with which a local government must comply and organizes the information based on operations, i.e., motor vehicle servicing, property management, etc. This makes it easier for the representative of a local government responsible for an operation to find out about all the environmental requirements that might impact his or her operation and where to find more detailed compliance information.
• Local Government Environmental Assistance Network (LGEAN): EPA helps support this
Internet-based information service (that has parallel toll-free voice and fax-back options). LGEAN provides a first stop for local government officials with questions about environmental compliance. The site contains information from EPA and eight participating nongovernmental organizations. Users can ask questions of experts, consult with their peers, review and comment on developing regulations, and find the full text or summaries of State and Federal environmental statutes. LGEAN alerts users to hot topics and new developments in environmental compliance, tells them where to find technical and financial support, and provides them with a grant writing tutorial.
• Small Government Agency Plan: The Agency's interim Small Government Agency Plan
supplements the intergovernmental consultations described above. The Plan outlines the analysis rule writers must complete to determine whether the regulatory requirements of a rule might uniquely affect small governments. Under the plan, we encourage attention to such factors as whether small governments will experience higher per-capita costs because of economies of scale. The Plan also considers whether they would need to hire professional staff or consultants for implementation or be required to purchase and operate expensive or sophisticated equipment. EPA publishes the findings under the Small Government Agency Plan in the Federal Register with proposed and final rules. When there are unique or significant impacts on small governments, EPA takes action to inform and assist them.
177

10th Report to Congress on Agency Compliance with the Unfunded Mandates Reform Act
• Newsletter/Internet Site for Small Governments: Under a cooperative agreement funded
by EPA, the International City/County Management Association (ICMA) publishes a newsletter designed for small governments covering regulatory and other environmental programs of interest to them. ICMA's Environmental SCAN is also published electronically on the Internet. Access is free to anyone interested in local government issues. The ICMA site links electronically to EPA's Federal Register site so readers interested in a regulation covered in the newsletter can immediately gain access to the actual text. As part of the project, ICMA has also conducted several workshops for small government officials on regulatory and other environmental management topics.
• Guide to Federal Environmental Requirements for Small Governments: EPA also
publishes and distributes the small communities guide --a reference handbook to help local officials become familiar with Federal environmental requirements that may apply to their jurisdictions. The guide explains Federal regulations in a simple, straightforward manner. Mandated programs described in the guide include those for which small communities have major responsibilities, such as landfills, public power plants, and sewage and water systems.
• Regional Guides to Federal Environmental Requirements for Small Governments: EPA
Region VIII publishes and distributes a small community reference handbook to help local officials in Colorado, Montana, North and South Dakota, Utah and Wyoming become familiar with Federal environmental requirements that may apply to their jurisdictions. The guide includes up-to-date contact lists for State environmental programs.
Office of Solid Waste and Emergency Response Risk Management Program regulation for the prevention of accidental chemical releases
Facilities that have more than a threshold quantity of certain highly hazardous substances must implement a risk management program. The program consists of hazards analyses, and chemical accident prevention and emergency response programs. Facilities then describe certain details of their programs in a risk management plan (RMP). The RMP is submitted to EPA, the state, the local emergency planning entities, the Chemical Safety and Hazard Investigation Board (CSB), and made available to the public. EPA modified the RMP requirements in response to issues raised by stakeholders (see below).
The primary affected parties of the RMP are chemical plants and other companies that handle highly hazardous substances. States and local governments also have a stake because they are responsible for chemical emergency response planning; the RMP assists with this effort. Several other Federal agencies rely on the RMP data submitted by companies; it is the most comprehensive data source on chemical accidents and prevention. These other agencies include law enforcement, homeland security, and the military. Academia and NGOs are also affected since research, training, and public policy are affected by chemical emergencies.
178

Appendix
EPA participated in a number of meetings and roundtable workshops with representatives of the chemical industry, academia, NGOs, and other government agencies on chemical accident data and information. It also held regular conference calls with its Regional and state partners. Input and exchange during these forums contributed to EPA’s understanding of the issues.
Other agencies and NGOs expressed a concern that chemical accident data was being updated only once every five years; this information was needed on a more timely basis. In addition, the CSB requested that EPA get information on incidents as a result of chemical reactivity. State partners and regions were concerned about the use of contractors in the development of RMPs and the possibility of systemic errors, and that companies make changes in the emergency contact information but no mechanism for readily updating this information in the RMP is available. Researchers also wanted to know why companies make changes to their chemical plants.
EPA modified the RMP rule requirements to:
• capture the reasons why a company made changes to the RMP; • add a reporting requirement on the contractor used to prepare the RMP; • require that emergency contact information be updated in the RMP within 6 months of a
change; • required that accident history information be updated within 6 months of an accidental
release that meets reporting criteria; and • developed a mechanism whereby companies can update certain RMP information rapidly
using the Internet. Office of Water 1. Minimizing Adverse Environmental Impact From Cooling Water Intake Structures Under Section 316(b) of the Clean Water Act, Phase II (Final Rule)
On July 9, 2004, EPA established location, design, construction and capacity standards for cooling water intake structures at large existing power generation facilities. The final rule sets standards to protect fish, shellfish and other forms of aquatic life and provides flexibility by offering several alternatives for facilities to comply. This is the second in a series of three rules designed to reduce harm to aquatic life that is taken up with cooling water.
The Phase II national categorical requirements apply to existing electric generating plants that are designed to withdraw 50 million gallons per day or more and that use at least 25 percent of their withdrawn water for cooling purposes only. The final Phase II regulations are estimated to affect approximately 17 small governments owning 17 Phase II facilities and 27 large governments owning 59 Phase II facilities.
During the development of these regulations, EPA consulted with, and received comments from, the American Public Power Association (APPA) and the National Rural Electric Cooperative Association (NRECA). APPA is a trade association that represents more than 2,000
179

10th Report to Congress on Agency Compliance with the Unfunded Mandates Reform Act
municipal and other state and local community-owned utilities. NRECA is a not-for-profit trade association that represents more than 930 customer-owned rural electric utilities.
EPA held three public meetings, an expert panel, and a technology symposium during the development of the Phase II regulations. In addition, EPA met many times with representatives of the industry to hear their concerns and to clarify and respond to questions. APPA and NRECA participated in many of these forums. They also provided written comments on the proposal and notice of data availability.
In general, APPA and NRECA were concerned that these regulations might impact their ability to provide reliable, affordable electricity to their end-users. They agreed that the regulations should be based on the performance of design and construction technologies and not cooling towers. However, they were concerned that natural variability was great and that any performance standards should be targets only. They supported a streamlined technology option where transaction costs would be minimized and supported the use of restoration as a way to offset impacts caused by the cooling water intake structures. APPA was concerned that downtime associated with the installation of technology might cause unintended consequences such as price spikes and set sensible deadlines for compliance.
Based on input from these and other stakeholders, EPA developed a regulatory framework that provides sufficient flexibility to the regulated entity to minimize, to the maximum extent possible, impacts from either the costs of technologies or the application study costs. The regulatory framework of the final Phase II rule allows facilities to choose one of five different compliance alternatives. One of the compliance alternatives allows facilities to install an approved technology, if it meets certain specific criteria, with less study requirements. Another compliance alternative allows alternative standards for facilities that demonstrate the costs they would incur are significantly greater than (1) the costs EPA considered or (2) the benefits that would be realized. EPA also allows facilities to (1) implement restoration projects in lieu of installing design and construction technologies and (2) use historical studies in lieu of collecting new data. Based on comments that the performance standards should be targets rather than specific thresholds, EPA has allowed compliance to be determined based on whether a facility is complying with the terms of a "Technology Installation and Operation Plan" rather than whether the facility is actually meeting the performance standards. 2. Minimizing Adverse Environmental Impact from Cooling Water Intake Structures Under Section 316(b) of the Clean Water Act, Phase III (Proposed Rule)
On November 1, 2004, EPA proposed location, design, construction and capacity standards for cooling water intake structures at certain existing facilities and new offshore and coastal oil and gas extraction facilities. The proposed rule sets standards to protect fish, shellfish and other forms of aquatic life and provides flexibility by offering several alternatives for facilities to comply. This is the third in a series of rules designed to reduce harm to aquatic life that is taken up with cooling water.
Several municipal electric generators were consulted as Small Entity Representatives (SERs) during the Small Business Advocacy Review Panel (Panel), which EPA convened prior
180

Appendix
to issuing the proposed rule. The SERs provided advice and recommendations to the Panel on several aspects of the proposed rule.
The proposed national categorical requirements would apply to two groups of facilities: (1) Existing manufacturing facilities (including but not limited to chemical, metal, pulp and paper, and petroleum refining facilities), and (2) new offshore oil and gas extraction facilities. Also potentially within the scope of the Phase III rulemaking are electric power generators with less than 50 million gallons per day (MGD) cooling water design intake flows. National categorical requirements were not proposed for these lower flow electric power generators.
The small entity representatives commented that the costs projected by EPA could impose a significant financial burden on some small businesses. The small entity representatives suggested regulatory alternatives that would reduce the impacts of the rule on small entities. The suggested alternatives included delayed implementation or flexible timing of implementation, and thresholds for applicability of requirements based upon the design flow of an intake. Most SERs recommended an applicability threshold in the range of 20 to 50 MGD. Under this approach, facilities that fell below the threshold would continue to be regulated on an individual best professional judgment basis by State and local permitting authorities, but would not be subject to uniform national requirements.
EPA sought regulatory alternatives that would minimize the impact on small entities consistent with the stated objectives of the statute authorizing the rule. EPA proposed a minimum applicability threshold of 50 MGD. This threshold excludes all Phase III electric power generators, including municipal electric power generators, from national categorical requirements.
181