validating cohesion metrics by mining open pariksha singh ...to my spouse surendra, parents premlall...
TRANSCRIPT

Validating Cohesion Metrics by Mining Open
Source Software Data With Association Rules
Pariksha Singh
Student Number - 19653017
A dissertation submitted for the fulfillment of
the requirement for the degree of
Masters in Information Technology
Department of Information Technology
Faculty of Accounting and Informatics
Durban University of Technology
Supervisor: Dr S D Eyono Obono
(PhD, Msc, Bsc)Computer Science
Co-Supervisor: Professor D Petkov
(PhD) Computer Science

Declaration
I, Pariksha Singh declare that this dissertation represents research work carried out by
myself and that it has not been submitted in any form for another degree at any
university or higher learning institute. All information used from published or
unpublished work of others has been acknowledged in the text.
______________ _____________
Pariksha Singh Date

II
Dedication
To my spouse Surendra, parents Premlall and Vanitha, siblings Varsha and Vedanth,
and children Yadav and Shriya thank you for your love and support.

III
Acknowledgements
I would like to express my sincerest and deepest gratitude to all the people who
supported me throughout my research.
I am particularly grateful to my supervisor Dr Eyono Obono for his thoughtful and
creative comments, and especially for exploring with me the boundaries of the study.
I am indebted to him for his unbounded enthusiasm and infectious energy.
I like to thank Professor D Petkov for his significant input and intriguing ideas.
My deepest gratitude goes to Pieter Germishuys and Nolan Naidoo for their
assistance in helping program the software used by this study.
My appreciation also goes to Nareen Gonsalves for her critical evaluation and editing
of the dissertation.
I wish to thank Anusha Govender and the IT department for the fruits of several
valuable discussions held throughout the course of this work.
I thank my spouse, Surendra, for his forbearance whilst I have spent hundreds of
hours working. A special thanks to family members who have continually offered
advice, support and encouragement throughout my study.

IV
TABLE OF CONTENTS
ACKNOWLEDGEMENTS III
ABSTRACT VII
GLOSSARY OF TERMS VIII
CHAPTER ONE - INTRODUCTION 1
1.1 BACKGROUND 1
1.1.2 SOFTWARE PROJECT SCOPE 1
1.1.2.3 SCHEDULE 3
1.1.3 OBJECT ORIENTED PROGRAMMING 3
1.1.4 OPEN SOURCE SOFTWARE 4
1.1.5 SOFTWARE AND COHESION METRICS 4
1.1.6 DATA MINING 6
1.2 PROBLEM STATEMENT 7
1.3 RESEARCH QUESTIONS 8
1.4 RESEARCH OBJECTIVE 8
1.5 RATIONALE 9
1.6. RESEARCH METHODOLOGY 10
1.6.1 RESEARCH METHOD 10
1.6.2 RESEARCH POPULATION 10
1.6.3 SAMPLING 10
1.6.4 DATA PROCESSING 11
1.6.5 HYPOTHESIS 11
1.7 SCOPE AND CONSTRAINTS 11
1.8 CONCLUSION 12
CHAPTER TWO - LITERATURE REVIEW 14
2.1 INTRODUCTION 14
2.2 SOFTWARE MEASUREMENT 16
2.2.1 PREDICTION OF FAULT-PRONENESS 16
2.2.2 PREDICTION OF CHANGEABILITY 17
2.2.3 INDEPENDENCE OF COHESION METRICS 19
2.2.4 PREDICTION OF MAINTAINABILITY 20
2.3 MINING SOFTWARE DATA 21
2.4 OPEN SOURCE SOFTWARE 24
2.4.1 COMPARISON OF OPEN SOURCE SOFTWARE AND CLOSED SOFTWARE 25
2.5 COHESION OF OPEN SOURCE SOFTWARE 26
2.6 CONCLUSION 27

V
CHAPTER THREE - RESEARCH DESIGN 28
3.1 INTRODUCTION 28
3.2 RESEARCH METHOD 28
3.3 RESEARCH POPULATION - OPEN SOURCE SOFTWARE 28
3.4 DATA SAMPLING 29
3.4.1 SAMPLE SIZE 29
3.4.2 STRATIFICATION 29
3.4.3 RANDOMIZATION 30
3.5 INDEPENDENT VARIABLES USED IN THIS STUDY 32
3.5.1 SOUCEFORGE.NET DATA 32
3.5.2 CLASS COHESION VARIABLES 34
3.5.3 PACKAGE COHESION VARIABLES 36
3.6 RESEARCH APPROACH 36
3.6.1 QUALITATIVE DATA 36
3.6.2 QUANTITATIVE DATA 37
3.6.3 DATA DISCRETISATION 37
3.7 DATA PROCESSING TECHNIQUES 42
3.7.1 DATA MINING 43
3.7.2 ASSOCIATION RULES 43
3.7.2.1 THE APRIORI ALGORITHM 44
3.8 PROGRAM DESIGN 51
3.8.1 CLASS DIAGRAM 51
3.8.2 SEQUENCE DIAGRAM 53
3.8.3 USE CASE DIAGRAM 53
3.9 CONCLUSION 55
CHAPTER FOUR - RESULTS 57
4.1 INTRODUCTION 57
4.2 ASSOCIATION RULES 57
4.3 RULES OBTAINED FROM INDEPENDENT VARIABLES AND COHESION VALUES. 58
4.4 CRITERIA FOR RULE SELECTION 58
4.5 SELECTED RULES 59
4.5.1 RULES WITH NO COHESION VARIABLES. 59
4.5.2 RULES WITH ONE COHESION VARIABLE 62
4.5.2.1 MINING ONE COHESION VARIABLE AGAINST ALL INDEPENDENT VARIABLES 62
4.5.2.2 MINING ONE COHESION VARIABLE AGAINST ONE INDEPENDENT VARIABLE 64
4.6. RULES INTERPRETATION 70
4.7 RESULTS 70
4.7.1 INDEPENDENCE OF VARIABLES 70
4.7.2 VALIDITY OF COHESION FORMULAS 71
4.7.3 CORRELATION BETWEEN INDEPENDENT VARIABLE AND COHESION 71
4.7.4 CALCULATION OF THE COHESION OF A PACKAGE 71
4.7.5 NEGATIVE RESULTS 71
4.8 CONCLUSION 72

VI
CHAPTER 5 CONCLUSION AND RECOMMENDATIONS 73
5.1COMPARISONS WITH EXISTING LITERATURE 73
5.1.1 SOFTWARE SIZE 73
5.1.2 SOFTWARE FAULTS 73
5.1.3 SOFTWARE CHANGEABILITY 74
5.1.4 RESULTS OBTAINED THAT HAS NOT BEING RECORDED IN LITERATURE 75
5.2 FUTURE WORK AND RECOMMENDATIONS 75
5.2.1 SOFTWARE SIZE 76
5.2.2 SOFTWARE FAULTS AND CHANGEABILITY 76
5.2.3 TEAM SIZE 76
5.2.4 SOFTWARE REVIEWERS 76
5.2.5 SOFTWARE MATURITY 76
5.2.6 GENERAL RECOMMENDATION 76
REFERENCES 78

VII
Abstract
Competitive pressure on the software industry encourages organizations to examine
the effectiveness of their software development and evolutionary processes.
Therefore it is important that software is measured in order to improve the quality.
The question is not whether we should measure software but how it should be
measured. Software measurement has been in existence for over three decades and it
is still in the process of becoming a mature science. The many influences of new
software development technologies have led to a diverse growth in software
measurement technologies which have resulted in various definitions and validation
techniques.
An important aspect of software measurement is the measurement of the design,
which nowadays often means the measurement of object oriented design. Chidamer
and Kemerer (1994) designed a metric suite for object oriented design, which has
provided a new foundation for metrics and acts as a starting point for further
development of the software measurement science.
This study documents theoretical object oriented cohesion metrics and calculates
those metrics for classes extracted from a sample of open source software packages.
For each open source software package, the following data is recorded: software size,
age, domain, number of developers, number of bugs, support requests, feature
requests, etc. The study then tests by means of association rules which theoretical
cohesion metrics are validated hypothesis: that older software is more cohesive than
younger software, bigger packages is less cohesive than smaller packages, and the
smaller the software program the more maintainable it is.
This study attempts to validate existing theoretical object oriented cohesion metrics
by mining open source software data with association rules.

VIII
Glossary of Terms
Attribute: - A data item encapsulated in a class. Other names include instance
variable, data member, and state variable
Class: - A term that denotes the encapsulation of data and behavior into a
single package or unit. Class is the template from which many objects
are instantiated.
Independent Variables: - Variables that do not depend on one another
Measurement: - The process by which numbers or symbols are assigned
to attributes of entities in the real world according to
clearly defined rules
Methodology: - Comprehensive guidelines to follow for completing an
activity including specific models, tools and techniques
Methods: - How behaviors are implemented in object oriented
languages. Similar to functions found in other
languages.
Metrics: - The aspect being measured.
Private Methods: - Methods that are accessible only within the body of a
class.
Public Methods: - Methods with no access limitation.
Object: - Instance of a class.

IX
Object Orientation
Approach: - An approach to system development that views a
program as a collection of interacting objects that work
together to accomplish required tasks.
Variables: The representation of an area in the computer memory
in which a value of a particular data type can be stored.
List of Acronyms
CAMC: - Cohesion among methods in a class
CBO: - Coupling between objects
GNU: - Not Unix
Co: - Connectivity
CVS: - Concurrent versioning system
GQM: - Goal question metrics
Ich: - Information – flow based cohesion
Lcc: - Loose class cohesion
Lcom: - Lack of cohesion Metrics
MNC: - Number of methods in a class
NAS: - Number of associations
OO: - Object Oriented
OSS: - Open source software
RFC: - Response for a class
Tcc: - Tight class cohesion
TCO: - Total cost of ownership

- 1 -
Chapter One - Introduction
1.1 Background
Software engineering is the process of developing software through successive phases
in a methodical way. This process includes the groundwork of the user requirements
definition and analysis, the design of what is to be coded, the actual writing of
software code, and the testing of the developed software to ensure that it meets the
requirements. Before systems development methods came into being, the
development of new systems or products was often carried out using the experience
and intuition of management and technical personnel. Among systems development
methods, object oriented programming within the unified model is the state of the art
software development model. It is difficult to perform measurements on proprietary
software due to its closed nature, but the emergence of Open Source Software has
opened new opportunities to measure software features. One of theses features is
software quality. But software quality must be considered in the broader context of
the software project’s scope.
1.1.2 Software Project Scope
A project scope encompasses these three concepts: quality, cost and time.
1.1.2.1 Quality
While it is obvious that determining what truly represents software quality in the
customer’s view can be elusive, it is equally apparent that the number and regularity
of problems and defects associated with a software product are inversely proportional
to the quality of the software. Software problems and defects are among the few
direct measurements of software processes and products. Flora (1996) states that
“Problem and defect measurements are also the basis for quantifying several
significant software quality attributes, factors, and criteria-reliability, correctness,
completeness, efficiency, and usability among others” .
- 2 -
1.1.2.2 Cost and Maintenance
The amount of rework is an important cost factor in software development and
maintenance. The number of problems and defects connected with the product are
direct contributors to this cost. Measurement of defects can assist one to realize where
and how the problems and defects arise, provide an insight to methods of fault
detection, fault prevention, and fault prediction, and keep expenditure under control.
Maintenance of software is also considered an immense cost in the software
development process.
It is difficult to measure the quality of software code but evaluating why code is
difficult and time consuming to maintain is very important. According to Wise
(2005) maintenance problems fall into one of the following categories: poor
specifications, complex design and bad code.
a) Poor specification
Poor specification is usually a result of poor planning and communication
between the users/management and the developer/architect.
b) Complex Design
When the code is required to do really complicated things, its structure and
reliability also become complex.
c) Bad code
Bad code seems to be linked to programming experience. The following
questions are used when it comes to bad coding. Are the developers not
following coding standards? Do developers have a fundamental
misunderstanding of how to write clean code? Are they junior developers
who are performing tasks for the first time?
The above categories (a, b, c) have an impact on the maintenance of software code.

- 3 -
1.1.2.3 Schedule
The primary driver of projects schedules is the tracking of workload, people and
processes. But it is also useful to measure defects in tracking project progress in order
to identify process inefficiencies, and to forecast obstacles that can jeopardize
scheduled commitments.
If software development is no longer seen as an ‘art’, but as a craft or a science, then
we must be able to measure the characteristics of a software product. We can pursue
this by using metrics. Metrics can provide the feedback we need during the software
life cycle in order to evaluate software complexity, and to avoid its inherent
consequence which is defective software.
1.1.3 Object Oriented Programming
Currently, software development environments quite often form a methodological
and technical framework for the realization of complex software systems. Because of
the demand for tool integration, tool management, communication support, and
process modeling, etc., the conception and realization of such development
environments becomes quite a difficult undertaking. A distinct software process is
required to provide organizations with a reliable framework for performing and
improving their work. An overall modeling framework simplifies the task of
producing process models, permits them to be customized to particular requirements,
and facilitates process evolution. It is often claimed that the object oriented
programming paradigm allows a faster development pace and higher quality of
software. A number of metrics have been proposed to measure object oriented
systems. Chidamber and Kemerer (Chidamber et al, 1994) made one of the first
attempts at developing software metrics for object oriented systems. They proposed a
set of six oriented design metrics. Object oriented systems development is one of the

- 4 -
major aspects of modern software engineering.
Certain aspects of object orientation require a fundamental reconsideration of basic
concepts of development environments as well as their technical realization.
Emphasis is placed on a realistic consistent object oriented software development
environment and on the concepts for integrating an object oriented generic process
model into a software development environment.
1.1.4 Open Source Software
Open Source software is a system whose source code is freely available to the general
public for use and/or modification from its original design. Open source code is
usually produced as a collaborative attempt in which programmers enhance upon the
code and disclose the changes. The open source definition denotes that the origins of
a product are freely available in part or in full.
1.1.5 Software and Cohesion Metrics
A metric is defined as a process by which numbers are assigned to attributes of
entities in the real world to describe them according to clearly defined rules (Fenton,
1994). There are relatively new metrics, called ‘object oriented’ metrics and the older
metrics, which are now referred to as “traditional” or “conventional” metrics. Then
there is another distinction, namely, there are metrics that measure the written code,
and there are metrics for software design.
The study of metrics was established in the 1960s and developed further in the 1970s.
The earliest software metric is the measure LOC (lines of code) (Park, 1992). This
metric was subjected to lots of criticism for the reason that the program length is not a
good way to determine program characteristics like reliability and ease of
maintenance.

- 5 -
That criticism gave birth to a great deal of metrics and measurement ideas. For
example, the metrics proposed by McCabe (1989) and Halstead (1997) were created
in the middle of the 1970s, and are still heavily discussed today. In (McCabe, 1989),
cyclomatic metric is presented; it uses graph theory to measure software complexity.
It looks at a program’s control flow graph and determines the minimum number of
paths in that graph. McCabe argued that this number determines the complexity
(cyclomatic complexity) of a program. Halstead devised a metric, which is based on
two quantities: the number of distinct operators in the program and the number of
distinct operands in the program. From these numbers one can construct the “Halted
Length” which is the measure of the complexity of a program. Usually the “Halted
length” is calculated after the code is written but is also used for the measurement of
programming effort. McCabe and Halstead complexity measures were deemed to be
inconsistent due to the following:
a) The measure is independent on physical size.
b) The measure fails to distinguish between different kinds of control flow structure.
c) The measure does not account for the level of nesting of various control structures
and for this measure three loops in succession and three nested loops are
equivalent. Such nesting however, may affect the psychological complexity of
the program.
d) The cyclomatic complexity increases with each application of structuring
transformation like node splitting.
These inconsistencies urged different researchers to improve the science of metrics.
Weyuker (1998) proposed her desirable properties for metrics; these properties are
discussed and elaborately explained by Misra and Misra (2007). Weyuker properties
are accepted by numerous authors as been very robust.
Recent works by Chidamber and Kemerer (1994) outline the most important Object
oriented metrics. These metrics are summarized by Briand, Daly, and Wust (1999).
- 6 -
1.1.6 Data Mining
Data mining, also known as knowledge discovery, is the practice of analyzing data
from diverse perspectives and summarizing it into constructive information. Data
mining software is an analytical tool for analyzing data. It allows users to analyze
data from many diverse dimensions or angles, categorize it, and summarize the
relationships recognized. Data mining is the process of finding correlations or
patterns among thousands of fields in large relational databases.
1.1.6.1 Data Mining Algorithms
Frequent item set mining (FIM) has only being in existence from 1993 according to
Agrawal, Imielienski and Swami (1993). These authors describe and explain the way
association rules works when mining databases with a large number of item sets.
Agrawal, Imielinski and Swami (1993) introduced an algorithm called AIS. Later
Agrawal and Srikant (1994) proposed two new algorithms, called Apriori and
AprioriTid that are fundamentally different from the previous one. The algorithms
achieved significant improvements over AIS and became the core of many new
algorithms for mining association rules.
Cheung (1996) proposed an algorithm called FUP (Fast Update Algorithm) for
finding the frequent item sets. The word item set was invented specially for data
mining and it means a set of items, a group of elements that represents together a
single entity. The major idea of the FUP algorithm is to reuse the information of the
old frequent item sets and to integrate the support information of the new frequent
item sets in order to reduce the pool of candidate item sets to be re-examined. Along
with the item sets, a negative border, proposed by Toivonen (1996) was maintained.
A negative border consists of all the item sets that are candidates of the Apriori
algorithm that do not have sufficient support.
Another approach to incremental mining of frequent item sets was presented by
Thomas et al (1997). The algorithm that was introduced required only one database

- 7 -
pass and was applicable not only for expanded but also for reduced databases. Nag
(1999) introduced the issue of interactive mining of association rules and the concept
of knowledge cache was introduced. The cache was designed to hold frequent item
sets that were discovered while processing other queries. Several cache management
schemas were proposed by Aggarwal and Yu (1998), Han (1998) and Hidber (1999)
and their integration with the Apriori algorithm was analyzed. An important
contribution as stated by Nag (1999) was an algorithm that used item sets discovered
for higher support thresholds in the discovery process for the same task, but with a
lower support threshold. The notion of data mining queries or knowledge discovery
in databases was introduced by Imielinski and Mannila (1996). The need for
Knowledge and Data Management Systems (KDDMS) as second generation data
mining tools was expressed. The ideas of application programming interfaces and
data mining query optimizers were also mentioned. Several data mining query
languages that are extensions of SQL were proposed by Ceri, Meo and Psaila (1996),
Han et al (1996), Imielinski and Mannila (1996) and Morzy, Wojciechowski z and
Zakrzewicz (2000).
1.2 Problem Statement
Cohesion metrics intend to measure software quality, but they only apply to software
classes. Ideas have been put forward as to how to derive the cohesion of a software
package from the cohesion of its classes but the validity of those ideas is still to be
proven.
The concept of class cohesion provides an interesting link between object oriented
programming and software metrics, but it is even more interesting to study that link
in the specific context of open source software.
These are possible research ideas that can exhibit the contribution of object oriented
programming, open source software and software metrics (cohesion) to software
quality.

- 8 -
1.3 Research Questions
The relationship between software quality, object oriented programming, software
metrics, and open source software, calls for several questions.
For example one may want to examine the correlation between software quality as
measured by cohesion metrics and software attributes such as software size, software
domain, software age and the number of developers. What is the correlation between
these independent variables and cohesion? Can software metrics conclusively
measure software quality?
Since object oriented cohesion metrics are only defined for classes, how can the
cohesion of a software package be calculated?
This research is an attempt to answer the above questions.
1.4 Research objective
The objective of this study is to design a methodology to test the validity of software
cohesion metrics.
In pursuing the above-defined objective, the following tasks must be completed.
a) Document existing metrics within the object oriented development
environment.
b) Develop software that calculates cohesion metrics for a sample of open source
software.
c) Data Mine these metrics to test the hypothesis as outlined in this study.

- 9 -
1.5 Rationale
The Linus's law states, "Given enough eyeballs, all bugs are shallow". More formally:
"Given a large enough beta-tester and co-developer base, almost
every problem will be characterized quickly and the fix obvious to
someone" (Torvalds, 2003).
The driving force of Linus' Law is less about security than it is the general process of
assuring quality in software. This certainly resonates with the existing deliberation
amongst open source advocates, that having source code accessible for analysis and
audit helps make certain that potentially unsafe bugs are more easily neutralized.
This law states that the greater number of people to view the developed code that is
developed the easier it is to discover bugs and problem areas. With proprietary
software only the testing team has access to test the source code therefore some
problems may not be unearthed. Due to open source software being available to all
eyes, this software can be revised until it is deemed perfect by all associated parties.
This study can contribute to the testing the validity of the Linus Law in the sense that
it assesses open source software quality based on the calculation of cohesion metrics
of open source software. Threats to validity include construct validity, External
validity and internal validity.
Construct Validity is defined as the extent to which the independent variables and
dependent variables precisely measure the concept they intend to measure.
Internal Validity is defined as the degree to which conclusion can be drawn about the
causal effect of the independent variables on the dependent variables.
External validity is defined as the degree to which the results of the research can be
generalized to the population under study and other research settings.
The study focuses on construct validity since cohesion values are compared to
independent variables e.g. age, size, category, programming language, etc.

- 10 -
1.6. Research Methodology
The research methodology comprises of the research method, research population and
research sample.
1.6.1 Research method
It is important to know that the present study is a survey. The population and
sampling of the survey is defined below.
1.6.2 Research population
The research population is made up of open source software. All necessary data can
be gathered and downloaded from the url http://www.Sourceforge.org. The size of
the population of open source software packages as at December 2006 was 65549 and
these increases daily.
1.6.3 Sampling
Data gathering for the sample is performed on historical data available from open
source software that is on the Internet within software categories. The reason for this
is to prove the theory of Linus’ Law as stated in the rationale. The sampling method
and sample size is defined below.
1.6.3.1 Sampling Method
The sampling method used is randomization within a stratified group. The population
referred to above has been stratified into 13 different domains; the sample in each of
these domains is randomly chosen. Each software domain is considered as a strata.
For example the category “software development” is a strata; Software packages
from this category is randomly selected and downloaded. This method is used for the
entire sample.

- 11 -
1.6.3.2 Sampling Size
The size of the sample used to test the hypothesis is 68 i.e. 68 software packages are
downloaded and their data form the basis of the study. The calculation of the sample
size is given in chapter 3.
1.6.4 Data processing
In chapter 4, software data from the 68 software packages is mined using association
rules in order to determine the correlation between cohesion and software
independent variables.
1.6.5 Hypothesis
The following hypotheses are assumed.
a) There is a correlation between software size, software support requests,
software feature requests, software patches and cohesion.
b) Software cohesion does not depend on the software domain.
c) Highly cohesive software contains few errors.
1.7 Scope and constraints
There are different metrics for object oriented design e.g. depth of inheritance tree,
weighted average method per class, coupling, lines of code, etc. This study deals
exclusively with cohesion metrics, especially the one defined by Chidamber and
Kemerer. While the study does discuss cohesion metrics in general, it does however
exclusively focus on the cohesion metrics proposed by Chidamber and Kemerer
(1994). Software written in a traditional programming language is excluded since
this study is based on the object oriented software paradigm.
Another limitation is on the data collected. Data is solely collected from open source

- 12 -
software. The reason for choosing Open source software is because proprietary
software or off the shelf software is expensive and their code is not available.
All software studied is written in programming languages in the .net environment
(Example C#.net, J#.net, Visual Basic.net, etc)
1.8 Conclusion
A cohesive program is one in which the modularisation of functionality is performed
‘correctly'. More precisely, a cohesive module or function should perform only
closely related tasks. The principle is mirrored in object-oriented programming by the
concept of encapsulation: well-encapsulated objects contain all necessary data and
function members within themselves.
The motivation for measuring and assessing the cohesiveness of programs rests upon
claims that highly cohesive code is easier to maintain, modify and reuse.
Open source software is relevant in today’s ever-changing world of information
technology and we need to know if the millions of open source code available can be
trusted for deployment. One way of measuring whether this open source software
code is reliable is through the measurement of quality. One measurement of software
quality used today is software cohesion. Cohesion can confirm if software quality is
high, medium or low and if software reuse is a dependable approach.
This study comprise of five chapters and is broken down into 3 three sections. In the
first section, which is chapters one and two, an overall context for the study is
provided, as well as an in-depth literature review on the mining of software
engineering data.
In the second section, which comprises chapter three, a description of the research
methodology is given with the aim of explaining the entire research process from the
data collection to the production of association rules. The design of software
programs is written for the calculation of cohesion metrics are presented.

- 13 -
Finally, in chapter four, the association rules are analyzed and the results of that
analysis are presented and interpreted. Chapter five concludes the study.

- 14 -
Chapter Two - Literature review
2.1 Introduction
Validation of software measures and prediction models are based on the following
questions documented by Zeus (1991):
a) Is it possible to predict the error-proneness of a system using
software measures from its design phase?
b) Is it possible to extract quantitative features from the
representation of a software design to enable us to predict the
degree of maintainability of a software system?
c) Are there any quantifiable, key features of the program code of a
module that would enable us to predict the degree of difficulty
of testing for that module, and the number of residual errors in
the module after a particular level of testing has occurred?
d) Is it possible to extract quantifiable features from the
representation of a software design to enable us to predict the
amount of effort required to build the software described by that
design?
e) What properties of software measures are required in order to
determine the quality of a design?
f) Are there features in order to predict the size of a project from
the specification phase?
g) What are appropriate software measures to underlie the software
quality attributes of the ISO 9126 norm by numbers?
h) What are the criteria for the internal and external validation of
software measures? What are the criteria for prediction models?
These questions may form the basis of a software measurement theory whose
importance according to Zeus will become more and more obvious with time.

- 15 -
Metrics is not just important in software development but imperative since metrics
can measure different aspects of a software program, like quality. Cohesion metrics
measures software quality by measuring how closely related classes are in a software
package. This is known as cohesion of a software package.
The Lcom metric was one of the six metrics proposed in a draft suite of
measurements theory based software metrics in 1991 by Chidamber and Kemerer.
The metric was interpreted by Li and Hendry (1993, 1995), which was later refined
by Hitz and Montazeri(1996). Chidamber and Kemerer (1994) also later proposed a
revised definition for Lcom. The multiple interpretations of the Lcom metrics can
result in different values for a particular class (Hitz and Montazeri, 1996) (Etzkorn,
Davis and Li, 1998). However, in spite of its many definitions, the Lcom metric is
still currently the most widely used metric for measuring cohesiveness of a class.
The Lcom metric uses class data attributes access patterns to compute the lack of
cohesion. The metrics determines the set of methods that have one or more attibute
access in common in the implementation of the methods of a class. The number of set
of non-overlapping attributes gives the Lcom measure of a class. Using the
Chidamber and Kemerer revised definition, the Lcom value for completely cohesive
classes is zero and can be as high as (2n ) for a class with “n” methods. With the Li
and Hendry (1993) interpretation, the Lcom provides a number that indicates the
number of classes with which a non-cohesive class should be replaced with. In an
article (Etzkorn, Davis and Li, 1998) which compares the various implementations of
Lcom by Chidamber and Kemerer and the extensions made by Li and Hendry provide
the best interpretation of lack of cohesion in methods of a class. A framework for the
measurement of cohesion was agreed upon by several authors, this framework is used
to test the validity of cohesion metrics in this study (Briand, Daly and Wust, 1998).
“In the future, theory building (hypotheses about reality) becomes
more and more important. The axiom systems of measurement
theory can help here to get a better understanding of what’s behind
software quality and cost.” – [Zeus, 1989; 24]

- 16 -
2.2 Software Measurement
Many object-oriented metrics have been proposed over the last decade. A few of
these metrics have undergone empirical validation, and in reality metrics are being
used by corporations as functional effort to manage software quality. Accurate
prediction of fault prone modules in software development process enables effective
discovery and detection of defects. Such prediction models are valuable for
comprehensive systems, where verification experts need to focus their attention and
resources to problem areas in the system under development. The assessment of the
changeability of software systems is of concern for purchases of the huge systems
found in fast-moving domains. An approach to this problem is to examine the
dependency between the changeability of the software and its design, with the
purpose of discovering design properties that can be used as changeability indicators.
The usage of metrics in the analysis and design of object oriented (OO) software can
aid designers make improved decisions is gaining relevance in software measurement
area. Moreover, the necessity of having early indicators of external quality attributes,
such as maintainability, based on early metrics is growing.
2.2.1 Prediction of fault-proneness
Basili, Briand and Melo (1996) experimentally investigated the suite of Object
Oriented (OO) design metrics introduced by (Chidamber and Kemerer, 1994), with
the aim of assessing if metrics can predict fault-prone classes. Data on the
development of average-sized information management systems based on evenly
balanced requirements were collected and a controlled study was run over four
months. Data was also collected on defects found in Object-Oriented classes from
graduate students. The students were randomly grouped into eight teams. Each team
developed medium-sized management information systems that support the
rental/return process of a hypothetical video rental business with a customer and
video database. Based on this data it was confirmed experimentally how much fault-
proneness is influenced by internal (e.g., size, cohesion) and external (e.g., coupling)

- 17 -
design characteristics of OO classes. From the results, five out of the six Chidamber
and Kemerer’s OO metrics are effective to forecast class fault-proneness during the
initial phases of the life-cycle. This empirical validation presents some empirical
evidence indicating that the majority of these metrics can be effective quality
indicators. In addition the results show these metrics to be complementary.
Benlarbi, Emam and Goel (1999) investigated the empirical validation of object-
oriented metrics by assessing each metric (Weighted Method Per Class, Coupling
Between Objects, RFC, LCOM) against class fault-proneness. Data was collected
from 174 classes in a C++ system. The method of analysis used was logistic
regression. The results showed that size can have an important confounding effect on
the validity of object-oriented metrics.
2.2.2 Prediction of changeability
Kabaili et al (2001) goal was to validate cohesion metrics as changeability indicators.
LCC and LCOM were chosen as cohesion metrics. Data was collected about these
metrics on three different industrial systems. For each metrics minimum, maximum,
mean, median and standard deviation statistics were collected, to test the relationship
between cohesion and the coupling metrics. The Pearson correlation coefficient was
used to measure the degree of relationship between variables. Investigation of classes
that was weakly cohesive showed that the metrics used do not capture all the facets of
class cohesion. The conclusion was that cohesion metrics such as LCC and LCOM
should not be used as changeability indicators.
Esperanza, Genero and Piattini (2003) used three controlled experiments to ascertain
if any correlation exists between the structural complexity and the size of UML class
diagrams and their maintainability, using eight metrics for measuring the structural
complexity of class diagrams and three metrics to measure their size. The obtained
results show that the metrics related to associations, aggregations, generalizations and
dependencies, are validated whilst those related to size seem to be redundant. The
result also shows a strong relationship between maintainability and principal
components (Independent Variables).

- 18 -
In an Empirical study by Bhadri and Bhadri (2004), the main goal of the research was
to validate the introduced criterion which focuses on interactions between class
methods and their approach for class cohesion assessment. The results showed clearly
that based on a combination of the proposed criteria, there are more pairs of
connected methods than the existing cohesion metrics, particularly the ones implicitly
taking into account the interactions between methods (such as Connectivity, Tight
Class Cohesion and Loose Class Cohesion metrics). A cohesion measurement tool
was developed for Java programs to automate the computation of the major existing
class cohesion metrics presented by Chidamber and Kemerer (1991). In order to
demonstrate the effectiveness of the new criterion and the proposed metrics for class
cohesion, a case study of more than 2000 Java classes was analysed. The results
proved that their analysis constitutes an improvement of class cohesion assessment.
Existing class cohesion metrics are essentially based on instance variables, this
criterion is important but not sufficient to capture all the connections among members
within a class according to Bhadri and Bhadri (2004). In order to capture additional
characteristics of classes and to better measure the cohesion property of classes,
Bhadri and Bhadri (2004) introduced new class cohesion criteria, based on methods
invocation.
The goal of research by Muskens, Chaudron and Lange (2004) was to develop
industry-proof software architecture and design metrics. They identified a number of
problems that occur in computing software architecture and design metrics in
industrial settings that were not encountered in computing source-code metrics. These
problems include the absence of a single, unifying representation for architectures
and they arise from the fact that architecture diagrams are used in an informal
manner. They evaluated models based on the object oriented paradigm for
representing architecture and the results documented that software architecture has
significant impact on the quality, cost and development time of software projects;
hence the quality of software architecture needs to be evaluated in the early stages of
the development process.

- 19 -
Counsell, Swift and Turner (2006) attempted to clarify the contributing factors to an
OO cohesive class. Twenty four test subjects were used and 322 C++ classes were
tested in their study to test if:-
a) Smaller classes are more cohesive than larger classes
b) Classes with relatively large number of comment lines are more cohesive than
those without and
c) There is a relatively large difference in the rating of cohesion made by
developers with IT experience and those developers without IT experience.
The cohesion metric used in the study was Number of Methods in a class (NMC),
Coupling between objects (CBO) and Number of Associations (NAS). The results
showed that smaller classes are not more cohesive than larger classes and it is not true
that classes with relatively large numbers of comment lines are generally deemed
more cohesive than those with fewer comment lines. There was not enough evidence
to support the difference in rating between novice and experienced developers in IT.
2.2.3 Independence of cohesion metrics
Lethbridge and Anquetil (1998) applied cohesion metrics to various decomposition of
a large system of about 4500 files. The results revealed that no matter which method
was used to compute similarity, roughly the same information about the coupling and
cohesion subsystems were recorded. Results also recorded correlation between
cohesion and coupling. Thus Lethbridge and Anquetil believed that these metric
should not be thought of as completely independent indicators of quality.
Kabaili et al (2001) also looked at the correlation between cohesion and coupling
metrics. The metrics used for the study was Coupling Between Objects (CBO) and
Response For a Class (RFC). They experiment showed no correlation between
cohesion and coupling metrics chosen. Cohesion metrics used in their
experimentation did not reflect the real cohesion of a class. An investigation carried

- 20 -
out using manual classes with low cohesion metric values were analysed and the
results proved although some classes have low LCC and/or high LCOM values, these
classes are actually cohesive. Based on these results the authors concluded that
cohesion metrics cannot be trusted as changeability indicators and further concluded
that as measures, LCC and LCOM do not reflect the cohesion property of a class.
2.2.4 Prediction of maintainability
Li and Henry’s (1993) research implemented object oriented metrics to predict
maintenance effort. This research used one dependent variable representing software
change, and ten independent variables. Change is a measure of maintenance effort.
All the independent variables are metrics values. The metrics used were Depth of
inheritance tree (DIT), Number of Children (NOC), Response for a class (RFC), Lack
of cohesion of class (LCOM) and Weighted Method per class (WMC). The study
tested if there is a strong relationship between object oriented metrics and the
maintenance effort as measured and if size has any correlation with maintainability.
The results of their analysis proved that
a) There is a strong relationship between metrics and the maintenance effort
in the object oriented systems. Ninety-percent (90%) of the total variance
in the maintenance effort is accounted for by metrics.
b) The maintenance effort can be predicted from the combinations of
metrics collected from source code
c) Size can account for a large portion of the total variance in the
maintenance effort.
d) Metrics are very useful predictors of maintenance.
Bansiya et. al. (1998) compared the Lack of cohesion (LCOM) metrics with Coupling
Among Methods of a Class (CAMC). CAMC is a metrics representing the cohesion
among methods in a class. A sample size of 17 classes was used in the analysis. As
part of their study LCOM was statistically correlated with CAMC and the results
proved that the CAMC metric shows significant potential as an early way to assess

- 21 -
the cohesiveness of classes in a design but it needs to be validated using a set of
projects from various domains.
In a paper by Harrison, Councell and Nithi (1998), two coupling metrics are
analyzed: the metrics proposed by Chidamber and Kemerer’s (Coupling between
Objects) and Number of Association between classes (NAS) metric developed
through the use of the Goal-Question-Metrics. Five systems were tested and the
results showed a strong relationship between Chidamber and Kemerer’s metrics and
NAS metrics, implying that only one of these metrics need be used to access systems
design.
2.3 Mining Software Data
Inderpaul et al (1993) effectively introduced the attribute-focusing technique to the
software engineering community. It discusses the use of association discovery for
exploring defective software and process improvement. The authors discuss the
results of their technique in an extensive case study which was executed at IBM.
Inderpaul et al (1994) also present work on attribute focusing that is more oriented to
software engineering practitioners. It focuses on the data analysis methodology and
the lesson learned by the authors. The major lessons learned from Inderpaul et al. is
that machine-assisted data exploration of classified defect data can readily lead a
project team to improve their process during development. Such analysis focuses the
team on the immediate experience of development and helps them correct process
problems as well as to validate whether those problems have indeed been corrected.
Such analysis can complement current practices of in-process improvements.
De Oca and Carver (1998) describe data mining techniques as having been used
previously, for identification of subsystems based on associations. This approach
provides a system abstraction up to the program level as it produces a decomposition
of a system into data cohesive subsystems by detecting associations between

- 22 -
programs sharing the same files. Results show that data mining can identify data
cohesive subsystems without any previous knowledge of the subject system.
Furthermore, data mining can produce meaningful results regardless of system size
making this approach especially appropriate to the analysis of large undocumented
systems.
Manoel et al (1998) discusses two approaches for improving existing measurement
and data analysis techniques in software organizations. The first approach works top-
down based on goal oriented measurement planning. The second approach works
bottom-up by extracting new information from the legacy data already available in
the organization. For the latter approach, the authors use association discovery to gain
new insights into the data that is already present in the organization. These
approaches were used to analyze the customer satisfaction (CUSTSAT) survey data
at the IBM Software Solutions Division Laboratory. The CUSTSAT data are
collected annually through surveys carried out by an independent party. Their
purpose is to evaluate customer satisfaction with products of IBM's Software
Solutions Division and competing products. IBM surveys a large number of
customers from several different countries. All the data are stored in one database.
Currently, this database stores CUSTSAT data collected over several years. The
studies main objectives were: (1) better understanding of the user groups' needs with
respect to the CUSTSAT measurement, and (2) better exploration of the data already
stored in this database. The results showed that the Goal Question Matrix (GQM) -
and AF-based approaches are complementary and can work in synergy. The GQM
structures help us to choose and organize data for AF analyses. The new knowledge
gained through the AF analyses can be fed back into the measurement goals and used
to revise GQM structures.
Data mining has appeared as one of the tools of choice to better explore software
engineering data as described by Brand and Gerritsen (1998). The constant increases
in software and hardware infrastructures only increase the availability of data in
software organizations. Brand and Gerritsen carried out analysis on data collected in
telecommunications. The results showed that association algorithms can only operate

- 23 -
on categorical data. If non-categorical is used, the non-categorical data must be
binned into ranges, and each range would have to represent an attribute.
Rousidis and Tjortjis (2005) described clustering that is used to support software
maintenance and systems knowledge discovery. Rousidis and Tjortjis describe in a
paper the method for grouping Java code elements together according to their
similarity. It focuses on achieving a high-level system understanding. This method
derives system structure and interrelationships, as well as similarities among systems
components. This is done by applying cluster analysis on data extracted from source
code in order to better understand similarities among program elements in support of
software maintenance. This methodology used an input model and a clustering
algorithm. It correctly recognized data about software packages, classes, methods
and parameters. A tool was developed to assess this fully automated approach, and
the experimental results showed that the tool successfully revealed similarities among
Java code elements.
An approach for evaluation of dynamic clustering was presented by Xiao and Tzerpos
(2005). The scope of this work was to evaluate the usefulness of providing dynamic
dependencies as input to software clustering algorithms. This method was applied to
Mozilla, a large open source software system with more than a four million lines of
C-Sharp (c#) source code. In this experiment, the clustering produced by the dynamic
process to the ones produced by the static one was compared. Results show that the
static process performs usually better. However, there are cases where the dynamic
clusterings are the ones with the higher quality. Also, the average difference between
the static and dynamic clustering was less than 5%.
Michail (2000) discussed how data mining could be used to discover reuse patterns in
existing applications. This work improves upon his earlier research using
“association rules” by taking into account the inheritance hierarchy using
“generalized association rules”. Michail explains by browsing generalized association
rules, a developer can discover pattern in usage in a way that takes into account
- 24 -
inheritance relationships. Michail’s research illustrated the approach using the tool,
CodeWeb, by demonstrating characteristic ways in which applications reuse classes
in the Knowledge Desktop Environment application framework. The results showed
that some important rules would not have been found without taking into account the
inheritance hierarchy.
Recently Xie, Pei and Hassan (2007) presented in a tutorial the latest research in
mining Software Engineering data, discusses challengers associated with mining
software engineering, highlights software engineering mining success stories, and
gives future direction of Data mining. This paper outlines the types of Software
Engineering data that is available to be mined, which software engineering tasks can
be helped using data mining and how are data mining techniques used in software
engineering.
Data mining can be effectively performed on open source software since open source
software is transparent.
2.4 Open Source Software
The free software movement was launched in 1983. In 1998, a group of individuals
advocated that the expression “free software” be replaced by open source software
(OSS) as an expression which is less ambiguous and more comfortable for the
corporate world (Raymond, 1998). Software developers want to publish their
software with open source software license, so that any person can also cultivate the
same software or understand how it functions. Open source software usually permits
anyone to develop a new version of the software, port it to new operating systems and
processor architectures and distribute it to others or promote it. The purpose of open
source is to let the software developed be more understandable, modifiable,
duplicatable, reliable or simply accessible, while it is still marketable.
The open source software (OSS) model represents a disruptive paradigm in the
software industry. Compared with traditional proprietary software development, OSS
is a radically new paradigm (Moody, 2001; Raymond, 2005; Sharma, Sugumaran and

- 25 -
Rajagopalan, 2002). With OSS, software source code is freely available for anyone to
view, download, modify and redistribute as long as it is under the same open source
license. Most open source software projects rely entirely on the voluntary efforts of a
community of developers (although some projects are coordinated and led by
commercial entities). Such a voluntary community process keeps the cost of
development and testing low. The nearly zero total cost of ownership (TCO) gives
open source software a strong competitive edge. A few of the projects initiated by the
OSS community, such as GNU, Linux, Apache, MySQL and PHP, have achieved
extraordinary success. However, except for these few successful projects, the
majority of the open source projects lack performance, with little development
momentum behind them (Thomas et al, 2004). A Dutch Maastricht Economic
research Institute (MERIT) in 2005 presented the results of an open source software
survey at the O’Reilly open source Convention in Amsterdam. A total of 955
participants from twelve countries were consulted via phone and web- based survey.
The study found that 49% of organizations are using open source software within
their IT environments and about 70% of open source users wanted to increase their
open source use. Furthermore the results also showed that IT administrator’s efforts
can be reduced by adopting open source software environments i.e. maintenance
would be reduced considerably.
2.4.1 Comparison of open source software and closed software
A study by Samoladas et al. (2004) examined five active and popular open source
software projects that comprised of 5,856,873 lines of code. For each project the
number of major releases was measured, obtaining a history of the evolution of the
source code quality. This was compared to closed source code (Proprietary Software)
and the results showed that open source software code compared to be equal and in
some cases better than the quality of closed source software code implementing the
same functionality. Results also showed that open source software code quality
suffers the same problem as closed source software. Maintainability deterioration
over time is a typical phenomenon and produces legacy closed source software
systems. Similar behavior was exhibited with open source software projects as they

- 26 -
age: the open source systems approach will produce legacy systems in much the same
way as closed source systems has done.
Zhou and Davis (2005) collected data on bug tracking from eight popular open source
software projects from sourceforge.org and investigated the time related bug
reporting patterns from them. The results indicate that along its development cycle,
open source projects exhibit similar reliability growth pattern with that of closed
source projects. Bug arrivals of most open source projects will stabilize at a very low
level, even though in comparison, no formal testing activities are involved.
2.5 Cohesion of open source software
Research carried out by Koch and Schneider (2000) into open source development
was to use existing data on the projects available to the public. Therefore the CVS-
repository of the GNOME project was used for the collection of data. The research
aim was to identify if there was any correlation between Lines of Code and
programming effort. The results could not confirm any correlation.
A paper written by Gyimothy, Ferenc and Siket (2005) on the validation of object
oriented metrics on open source software for fault proneness aim was to calculate and
validate the object oriented metrics suite given by Chidamber and Kemerer (1994) for
fault prone detection from the source code suite of “Mozilla”. Using the calculated
metrics, Mozilla’s predicted fault proneness changed over seven versions covering
one and a half years of development. The results showed that the correctness of the
LCOM metrics is good, but its completeness value is low.
Koru, Zhang and Liu (2007) presented a paper on modeling the effect of Size on
Defect Proneness for Open Source Software. The objective of their study was to
model the relationship between size and defect proneness while addressing the unique
dynamic characteristics of Open Source Software. Defect fixes made to C++ classes
in open source projects were modeled. Class size was measured in Lines of Code

- 27 -
excluding the blank and comment lines. The results showed that when change in
module size and addition and deletion of software modules over time was related to
defect-proneness, the functional form of size was logarithmic.
2.6 Conclusion
Many object oriented metrics have been proposed over the last decade. A few of
these metrics have undergone empirical validation.
Factors related to cohesion are fault-proness, changeability, maintainability and other
independent variables (such as the number of developers, number of bugs, etc). This
chapter focused on the empirical validation of cohesion metrics as related to fault-
proness, changeability, maintainability and other independent variables. The chapter
starts with a review of existing literature on the empirical validation of cohesion
metrics for software in general; a similar review for open source software is done.

- 28 -
Chapter Three - Research Design
3.1 Introduction
The purpose of this chapter is to present the methodology used for the assessment of
validity of cohesion metrics with regard to the assumed hypothesis.
This chapter defines the research method, the population, the sampling size and
sampling methods. The research variables are also described and the design of a
software program that calculates the values of cohesion is documented. The chapter
ends on the presentation of suitable data mining techniques for the testing of the
hypotheses.
3.2 Research Method
This study is based on a survey. The purpose of the survey is to collect data on open
source object oriented software packages. In the study the correlation between
cohesion variables and other independent variables is tested.
3.3 Research Population - Open Source Software
The population of the survey is made of open source software packages. It is a very
large population but this study only focuses on software written within the dot net
framework. Open source software was chosen because by definition the source code
of proprietary software is very difficult to obtain but the source code of open source
software is freely available. The dot net framework is also becoming more popular
for developers and analysts.

- 29 -
3.4 Data Sampling
It is impractical and virtually impossible to study every occurrence of currently
available open source software packages. The study therefore needs a sampling
technique to get a large enough cross section of the population. Sample size must be
calculated and a sampling method must be designed.
3.4.1 Sample Size
A simple and reliable formula for determining sample size is:-
Sample size = 0.25 * (Certainty factor/Acceptable error) 2 obtained from
Bentley and Whitten (2000).
The certainty factor depends on how certain you want to be that the data sample will
not include variations in the sample. The certainty factor is calculated from tables
obtained from industrial engineering texts or statistics. For this study a 90% certainty
factor is assumed and an acceptable error rate of 10%. Acceptable error rate is the
maximum error rate that should be accepted by the test process. Therefore the study
sample would be: -
Sample size = 0.25 (1.645 / 10) 2 = 68
3.4.2 Stratification
Stratification is a systematic sampling technique that attempts to reduce the variance
of estimates by spreading out the sampling – for example, choosing open source
software by category and not excluding any category.
There are 14 categories (as at November 2006) that open source software belong to,
and all 14 categories will be tested. The categories are as follows: -
a) Enterprise software
b) Clustering Software
c) Multimedia software

- 30 -
d) Database software
e) Financial software
f) Networking software
g) Desktop software
h) Entertainment software
i) Security software
j) Development software
k) Hardware software
l) Systems Administration
m) Storage software
n) Voice over internet protocol software.
3.4.3 Randomization
This sampling method randomization is a technique characterized as having no
predetermined pattern or plan for selecting sample data. This study selects open
source software randomly within a specific category
Within each of the above software categories, random sampling is used to select the
packages on which the cohesion metrics software will be tested.
The following table shows the different categories together with the number of open
source programs in that category. The percentage of programs is worked out in each
category and the sample size determined from that. Since the sample size is a
percentage it is not a whole number, the number is then rounded off to the nearest
integer and the software downloaded according to the required sample.
- 31 -
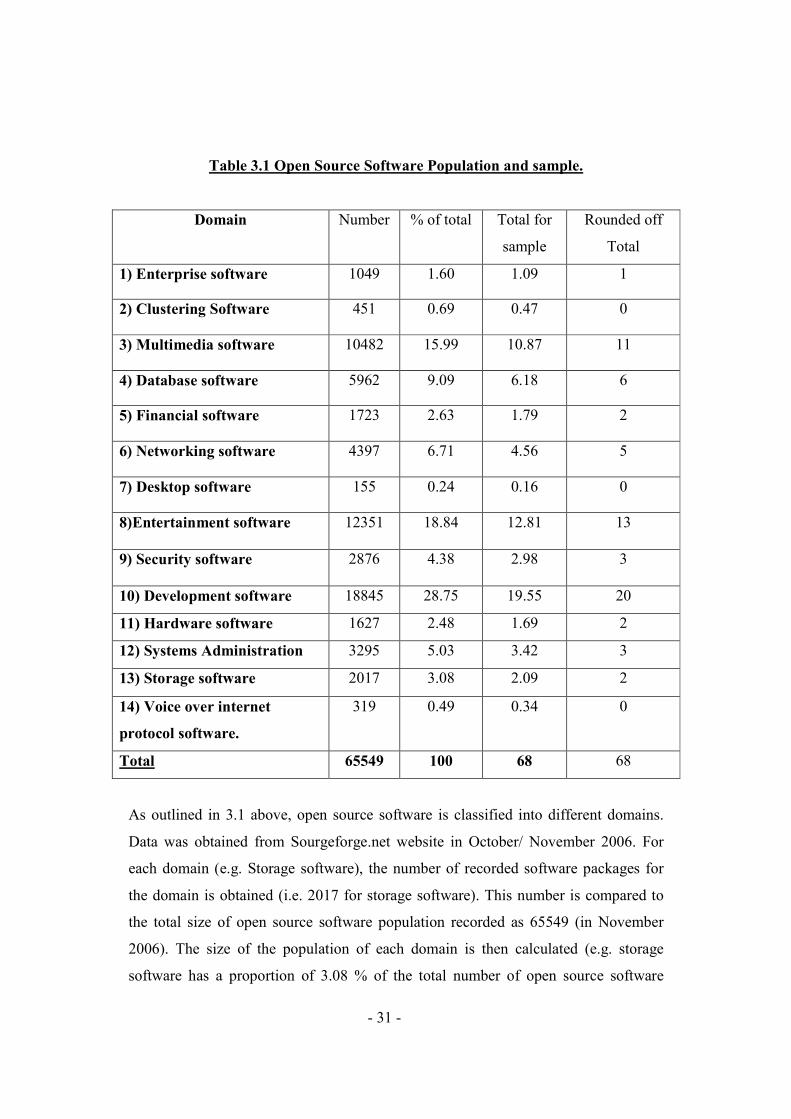
Table 3.1 Open Source Software Population and sample.
Domain Number % of total Total for
sample
Rounded off
Total
1) Enterprise software 1049 1.60 1.09 1
2) Clustering Software 451 0.69 0.47 0
3) Multimedia software 10482 15.99 10.87 11
4) Database software 5962 9.09 6.18 6
5) Financial software 1723 2.63 1.79 2
6) Networking software 4397 6.71 4.56 5
7) Desktop software 155 0.24 0.16 0
8)Entertainment software 12351 18.84 12.81 13
9) Security software 2876 4.38 2.98 3
10) Development software 18845 28.75 19.55 20
11) Hardware software 1627 2.48 1.69 2
12) Systems Administration 3295 5.03 3.42 3
13) Storage software 2017 3.08 2.09 2
14) Voice over internet
protocol software.
319 0.49 0.34 0
Total 65549 100 68 68
As outlined in 3.1 above, open source software is classified into different domains.
Data was obtained from Sourgeforge.net website in October/ November 2006. For
each domain (e.g. Storage software), the number of recorded software packages for
the domain is obtained (i.e. 2017 for storage software). This number is compared to
the total size of open source software population recorded as 65549 (in November
2006). The size of the population of each domain is then calculated (e.g. storage
software has a proportion of 3.08 % of the total number of open source software

- 32 -
population. This percentage is then used to calculate the sample size for each domain
knowing that the total sample size for the study is 68. (E.g. storage software domain
sample size is 2, that is 3.08% of 68).
3.5 Independent Variables used in this study
For each open source software package, the following data (3.5.1) is available from
the sourceforge.net website. The following variables (3.5.2) are independent variables
obtained from available information on open source software used in the study, which
are compared to the values of cohesion.
3.5.1 Souceforge.net data
a) Name of Package
This is the name of the software as baptized by its authors.
b) Number of developers
This is the number of people used for the development of the package.
c) Category
This is the category in which the package falls into; this category can be one of the 14
categories listed under the domain column of table 3.1.
d) Total number of bugs
This is the total number of bugs that were found in the package by the open source
community.
e) Total number of bugs still opened
This is the total number of bugs not yet solved.

- 33 -
f) Total number of support requests
This is the total number of help requests from the users for the package as reported
by the sourceforge.net administrators.
g) Total number of support requests still opened
This is the total number of help requests for the package, not yet been solved.
h) Total patches and feature requests
Patches are used to solve security issues and feature requests are requests that are
used to enhance the functionality of the software package. This aspect deals with the
number of patches and feature requests made by users.
i) Total patches and feature requests still opened
It is the number of patches and feature requests not yet implemented.
j) Number of messages in a public forum
This is the number of messages posted by open source forum users about the
package.
k) Mailing lists
The number of users in the packages mailing lists.
l) CVS Repository Commits
CVS stands for Concurrent Versions Systems. It is a tool used by many software
developers to manage changes within their source code tree. CVS provides the means
to store the current version of a piece of source code, and to record all changes (and
who made those changes) that have occurred to that source code from its first version
up to its current version. CVS repository commits are permanent changes made to a
software version by developers. Here this study is interested in the total number of
such commits.

- 34 -
m) CVS Repository Reads
Is the same as the above except that now this study is now interested in the number of
times such changes have been read.
n) Size
It is the amount of disk space occupied by the package (e.g. Bytes, Kilobytes,
Megabytes, etc).
o) Programming Language
It is the dot net language in which the software package is written (e.g. C#, J#,
VB.net)
p) Age
It is the number of days the project has been in existence.
3.5.2 Class cohesion variables
a) Lcom1
Lcom1 counts methods implemented in a class that only reference attributes
implemented in that class, therefore Lcom1 is the number of pairs of methods in the
class using no attribute in common.
b) Lcom2
Lcom2 is the number of pairs of methods in the class using no attributes in common,
minus the number of pairs of methods that do. If this difference is negative, however,
Lcom2 is set to zero.
c) Lcom3
Lcom3 is defined as the number of connected components in a class. Values of 1 and
greater are considered extreme lack of cohesion.

- 35 -
d) Lcom4
A value of 1 indicates a good cohesive class (Highly Cohesive). Values of 2 and
greater are considered bad (lack of cohesion). Such a class should be split.
e) Lcom5
Lcom5 Counts for each attribute, how many methods access the attribute. Only direct
connections between methods and attributes are considered. In a completely cohesive
class, each attribute is accessed by every method.
f) Connectivity (Co)
The value for Co can either be 0 or 1, where 0 means tightly cohesive and 1 means
loosely cohesive.
g) Tight Class Cohesion
Besides methods using attributes directly (by referencing them), this measure
considers attributes indirectly used by a method. Method m uses attribute a indirectly,
if m directly or indirectly invokes a method which directly uses attribute a. Two
methods are said to be connected, if they directly or indirectly use common attributes.
TCC is defined as the percentage of pairs of public methods of the class, which are
connected, i.e., pairs of methods which directly or indirectly use common attributes.
h) Loose Class Cohesion (Lcc)
Lcc is the same as Tcc, except that this measure also considers pairs of indirectly
connected methods. If there are methods m1 m2,... mn, such that mi and mi+1 are
connected for i=1,...,n-1, then m1 and mn are indirectly connected. LCC is the
percentage of pairs of public methods of the class which are directly or indirectly
connected.
i) Information-flow-based cohesion (Ich)
Ich for a method is defined as the number of invocations of other methods of the
same class, weighted by the number of parameters of the invoked method.
The Ich of a class is the sum of the Ich values of its methods.

- 36 -
3.5.3 Package cohesion variables
a) Cohesion Value – Maximum
This variable represents the maximum cohesion value among the classes of a
package.
b) Cohesion Value – Minimum
This variable represents the minimum cohesion value among the classes of a software
package.
c) Cohesion Value – Average
This variable represents the average cohesion value among the classes of a software
package. The average is the sum of cohesion values for each class divided by the
number of classes in that package.
d) Cohesion Value - Sum for package
This variable represents the sum of the cohesion values among the classes of software
package.
3.6 Research Approach
Because data is mined using association rules, and because association rules require
qualitative data, this can be described as qualitative research. However several
variables above are described by quantitative data. There is therefore a need to
convert quantitative data to qualitative data through data discretisation.
3.6.1 Qualitative Data
Only three variables have qualitative values namely package name, category of
software and programming language.

- 37 -
3.6.2 Quantitative Data
Except for package name, category of software and programming language all other
variables contain quantitative values: i.e. class cohesion values, packaged cohesion
values as defined above
3.6.3 Data Discretisation
As stated in the preceding paragraphs, almost all variables contain quantitative data
but association rules require qualitative data. This section explains how quantitative
data is converted into qualitative data through the data discretisation process.
Data discretisation is a strategy for data reduction. Data reduction techniques are
used in order to obtain a new representation of the data set that is much smaller in
volume, but yet produces the same analytical results.
The most common strategies for data reduction are:
a) Data cube aggregation
b) Dimensionality reduction
c) Numerocity reduction
d) Concept hierarchy generation and
e) Data discretisation
Simply put, data discretisation is the conversion of quantitative data into qualitative
data. The data discretisation algorithm used in this study is presented in the next
section.

- 38 -
3.6.3.1 Data discretisation algorithm
The method used here assists in dividing the range of each variable into five
segments: one segment to locate the average value of the range, two segments to
locate values below average and two segments for values above average.
The division of the data range into segments is carried out according to the following
algorithm.
Figure 3.2 Data Discretisation Algorithm
Variables
B: Array [1 .. n] of Int.
B=[3,1,2,8,4,1,1,3,1,2,1,1,1,1,1,1,1,1,11,2,1,3,1,4,1,1,1,2,1,2,1,1,1,1,1,1,2,1,1,1,1,13,1,
1,2,1,1,7,3,1,2,3,1,12,3,1,1,1,1,1,1,1,1,2,1,6,1,2]
A: Set[1..m] of Integer
E1,E2,E3,E4 : Integer;
N1, N2, N3, N4 : Integer;
Position_min1, Position_min2 , Postion_Ave1 , Position_Ave2 ,Position_Ave3 : Int;
PMin1Plus, PMax1Plus, PositionAvePlus : Integer;
Min1, Max1 : Integer;
Ave1, Ave2, Ave3 , AvePlus: Real;
Segment1, Segment2, Segment3, Segment4, Segmen5, Segment6, SegmentX: Interval;

- 39 -
Pseudo code
B=[1,1,1,1,1,1,1,1,1,1,1,1,1,1,1,1,1,1,1,1,1,1,1,1,1,1,1,1,1,1,1,1,1,1,1,1,1,1,1,1,2,2,2,2,
2,2,2,2,2,2,3,3,3,3,3,3,4,4,6,7,8,11,12,13]
A = {1,2,3,4,6,7,8,11,12,13}
Min1 = A[1];
Position_min1;
Max1 = A[n];
Positionmax1 = n;
Ave1 = average of B[1..n]
E1 = Biggest element of A less than Ave1
PositionAve1 =Position in A of E1;
Ave2 = average of B[PositionMin1..PositionAve1] = Average of B[1..2]
E2 = Biggest element of A less than Ave2
Position_Ave2 = Position in A of E2 = 1
Ave3 = average of B[PositionAve1+1 ..PositionMax1]
E3 = Biggest element of A less than Ave3
Position_Ave3 = Position in A of E3 ;
Segment 1 = [PositionMin1 .. PositionAve2]
Segment 2 = ]PositionAve2 .. PositionAve1]
Segment 3 = ]PositionAve1 .. PositionAve3]
Segment 4 = ]PositionAve3 .. PositionMax1]
Calculate N1, N2, N3, N4;
SegmentX = Most populated non singleton segment from Segment 1, 2, 3, 4
PMin1Plus = Beginning of SegmentX
PMax1Plus = End of SegmentX
AvePlus = average of B[PMin1Plus..Pmax1Plus]
E4 = Biggest element of A less than AvePlus
PositionAvePlus = Position in A of E4
Segment 5 = [PMin1Plus .. PositionAvePlus]
Segment 6 = ]PositionAvePlus..Pmax1Plus]

- 40 -
The following section runs the data discretisation algorithm for the variable
representing the number of developers. The dataset for the variables representing the
number of developers is given below:
B={3,1,2,8,4,1,1,3,1,2,1,1,1,1,1,1,1,1,11,2,1,3,1,4,1,1,1,2,1,2,1,1,1,1,1,1,2,1,1,1,1,13,
1,1,2,1,1,7,3,1,2,3,1,12,3,1,1,1,1,1,1,1,1,2,1,6,1,2}
Figure 3.3 Example of data discretisation: (Number of Developers)
Variables
B: Array [1 .. n] of Int.
B=[3,1,2,8,4,1,1,3,1,2,1,1,1,1,1,1,1,1,11,2,1,3,1,4,1,1,1,2,1,2,1,1,1,1,1,1,2,1,1,1,1,13,
1,1,2,1,1,7,3,1,2,3,1,12,3,1,1,1,1,1,1,1,1,2,1,6,1,2]
A: Set[1..m] of Integers
E1,E2,E3,E4 : Integer;
N1, N2, N3, N4 : Integer;
Position_min1, Position_min2 , Postion_Ave1 , Position_Ave2 ,Position_Ave3 : Int.
PMin1Plus, PMax1Plus, PositionAvePlus : Integer;
Min1, Max1 : Int.
Ave1, Ave2, Ave3 , AvePlus: Real;
Segment1, Segment2, Segment3, Segment4, Segmen5, Segment6, SegmentX:
Interval;

- 41 -
Pseudo code
B=[1,1,1,1,1,1,1,1,1,1,1,1,1,1,1,1,1,1,1,1,1,1,1,1,1,1,1,1,1,1,1,1,1,1,1,1,1,1,1,1,2,2,2,
2,2,2,2,2,2,2,3,3,3,3,3,3,4,4,6,7,8,11,12,13]
A = {1,2,3,4,6,7,8,11,12,13}
Min1 = A[1]; Positionmin1 = 1;
Max1 = A[n] = 13; Positionmax1 =13;
Ave1 = average of B[1..n] = 2.1618
E1 = Biggest element of A less than Ave1 = 2
PositionAve1 =Position in A of E1 = 2;
Ave2 = average of B[PositionMin1..PositionAve1] = Average of B[1..2] = 1.1852
E2 = Biggest element of A less than Ave2 = 1
Position_Ave2 = Position in A of E2 = 1
Ave3 = average of B[PositionAve1+1 ..PositionMax1]= Ave of B[3.. 13] = 5.9286
E3 = Biggest element of A less than Ave3 = 4
Position_Ave3 = Position in A of E3 = 4 ;
Segment 1 = [PositionMin1 .. PositionAve2] = [1..1]
Segment 2 = ]PositionAve2 .. PositionAve1] = ]1..2]
Segment 3 = ]PositionAve1 .. PositionAve3] = ]2..4]
Segment 4 = ]PositionAve3 .. PositionMax1] = ]4..13]
N1 = 44; /* But segment 1 is a singleton i.e only made up of the element 1 */
N2 = 10; /* But segment 2 is a singleton i.e only made up of the element 2 */
N3 = 8; /* But segment 3 is not a singleton i.e made up of the elements 3 and 4 */
N4 = 6; /*But segment 4 is not a singleton i.e made up of the elements
6,7,8,11,12,13 */
SegmentX=Most populated non singleton segment from Segment 1,2,3,4 = Segment 3
PMin1Plus = Beginning of SegmentX = 3
PMax1Plus = End of SegmentX = 4
AvePlus = average of B[PMin1Plus..Pmax1Plus] = Average of B[3..4] = 3.3
E4 = Biggest element of A less than AvePlus = 3
PositionAvePlus = Position in A of E4 = 3
Segment 5 = [PMin1Plus .. PositionAvePlus] = ]3..3]
Segment 6 = ]PositionAvePlus..Pmax1Plus] = ]3..4]

- 42 -
Table No 3.3: Number of Developers –
(Part of the data columns from the study)
3 Average Minus
1 very low
2 Low
8 High
4 Average Plus
11 High
13 Very high
7 High
12 High
6 High
Data discretisation will be performed on all numeric rows in the study.
3.7 Data Processing Techniques
Data mining is the data processing technique used in this study. There are several
data mining techniques e.g. Classification Trees; Association Discovery Techniques;
Clustering Techniques; Artificial Neural Networks; Optimized Set Reduction and
Bayesian Belief Networks
Classification or decision trees are induction techniques used to discover
classification rules for a chosen attribute of a data set by systematically subdividing
the information contained in this data set. They are one of the tools of choice for
building classification models in the software engineering field. Association
discovery extracts information from coincidences in the data set. Knowledge
discovery takes place when these coincidences are previously unknown, non-trivial,
and interpretable by a domain expert.

- 43 -
Clustering is group data records with similar attributes together so information can be
abstracted. Neural networks have been one of the tools of choice for building
predictive software engineering models. They are heavily interconnected networks of
simple computational elements. Optimized Set Reduction (OSR) is a technique that
was specifically developed in the realms of software engineering data analysis. Its
approach is to determine what subset of data records provides the best
characterization for the entities being assessed.
3.7.1 Data Mining
Generally, data mining (sometimes called data or knowledge discovery) is the process
of analyzing data from different perspectives and summarizing it into useful
information - information that can be used to increase revenue, cut costs, or both.
Technically, data mining is the process of finding correlations or patterns among
fields in large databases.
One of the ways of finding these patterns is through association rules. Data mining
software is one of a number of analytical tools for analyzing data. It allows users to
analyze data from many different dimensions or angles, categorize it, and summarize
the relationships identified.
3.7.2 Association Rules
Association rules mining finds interesting associations and/or correlation among large
sets of data items. Association rules shows attribute value conditions that occur
frequently together in a given dataset. Algorithms for discovering large item sets
make multiple passes over the data. In the first pass support of individual items is
counted and those that are large i.e. have required minimum support are identified.
Each subsequent pass starts with a seed set of item sets found to be large in the
previous pass. This seed set is used for generating new potentially large item sets,
called candidate item sets, and count the actual support for these candidate item sets
during the pass over the data. At the end of the pass, the larger candidate item sets are
determined, and they become the seed for the next pass.

- 44 -
This process continues until no new large item sets are found. The market basket
analysis is one way in which association rules are used.
Market basket analysis is possibly the largest application for algorithms that discover
association rules. These days, purchased items have bar codes that enable retail
organizations to track the sale of items and if a retail organization issues 'loyalty
cards' the organization can track the purchases made by customers. A typical
customer will revisit the same supermarket many times throughout the year. A
transaction refers to a single visit and associated with each transaction is a purchase
date and the items purchased.
The term 'basket data' is used to refer to such transaction data. By analyzing basket
data, retail organizations can extract information to drive their marketing strategy.
For example, the data may show that customers who purchase baby products have a
tendency to purchase ready-made meals. This information can then be used for target
marketing (e.g., send promotional offers for take-away meals to customers who
purchase baby products) (Agrawal and Srikant, 1994).
The application of association rules is not restricted to market basket analysis. The
following section explains the Apriori algorithm as published by Agrawal, Imielinski
and Swami (1993).
3.7.2.1 The Apriori Algorithm
The algorithm is given by the following pseudo code.
The Apriori Algorithm: Pseudo code
Ck: Candidate itemset of size
Lk: frequent itemset of size k

- 45 -
Join Step: Ck is generated by joining Lk-1with itself
Prune Step: Any (k-1)-itemset that is not frequent cannot be a subset of a frequent k-
itemset
L1= {frequent items};
One way to explain the algorithm is to run it with an example. Consider a database
consisting of six records.
Table 3.4: Package Database
Package No of developers No of Bugs Size
Package 1 High Large Very big
Package 2 Low Small Very Small
Package 3 Low Small Very Small
Package 4 High Medium Very Big
Package 5 High Large Very Big
Package 6 Low Small Very Big
Suppose the sequential minimum support is 2, meaning only associations supported
by least 2 records will be considered. Let the minimum required confidence be 70%.
The percentage of the confidence factor is according to how correct one wants the
information to be.

- 46 -
Firstly, the large itemset called L1 in the algorithm has to be determined. L1is simply
the list of all attributes values satisfying the required minimum support.
Table 3.5: Frequent Itemsets
Package Item Set
Package 1 High, Large, Very big
Package 2 Low, Small, Very Small
Package 3 Low, Small, Very Small
Package 4 High, Medium, Very Big
Package 5 High, Large, Very Big
Package 6 Low, Small, Very Big
Table 3.6: Attribute Values
In the algorithm it is said that C2 = aprior_gen (L1).
In other words the algorithm uses L1 cross-tabulate L1 to generate a candidate set of
2-itemsets, C2.
Cross tabs are frequently used because:
Item Set Sup Count
{high} 3
{large} 2
{very big} 4
{low} 3
{small} 3
{very small} 2
{medium} 1
Item Set Sup Count
{high} 3
{large} 2
{very big} 4
{low} 3
{small} 3
{very small} 2
L1 Attribute Values

- 47 -
� They are easy to understand. They appeal to people that do not understand the
most sophisticated measures.
� They can be used with any level of data: nominal, ordinal, interval, or ratios
cross tabs treat all data as if it is nominal.
� A table can provide greater insight than single statistics.
� It solves the problem of empty or sparse cells.
� They are simple to conduct.
Therefore, it can be said that: C2 = L1 * L1
Where the * represents cross tabulation.
Table 3.7: Itemsets
C2 = L1 * L1
C2
L2 is made of C2 items with the require minimum support
Now moving on to C3 = L2 * L2
Where * means the Join
{high, large} 2
{high, very big} 3
{high, low} 0
{high, small} 0
{high , very small} 0
{large, very big} 2
{large, low} 0
{large ,small} 0
{large, very small} 0
{very big, low} 1
{very big, small} 1
{very big, very small} 0
{low, small} 3
{low, very small} 2
{small , very small} 2

- 48 -
Table 3.8: Items with minimum support
Table 3.9 : - 3-Itemset
L3
Now moving on to C4 = L3 Join L3
The two items in L3 do not have a common value, so L3 Join L3 = 0 therefore C4 = 0
and the algorithm stops. So the largest frequent item set is in L3.
Item Set Support
Count
{high, large} 2
{high, very big} 3
{large, very big} 2
{low, small} 3
{low, very small} 2
{small , very small} 2
3 – Itemset Support
Count
{high, Large, Very
Big}
2
{Low, Small, Very
small}
2
3 – Itemset Support
Count
{high, Large, Very
Big}
2
{Low, Small, Very
small}
2
L3

- 49 -
It is now time to generate associations from the largest itemset according to the
following procedure.
Procedure:
For each frequent itemset “I”, which generate all nonempty subsets of l.
For every nonempty subsets s of I, output the rule “s →(I-s)” if Support (I)/
Support(s) >= minimum support confidence.
Let’s look at the example again.
For I = (Low, Small, Very Small) and I = {High, Large, very big}
If s = {Low} then l- s is (Small and very small)
Support (I) = 2
Support (s) = 3
Support (I) / Support (I - S) = 2/3 = 67%
That implies that if the number of developers is low then the number of bugs is small
and the size is very small.
If s = {small} then 1-s is {Low, very small}
That implies that if number of bugs is small then the no of developers is low and the
size is very small
If s = {very small} then 1-s is {Low, small}
That implies that if Size is very small then the no of developers is low and no of bugs
is small.
If s = {High} then 1-s is {Large, very big}
That implies that if no. of developers is high then No. of bugs is Large and Size is
very big.

- 50 -
If s = {Large} then 1-s is {High, very big}
That implies that if the number of bugs is large then the number of developers is high
and the Size is very big.
If s = {very big} then 1-s is {High, Large}
That implies that if the Size is very big then number of developers is high and the
number of bugs is large.
From the above this is the final set of association rules:
a) That if the number of developers is low then the number of bugs is small and
the size is very small.
b) That if number of bugs is small then the no of developers is low and the size
is very small
c) That if Size is very small then the no of developers is low and no of bugs is
small.
d) That if no. of developers is high then No. of bugs is Large and Size is very
big.
e) That if the number of bugs is large then the number of developers is high and
the Size is very big.
f) That if the Size is very big then number of developers is high and the number
of bugs is large.

- 51 -
3.8 Program Design
The purpose of this section is to explain the architectural design of the program used
for the computation of the cohesion values of a package classes.
A package is made of different classes. There exists a C # structure that represents all
the types of classes in a package. That structure is the assembly structure.
The different classes in the class diagram below can be constructed with their main
attributes and methods as indicated in fig 3.1, 3.2, and 3.3.
3.8.1 Class Diagram
Below are the classes that are designed to write the program.
A class is made of attributes (fields) and methods (operations). In return, an attribute
belongs to given class type and a method also accesses attribute. The user interacts
with the program using a form. (See fig. 3.1)
Fig 3.1: System Class Diagram
The class type and assembly belong to C#. The main methods for type are
getMethods and getFields. The main method for assembly is getTypes.
type (C#)
Field
(Attribute)
Class Method
Package Form (I/O class)
Assembly (C#)

- 52 -
Fig. 3.2 Package outline
Fig 3.3 Class Outline
Fig 3.4 Lcom1 outline for class c
Fig 3.4 Lcom Outline for class c
Class Package
fileName : String
classes: List of Class
assembly: Assembly
Package (filePath): Constructor
fileName = FilePath
Classes = 0
assembly = Create New Assembly for the path “filepath”
For each type_ in Assembly.getTypes
{c = newclass(type_); Add c to classes}
class Class
type : Type /* C# data structure */
methods: List of Methods
fields: List of Fields
Class (type): Constructor
type = type_
methods = type.getMethods
fields = type.getFields
Lcom1
/* See algorithm in the next figure */
L = 0
for each methodI in c.Method
for each methodJ in c.Method
fieldI = methodI. getReferenceFields
fieldJ = methodJ. getReferenceFields
L= L + (fieldi – fieldj)
Lcom1 = L

- 53 -
3.8.2 Sequence Diagram
A system sequence diagram is used to show the flow of messages in the designed
program. Diagram in figures 3.5 and 3.6 is a systems sequence diagram of the
program design
Suppose a user wants to calculate the cohesion of all classes inside a package located
in the file c:\xmas\solar.exe. A form is presented to the user from which he / she can
locate the file c:\xmas\solar.exe. The form has an instance of a package but at this
stage, that instance is not yet created. The form can now create the instance by
passing to it the file name for which an assembly is created inside the package. This
creation of that instance means that a list of instances of classes has been created for
each type in the assembly of the package. Now that the package has been fully
constructed, the calculation of cohesion values for each class in the package can now
proceed, and the results of those calculations are output on the form.
3.8.3 Use Case Diagram
Once a user selects a package, the user can then request for the cohesion values of
that package to be calculated. The program calculates the cohesion of each class of
the selected package and displays the results. (Fig 3.6)

- 54 -
Fig. 3.5 System Sequence Diagram

- 55 -
Fig 3.6 Lcom1 – Sequence Diagram
c:class methodI::Method methodJ::Method
ReferenceFields
fieldsI
ReferenceFileds
fieldJ
For each (methodI, methodJ)
in (method x method)
L = L + (fieldI - filedJ)
L = 0
LCom1 = L
3.9 Conclusion
Chapter three described the research design for the rest of the study and for the
program that has been written to test cohesion. Data mining and data mining
techniques were discussed and in particular association rules which is used to
determine correlation between different values.

- 56 -
The research design uses a survey of 68 randomized open source software programs
within a stratified group. Each independent variable used in the study is compared to
cohesion. All variables are presented as either being quantitative or qualitative. Data
discretisation was performed on all collected data and the method of discretisation
was explained using an example from the study. Data mining and the algorithm
known as Apriori was discussed and explained using an example from the collected
data.
The program design of classes is discussed to show how classes of the written
software program are compiled.
In Chapter four the results obtained from the association rules of data mining using
the Apriori algorithm will be discuss and analysed. In addition, the difficulties and
future work for the study are then discussed.

- 57 -
Chapter Four - Results
4.1 Introduction
This chapter analyses and interprets the association rules obtained from the data
collected. The chapter starts with a short definition of association rules.
The list of all association rules obtained from the data is then presented. That list is
then cleaned with the view of eliminating meaningless rules once the criterion for
rule selection has been defined. The chapter ends with a classification of the selected
rules in accordance with the research hypothesis defined in the previous chapters.
4.2 Association Rules
Maqbool et al (1995) describes association rules as attributes value conditions that
occur frequently together in a given dataset. Association rules provide information of
this type in the form of "if-then" statements. These rules are computed from the data
and, unlike the if-then rules of logic, association rules are probabilistic in nature. In
addition to the antecedent (the "if" part) and the consequent (the "then" part), an
association rule has two numbers that express the degree of uncertainty about the
rule. The antecedent and consequent are sets of items (called itemsets) that are
disjoint (do not have any items in common).
The legitimacy of each association with regard to the values in the whole dataset is
described by two metrics: the support and the confidence.
The support represents the number of transactions whose attributes match both the
antecedent and consequent parts of the rule.
Confidence of rule "B given A" is a measure of how much more likely it is that B
occurs when A has occurred. It is expressed as a percentage, with 100% meaning B
always occurs if A has occurred. Statisticians refer to this as the conditional
probability of B given A. When used with association rules, the term confidence is

- 58 -
observational rather than predictive. (Statisticians also use this term in an unrelated
way. There are ways to estimate an interval and the probability that the interval
contains the true value of a parameter is called the interval confidence. So a 95%
confidence interval for the mean has a probability of .95 of covering the true value of
the mean.) (Two Crows Corporation, 2005)
4.3 Rules obtained from independent variables and cohesion values.
Having in mind the data set described in the previous chapter, it is now time to
present the association rules obtained from the data. The rules are listed according to
the following protocol. Rules with no mention of a cohesion variable are put in one
section. Rules with mention of single cohesion variables are grouped under another
section specific to those cohesion variables. Rules with mention of many cohesion
values are not listed because the correlation between cohesion values is not studied
here. The entire set of rules can be viewed in Appendix B
4.4 Criteria for rule selection
The criteria for the selection of rules are based on the hypothesis. If a rule confirms
the hypothesis, then that rule is chosen. If a rule does not support any hypothesis then
that rule is disregarded.
For example, if a rule states that the cohesion value is high when the software
package size is small, then that rule is selected since it is in line with the studies
hypothesis.
If a rule states the cohesion value is low for a software package easily maintainable,
then that rule is discarded because it is not in line with this hypothesis. If a rule
supports one hypothesis and that rule contradicts another hypothesis than that rule is
discarded. The following rules are selected from the appendix of rules on the basis of
the selection criteria.

- 59 -
4.5 Selected Rules
4.5.1 Rules with no cohesion variables.
Selected Rule 1 (Rule 67,69,71,73,81,1006,1012,1016, 1022,1029,1035 )
Total no. of Support Requests=very_low_Plus 56 ==> Support requests still
opened=very_low 56 conf:(1)
Selected Rule 2 (Rule 68, 70, 72, 74, 79, 82, 1004, 1009, 1014, 1020, 1026, 1033,)
Total patches and Feature Requests=very_low 56 ==> Total patches and Feature
Requests still opened=very_low 56 conf:(1)
Selected rule 1 and 2 are obtained by mining Lcom1 with all independent variables,
Lcom2 with all independent variables, Lcom3 with all independent variables, Lcom4
with all independent variables, Tcc with all independent variables, Lcc with all
independent variables and Ich with all independent variables
Selected Rule 3 (Rule 76, 80, 83, 88)
Support requests still opened=very_low Total patches and Feature
Requests=very_low 55 ==> Total patches and Feature Requests still
opened=very_low 55 conf :(1)
Selected rule 3 is obtained by mining Tcc with all independent variables, Ich with all
independent variables and Lcc with all independent variables.
Remark: Selected rule 3 summarizes selected rule 1 and selected rule 2 but the
support is slightly different.
Selected Rule 4 (Rule 77, 86)
No of Bugs still opened=very_low 56 ==> Support requests still opened=very_low 55
conf:(0.98)

- 60 -
Selected rule 4 is obtained by mining Tcc with all independent variables and Lcc with
all independent variables.
Selected Rule 5 (Rule 78)
Total no. of Support Requests=very_low 60 ==> Support requests still
opened=very_low 58 conf:(0.97)
Selected rule 5 is obtained by mining Tcc with all independent variables.
Selected Rule 6 (Rule 84)
No of Bugs still opened=very_low Total no. of Support Requests=very_low_Plus 51
==> Support requests still opened=very_low 51 conf:(1)
Remark: Selected rule 6 summarizes selected rule 4 and selected rule 5 but the
support is different.
Selected rules 6 is obtained by mining Ich with all independent variables
Selected Rule 7 (Rule 85)
Total no. of Support Requests=very_low_Plus Total patches and Feature Requests
still opened=very_low 51 ==> Support requests still opened=very_low 51 conf:(1)
Selected rules 7 is obtained by mining Ich with all independent variables
Selected Rule 8 (Rule 87)
Total patches and Feature Requests still opened=very_low 58 ==> Total patches and
Feature Requests=very_low 56 conf:(0.97)
Selected rules 8 is obtained by mining Ich with all independent variables
Selected Rule 9 (Rule 89)
No of Bugs still opened=very_low Support requests still opened=very_low 53 ==>
Total no. of Support Requests=very_low_Plus 51 conf:(0.96)

- 61 -
Selected rules 9 is obtained by mining Ich with all independent variables
Selected Rule 10 (Rule 90)
Total patches and Feature Requests still opened=very_low 58 ==> Support requests
still opened=very_low 55 conf:(0.95)
Selected rules 10 is obtained by mining Ich with all independent variables
Remark: Contained in selected rule 7 but the support is different.
Selected Rule 11 (Rule 1003)
Total No of bugs=very_low 46 ==> No of Bugs still opened=very_low 46 conf:(1)
Selected rule 11 is obtained by mining Lcom1 with bugs
Selected Rule 12 (Rule 1005, 1010, 1015, 1021, 1034)
Total patches and Feature Requests still opened=very_low 58 ==> Total patches and
Feature Requests=very_low 56 conf:(0.97)
Selected rule 12 is obtained by mining Lcom1 with total patches and feature requests,
Lcom2 with total patches and feature requests, Lcom3 with total patches and feature
requests, Lcom4 with total patches and feature requests and Ich with total patches and
feature requests
Selected Rule 13 (Rule 1007, 1011, 1017,1023, 1030, 1036)
Support requests still opened=very_low 61 ==> Total no. of Support
Requests=very_low_Plus 56 conf:(0.92)
Selected rule 13 is obtained by mining Lcom1 with support requests, Lcom2 with
support requests, Lcom3 with support requests, Lcom4 with support requests, Tcc
with support requests and Ich with support requests

- 62 -
Selected Rule 14 (Rule 1008, 1018, 1024, 1027, 1031, 1037)
CVS Repository - Commits=very_low 50 ==> CVS Repository - Read=very_low 49
conf:(0.98)
Selected rule 14 is obtained by mining Lcom1 with CVS Repository , Lcom3 with
CVS Repository , Lcom4 with CVS Repository, Lcc with CVS Repository, Tcc with
CVS Repository and Ich with CVS Repository
Selected Rule 15 (Rule 1013, 1019, 1025, 1028, 1032)
Total No of bugs=very_low 46 ==> No of Bugs still opened=very_low 46 conf:(1)
Selected rule 15 is obtained by mining Lcom3 with Bugs, Lcom4 with Bugs, Lcc
with Bugs , Tcc with Bugs and Ich with bugs
4.5.2 Rules with one cohesion variable
4.5.2.1 Mining one cohesion variable against all independent variables
Obtained by mining Lcom1 with all independent variables
Selected Rule 16 (Rule 3)
Support requests still opened=very_low 61 ==> Lcom1 Value Minimum=high 60
conf:(0.98)
Selected Rule 17 (Rule 5)
Total patches and Feature Requests still opened=very_low 58 ==> Lcom1 Value -
Minimum=high 57 conf:(0.98)
Selected Rule 18 (Rule 6)
Total no. of Support Requests=very_low_Plus 56 ==> Lcom1 Value -
Minimum=high 55 conf:(0.98)

- 63 -
Selected Rule 19 (Rule 7)
Total patches and Feature Requests=very_low 56 ==> Lcom1 Value -
Minimum=high 55 conf:(0.98)
Selected Rule 20 (Rule 8)
Total no. of Support Requests=very_low_Plus Support requests still
opened=very_low 56 ==> Lcom1 Value - Minimum=high 55 conf:(0.98)
Obtained by mining Lcom3 with all independent variables
Selected Rule 21 (Rule 17)
CVS Repository - Read=very_low 55 ==> Lcom3 Value - Minimum=high 55
conf:(1)
Selected Rule 22 (Rule 20)
Support requests still opened=very_low 61 ==> Lcom3 Value - Minimum=high 59
conf:(0.97)
Selected Rule 23 (Rule 22)
Total patches and Feature Requests still opened=very_low 58 ==> Lcom3 Value -
Minimum=high 56 conf:(0.97)
Selected Rule 24 (Rule 23)
Total no. of Support Requests=very_low_Plus 56 ==> Lcom3 Value -
Minimum=high 54 conf:(0.96)
Selected Rule 25 (Rule 24)
Total patches and Feature Requests=very_low 56 ==> Lcom3 Value -
Minimum=high 54 conf:(0.96)

- 64 -
4.5.2.2 Mining one cohesion variable against one independent variable
Obtained by mining Lcom1 with Bugs
Selected Rule 26 (Rule 93)
No of Bugs still opened=very_low 56 ==> Lcom1 Value - Minimum=high 53
conf:(0.95)
Obtained by mining Lcom1 with Age
Selected Rule 27 (Rule 100)
Age=new 17 ==> Lcom1 Value - Minimum=high 17 conf:(1)
Obtained by mining Lcom1 with Category
Selected Rule 28 (Rule 110)
Category=Development_software 20 ==> Lcom1 Value - Minimum=high 20
conf:(1)
Obtained by mining Lcom1 with Number of Developers
Selected Rule 29 (Rule 120)
Number of Developers=very_low 44 ==> Lcom1 Value - Minimum=high 43
conf:(0.98)
Obtained by mining Lcom1 with Mailing Lists
Selected Rule 30 (Rule 130)
Mailing Lists=low 53 ==> Lcom1 Value - Minimum=high 52 conf:(0.98)
Obtained by mining Lcom1 with number of messages in a public forum
Selected Rule 31 (Rule 140)
No. of messages in public forums=very_low_Minus 18 ==> Lcom1 Value -
Minimum=high 18 conf:(1)

- 65 -
Selected Rule 32 (Rule 141)
No. of messages in public forums=very_low_Plus 30 ==> Lcom1 Value -
Minimum=high 29 conf:(0.97)
Obtained by mining Lcom1 with total patches and feature requests
Selected Rule 33 (Rule 150)
Total patches and Feature Requests still opened=very_low 58 ==> Lcom1 Value -
Minimum=high 57 conf:(0.98)
Selected Rule 34 (Rule 154)
Total patches and Feature Requests=very_low 56 ==> Lcom1 Value -
Minimum=high 55 conf:(0.98)
Selected Rule 35 (Rule 156)
Total patches and Feature Requests still opened=very_low 58 ==> Total patches and
Feature Requests=very_low Lcom1 Value - Minimum=high 55 conf:(0.95)
Obtained by mining Lcom1 with Programming Language
Selected Rule 36 (Rule 157)
Programming Language=C# 45 ==> Lcom1 Value - Minimum=high 44 conf:(0.98)
Obtained by mining Lcom1 with Size
Selected Rule 37 (Rule 166)
KiloBytes=very_low_Plus 19 ==> Lcom1 Value - Minimum=high 19 conf:(1)
Selected Rule 38 (Rule 167)
KiloBytes=very_low_Minus 24 ==> Lcom1 Value - Minimum=high 23 conf:(0.96)
Obtained by mining Lcom1 with Support Requests
Selected Rule 39 (Rule 176)
Support requests still opened=very_low 61 ==> Lcom1 Value - Minimum=high 60
conf:(0.98)

- 66 -
Selected Rule 40 (Rule 179)
Total no. of Support Requests=very_low_Plus Support requests still
opened=very_low 56 ==> Lcom1 Value - Minimum=high 55 conf:(0.98)
Selected Rule 41 (Rule 180)
Total no. of Support Requests=very_low_Plus 56 ==> Lcom1 Value -
Minimum=high 55 conf:(0.98)
Obtained by mining Lcom1 and CVS Repository
Selected Rule 42 (Rule 183)
CVS Repository - Commits=very_low 50 ==> Lcom1 Value - Minimum=high 50
conf:(1)
Selected Rule 43 (Rule 184)
CVS Repository - Commits=very_low CVS Repository - Read=very_low 49 ==>
Lcom1 Value - Minimum=high 49 conf:(1)
Selected Rule 44 (Rule 188)
CVS Repository - Read=very_low 55 ==> Lcom1 Value - Minimum=high 54
conf:(0.98)
Obtained by mining Lcom3 with Bugs
Selected Rule 45 (Rule 302)
Total No of bugs=very_low 46 ==> No of Bugs still opened=very_low Lcom3 Value
- Minimum=high 43 conf:(0.93)
Obtained by mining Lcom3 with number of developers
Selected Rule 46 (Rule 325)
Number of Developers=very_low 44 ==> Lcom3 Value - Minimum=high 43
conf:(0.98)
No rules were selected for Lcom2

- 67 -
Obtained by mining Lcom3 with mailing lists
Selected Rule 47 (Rule 335)
Mailing Lists=low 53 ==> Lcom3 Value - Minimum=high 52 conf:(0.98)
Obtained by mining Lcom3 with number of lists in a public forum
Selected Rule 48 (Rule 345)
No. of messages in public forums=very_low_Plus 30 ==> Lcom3 Value -
Minimum=high 30 conf:(1)
Obtained by mining Lcom3 with total number of patches and feature requests
Selected Rule 49 (Rule 355)
Total patches and Feature Requests=very_low 56 ==> Total patches and Feature
Requests still opened=very_low Lcom3 Value - Minimum=high 54 conf:(0.96)
Selected Rule 50 (Rule 356)
Total patches and Feature Requests=very_low Total patches and Feature Requests
still opened=very_low 56 ==> Lcom3 Value - Minimum=high 54 conf:(0.96)
Selected Rule 51 (Rule 358)
Total patches and Feature Requests=very_low 56 ==> Lcom3 Value -
Minimum=high 54 conf:(0.96)
Selected Rule 52 (Rule 360)
Total patches and Feature Requests still opened=very_low 58 ==> Total patches and
Feature Requests=very_low Lcom3 Value - Minimum=high 54 conf:(0.93)
Selected Rule 53 (Rule 361)
Total patches and Feature Requests still opened=very_low 58 ==> Lcom3 Value -
Minimum=high 56 conf:(0.97)
Obtained by mining Lcom3 with Programming Language
Selected Rule 54 (Rule 363)
Programming Language=C# 45 ==> Lcom3 Value - Minimum=high 43 conf:(0.96)

- 68 -
Obtained by mining Lcom3 with Size
Selected Rule 55 (Rule 373)
KiloBytes=very_low_Minus 24 ==> Lcom3 Value - Minimum=high 24 conf:(1)
Obtained by mining Lcom3 with Support Requests
Selected Rule 56 (Rule 384)
Support requests still opened=very_low 61 ==> Lcom3 Value - Minimum=high 59
conf:(0.97)
Selected Rule 57 (Rule 385)
Total no. of Support Requests=very_low_Plus 56 ==> Support requests still
opened=very_low Lcom3 Value - Minimum=high 54 conf:(0.96)
Selected Rule 58 (Rule 386)
Total no. of Support Requests=very_low_Plus Support requests still
opened=very_low 56 ==> Lcom3 Value - Minimum=high 54 conf:(0.96)
Selected Rule 59 (Rule 387)
Total no. of Support Requests=very_low_Plus 56 ==> Lcom3 Value -
Minimum=high 54 conf:(0.96)
Obtained by mining Lcom3 with CVS Repository
Selected Rule 60 (Rule 391)
CVS Repository - Read=very_low 55 ==> Lcom3 Value - Minimum=high 55
conf:(1)
Selected Rule 61 (Rule 392)
CVS Repository - Commits=very_low 50 ==> Lcom3 Value - Minimum=high 50
conf:(1)
Selected Rule 62 (Rule 393)
CVS Repository - Commits=very_low CVS Repository - Read=very_low 49 ==>
Lcom3 Value - Minimum=high 49 conf:(1)
Selected Rule 63 (Rule 397)
CVS Repository - Commits=very_low 50 ==> CVS Repository - Read=very_low
Lcom3 Value - Minimum=high 49 conf:(0.98)

- 69 -
Obtained by mining Lcom4 with Category
Selected Rule 64 (Rule 414)
Category=Development_software 20 ==> Lcom4 Value Maximum=very_low 20
conf:(1)
Obtained by mining Lcom4 with number of Developers
Selected Rule 65 (Rule 424)
Number of Developers=very_low 44 ==> Lcom4 Value -Maximum=very_low 44
conf:(1)
Obtained by mining Lcom4 with Mailing Lists
Selected Rule 66 (Rule 434)
Mailing Lists=low 53 ==> Lcom4 Value -Maximum=very_low 53 conf:(1)
Obtained by mining Lcom4 with number of messages in a public forum
Selected Rule 67 (Rule 444)
No. of messages in public forums=very_low_Plus 30 ==> Lcom4 Value -
Maximum=very_low 30 conf:(1)
Obtained by mining Lcom4 with total number patches and feature requests
Selected Rule 68 (Rule 454)
Total patches and Feature Requests still opened=very_low 58 ==> Lcom4 Value -
Maximum=very_low 58 conf:(1)
Obtained by mining Lcom4 with programming Language
Selected Rule 69 (Rule 464)
Programming Language=C# 45 ==> Lcom4 Value -Maximum=very_low 45
conf:(1)
The selected rules obtained for Lcom4 is discarded because it does not match the
hypothesis outlined in chapter 1. For example if selected rules 48 and 67 was

- 70 -
compared, a contradiction would have resulted. Therefore, the one that does not
match the hypothesis, in this case it is selected rule 67, would have to be discarded.
No rules were selected for Lcom5, Co, Lcc, Tcc and Ich
4.6. Rules Interpretation
Lets interpret one of the above listed rules, for example, Selected Rule 2. Total
patches and Feature Requests = very_low 58 ==> Total patches and Feature Requests
still opened = very_low 58 conf :(1)
This rule means:- If the total patches and feature requests is very low that implies the
total patches and feature requests that are still not resolved are also very low with a
confidence factor of 100%, 58 records from the 68 records matched this rule. All the
other rules can be interpreted in a similar way.
4.7 Results
The following results were obtained from the association rules.
4.7.1 Independence of variables
The following positive conclusion can be reached by the study with the rules that
contained no cohesion variables
a) There is a correlation between the total number of support requests and the
total number of support requests still opened. There is also a correlation
between the total number of patches and feature requests, and the total
number of patches and feature requests still opened. This is validated by
selected rules 1, 2, 3, 5, 7, 8, 10, 12, 13. There is a correlation between the
total number of bugs in a software program and the number of bugs in a
program yet to be solved. This is validated by selected rule 11 and 15. A
correlation exists between the CVS repository commits and the CVS
repositories read. This is validated by selected rule 14.

- 71 -
b) A correlation exists between the number of bugs and the number of support
requests. This is validated by selected rules 4, 6, 9
4.7.2 Validity of cohesion formulas
The following positive conclusion can be reached by the study with the rules that
contained one cohesion variable against all independent variable.
There is empirical evidence that Lcom1 and Lcom3 are valid formulas for the
calculation of cohesion when testing independent variables. This is validated by
selected rules 16 to 69
4.7.3 Correlation between independent variable and cohesion
Bugs, Age, Number of Developers, Mailing Lists, number of messages in a public
forum, total patches and feature requests, Programming Language, Size, Support
requests and CVS Repository can be used as predictors of software cohesion when
that cohesion is calculated using Lcom1 or Lcom3. This is validated by selected rules
16 to 64
4.7.4 Calculation of the cohesion of a package
There is empirical evidence that the cohesion of a package (set of classes) can be
calculated as the minimum value for all cohesion values of the classes in the set.
4.7.5 Negative Results
The following negative conclusions are determined by the study.

- 72 -
a) There is no empirical evidence that Lcom2, Lcom4, Lcom5, Lcc, Tcc, Ich and
connectivity (Co) must be used for the evaluation of software cohesion.
b) There is no empirical evidence that sum, maximum, and average must be used
for the evaluation of software package cohesion.
4.8 Conclusion
An overview of all cohesion measures shows that the minimum value of cohesion for
Lcom1 and Lcom3 are measurements that can be trusted. The measurement for
Lcom2, Lcom4, Lcom5, Co, Lcc, Ich and Tcc cannot be validated as true refection of
cohesion measurements.
The correlation between Lcom1 and Lcom3 and the independent variables of the
study was proven to be successful when measuring cohesion. It was concluded that
independent variables i.e. Support requests, Total patches and feature requests, Bugs,
Age, Category, Number of Developers, Mailing Lists, messages in a public forum,
patches and feature requests, programming language, size and CVS Repository used
in study can be used as indicators of cohesion in any software program.
It is assumed that since cohesion is a measure of quality, the more cohesive a
package is the higher the package quality. If a package is of a high quality then that
package is easier to maintain.

- 73 -
Chapter 5 Conclusion and Recommendations
5.1 Comparisons with existing Literature
The objective of this study is to test the empirical validity of software cohesion
metrics based on the mining of open source software data.
5.1.1 Software Size
The research reveals empirical evidence that smaller software is more cohesive than
bigger software when Lcom1 and Lcom3 are used for the calculation of cohesion.
That result complements a result found by Benlarbi, Eman and Goel (1999) in the
same sense that both results are similar but on different types of software (proprietary
software (for Benlarbi, Eman and Goel) versus open source software (that is used in
this study)). Moreover, the results find differences in the behavior of the different
cohesion metrics (Lcom1, Lcom2, Lcom3, Lcom4, Lcom5, Co, Tcc, Lcc and Ich) but
Benlarbi, Eman and Goel results looks at Lcom as its research took place before the
categorization of Lcom by many different authors. The methodologies used in the
two cases are also different. In the study data mining is used, but Benlarbi, Eman and
Goel used logistic regression of 174 classes in a C++ system and the study consisted
of 68 packages with different number of classes in each package from the .net
languages (C#, VB.net and J#)
On the other hand, Counsell, Swift and Turner (2006) could not find empirical
evidence that smaller software is more cohesive than bigger software probably
because the cohesion metrics used was Coupling Between objects, Number of
Association and Number of Methods in a class.
5.1.2 Software Faults
Basili, Briand and Melo (1995) conducted a study on a medium size information
system in which it was empirically shown that fault proness is influenced by size and
cohesion. The results are in line with the work published by Basili, Briand and Melo

- 74 -
(1995) in the sense that the study also found empirical evidence that software faults
expressed by software bugs, software support requests and patches and feature
requests correlate with software cohesion. This is also confirmed by Gyimothy,
Ferenc and Siket (2005) where research on the validation of object oriented metrics
on open source software using Mozilla’s proved that the Lcom metric is a good
indicator of software fault proneness.
Moreover, Koru, Zhang and Liu (2007) presented a paper on the modeling of the
effect of Size on Defect Proneness for Open Source Software. The results showed
defect-proneness is a logarithmic pattern. The research does not reveal any empirical
evidence linking size to defect proneness. This study also showed that there is a
correlation between the number of bugs in a package and the Lcom1 and Lcom3
value, the lower the number of bugs the higher the cohesion. A correlation also exists
between the category of development software and the cohesion values for Lcom1
and Lcom3, as long as the category is “development software” the cohesion value
was high.
5.1.3 Software Changeability
Kabaili et al (2001) goal was to validate cohesion metrics as changeability indicators,
and Lcc, and Lcom were chosen cohesion metrics. For each metric min, max, mean,
median and standard deviation statistics were collected. The conclusion reached by
Kabaili et al (2001) was that Lcc and Lcom should not be used as changeability
indicators. The results however show that Lcom1 and Lcom3 can be used as
changeability indicators represented by the number of software patches. Once again,
the studies methodology is original and it relies on a wider data set compared to the
methodology used by Kabaili et al (2001) that only applied to three industrial
systems.
Furthermore, Li and Hendry (1993) research implemented object oriented metrics to
predict maintenance effort. The results of their analysis proved that there is a strong

- 75 -
relationship between maintenance effort and size. This study shows a relationship
between the total patches and feature requests (linked to maintenance) and cohesion
values for Lcom1 and Lcom3. The lower the total patches and feature requests the
higher the cohesion of Lcom1 and Lcom3. The study also revealed that if the CVS
repository for commits or reads were low the Lcom1 and Lcom3 cohesion values
were also high.
5.1.4 Results obtained that has not being recorded in literature
a) Team Size
If the number of developers is low in a package the values for Lcom1 and Lcom3
cohesion is high.
b) Software reviewers
If the mailing lists is low the values for Lcom1 and Lcom3 cohesion is also high.
If the number of messages in a public forum is low the value of Lcom1 and Lcom3
cohesion is high.
c) Software Maturity
If a software package was only a few days old the cohesion of that package was high
for Lcom1 and Lcom3
d) Software Language
If the programming language was C# the cohesion of Lcom1 and Lcom3 was high
5.2 Future Work and Recommendations
There is a very rich body of object oriented measurement documented, but these
frameworks for measurement have not been empirically tested. There is definitely a
need for these measurements to be tested and validated to ensure good software
packages that are easy to maintain, reliable and easily imported into ones own work.
Future work should also include identifying guidelines for the measurement of object
oriented metrics measurement and a standardized framework should be established.
There also exists a platform for the measurement of independent variables and object
- 76 -
oriented metrics. A platform also exists for developing a standardized framework of
all metrics
5.2.1 Software Size
It is recommended to design software in small units rather than in big monolithic
programs. It actually confirms the basic principal of modularization.
5.2.2 Software faults and Changeability
It is recommended to design highly cohesive software. This is possible at the design
stage where the calculation of cohesion metrics should be done and appropriate
decisions should be taken as to optimize software cohesion that will yield positive
rewards during the maintenance phase as this study shows that cohesive software is
less fault prone.
5.2.3 Team Size
It is recommended that teams should be kept small
5.2.4 Software Reviewers
Even though fewer software reviewers can guarantee higher software cohesion, it is
still recommended to have a bigger set of software reviewers because the more the
reviewers the more the faults will be discovered. It is a rectification of these faults
that leads to low cohesion.
5.2.5 Software Maturity
There is nothing one can do about the maturity of a software package even though the
results show that young software is more cohesive than old software.
5.2.6 General Recommendation
This study results shows that software cohesion only makes sense at the early state of
the software life cycle. Therefore it is recommended to measure software cohesion

- 77 -
before the software is released for the first time to users. Once the software has been
released, its maintenance seems to degrade software cohesion. The possible results
for that cohesion degradation seems to be linked to the fact that changes are made
under pressure and no time is given to the redesign of the software. It is therefore
recommended to re-engineer the design of software every time that software is
maintained.

- 78 -
References
Agrawal R., Imielinski T., Swami A. (1993). Mining Association Rules between Sets
of Items in Large Databases. Proceedings of the ACM SIGMOD Conference on
Management of Data, 1993.
Aggarwal C, Yu P., (1998). “Online Generation of Association Rules”. ICDE 1998.
Agrawal R., Srikant R. (1994) Fast Algorithms for Mining Association Rules.
Proceedings of the 20th International Conference on Very Large Data Bases.
Badri L., Badri M and Ferdenache, (1995). Towards Quality Control Metrics for
Object Oriented Systems Analysis, TOOLS (Technology of object oriented
Languages and Systems Europe), Prentice Hall.
Bhadri L and Bhadri M, (2004). A proposal of a New class Cohesion Criterion: An
empirical study, Journal of oriented Technology Vol3 No.4, April 2004.
Bansiya J., Etzkorn L., Davis C., Li W., (1998). A class Cohesion Metrics for Object-
Oriented Design Published in the Journal of Object-Oriented Programming.
Barnes N, Hale D.P and Hale J.E. (2006). The cohesion – based requirements set
model for improved information system maintainability. Proceedings of the 2006
Southern Association for Information Systems Conference.
Basili, V., Briand, L., and Melo, W. (1996). A Validation of Object-Oriented Design
Metrics as Quality Indicators. IEEE Transactions on Software Engineering, 22(10),
751-761.
Basili V. and Rombach H.D., (1988) The TAME Project: Towards Improvement-
Oriented Software Environments, IEEE Transactions on Software Engineering, vol.
14, pp. 758-773

- 79 -
Benlarbi S., Emam K.E., Goel N., (1999), Issues in validating object oriented Metrics
for early risk prediction. ISSRE.
Berkhin, P. (no date). Survey of Clustering Data Mining Techniques Accrue
Software, Inc.
Bieman M.J., Kyoo Kang B. (1995). Cohesion and Reuse in an Object – Oriented
System. ACM Digital Library. pp 256 – 262.
Bently L.D and Whiten J.L (2000). Systems Analysis and Design for the global
enterprise. McGraw Hill publications.
Brand E and Gerritsen R (1998). Data Mining and Knowledge Discovery. Data
Mining Solution Supplement.
Briand L.C., Daly J. and Wust J., (1998). A unified framework for cohesion
measurement in object oriented systems, Empirical Software Engineering, No3 pp 67
– 117, 1998
Briand L.C., Jurgen J.W., (1999). A unified framework for coupling measurement in
object – oriented systems IEEE Transactions on Software Engineering Volume 25 ,
Issue 1 Pages: 91 – 121
Briand L.C., Daly J, Wust J. and Porter V.,(2000). Exploring the relationship between
Design Measures and software quality in object oriented systems, Journal of Systems
Software, no 51 pp 245 – 273, 2000
Bruno S., Marjan H., Ivan R., (1995). How to Evaluate Object-Oriented Software
Development? ACM Sigplan notices, Volume 30 University of Maribor Faculty of
Electrical Engineering and Computer Science Business IT Conference, Manchester,
1995.

- 80 -
Boehm, B. W., et al, (1973). “Characteristics of Software Quality,” TRW Software
Series, December 22, 1973.
Booch G, (1994). Object Oriented Analysis and Design with Applications, Second
Edition, Benjamin/Cumming.
Churcher N, Irwin W, Kriz, R, (2003). “Visualizing class cohesion with virtual
words” ACM International Conference Proceeding Series; Vol. 142 Proceedings of
the Asia-Pacific symposium on Information visualization - Volume 24 Adelaide,
Australia, Pages: 89 – 97.
Ceri S., Meo R., Psaila G., (1996). A New SQL-like Operator for Mining Association
Rules. Proceedings of the 22nd International Conference on Very Large Data Bases.
Chae H.S and Kwon A.,(1998). A cohesion measure for classes in object – oriented
systems, Procedings of the fifth International Software Metrics Symposium,
Bethesda, MD, pp 158 – 166, November 1998.
Chae H.S, Kwon A and Bae D.H., (2000) A cohesion measure for object oriented
classes, Software Practice and Experience, No 30, pp 1405- 1431.
Cheung D.W., Han J., Ng V., Wong C.Y.,(1996) Maintenance of Discovered
Association Rules in Large Databases: An Incremental Updating Technique.
Proceedings of the 12th ICDE, 1996.
Chidamber S.R. and KemererC.F, 1991. S.R., (1991) Towards a Metrics Suite for
Object Oriented Design, OOPSLA '91 ConferenceProceedings, Special Issue of
SIGPLAN Notices, Vol. 26, No. 11, November 1991, pp. 197 – 211.

- 81 -
Chidamber S.R.and Kemerer C.F., (1994) A Metrics Suite for Object-Oriented
Design, IEEE Transactions on Software Engineering, Vol. 20, No. 6, June 1994, pp.
476 – 493.
Chidamber S.R, Darcy D.P and Kemerer C.F., (1998). Mangerial use of metrics for
object-oriented software: An exploratory analysis, IEEE Transactions on software
Engineering, vol. 24 No 8 pp 629 – 639, August 1998.
Curtis, B. (2005) Measurement and experimentation in software engineering:
Proceedings of the IEEE Sept. 1980 Volume: 68, Issue: 9 On page(s): 1144- 1157
Posted online: 2005-06-28.
Curtis B., Sheppard S. B., and Milliman P., (1981). Third Time Charm: Stronger
Prediction of Performance by Software Complexity Measures, Tutorial on
Programming Productivity: Issues for the Eighties, Edited by C. Jones, IEEE
Computer Society Press, New York, New York, 1981, pp. 81 - 85.
Councell S., Swift S., and Tucker A., (2006). Object oriented Cohesion Subjectivity
amongst Experienced and Novice Developers: an Empirical Study. ACM Digital
Libruary Volume 31 Number 5, September 2006.
CSCW 2004, the ACM Conference on Computer Supported Cooperative Work,
November 6-10, 2004.
DeMarco, T. (1982). Controlling Software Projects: Management, Measurement &
Estimation, Yourdon Press, New York, USA, p3.
De Oca C.M and Carver D.L., (1998). “Identification of Data Cohesive Subsystems
Using Data Mining Techniques”, Proceedings of the International Conference
Software Maintenance (ICSM 98), 1998, pp.16-23.

- 82 -
Dowson M. and Fernström C., (1994). Towards Requirements for Enactment
Mechanisms, in Software Process Technology, Third European Workshop, EWSPT,
Villard de Lans, France, edited by Brian Warboys. Springer Verlag LNCS 772, 1994.
Esperanza M., Genero M., Piatattini M., (2003). No-Redundant Metrics for UML
Class Diagram structural Complexity.
Etzkorn L., Davis C., and Li W., (1998). A Practical Look at the Lack of cohesion in
Method Metrics.
Fenton, N. E. (1991). Software Metrics A Rigorous Approach. Chapman and Hall.
Fenton N. E., Pfleeger S.L.; (1997). Software metrics: a rigorous and practical
approach PWS Publishing Co. Boston, MA, USA
Fenton N.E., (1994). Software Measurement: A Necessary Scientific Basis, IEEE
Transactions on Software Engineering, Vol. 20, No. 3, March 1994, pp. 199 – 206.
Flávio O., (2003): Software Process Technology, 9th International Workshop,
EWSPT 2003, Helsinki, Finland, September 1-2, 2003, Proceedings. Lecture Notes in
Computer Science 2786 Springer 2003, ISBN 3-540-40764-2.
Flora A.W., (1996). Software quality measurement, a framework for counting
problems and defects Software Engineering Institute Carnegie Mellon University.
Greenwood R. M, Robertson I. Snowdon R.A, Warboys B.C (no date). Active
Models in Business.
Gui G., Scott PD., (2006) Coupling and Cohesion Measures for Evaluation of
Component Reusability, ACM Digital Library.

- 83 -
Gupta, N. and Rao, P. (2001). “Program Execution Based Module Cohesion
Measurement,” 16th International Conference on Automated on Software
Engineering (ASE ’01), San Diego, USA, November 2001.
Gyimothy, T.; Ferenc, R.; Siket, I., (2005). Empirical validation of object-oriented
metrics on open source software for fault prediction Software Engineering, IEEE
Transactions Volume 31, Issue 10, Oct. 2005 Page(s): 897 – 910.
Halstead M.H., (1977). Complexity Metrics and Models the Software Science ACM
Digital Library
Halstead M.H.,(1977). Elements of Software Science, Elsevier, North-Holland, New
York.
Han J., Fu Y., Wang W., Chiang J., Gong W., Koperski K., Li D., Lu Y., Rajan
A.,Stefanovic N., Xia B., Zaiane O.R. DBMiner (1996). A System for Mining
Knowledge in Large Relational Databases. Proc. of the 2nd KDD Conference, 1996.
Han J. (1998). “Towards On-Line Analytical Mining in Large Databases”. SIGMOD
Rec., 27(l), 1998.
Harrison, R., Councell, S., Nithi, R., An investigation into the applicability and
validity of object-oriented design metrics. Empirical Software Eng., 3, 3 (Sep. 1998),
255-273.
Henderson-Sellers, B. (1996). Object-Oriented Metrics, Measures of Complexity, the
Object Oriented Series. Prentice Hall.
Hidber C. “Online Association Rule Mining”. SIGMOD Conference 1999.
Hitz, M., and Montazeri B., (1996) Chidamber and Kemerer’s metric suite : A
Measurement Theory Perspective, IEEE Transactions on Software Engineering, Vol.
4, April 1996, pp. 267-271.

- 84 -
Holland J.H., Holyoak K.J.,Nisbett R.E., and Thagard P.R.(1996). Induction:
Processes of Inference, Learning, and Discovery. MIT Press, Cambridge, MA, 1986.
Theory Perspective, IEEE Transactions on Software Engineering, Vol. 4, April 1996,
pp. 267-271.
Hoekstra A, Metrics for object – orientated design.
http://www.cs.vu.nl/~ahoekst/metrics.html. Accessed April 2006
IEEE 90b (1990). Standard for a Software Quality Metrics Methodology (IEEE
Standard P-1061/D21). New York, N.Y.: Institute of Electrical and Electronic
Engineers, Inc.
Inderpal S. Bhandari, Halliday M.J., E. Tarver D B., Chaar J., and Chillarence R.
(1993). A Case Study of Software Process Improvement During Development. IEEE
Trans. on Software Engineering, 19(12), pp. 1157 - 1170, December 1993.
Inderpal S. Bhandari, Halliday M.J., Chaar J., Chillarence R., Jones K., Atkinson J.S.,
Lepori-Costello C., Jasper P.Y.,Tarver E.D.,Lewis C.C., and Yonezawa M., (1994)
In-Process Improvement through Defect Data Interpretation.” IBM Syst. Journal,
33(1), pp. 182-214, 1994.
Imielinski T., Mannila H., (1996) A Database Perspective on Knowledge
Discovery.Communications of the ACM, Vol. 39, No. 11, 1996.
Kabali, H, Keller R,K Lustmaan F., and Saint-Denis (2001). Class cohesion as
predictor of changeability : An Empirical study ACM Digital Library.
Kan S.H., (2002). Software quality metrics overview. Addison-Wesley
Kelvin, W.T. Popular Lectures notes and Addresses [unpublished]. 1891-1894.

- 85 -
Koch and Schneider (2000). Open source Development Project using Public Data.
Published online by http://epub.wu_wien.ac.at.
Kohler G., Rust H. and Simon F., (1999). Understanding object oriented software
without source code inspection. Published in the proceedings of Experiences in
reengineering workshop.
Koru A.G., Zhang D. And Liu H., (2007). Modeling the Effect of Size on Defect
Proneness for Open Source Software. Published in the third international Workshop
on Predictor Models in Software Engineering (PROMISE’07).
Laing V and Coleman C., (2001). Principal Components of Orthogonal Object-
Oriented Metrics. Published by SATC
Lee and Chang T.C., (1995). Cohesion: an efficient distributed shared memory
system supporting multiple memory consistency models First Aizu International
Symposium on Parallel Algorithms/Architecture Synthesis p. 146.
Lethbridge T.C and Anquetil N., (1998) Experiments with coupling and cohesion
metrics in a large system Fifth International software metric symposium.
Lorenz and Kidd, (1994). Object-Oriented Software Metrics, Prentice Hall,
Englewood Cliffs, New Jersey.
Li, W., and Henry S., (1993). Maintenance Metrics for the Object-Oriented
Paradigm," Proceedings of the First International Software Metrics Symposium,
Baltimore, Maryland, 1993, pp. 52 - 60.
Li W., and Henry S., (1993) Object oriented metrics that predict maintainability,
Journal of Systems and Software, Vol 23. pp 111-122, 1993.
- 86 -
Li, W., Henry S., Kafura D., and Schulman R., (1995) Measuring Object-oriented
design. Journal of Object-Oriented Programming, Vol. 8, No. 4, July 1995, pp. 48-55.
Moreau, D and Dominick W., (1989). Object oriented Grahical Information Systems:
Research Plan and Evaluation Metrics, Journal of Systems and Software, vol. 10, pp
23 – 28, 1989.
Maqbool, O.; Babri, H.A.; Karim, A.; Sarwar, M., (2005). Metarule-guided
association rule mining for program understanding Software, IEE Proceedings -
Volume 152, Issue 6, 9 Dec. 2005 Page(s): 281 – 296.
Manoel G. Mendonça, Basili V.R., Inderpal S. Bhandari, and Dawson J., (1998). An
Approach to Improving Existing Measurement Frameworks. IBM Syst. Journal,
37(4), pp. 484-501, 1998.
McCabe, T.J., (1976) A complexity measure, IEEE Transactions on Software
Engineering, vol. SE-2, no. 4, pp. 308-320, Dec. 1976.
McCabe, T.J., (1989). Design Complexity Measurement and Testing,
Communications of the ACM, vol. 32, no. 12, pp. 1415-1425, December 1989.
McCabe T.J, Charles W., Butler (December 1989) Design complexity measurement
and testing Communications of the ACM, Volume 32 Issue 12 ACM Press.
Mens T., Demeyer S., (2002). Future trends in software evolution Metrics, ACM
Digital Library 2002.
Meyer B.,(1998) The Role of Object-Oriented Metrics, Computer, vol. 31, no. 11,
pp. 123-125, Nov., 1998.

- 87 -
Michail A., (2000). Data Mining Library Reuse Pattern using Generalized
Association Rules” ICSE ACM Digital Library.
Misra S, Misra A.K.,(2007). “Evaluation and comparison of Cognitive Complexity
Measure” Volume 32 ACM Digital Library, March 2007 .
Moody G., (2001). Rebel code: Linux and the open source revolution. Cambridge,
MA: Perseus Press.
Morris K.L., (1989). Metrics for object-oriented software development environments,
Master's Thesis, M. I.T. Sloan School of Management, 1989.
Morzy T., Zakrzewicz M., (1997) SQL-like Language for Database Mining.
ADBIS’97 Symposium, 1997.
Morzy T., Wojciechowski M., Zakrzewicz M., (2000). Data Mining Support in
Database Management Systems. Proc. of the 2nd DaWaK Conference, 2000.
Murine, G. E., (1983) Improving Management Visibility Through the Use of
Software Quality Metrics, Proceedings from IEEE Computer Society‘s Seventh
International Computer Software & Application Conference. New York, N.Y.:
Institute of Electrical and Electronic Engineers, Inc., 1983.
Muskens J., Chaudron M.R.V., Lange C.M (2004): Investigations in Applying
Metrics to Multi-View Architecture Models. EUROMICRO 2004: 372-379
Nag B., Deshpande P.M., DeWitt D.J., (1999) Using a Knowledge Cache for
Interactive Discovery of Association Rules. Proceedings of the 5th KDD Conference,
1999.

- 88 -
Naveen S., Padmaja J., Rushikesh K. J., (2006) Applicability of Weyuker's Property 9
to Object Oriented Metrics, IEEE Transactions on Software Engineering, vol. 32,
no. 3, pp. 209-211, Mar., 2006.
Page-Jones, (1998). “The Practical guide to Structured Systems Design” Wayland
Systems Inc.
Park, R. E.,(1992). Software Size Measurement: A Framework for Counting Source
Statements. Technical Report CMU/SEI-92-TR-20.; 1992.
Patel, S., Chu, W., Baxter, R., (1992). A Measure for Composite Module Cohesion,
14-th Intl. Conf. on Soft. Engr., Melbourne, Austrilia, May, 1992.
Perens B., (1997). “The Debian free software guidelines”, http://www.debian.org/
Pfleeger S.L., Fenton N., and Page S.,(1994). Evaluating Software Engineering
Standards, IEEE Computer, Vol. 27, No. 9, September 1994, pp. 71 - 79.
Raymond, E. (2005). The cathedral and the bazaar. Retrieved on December 12, 2005.
from http://www.catb.org/~esr/writings/cathedral-bazaar/cathedral-bazaar/index.html
Roberts, Fred S., (1979). Measurement Theory with Applications to Decision
making, Utility, and the Social Sciences. Encyclopedia of Mathematics and its
Applications Addison Wesley Publishing Company, 1979.
Rosenberg, L.H., Hyatee, L.E (1997). Software Quality Metrics for Object-Oriented
Environments Crosstalk Journal.
Rombach, D.: Design Measurement: Some Lessons Learned. IEEE Software, March
1990, pp.17-24.

- 89 -
Rousidis D and Tjortjis C, “Clustering Data Retrieved from Java Source Code to
Support Software Maintenance: A Case Study”, Proceedings IEEE 9th European
Conf. Software Maintenance Reengineering (CSMR 05), 2005, pp. 276-279.
Rumbaugh, J., Blaha, M., Premerlani, W., Eddy, F. & Lorenson, W. (1991). Object
oriented modelling and design. New York: Prentice Hall.
Sarwar, B., Karypis, G., Konstan, J., Riedl, J., 2000. Analysis of recommendation
algorithms for e-commerce. In: Proceedings of the ACM Conference (Electronic
Commerce), pp. 158–167.
Schneidewind, Norman F. (1991). Setting Maintenance Quality Objectives and
Prioritizing Maintenance Work by Using Quality Metrics. In: Proceedings of the
Conference on Software Maintenance Sorrento, Italy, October 1991.
Snowdon R.A.,(nd) Overview of Process Modeling of ICL Processwise Portfolio
Centre, Kidsgrove, UK, and Informatics Process Group, Manchester University, UK.
Sommerville I., Software Engineering, 6th ed., Harlow, Addison-Wesley, 2001.
Samoladas I., Stamelos I., Angelis L. And Oikonomou A. (2004). Open Source
Software Development should strive for Even Greater Code Maintainability. ACM
digital Library.
Stalhane T. and Coscolluea A., (1992). A Final report on metrics, Deliverables
D1.4.B1, Esprit Projct 5327 (REBOOT), February 1992
Stiglic B, Herioko M, Rozlnan I.,(1995). How to Evaluate Object-Oriented Software
Development University of Maribor Faculty of Electrical Engineering and Computer
Science 62000 Maribor, Smetanova 17, Slovenia ACM SIGPLAN Notices, Volume 30,
No. 5 May 1995.

- 90 -
Stilltow J., (2006). Data mining 101: Tolls and Techniques, Published by the institute
of Internal Auditors Vol. 9 September 2006.
Sukesh P., William C. and Rich B., (1992). A Measure For composite Module
Cohesion 1992 - ACM digital library Lockheed Software Technology Center.
Sharma, S., Sugumaran, V., and Rajagopalan, B., (2002). A framework for creating
hybrid open source software communities. Information Systems Journal, 12 (1), 7-26.
Tanit T., Meyer B., Stapf E., (2001). A Metric Framework for Object-Oriented
Development 39th International Conference and Exhibition on Technology of Object-
Oriented Languages and Systems (TOOLS39) July 2001 pp. 0164.
Thomas, D. and Hunt, A., (2004). Open source ecosystems. IEEE Software, 32 (1),
89-91.
Thomas J.E., (1984). A Discriminant Metric for Module Cohesion IEEE 1984 AT&T
Bell Laboratories Piscataway, New Jersey 08854.
Thomas S., Bodagala S., Alsabti K., Ranka S., (1997) An Efficient Algorithm for the
Incremental Updation of Association Rules in Large Databases. Proceedings of the
3rdKDD Conference, 1997.
Tichy, W.F., (1998) Should computer scientists experiment more? Karlsruhe
University Computer Publication Date: May 1998 Volume: 31, Issue: 5 On page(s):
32-40.
Tjortjis C., Sinos L. and Layzell P.J., (2003). “Facilitating Program Comprehension
by Mining Association Rules from Source Code”, Proc. IEEE 11th Int’l Workshop
Program Comprehension (IWPC 03), 2003, pp. 125-132.

- 91 -
Tom M. and Serge D., (2006). Quality in Modeling, ACM/IEEE 9th International
Conference on Model Driven Engineering Languages and Systems, 2006.
Toivonen H.(1996) Sampling Large Databases for Association Rules. Proc. of the
22nd Internationall Conference on Very Large Data Bases, 1996.
Torvalds L, (2001). The Hacker Ethic, ISBN 0-375-50566-0.
Weyuker, E., (1988). Evaluating Software Complexity Measures, IEEE Transactions
on Software Engineering, Vol. 14, No. 9, September 1988, pp. 1357 - 1365.
Wise, E (2005). Fixing the Software Development Industry, Scrum Works.
Wojciechowski M., Zakrzewicz M., (1998). Itemset Materializing for Fast Mining of
Association Rules. Proceedings of the 2nd ADBIS Conference, 1998.
Wojciechowski M., Zakrzewicz M., (2002) Methods for Batch Processing of Data
mining Queries. Proceedings of the 5th International Baltic Conference on Databases
and Information Systems, 2002.
Wojciechowski M., Zakrzewicz M.(2003) Evaluation of Common Counting Method
for Concurrent Data Mining Queries. Proc. of the 7th ADBIS Conference, 2003.
Xiao C., Tzerpos V, “Software Clustering on Dynamic Dependencies”, Proceeding
of IEEE 9th European Conferance Software Maintenance Reengineering (CSMR 05),
2005, pp. 124-133.
Xie, Pei and Hassan, (2007). Mining software engineering data, Proc. IEEE 29TH
International Conference on software engineering (ICSE 07), 2007.
Young L., and Kai H.C., (2004) Reusability and Maintainability Metrics for object-
oriented software 2000- ACM 1 -58113-250-6/00/0004.

- 92 -
Yourdan E and Constantine L.L., (1979). Structured Design, Prentice Hall, 1979.
Zelkowitz, M.V.; Wallace, D.R. (1998). Experimental models for validating
technology Volume 31, Issue 5, May 1998 Page(s):23 – 31
Zhong S, Khoshgoftaar T.M., and Seliya N., (2004). “Analyzing Software
Measurement Data with Clustering Techniques”, IEEE Intelligent Systems, Vol. 19,
No. 2, 2004, pp. 20-27.
Zhou Y and Davis J., (2005). International Conference on Software Engineering
Proceedings of the fifth workshop on Open source software engineering., ACM
Digital Library.
Zuse H., (1989). History of Software Measurement IEEE89/ IEEE: Standard
Dictionary of Measures to Produce Reliable Software. The Institute of Electrical and
Electronics Engineers, Inc 345 East 47th Street, New York, NY 10017-2394, USA
IEEE Standard Board, 1989.
Zuse, H., (1991). Software Complexity: Measures and Methods, Walter de Gruyter,
Berlin, 1991.
Zuse H., (1998). A Framework of Software Measurement, Published by Walter de
Gruyter, 1998

- 93 -