vale’s performance in 2017 · us$ 5.3/t in platts iodex, as a result of higher prices in base...
TRANSCRIPT

Vale’s Performance
in 2017
Ricardo Teles/Vale

www.vale.com
App Vale Investors & Media
iOS: https://itunes.apple.com/us/app/vale-investor-media-portugues/id1087134066?ls=1&mt=8
Android: https://play.google.com/store/apps/details?id=com.theirapp.valeport
Tel.: (55 21) 3485-3900
Investor Relations Department
André Figueiredo
André Werner
Carla Albano Miller
Fernando Mascarenhas
Andrea Gutman
Bruno Siqueira
Renata Capanema
BM&F BOVESPA: VALE3
NYSE: VALE
EURONEXT PARIS: VALE3
LATIBEX: XVALO
Except where otherwise indicated the operational and financial information in this release is based on the consolidated figures
in accordance with IFRS and, with the exception of information on investments and behavior of markets, quarterly financial
statements are reviewed by the company’s independent auditors. The main subsidiaries that are consolidated are the following:
Mineração Corumbaense Reunida S.A., PT Vale Indonesia Tbk (formerly International Nickel Indonesia Tbk), Salobo Metais
S.A, Vale Australia Pty Ltd., Vale International Holdings GMBH, Vale Canada Limited (formely Vale Inco Limited), Vale
International S.A., Vale Manganês S.A., Vale Moçambique S.A., Vale Nouvelle-Calédonie SAS, Vale Oman Pelletizing Company
LLC and Vale Shipping Holding PTE Ltd.
3
Content
Vale’s performance in 2017 ........................................................................................ 4
Operating revenues .............................................................................................................. 10
Costs and expenses ............................................................................................................. 12
Adjusted earnings before interest, taxes, depreciation and amortization (EBITDA) .. 16
Net income ............................................................................................................................. 18
Shareholders’ remuneration ................................................................................................ 21
Investments ........................................................................................................................... 22
Free cash flow ....................................................................................................................... 26
Debt indicators ...................................................................................................................... 28
Performance of the business segments ............................................................................ 31
Ferrous Minerals ................................................................................................................... 32
Base Metals ........................................................................................................................... 46
Coal ......................................................................................................................................... 55

4
Vale’s performance in 2017
Chief Executive Officer Mr. Fabio Schvartsman commented on 2017 results: “Our 2017
performance shows remarkable cash generation and substantial net debt reduction as a result of
improvements in price realization, strict discipline in capital allocation and slightly improved results
from nickel and coal assets”. He concluded that “2017 was a turning point for Vale. We started
ambitious changes in efficiency, cost management and corporate governance. We laid the
foundations for diversifying cash generation by improving the asset base we have today to reduce
our dependency on iron ore. We aim to transform Vale into a predictable company”.1
• Adjusted EBITDA was US$ 15.338 billion in 2017, 28% higher than in 2016, despite the
negative impact of the BRL appreciation (8.4%) and higher bunker oil prices (45%), mainly as
a result of higher realized prices and premiums.
• Quarterly adjusted EBITDA was US$ 4.109 billion, in line with 3Q17 despite the reduction of
US$ 5.3/t in Platts IODEX, as a result of higher prices in Base Metals and Coal, higher sales
volumes in Ferrous Minerals and lower costs in Base Metals.
• Free Cash Flow was US$ 8.604 billion in 2017, the highest level since 2011, and net debt
decreased by US$ 6.899 billion, totaling US$ 18.143 billion as of December 31st, 2017.
• Quarterly Free Cash Flow increased considerably vs. 3Q17, totaling US$ 2.744 billion in 4Q17.
This enabled a significant net debt reduction of US$ 2.923 billion quarter-on-quarter. “The solid
operational performance and the conclusion of our divestment program accelerated Vale’s net
debt reduction. The US$ 18.1 billion net debt in 4Q17 is equivalent to a pro forma net debt of
US$ 14.4 billion, considering the cash inflows of US$ 3.7 billion from the conclusion of the
Fertilizers deal with Mosaic in January and from the Project Finance at Nacala Corridor to be
received soon. We have obtained the financial close of the Nacala Project Finance, which
means that all the conditions precedent were fulfilled, and we will receive the proceeds on
March 21st, 2018. These inflows, together with the continuing cash generated from operations,
will enable us to achieve our US$ 10 billion net debt target in the short term”, highlighted Chief
Financial Officer Mr. Luciano Siani Pires.
• Capital Expenditures reached their lowest level since 2005, totaling US$ 3.848 billion in 2017,
decreasing US$ 1.342 billion vs. 2016 with the conclusion of the S11D mine and plant project.
CAPEX is expected to remain at these levels in the coming years.
• Adjusted EBITDA for the Ferrous Minerals business segment was US$ 13.192 billion in 2017,
26% higher than in 2016, mainly as a result of net effect of the 22% increase of the Platts
IODEX in revenues and costs (US$ 2.248 billion) and gains through higher premiums and
1 Excluding Manganese and Ferroalloys.

5
commercial initiatives (US$ 1.439 billion), which were partly offset by the negative impact of the
exchange rate (US$ 556 million) and the 45% increase in bunker oil prices (US$ 409 million).
• Adjusted EBITDA per ton for Ferrous Minerals2 was US$ 37.9/t in 2017, 24% higher than in
2016 mainly as a result of higher price realization and a better product mix, despite the 45%
increase in bunker oil prices. “Vale is focused on maximizing its margins through product mix
and volume adjustments as well as optimization of the balance between costs and price
realization. Looking forward, costs will reduce and price realization will increase further on
the back of continuous supply chain optimization”, commented Mr. Peter Poppinga,
Executive Officer for Ferrous Minerals and Coal.
• Adjusted EBITDA for pellets represented 18% of Vale’s total Adjusted EBITDA, totaling
US$ 2.767 billion in 2017, a 52% increase vs. 2016.
• Quarterly adjusted EBITDA for Ferrous Minerals was US$ 3.319 billion in 4Q17, decreasing
US$ 355 million vs. 3Q17, mainly due to lower prices. After excluding the exogenous factors
of lower market prices and premiums (US$ 581 million), adjusted EBITDA was US$ 226 million
higher than in 3Q17.
• Quarterly iron ore fines and pellets EBITDA break-even3 increased to US$ 33.9/t in 4Q17, US$
3.9/t higher than in 3Q17, mainly as a result of exogenous factors such as higher spot freight
rates, higher bunker oil prices and lower 65% Fe premiums.
• Quarterly CFR dmt4 reference price for iron ore fines was US$ 72.6/t in 4Q17, US$ 7.0/t higher
than the quarterly average Platts IODEX.
• Adjusted EBITDA for Base Metals was US$ 2.139 billion in 2017, increasing 16% vs. 2016
mainly as a result of higher prices. “We are on track to ensure that each and every asset in
Base Metals is cash flow positive irrespective of prices, while also maintaining the optionality of
capturing the possible upside in the market that comes with the advent of electric vehicles. In
2017, we carried out a detailed review on a mine-by-mine basis, putting in care and
maintenance two mines in Canada and one nickel refinery in Taiwan. Other stoppages are
planned for 2018 such as the precious metals refinery in Acton and the smelter and refinery in
Thompson. Additionally, we have just launched our cost efficiency program targeting a
reduction of US$ 150 million by 2020”, commented Mr. Eduardo Bartolomeo, Executive Officer
for Base Metals.
• Quarterly adjusted EBITDA for Base Metals totaled US$ 782 million in 4Q17, the highest
quarterly level since 1Q11, with an increase of US$ 221 million mainly as a result of higher
prices and lower costs.
• Quarterly adjusted EBITDA of VNC was US$ 11 million, mainly due to higher nickel and cobalt
prices, the quarterly production record of cobalt and lower costs5, which decreased 14% to US$
8,420/t in 4Q17.
2 Excluding Manganese and Ferroalloys. 3 Measured by unit cash costs and expenses on a landed-in-China basis and adjusted for quality, pellets margin differential and
moisture, excluding ROM. 4 dmt = dry metric ton 5 VNC unit cash costs net of by-product credits.

6
• Adjusted EBITDA for the coal shipped through Nacala reached US$ 410 million in 2017 driving
the improvement of the Coal business adjusted EBITDA of US$ 330 million in 2017, the first
positive result since 2010.
• Net income of US$ 5.5 billion in 2017 was US$ 1.5 billion higher than in 2016.
• Vale will pay R$ 4.7 billion (US$ 1.5 billion) of shareholder remuneration in the form of
interest on capital. Vale’s Board of Directors approved the distribution of R$ 2.2 billion in
December 2017 and R$ 2.5 billion in February 2018 to be paid in March 2018, which is
equivalent to the minimum established by Vale’s bylaws. The decision to pay the minimum
required remuneration reflects a cautious and disciplined approach from Vale, until the
Company receives the proceeds from asset sales and cash generation from operations. The
new dividend policy is being discussed and will be announced until the end of March.
Selected financial indicators
US$ million 2017 2016 2015 2014 2013
Net operating revenues 33,967 27,488 23,384 35,124 43,953
Total costs and expenses 22,743 19,196 20,907 26,486 25,892
Adjusted EBIT 11,224 8,292 2,477 17,717 14,915
Adjusted EBIT margin (%) 33.0 30.2 10.6 50.4 33.9
Adjusted EBITDA 15,338 11,972 6,513 13,075 22,614
Adjusted EBITDA margin (%) 45.2 43.6 27.9 37.2 51.5
Iron ore - Platts' 62% IODEX 71.3 58.4 55.5 96.7 135.2
Net income (loss) 5,507 3,982 (12,129) 657 585
Underlying earnings 7,023 4,968 (1,698) 4,419 12,269
Underlying earnings per share on a fully diluted basis (US$ / share) 1.35 0.96 (0.33) 0.85 2.36
Net debt 18,143 25,042 25,234 24,685 24,331
Capital expenditures 3,848 5,191 8,401 11,979 14,233
US$ million 4Q17 3Q17 4Q16
Net operating revenues 9,167 9,050 9,265
Total costs and expenses 6,270 5,866 5,632
Adjusted EBIT 2,897 3,184 3,633
Adjusted EBIT margin (%) 31.6 35.2 39.2
Adjusted EBITDA 4,109 4,192 4,722
Adjusted EBITDA margin (%) 44.8 46.3 51.0
Iron ore - Platts' 62% IODEX 65.6 70.9 70.8
Net income (loss) 771 2,230 525
Underlying earnings 1,886 2,090 2,717
Underlying earnings per share on a fully diluted basis (US$ / share) 0.36 0.40 0.52
Net debt 18,143 21,066 25,042
Capital expenditures 977 863 1,323

7
Market overview
IRON ORE
Iron ore Platts IODEX 62% averaged US$ 71.3/dmt in 2017, an increase of 22% from 2016,
supported by the steel sector outperformance that led to higher steel prices across the world.
China’s steel sector outperformance in 2017 was driven by machinery, manufacturing and real
estate. The infrastructure sector was quite robust with a relatively loose credit supply in the first three
quarters. Manufactured goods enjoyed healthy external demand driven by strong orders from
developed countries and from the ongoing ‘Belt and Road Initiative’ projects, all leading China to
deliver a record high steel production of 831.7 Mt in 2017, an increase of 5.7% year-on-year6.
Steel production ex-China also posted strong growth in 2017 with 859.5 Mt, an increase of 4.9%
year-on-year, as the world enjoyed its first synchronized growth period since the Global Financial
Crisis of 2008/09 as consumption and job creation increased and investments resumed, reflected
in steel demand and production.
Notably, in 2017 we witnessed increased price spreads between high and low quality ores.
Improved steel profitability, high coking coal prices and the environmental restrictions imposed
during 2017 led mills to source high quality ores like the Carajás iron ore (IOCJ), with around 65%
Fe, which provide higher productivity and lower emission levels. While the Metal Bulletin 58%
average of US$ 46.7/dmt in 2017 was only 1% higher year-on-year, the Metal Bulletin 65% average
of US$ 88.0/dmt in 2017 represented an increase of 36% year-on-year.
We believe that the price differentials between high and low grade iron ores are a structural change
that should continue to impact the market in the coming years. The move towards a more efficient
steel industry, along with the enforcement of stricter environmental policies in China, should support
the demand for high quality ores that enable productivity and lower emission levels like pellets and
IOCJ.
While the increased demand for higher grade ores should support the quality premiums, the
relatively strong supply of ores with lower Fe and high contaminant levels should also maintain
pressure on the discounts for such products.
In 2018, we expect China’s economic growth to become more moderate from 2017 with some
downward risks from property. However, since the property stock level has been reduced, the
investments and new starts should see only a small decrease. Global economic prospects continue
positive for 2018 as the IMF has recently upgraded GDP growth from 3.6% to 3.9%. Steel demand
and production are expected to grow also as new projects in Southeast Asia emerge, a region with
steel production deficit and lower steel consumption per capita.
COAL
Seaborne coking coal demand remained strong in 2017. China’s demand for coking coal
continues to be the main driver behind the global demand increase. Chinese imports were
forecast to reach the third highest level on record in 2017 at 70 Mt, an increase of 18% vs.
2016. Japan imports remained relativity flat around 70Mt, while India saw a rise in its coking
6 World Steel Association figures.
8
coal imports from 49 Mt to 55 Mt, up 12% year on year. Overall global imports are expected to
increase by around 5.5% in 2017.
We expect coking coal prices to lose steam throughout 1H18 as supply normalizes. Coking coal
supply tightened in 4Q17 due to prolonged congestion at the main export terminals in Australia.
NICKEL
In the nickel market, LME nickel prices averaged US$ 10,411/t in 2017 up 8% from the average of
US$ 9,609/t in 2016, with significant price gains in the last quarter of the year (4Q17 average price
of US$ 11,584/t). Strong demand for stainless steel production as well as positive macroeconomic
fundamentals, particularly in China, and increasing awareness of the role of nickel in batteries for
electric vehicles, helped support the price increase.
Total exchange inventories at LME and SHFE continued to decline, closing at 412 kt by the end of
2017 – down 53 kt since the beginning of the year – indicating a nickel deficit for the year. Global
stainless steel production increased approximately 5% in 2017 relative to 2016. Demand for nickel
in non-stainless steel applications experienced a strong growth year (up 5% vs. 2016), particularly
in the automotive, battery and aerospace sectors, with oil and gas showing signs of recovery.
On the supply side, the market saw a 2% increase in supply in 2017 relative to 2016. However, the
growth was in Class II material (+12% year-on-year), not suitable for specialty applications such as
batteries, while Class I material experienced a significant reduction (-7% year-on-year). In 2017, the
market entered a second year of deficits estimated at between 90 kt and 110 kt of nickel.
On the demand side, stainless is expected to continue to grow while growth in non-stainless
applications is expected to remain steady. Overall, we expect the market to remain in deficit in 2018.
The long-term outlook for nickel continues to be positive. Capital investment for new projects and
replacement volumes have been deferred within the context of challenging economic conditions,
which will widen future deficits given the continued demand growth as global economies stabilize.
Nickel in electric vehicle batteries will become an increasingly important source of demand growth,
particularly as battery chemistry trends towards higher nickel content, which allows higher energy
densities, and as the market shifts towards utilization of larger size batteries.
COPPER
In the copper market, LME copper price averaged US$ 6,166/t in 2017, an increase of 27% from
2016, with 4Q17 (US$ 6,808/t) being the strongest pricing quarter since 4Q14. This rise was
supported by increased global demand and tight supply. Total exchange inventories were practically
stable.
Global demand increased by 2% in 2017 vs. 2016. Looking at China specifically – accounting for
nearly 50% of global copper consumption – demand increased 3.2% year-on-year and was driven
primarily by increased infrastructure investment and the housing market. On the supply side, global
refined copper production remained relatively flat at 0.8% in 2017 vs. 2016 given mine supply
constraints during the first half of the year. A total of 800 kt of disruptions to mine supply have been
identified in 2017, mainly due to labor negotiations and government disputes, equivalent to 3.9% of
2017’s expected annual production.

9
Demand for copper due to electric vehicles and associated infrastructure is expected to increase at
a faster pace relative to previous years. Over the long-term, copper demand is also expected to
grow, driven in part by the increasing investment in renewable energy, while constraint on future
supply is expected, given declining ore grades and the need for greenfield investments.
COBALT
Cobalt reference benchmark price averaged US$ 57,025/t in 2017, more than double (127%)
compared to 2016. The reason for this increase in price is expected future demand from the battery
market given the growth in electric vehicles.
Cobalt is one of the key metals, besides nickel, needed to produce the highest energy density
batteries for use in electric vehicles. The cobalt market needs to grow significantly to feed into battery
demand; however, unlike other metals, cobalt is predominantly a by-product of nickel and copper
mining. This means that it does not have the flexibility to respond to demand pressures as readily
as other commodities.

10
Operating revenues
ANNUAL PERFORMANCE
Net operating revenues in 2017 were US$ 33.967 billion, 23.6% higher than the US$ 27.488
billion registered in 2016. The increase in sales revenues was mainly due to higher realized
prices of Ferrous Minerals (US$ 4.382 billion), Base Metals (US$ 1.029 billion) and Coal (US$
386 million) and higher sales volumes of Ferrous Minerals (US$ 397 million) and Coal (US$
342 million), being partially offset by lower Base Metals sales volumes (US$ 297 million).
The following tables cover net operating revenues by destination and by business area, with
the following highlights:
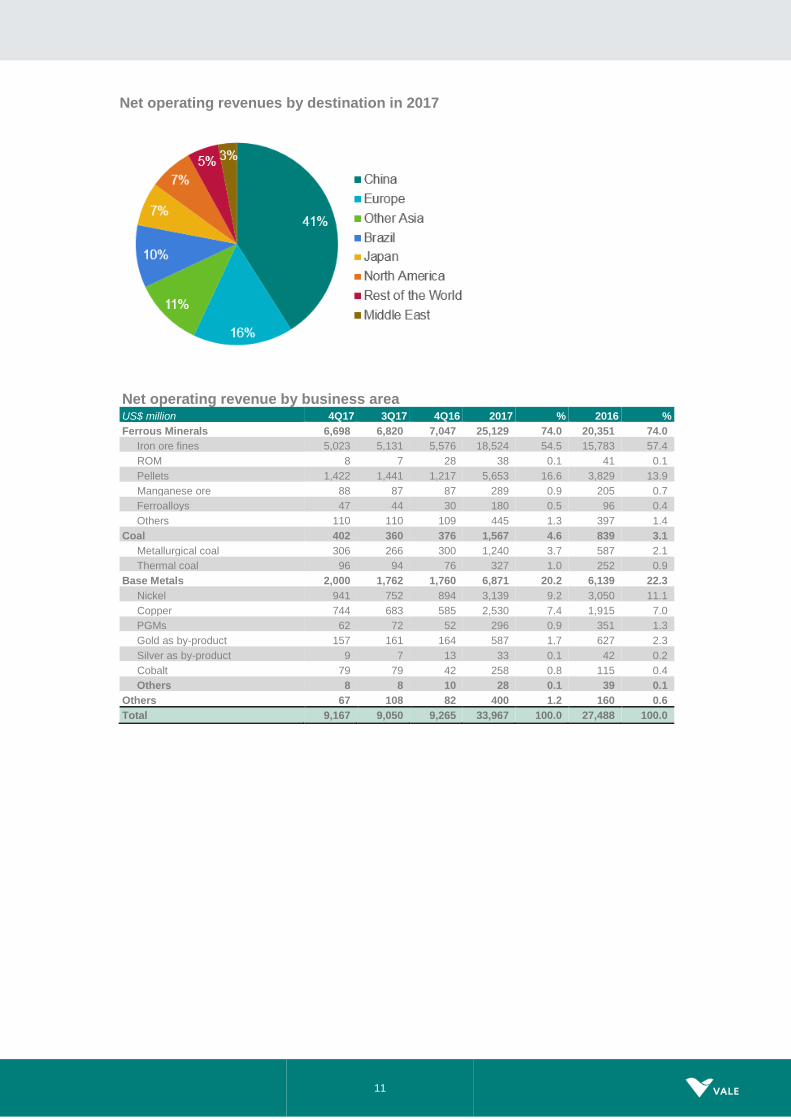
• Revenues by destination: higher geographical diversification, with lower share of
revenues from China, 41% in 2017 vs. 46% in 2016, and higher contribution from Asia
ex-China and South America, 18% and 12% in 2017 vs. 15% and 9% in 2016,
respectively.
• Contribution by business segment: Ferrous Minerals business segment share of
revenues was 74% in 2017, in line with 2016, while Coal segment share increased to
5% from 3% and Base Metals segment share decreased to 20% from 22% in the same
period.
QUARTERLY PERFORMANCE
Net operating revenues in 4Q17 were US$ 9.167 billion, 1.3% higher than the US$ 9.050 billion
in 3Q17. The increase in sales revenues was mainly due to higher sales volumes for Ferrous
Minerals (US$ 310 million) and higher sales prices for Base Metals (US$ 193 million), being
partially offset by lower Ferrous Minerals sales prices (US$ 432 million).
Net operating revenue by destination
US$ million 4Q17 3Q17 4Q16 2017 % 2016 %
North America 638 617 647 2,379 7.0 2,186 8.0
USA 351 352 328 1,310 3.9 1,005 3.7
Canada 269 246 310 1,008 3.0 1,172 4.3
Mexico 18 19 9 61 0.2 9 0.0
South America 1,307 916 713 4,078 12.0 2,411 8.8
Brazil 1,149 783 627 3,475 10.2 2,064 7.5
Others 158 133 86 603 1.8 345 1.3
Asia 5,473 5,520 5,898 20,056 59.0 16,878 61.4
China 3,824 3,822 4,685 14,018 41.3 12,747 46.4
Japan 633 736 513 2,456 7.2 1,741 6.3
South Korea 449 384 224 1,399 4.1 880 3.2
Others 567 578 476 2,183 6.4 1,510 5.5
Europe 1,260 1,409 1,497 5,502 16.2 4,649 16.9
Germany 374 368 415 1,389 4.1 1,379 5.0
Italy 162 99 85 521 1.5 435 1.6
Others 724 942 997 3,592 10.6 2,835 10.3
Middle East 301 282 338 1,085 3.2 967 3.5
Rest of the World 188 306 173 867 2.6 400 1.5
Total 9,167 9,050 9,265 33,967 100.0 27,488 100.0
11
Net operating revenues by destination in 2017
Net operating revenue by business area
US$ million 4Q17 3Q17 4Q16 2017 % 2016 %
Ferrous Minerals 6,698 6,820 7,047 25,129 74.0 20,351 74.0
Iron ore fines 5,023 5,131 5,576 18,524 54.5 15,783 57.4
ROM 8 7 28 38 0.1 41 0.1
Pellets 1,422 1,441 1,217 5,653 16.6 3,829 13.9
Manganese ore 88 87 87 289 0.9 205 0.7
Ferroalloys 47 44 30 180 0.5 96 0.4
Others 110 110 109 445 1.3 397 1.4
Coal 402 360 376 1,567 4.6 839 3.1
Metallurgical coal 306 266 300 1,240 3.7 587 2.1
Thermal coal 96 94 76 327 1.0 252 0.9
Base Metals 2,000 1,762 1,760 6,871 20.2 6,139 22.3
Nickel 941 752 894 3,139 9.2 3,050 11.1
Copper 744 683 585 2,530 7.4 1,915 7.0
PGMs 62 72 52 296 0.9 351 1.3
Gold as by-product 157 161 164 587 1.7 627 2.3
Silver as by-product 9 7 13 33 0.1 42 0.2
Cobalt 79 79 42 258 0.8 115 0.4
Others 8 8 10 28 0.1 39 0.1
Others 67 108 82 400 1.2 160 0.6
Total 9,167 9,050 9,265 33,967 100.0 27,488 100.0

12
Costs and expenses
COST OF GOODS SOLD (COGS)
ANNUAL PERFORMANCE
COGS7, net of depreciation, totaled US$ 17.555 billion in 2017, with a net increase of US$ 268
million, or 2%, compared to 2016, after excluding the following effects from:
(i) stronger operational performance, resulting in higher sales volumes impact on
COGS (US$ 484 million);
(ii) higher commodities prices, resulting in higher pelletizing plants’ leasing costs,
higher royalties, higher costs of feed purchased from third-parties and
provision for profit sharing payments to employees (US$ 695 million);
(iii) other exogenous factors, such as the negative impact of exchange rate
variations on COGS (US$ 655 million), higher bunker oil prices (US$ 409
million), higher freight costs8 (US$ 267 million) and higher energy costs (US$
215 million);
(iv) the Nacala Logistics Corridor (NLC) tariff introduced in 2017 which pays for the
remuneration of Vale’s remaining debt instruments (US$ 179 million) as part of
7 COGS currency exposure in 2017 was as follows: 52% BRL, 33% USD, 12% CAD and 3% EUR. 8 Excluding the effect of higher bunker oil prices.
IMPACTS OF HIGHER COMMODITIES PRICES ON COSTS AND EXPENSES
The higher commodities prices seen in 2017 versus 2016 contributed to the increase in
Vale’s sales revenues, but also resulted in an increase in costs and expenses, a procyclical
effect.
Some of Vale’s costs and expenses vary directly with prices of its own products, such as: (i)
pelletizing plants’ leasing costs, which are contractually adjusted based on pellet prices; (ii)
royalties; (iii) purchase of iron ore and nickel from third parties; and (iv) provision for profit
sharing for Vale’s employees. Unlike the typical “cost inflation” examined by industry
analysts, these cost increases reverse immediately should iron ore and nickel prices decline.
Additionally, bunker oil prices, which are a component of the freight costs, tend to increase
in a higher commodities price environment, however as a result of macroeconomic trends
and therefore with less than perfect correlation.

13
the NLC capital structure, which is received back by Vale through Financial
Income.
The net increase of US$ 268 million in COGS was mainly driven by the increase of Base Metals
costs due to higher nickel costs (US$ 359 million) as a result of the transition to a simpler and
more efficient nickel flowsheet in the North Atlantic operations and the increase of nickel unit
costs due to lower production volumes, reflecting Vale’s commitment to value over volume in
the nickel business, which were partly offset by lower copper costs (US$ 116 million).
QUARTERLY PERFORMANCE
COGS9, net of depreciation, totaled US$ 4.873 billion in 4Q17, remaining practically in line with
3Q17, after excluding the effects from:
(i) stronger operational performance, resulting in higher sales volumes impact on
COGS (US$ 150 million);
(ii) stronger commodities environment, resulting in higher bunker oil prices (US$
39 million);
(iii) and other exogenous factors, such as the positive impact of exchange rate
variation on COGS (US$ 57 million), higher freight costs10 (US$ 71 million) and
higher oil and energy costs (US$ 21 million).
Further details regarding cost performance are provided in the “Performance of the Business
Segments” section.
COGS by business segment US$ million 4Q17 3Q17 4Q16 2017 % 2016 %
Ferrous Minerals 3,664 3,375 3,213 13,007 61.8 10,623 60.2
Base Metals 1,558 1,524 1,498 5,989 28.5 5,697 32.3
Coal 490 423 292 1,641 7.8 1,057 6.0
Other products 79 90 100 402 1.9 273 1.5
Total COGS 5,791 5,412 5,103 21,039 100.0 17,650 100.0
Depreciation 918 868 952 3,484 - 3,267 -
COGS, ex-depreciation 4,873 4,544 4,151 17,555 - 14,383 -
9 COGS currency exposure in 4Q17 was as follows: 50% BRL, 35% USD, 12% CAD and 3% EUR.
10 Excluding the effect of higher bunker oil prices.

14
EXPENSES
ANNUAL PERFORMANCE
Total expenses, excluding depreciation, amounted to US$ 1.480 billion in 2017, US$ 82 million
lower than in 201611.
SG&A, excluding depreciation, totaled US$ 440 million in 2017, US$ 34 million higher than in
201612, mainly due to the stronger commodities environment in 2017 which resulted in (i) higher
selling expenses, driven by higher sales performance, (ii) the impact of Brazilian employees’
salary increase of 8.5% set in the November 2016 collective bargaining agreement of; and (iii)
management severance expenses.
R&D expenses totaled US$ 340 million in 2017, in line with 201613.
Pre-operating and stoppage expenses, excluding depreciation, totaled US$ 280 million in 2017,
US$ 75 million lower than in 201614, mainly due to lower pre-operating expenses in Long
Harbour (US$ 64 million) and Mozambique (US$ 37 million), as their ramp-ups mature. These
reductions were partly offset by higher pre-operating expenses in S11D, due to the start of the
ramp-up (US$ 55 million).
Other operating expenses amounted to US$ 420 million in 2017, US$ 32 million lower than in
201615, after adjusting for the one-off positive effect from the goldstream transaction (US$ 150
million) in 2016.
QUARTERLY PERFORMANCE
Total expenses, excluding depreciation, amounted to US$ 421 million in 4Q17, increasing by
US$ 19 million from 3Q17. The main reasons for this increase were: (i) the stoppage of Stobie
and Birchtree mines in Canada, after a detailed review on a mine-by-mine basis, in order to
improve the nickel business margin going forward; and (ii) the ramp-up of S11D operations
resulting in higher pre-operating expenses. Additionally, as a result of the detailed review in the
nickel business, Vale is planning to stop operations of the precious metals refinery in Acton and
the smelter and refinery in Thompson in 2018.
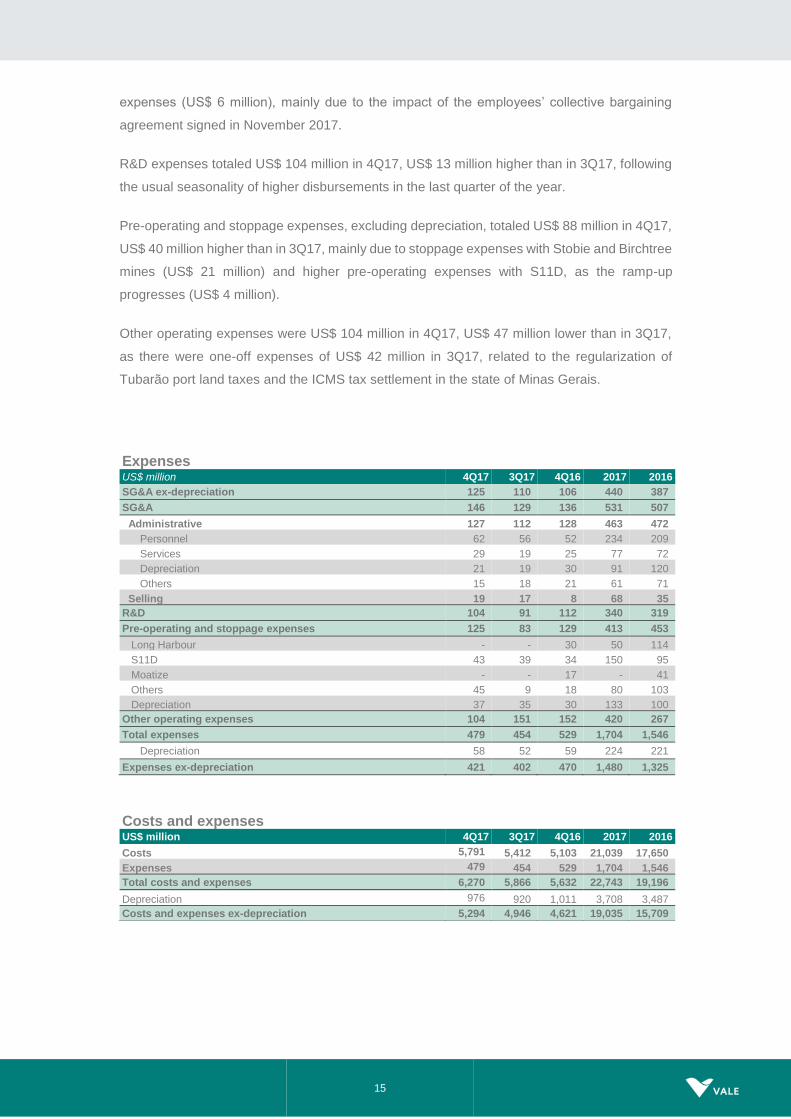
SG&A, excluding depreciation, totaled US$ 125 million in 4Q17, US$ 15 million higher than in
3Q17, mainly due to higher services expenses (US$ 8 million) and seasonally higher personnel
11 After adjusting for the one-off positive effect from the goldstream transaction of US$ 150 million in 2016 and after excluding
exchange rate variation impacts of US$ 86 million. 12 After excluding exchange rate variation impacts of US$ 19 million. 13 After excluding exchange rate variation impacts of US$ 18 million. 14 After excluding exchange rate variation impacts of US$ 14 million. 15 After excluding exchange rate variation impacts of US$ 35 million.
15
expenses (US$ 6 million), mainly due to the impact of the employees’ collective bargaining
agreement signed in November 2017.
R&D expenses totaled US$ 104 million in 4Q17, US$ 13 million higher than in 3Q17, following
the usual seasonality of higher disbursements in the last quarter of the year.
Pre-operating and stoppage expenses, excluding depreciation, totaled US$ 88 million in 4Q17,
US$ 40 million higher than in 3Q17, mainly due to stoppage expenses with Stobie and Birchtree
mines (US$ 21 million) and higher pre-operating expenses with S11D, as the ramp-up
progresses (US$ 4 million).
Other operating expenses were US$ 104 million in 4Q17, US$ 47 million lower than in 3Q17,
as there were one-off expenses of US$ 42 million in 3Q17, related to the regularization of
Tubarão port land taxes and the ICMS tax settlement in the state of Minas Gerais.
Expenses US$ million 4Q17 3Q17 4Q16 2017 2016
SG&A ex-depreciation 125 110 106 440 387
SG&A 146 129 136 531 507
Administrative 127 112 128 463 472
Personnel 62 56 52 234 209
Services 29 19 25 77 72
Depreciation 21 19 30 91 120
Others 15 18 21 61 71
Selling 19 17 8 68 35
R&D 104 91 112 340 319
Pre-operating and stoppage expenses 125 83 129 413 453
Long Harbour - - 30 50 114
S11D 43 39 34 150 95
Moatize - - 17 - 41
Others 45 9 18 80 103
Depreciation 37 35 30 133 100
Other operating expenses 104 151 152 420 267
Total expenses 479 454 529 1,704 1,546
Depreciation 58 52 59 224 221
Expenses ex-depreciation 421 402 470 1,480 1,325
Costs and expenses US$ million 4Q17 3Q17 4Q16 2017 2016
Costs 5,791 5,412 5,103 21,039 17,650
Expenses 479 454 529 1,704 1,546
Total costs and expenses 6,270 5,866 5,632 22,743 19,196
Depreciation 976 920 1,011 3,708 3,487
Costs and expenses ex-depreciation 5,294 4,946 4,621 19,035 15,709
16
Adjusted earnings before interest, taxes, depreciation and amortization (EBITDA)
ANNUAL PERFORMANCE
Adjusted EBITDA in 2017 was US$ 15.338 billion, 28.1% higher than in 2016, mainly as a result
of higher realized prices across all Vale’s business segments (US$ 4.537 billion), higher
premiums and gains in commercial initiatives in Ferrous Minerals (US$ 1.439 billion). These
positive impacts were partially offset by the expected pro-cyclical effects in costs and expenses
driven by higher commodities prices, as well as exogenous factors, as detailed below:
(i) higher commodities prices, resulting in higher pelletizing plants’ leasing costs,
higher royalties, higher costs of feed purchased from third-parties and provision for
profit sharing payments to employees, all driven by higher iron ore prices (US$ 695
million) and higher bunker oil prices (US$ 409 million); and
(ii) other exogenous factors, such as the negative impacts of exchange rate variations
on costs and expenses (US$ 725 million), higher freight costs16 (US$ 267 million)
and higher energy costs (US$ 215 million).
QUARTERLY PERFORMANCE
Adjusted EBITDA in 4Q17 was US$ 4.109 billion, in line with the US$ 4.192 billion recorded in
3Q17, despite the reduction of US$ 5.3/t in Platts IODEX, as a result of higher prices in Base
Metals and Coal, higher sales volumes in Ferrous Minerals and lower costs in Base Metals.
Adjusted EBITDA of the Ferrous Minerals business segment was US$ 3.319 billion in 4Q17,
9.7% lower than in 3Q17, impacted by the 7.5% reduction of the Platts IODEX and by lower
market premiums. Slightly higher costs and expenses were partially offset by higher volumes.
Adjusted EBITDA of the Base Metals business segment was US$ 782 million in 4Q17, the
highest quarterly level since 1Q11, with an increase of US$ 221 million vs. 3Q17, mainly as a
result of higher prices, lower costs, and higher nickel and copper volumes, which were partially
offset by lower by-product volumes and higher expenses.
Adjusted EBITDA for the Coal business segment was US$ 66 million in 4Q17, US$ 20 million
higher than in 3Q17, mainly due to higher realized sales prices, which were partially offset by
lower sales volumes and higher costs and expenses.
16 Excluding the effect of higher bunker oil prices.

17
Other business segments Adjusted EBITDA was negative US$ 58 million, US$ 31 million better
than in 3Q17, mainly due to dividends received from MRN, CSI and Aliança Energia.
Adjusted EBITDA US$ million 4Q17 3Q17 4Q16 2017 2016
Net operating revenues 9,167 9,050 9,265 33,967 27,488
COGS (5,791) (5,412) (5,103) (21,039) (17,650)
SG&A (146) (129) (136) (531) (507)
Research and development (104) (91) (112) (340) (319)
Pre-operating and stoppage expenses (125) (83) (129) (413) (453)
Other operational expenses (104) (151) (152) (420) (267)
Adjusted EBIT 2,897 3,184 3,633 11,224 8,292
Depreciation, amortization & depletion 976 920 1,011 3,708 3,487
Dividends and interests on associates and JVs 236 88 78 406 193
Adjusted EBITDA 4,109 4,192 4,722 15,338 11,972
Iron ore - Platts' 62% IODEX 65.6 70.9 70.8 71.3 58.5
Adjusted EBITDA by business area US$ million 4Q17 3Q17 4Q16 2017 2016
Ferrous Minerals 3,319 3,674 4,109 13,192 10,476
Coal 66 46 156 330 (54)
Base Metals 782 561 543 2,139 1,848
Others (58) (89) (86) (323) (298)
Total 4,109 4,192 4,722 15,338 11,972
Iron ore - Platts' 62% IODEX 65.6 70.9 70.8 71.3 58.5
18
Net income
ANNUAL PERFORMANCE
Net income was US$ 5.507 billion in 2017, increasing US$ 1.525 billion when compared to
2016.
Underlying earnings were US$ 7.023 billion in 2017, US$ 2.055 billion higher than in 2016,
mainly due to the US$ 3.366 billion increase in Adjusted EBITDA.
Impairments and other results on non-current assets and in associates and JVs caused non-
cash losses of US$ 474 million in 2017 vs. US$ 2.460 billion in 2016. In 2017, impairments
were mainly driven by closure of the Stobie mine (US$ 133 million) and Samarco (US$ 180
million). Samarco impairments were write-downs of the debt instruments used to fund its
working capital.
Net financial results showed a loss of US$ 3.019 billion in 2017, compared to a gain of US$
1.843 billion in 2016. The decrease of US$ 4.862 billion was mainly a result of non-cash losses
on exchange rate variations in 2017 vs. non-cash gains in 2016 (US$ 3.772 billion) and lower
gains on derivatives of currency and interest rate swaps (US$ 802 million).
In 2017, gross interest decreased 4% from US$ 1.768 billion in 2016 to US$ 1.697 billion, due
to the reduction of the gross debt, partly offset by the increase in the average cost of debt, as
the company prepaid short term debt, which is cheaper. Capitalization of interest decreased
from US$ 653 million in 2016 to US$ 370 million in 2017, as a result of the conclusion of the
Nacala Logistics Corridor project and the ramp-up of S11D.
Other financial expenses increased by US$ 254 million in 2017 vs. 2016, of which US$ 183
million were related to the repurchase of bonds and prepayment of loans in 2017.
Financial income includes US$ 179 million of interest on receivable loans from the Nacala
Logistics Corridor (NLC), as in 3Q17 we started to recognize the interest on Vale’s shareholder
loans to NLC.
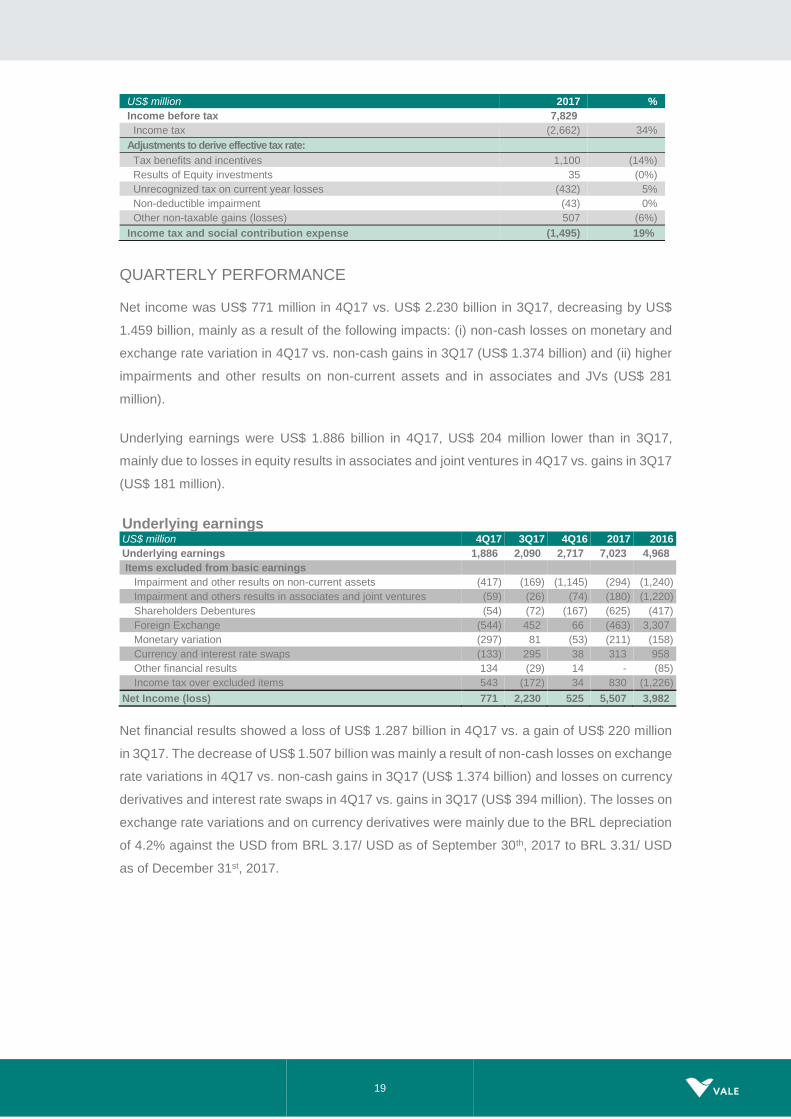
Income tax and social contribution expense totaled US$ 1.495 billion in 2017, representing an
effective tax rate of 19%. The effective tax rate was lower than the nominal 34% corporate tax
rate mainly due to tax benefits and incentives (US$ 1.100 billion), which were partlialy offset by
unrecognized tax assets on current year losses (US$ 432 million), mainly in Mozambique and
New Caledonia.
19
US$ million 2017 %
Income before tax 7,829
Income tax (2,662) 34%
Adjustments to derive effective tax rate:
Tax benefits and incentives 1,100 (14%)
Results of Equity investments 35 (0%)
Unrecognized tax on current year losses (432) 5%
Non-deductible impairment (43) 0%
Other non-taxable gains (losses) 507 (6%)
Income tax and social contribution expense (1,495) 19%
QUARTERLY PERFORMANCE
Net income was US$ 771 million in 4Q17 vs. US$ 2.230 billion in 3Q17, decreasing by US$
1.459 billion, mainly as a result of the following impacts: (i) non-cash losses on monetary and
exchange rate variation in 4Q17 vs. non-cash gains in 3Q17 (US$ 1.374 billion) and (ii) higher
impairments and other results on non-current assets and in associates and JVs (US$ 281
million).
Underlying earnings were US$ 1.886 billion in 4Q17, US$ 204 million lower than in 3Q17,
mainly due to losses in equity results in associates and joint ventures in 4Q17 vs. gains in 3Q17
(US$ 181 million).
Underlying earnings US$ million 4Q17 3Q17 4Q16 2017 2016
Underlying earnings 1,886 2,090 2,717 7,023 4,968
Items excluded from basic earnings
Impairment and other results on non-current assets (417) (169) (1,145) (294) (1,240)
Impairment and others results in associates and joint ventures (59) (26) (74) (180) (1,220)
Shareholders Debentures (54) (72) (167) (625) (417)
Foreign Exchange (544) 452 66 (463) 3,307
Monetary variation (297) 81 (53) (211) (158)
Currency and interest rate swaps (133) 295 38 313 958
Other financial results 134 (29) 14 - (85)
Income tax over excluded items 543 (172) 34 830 (1,226)
Net Income (loss) 771 2,230 525 5,507 3,982
Net financial results showed a loss of US$ 1.287 billion in 4Q17 vs. a gain of US$ 220 million
in 3Q17. The decrease of US$ 1.507 billion was mainly a result of non-cash losses on exchange
rate variations in 4Q17 vs. non-cash gains in 3Q17 (US$ 1.374 billion) and losses on currency
derivatives and interest rate swaps in 4Q17 vs. gains in 3Q17 (US$ 394 million). The losses on
exchange rate variations and on currency derivatives were mainly due to the BRL depreciation
of 4.2% against the USD from BRL 3.17/ USD as of September 30th, 2017 to BRL 3.31/ USD
as of December 31st, 2017.

20
Financial results US$ million 4Q17 3Q17 4Q16 2017 2016
Financial expenses (562) (826) (762) (3,276) (2,677)
Gross interest (378) (417) (441) (1,697) (1,768)
Capitalization of interest 73 111 91 370 653
Tax and labor contingencies (10) (22) 15 (52) (10)
Shareholder debentures (54) (72) (167) (625) (417)
Others (124) (332) (133) (875) (621)
Financial expenses (REFIS) (69) (94) (127) (397) (514)
Financial income 149 152 52 481 170
Derivatives¹ (29) 365 96 454 1,256
Currency and interest rate swaps (133) 295 39 313 959
Others² (bunker oil, commodities, etc) 104 70 57 141 297
Foreign Exchange (540) 443 64 (463) 3,252
Monetary variation (305) 86 (53) (215) (158)
Financial result, net (1,287) 220 (603) (3,019) 1,843
¹The net derivatives loss of US$ 29 million in 4Q17 is comprised of settlement losses of US$ 17 million and mark-to-market losses of US$ 12 million.
² Other derivatives include bunker oil derivatives gains of US$ 16 million.
Equity income from affiliated companies
ANNUAL PERFORMANCE
Equity income from affiliated companies showed a gain of US$ 98 million in 2017 vs. a gain of
US$ 309 million in 2016. The main contributors to equity income were the leased pelletizing
companies in Tubarão (US$ 224 million), MRS (US$ 69 million), CSI (US$ 42 million) and
Aliança Geração de Energia (US$ 27 million), which were partly offset by losses from Nacala
(US$ 62 million) and CSP (US$ 264 million).
QUARTERLY PERFORMANCE
Equity income from affiliated companies showed a loss of US$ 66 million in 4Q17 vs. a gain of
US$ 115 million in 3Q17. The main contributors to equity income were the leased pelletizing
companies in Tubarão (US$ 60 million), MRS (US$ 9 million), Aliança Geração de Energia (US$
9 million) and CSI (US$ 7 million), which were offset by losses from Nacala (US$ 40 million),
due to expenses related to signing the Project Finance contracts, and CSP (US$ 122 million),
due to the non-cash impact of the BRL depreciation on its USD denominated debt.
21
Shareholders’ remuneration
Vale will pay R$ 4.7 billion (US$ 1.5 billion) of shareholder remuneration in the form of interest
on capital. Vale’s Board of Directors approved the distribution of R$ 2.2 billion in December 2017
and R$ 2.5 billion in February 2018, to be paid in March 2018, which is equivalent to the
minimum established by Vale’s bylaws. The decision to pay the minimum requirement is
consistent with Vale’s primary focus to reduce its net debt to US$ 10 billion.
Considering the stronger commodities environment resulting in a free cash flow generation
higher than in 2H17 (US$ 4.2 billion) and the total net proceeds of US$ 3.7 billion from the sale
of Fertilizers assets and from the Nacala Corridor Project Finance, Vale may well achieve its net
debt target by the end of 1H18.
Net debt reduction is an enabler to adopt an aggressive dividend policy, applicable to any
commodity price scenario by linking shareholders’ remuneration to cash generation.
The new dividend policy is going to be more robust, more sustainable and more predictable,
aiming at generating outstanding returns for Vale’s shareholders over the coming years. It is
currently being discussed with the Board of Directors and will be announced by the end of March
2018.
22
Investments
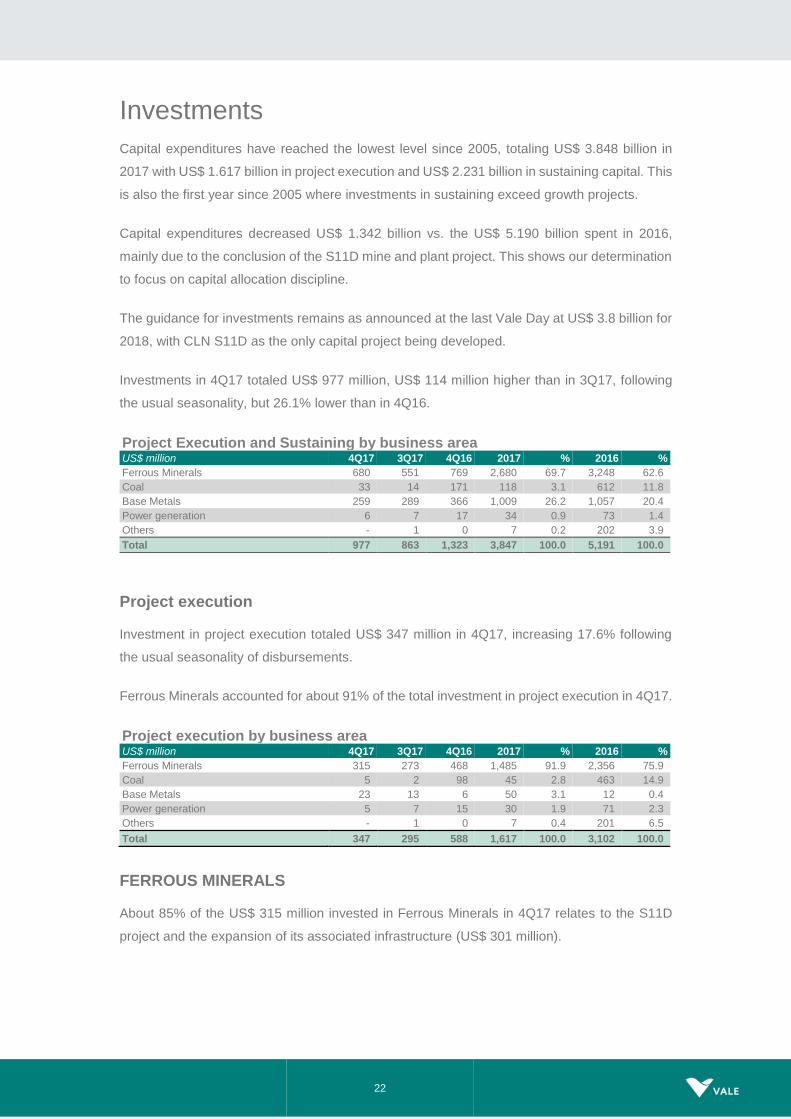
Capital expenditures have reached the lowest level since 2005, totaling US$ 3.848 billion in
2017 with US$ 1.617 billion in project execution and US$ 2.231 billion in sustaining capital. This
is also the first year since 2005 where investments in sustaining exceed growth projects.
Capital expenditures decreased US$ 1.342 billion vs. the US$ 5.190 billion spent in 2016,
mainly due to the conclusion of the S11D mine and plant project. This shows our determination
to focus on capital allocation discipline.
The guidance for investments remains as announced at the last Vale Day at US$ 3.8 billion for
2018, with CLN S11D as the only capital project being developed.
Investments in 4Q17 totaled US$ 977 million, US$ 114 million higher than in 3Q17, following
the usual seasonality, but 26.1% lower than in 4Q16.
Project Execution and Sustaining by business area US$ million 4Q17 3Q17 4Q16 2017 % 2016 %
Ferrous Minerals 680 551 769 2,680 69.7 3,248 62.6
Coal 33 14 171 118 3.1 612 11.8
Base Metals 259 289 366 1,009 26.2 1,057 20.4
Power generation 6 7 17 34 0.9 73 1.4
Others - 1 0 7 0.2 202 3.9
Total 977 863 1,323 3,847 100.0 5,191 100.0
Project execution
Investment in project execution totaled US$ 347 million in 4Q17, increasing 17.6% following
the usual seasonality of disbursements.
Ferrous Minerals accounted for about 91% of the total investment in project execution in 4Q17.
Project execution by business area US$ million 4Q17 3Q17 4Q16 2017 % 2016 %
Ferrous Minerals 315 273 468 1,485 91.9 2,356 75.9
Coal 5 2 98 45 2.8 463 14.9
Base Metals 23 13 6 50 3.1 12 0.4
Power generation 5 7 15 30 1.9 71 2.3
Others - 1 0 7 0.4 201 6.5
Total 347 295 588 1,617 100.0 3,102 100.0
FERROUS MINERALS
About 85% of the US$ 315 million invested in Ferrous Minerals in 4Q17 relates to the S11D
project and the expansion of its associated infrastructure (US$ 301 million).

23
S11D Mine – Buffer stockyard
S11D (including mine, plant and associated logistics – CLN S11D) achieved combined physical
progress of 93% in 4Q17 with the mine site concluded and 88% progress at the logistic
infrastructure sites.
The duplication of the railway reached 80% physical progress with 505 Km duplicated. The
product stockyard moved more than 22 Mt of ore and over 200 thousand wagons loaded until
December.
The Port expansion reached 97% physical progress, with the onshore stockyard expansion still
under construction but all the remaining onshore infrastructure completed. (The offshore port
expansion - pier IV, ship loading circuits and equipment - was concluded in 2016).
S11D Logistics – Duplication of the railway
24
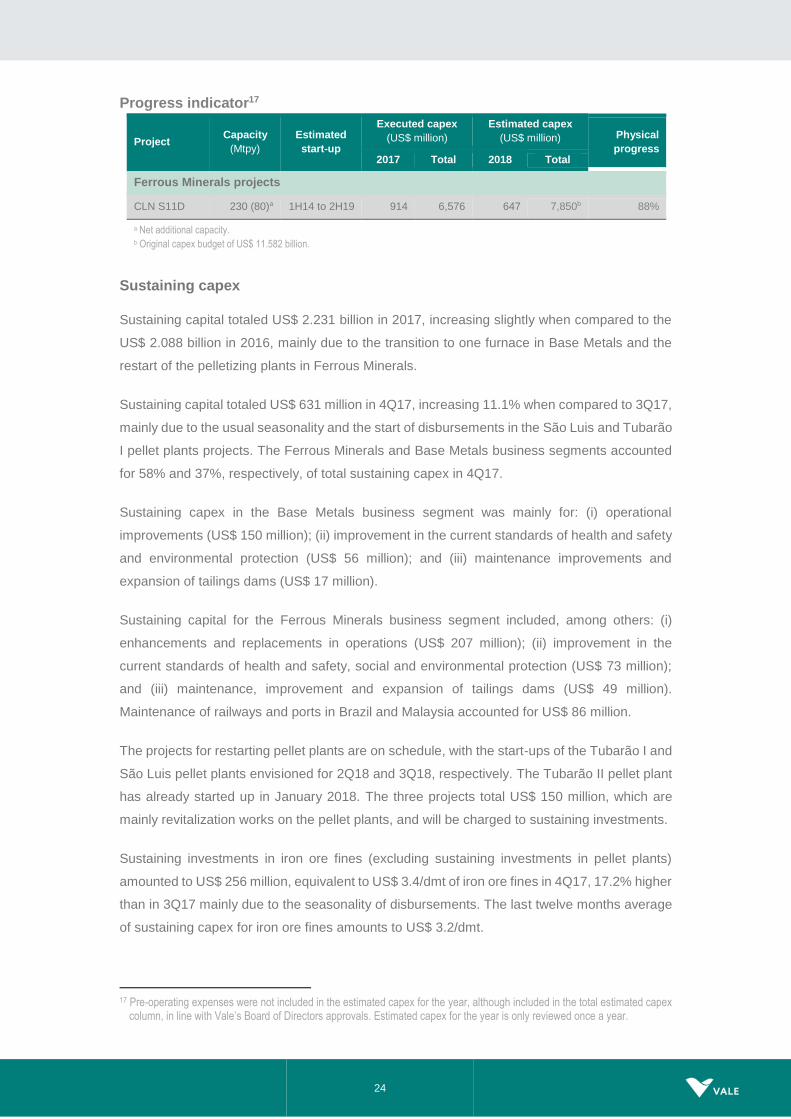
Progress indicator17
Sustaining capex
Sustaining capital totaled US$ 2.231 billion in 2017, increasing slightly when compared to the
US$ 2.088 billion in 2016, mainly due to the transition to one furnace in Base Metals and the
restart of the pelletizing plants in Ferrous Minerals.
Sustaining capital totaled US$ 631 million in 4Q17, increasing 11.1% when compared to 3Q17,
mainly due to the usual seasonality and the start of disbursements in the São Luis and Tubarão
I pellet plants projects. The Ferrous Minerals and Base Metals business segments accounted
for 58% and 37%, respectively, of total sustaining capex in 4Q17.
Sustaining capex in the Base Metals business segment was mainly for: (i) operational
improvements (US$ 150 million); (ii) improvement in the current standards of health and safety
and environmental protection (US$ 56 million); and (iii) maintenance improvements and
expansion of tailings dams (US$ 17 million).
Sustaining capital for the Ferrous Minerals business segment included, among others: (i)
enhancements and replacements in operations (US$ 207 million); (ii) improvement in the
current standards of health and safety, social and environmental protection (US$ 73 million);
and (iii) maintenance, improvement and expansion of tailings dams (US$ 49 million).
Maintenance of railways and ports in Brazil and Malaysia accounted for US$ 86 million.
The projects for restarting pellet plants are on schedule, with the start-ups of the Tubarão I and
São Luis pellet plants envisioned for 2Q18 and 3Q18, respectively. The Tubarão II pellet plant
has already started up in January 2018. The three projects total US$ 150 million, which are
mainly revitalization works on the pellet plants, and will be charged to sustaining investments.
Sustaining investments in iron ore fines (excluding sustaining investments in pellet plants)
amounted to US$ 256 million, equivalent to US$ 3.4/dmt of iron ore fines in 4Q17, 17.2% higher
than in 3Q17 mainly due to the seasonality of disbursements. The last twelve months average
of sustaining capex for iron ore fines amounts to US$ 3.2/dmt.
17 Pre-operating expenses were not included in the estimated capex for the year, although included in the total estimated capex
column, in line with Vale’s Board of Directors approvals. Estimated capex for the year is only reviewed once a year.
Project Capacity
(Mtpy)
Estimated
start-up
Executed capex
(US$ million)
Estimated capex
(US$ million) Physical
progress 2017 Total 2018 Total
Ferrous Minerals projects
CLN S11D 230 (80)a 1H14 to 2H19 914 6,576 647 7,850b 88%
a Net additional capacity. b Original capex budget of US$ 11.582 billion.

25
Sustaining capex by type - 4Q17
US$ million Ferrous
Minerals Coal Base Metals TOTAL
Operations 209 15 150 373
Waste dumps and tailing dams 49 1 17 67
Health and Safety 48 7 17 72
CSR - Corporate Social Responsibility 26 1 39 67
Administrative & Others 35 4 13 52
Total 367 28 236 631
Sustaining capex by business area US$ million 4Q17 3Q17 4Q16 2017 % 2016 %
Ferrous Minerals 365 278 301 1,195 53.6 892 42.7
Coal 28 12 73 73 3.3 149 7.1
Base Metals 236 276 360 959 43.0 1,045 50.0
Power generation 1 0 1 3 0.1 2 0.1
Others 0 0 - - - 1 0.0
Total 631 568 735 2,231 100.0 2,088 100.0
Corporate social responsibility
Investments in corporate social responsibility totaled US$ 612 million in 2017, of which US$
487 million dedicated to environmental protection and conservation and US$ 125 million to
social projects.
Portfolio Management
Vale signed the Nacala Logistics Corridor (NLC) Project Finance in 4Q17, through which NLC
will raise US$ 2.730 billion. The funds received will be mostly paid to Vale to take out part of
Vale’s shareholders loans conceded for construction of the NLC, but they will also be used to
support the ramp-up of the corridor.
In 4Q17, Vale also sold two very large ore carriers (VLOCs) of 400,000 dwt to nominees of
Bank of Communications Finance Leasing Co., Ltd. (Bocomm), for a total of US$ 178 million.
In 4Q17, Vale signed a quota purchase agreement with Yara International ASA, to sell its fully
owned subsidiary Vale Cubatão Fertilizantes Ltda., which currently owns and operates the
nitrogen and phosphate assets, for US$ 255 million. The conclusion of the transaction and the
proceeds should occur in 2H18, once conditions precedent are fulfilled.
Vale concluded the sale of its Fertilizer business, excluding the assets in Cubatão, to The
Mosaic Company in January 2018.
26
Free cash flow
Annual performance
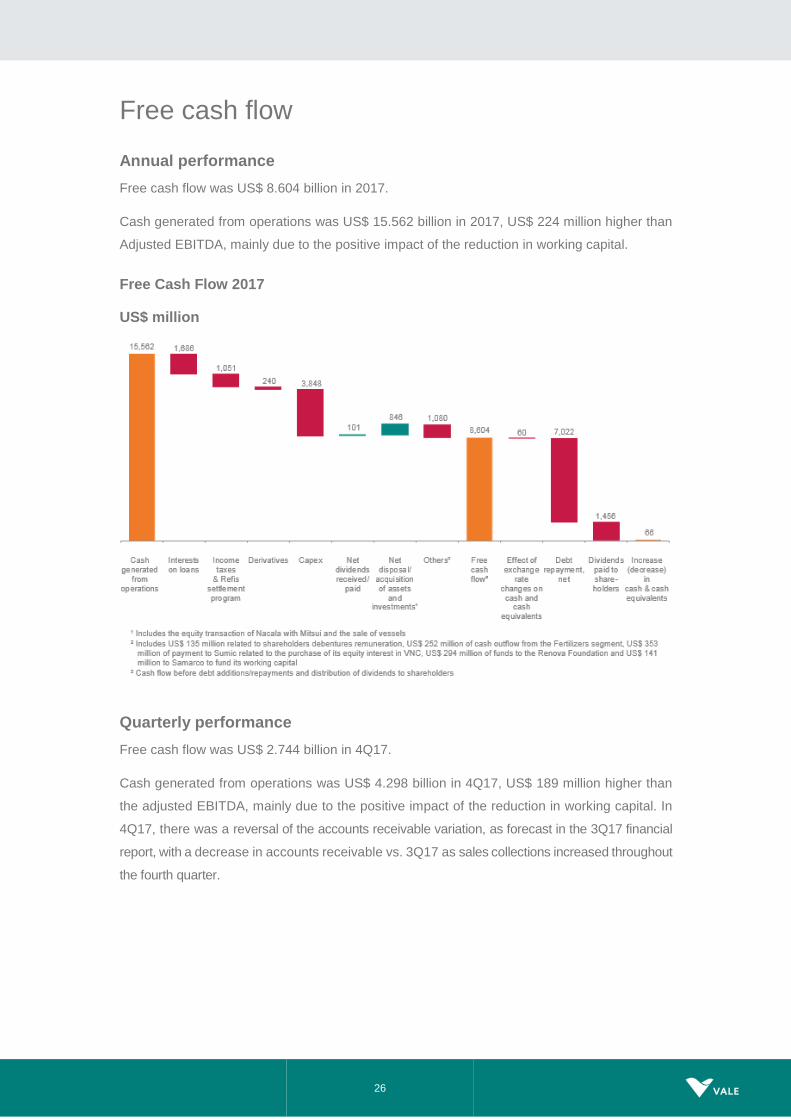
Free cash flow was US$ 8.604 billion in 2017.
Cash generated from operations was US$ 15.562 billion in 2017, US$ 224 million higher than
Adjusted EBITDA, mainly due to the positive impact of the reduction in working capital.
Free Cash Flow 2017
US$ million
Quarterly performance
Free cash flow was US$ 2.744 billion in 4Q17.
Cash generated from operations was US$ 4.298 billion in 4Q17, US$ 189 million higher than
the adjusted EBITDA, mainly due to the positive impact of the reduction in working capital. In
4Q17, there was a reversal of the accounts receivable variation, as forecast in the 3Q17 financial
report, with a decrease in accounts receivable vs. 3Q17 as sales collections increased throughout
the fourth quarter.

27
Free Cash Flow 4Q17
US$ million

28
Debt indicators Vale delivered a substantial reduction in its debt levels quarter-on-quarter and year-on-year.
Gross debt amounted to US$ 22.489 billion as of December 31st, 2017, decreasing by US$
6.833 billion from December 31st, 2016 and by US$ 3.301 billion from September 30th, 2017.
The decrease in gross debt against the end of last quarter was mainly due to net debt
repayments18 of US$ 3.447 billion in 4Q17 and to the effects of the BRL depreciation over Vale’s
debt, which decreased BRL-denominated debt when translated to USD by US$ 539 million
(partially offset by the US$ 320 million impact of the exchange rate variation on the USD and
EUR-denominated debt when converted into BRL, Vale’s functional currency). Interest accrued
in the period was US$ 378 million.
Net debt decreased by US$ 2.923 billion compared to the end of the previous quarter and by
US$ 6.899 billion compared to the end of 2016, totaling US$ 18.143 billion based on a cash
position of US$ 4.346 billion as of December 31st, 2017.
Considering the total net proceeds of US$ 3.7 billion19 from the sale of Fertilizers assets
received by Vale in January 2018 and from the Nacala Corridor Project Finance to be received
by Vale on March 21st,2018, pro forma net debt is equivalent to US$ 14.4 billion.
Debt position
18 Debt repayments less debt additions. Include interest payments. 19 Total proceeds from both transactions.

29
Gross debt after currency and interest rate swaps was 91% denominated in USD, with 27%
based on floating and 73% based on fixed interest rates as of December 31st, 2017.
Average debt maturity increased to 8.9 years on December 31st, 2017, against 8.4 years on
September 30th, 2017 and 7.9 years on December 31st, 2016. Average cost of debt, after the
abovementioned currency and interest rate swaps, increased slightly, to 5.06% per annum on
December 31st, 2017, against 4.96% per annum on September 30th, 2017. As the company
prepaid debt with shorter maturities and with cheaper borrowing rates, both maturity and
average cost of debt increased.

30
Interest coverage, measured by the ratio of LTM20 adjusted EBITDA to LTM gross interest, was
9.0x in 4Q17, the same as in 3Q17, and higher than the 6.8x in 4Q16.
Leverage, measured by gross debt to LTM adjusted EBITDA, decreased to 1.5x as of
December 31st, 2017 from 1.6x as of September 30th, 2017 and from 2.4x as of December 31st,
2016. Measuring by net debt to LTM adjusted EBITDA, leverage decreased to 1.2x as of
December 31st, 2017 from 1.3x as of September 30th, 2017 and from 2.1x as of December 31st,
2016.
Debt indicators US$ million 4Q17 3Q17 4Q16
Total debt 22,489 25,790 29,322
Net debt 18,143 21,066 25,042
Total debt / adjusted LTM EBITDA (x) 1.5 1.6 2.4
Net debt / adjusted LTM EBITDA (x) 1.2 1.3 2.1
Adjusted LTM EBITDA / LTM gross interest (x) 9.0 9.1 6.8
20 LTM = last twelve months

31
Performance of the business segments
Segment information – 2017, as per footnote of financial statements Expenses
US$ million Net
Revenues Cost¹
SG&A and others¹
R&D¹ Pre operating
& stoppage¹
Dividends and interests on associates
and JVs
Adjusted EBITDA
Ferrous Minerals 25,129 (11,410) (356) (109) (192) 130 13,192
Iron ore fines 18,524 (7,950) (284) (88) (181) 30 10,051
ROM 38 - - - - - 38
Pellets 5,653 (2,876) (65) (19) (7) 81 2,767
Others ferrous 445 (306) 5 (2) - 19 161
Mn & Alloys 469 (278) (12) - (4) - 175
Coal 1,567 (1,354) (44) (14) (4) 179 330
Base Metals 6,871 (4,416) (179) (62) (75) - 2,139
Nickel² 4,667 (3,437) (153) (48) (75) - 954
Copper³ 2,204 (979) (27) (13) - - 1,185
Others 400 (375) (281) (155) (9) 97 (323)
Total 33,967 (17,555) (860) (340) (280) 406 15,338
¹ Excluding depreciation and amortization.
² Including copper and by-products from our nickel operations.
³ Including by-products from our copper operations.
Segment information – 4Q17, as per footnote of financial statements Expenses
US$ million Net
Revenues Cost¹
SG&A and others¹
R&D¹ Pre operating
& stoppage¹
Dividends and interests on associates
and JVs
Adjusted EBITDA
Ferrous Minerals 6,698 (3,239) (130) (34) (56) 80 3,319
Iron ore fines 5,023 (2,302) (103) (27) (53) 29 2,567
ROM 8 - - - - - 8
Pellets 1,422 (779) (22) (6) (2) 44 657
Others ferrous 110 (76) (1) (1) - 7 39
Mn & Alloys 135 (82) (4) - (1) - 48
Coal 402 (433) (12) (3) - 112 66
Base Metals 2,000 (1,130) (45) (18) (25) - 782
Nickel² 1,358 (874) (33) (15) (25) - 411
Copper³ 642 (256) (12) (3) - - 371
Others 67 (71) (42) (49) (7) 44 (58)
Total 9,167 (4,873) (229) (104) (88) 236 4,109
¹ Excluding depreciation and amortization.
² Including copper and by-products from our nickel operations.
³ Including by-products from our copper operations.
32
Ferrous Minerals
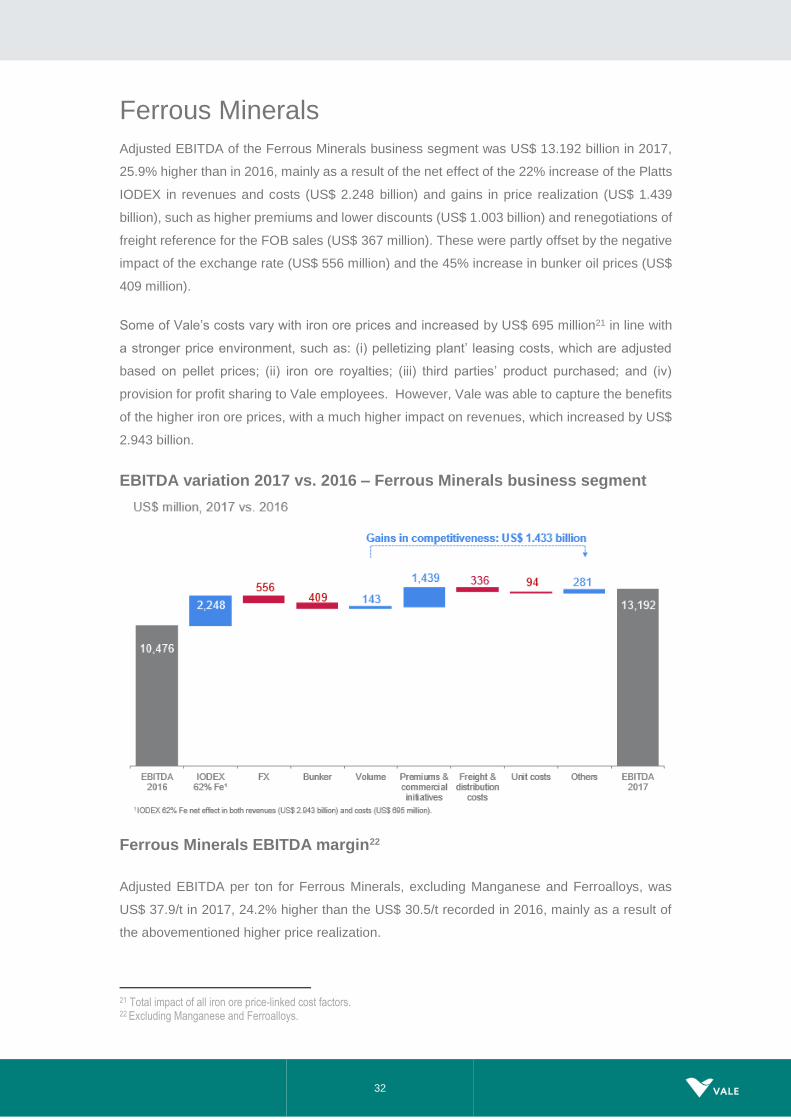
Adjusted EBITDA of the Ferrous Minerals business segment was US$ 13.192 billion in 2017,
25.9% higher than in 2016, mainly as a result of the net effect of the 22% increase of the Platts
IODEX in revenues and costs (US$ 2.248 billion) and gains in price realization (US$ 1.439
billion), such as higher premiums and lower discounts (US$ 1.003 billion) and renegotiations of
freight reference for the FOB sales (US$ 367 million). These were partly offset by the negative
impact of the exchange rate (US$ 556 million) and the 45% increase in bunker oil prices (US$
409 million).
Some of Vale’s costs vary with iron ore prices and increased by US$ 695 million21 in line with
a stronger price environment, such as: (i) pelletizing plant’ leasing costs, which are adjusted
based on pellet prices; (ii) iron ore royalties; (iii) third parties’ product purchased; and (iv)
provision for profit sharing to Vale employees. However, Vale was able to capture the benefits
of the higher iron ore prices, with a much higher impact on revenues, which increased by US$
2.943 billion.
EBITDA variation 2017 vs. 2016 – Ferrous Minerals business segment
Ferrous Minerals EBITDA margin22
Adjusted EBITDA per ton for Ferrous Minerals, excluding Manganese and Ferroalloys, was
US$ 37.9/t in 2017, 24.2% higher than the US$ 30.5/t recorded in 2016, mainly as a result of
the abovementioned higher price realization.
21 Total impact of all iron ore price-linked cost factors. 22 Excluding Manganese and Ferroalloys.

33
From 2016 onwards, Vale maintained the same level of EBITDA/t as its Australian peers,
despite the structural freight disadvantage and the bunker oil price evolution in the period. This
was achieved through Vale’s ongoing initiatives in supply chain optimization, dynamic
management of product mix, higher realized prices and not least its cost discipline.
Iron ore fines (excluding Pellets and ROM)
ANNUAL PERFORMANCE
Adjusted EBITDA of iron ore fines was US$ 10.051 billion in 2017, 19.0% higher than in 2016,
despite the negative impacts of exchange rate variations, bunker oil prices and spot freight
rates. The increase was driven by higher market prices, higher premiums and the
abovementioned initiatives of supply discipline, portfolio mix management, global supply chain
management and focus on cost savings.
Costs for iron ore fines increased US$ 928 million when compared to 201623, mainly due to
higher freight costs (US$ 642 million) and the negative effect of the above mentioned procyclical
iron ore price-linked cost factors (US$ 283 million).
Unit maritime freight cost per iron ore metric ton was US$ 15.4/t in 2017, US$ 3.2/t higher than
in 2016, mainly due to the impact of higher freight spot prices (US$ 1.2/t), and higher bunker
23 After adjusting for the effects of higher sales volumes (US$ 70 million) and the negative impact of exchange rate variations
(US$ 330 million). Excluding depreciation.

34
oil prices (US$ 1.9/t). The average bunker oil price in Vale’s freight portfolio increased 45%
from US$ 219/t in 2016 to US$ 318/t in 2017.
C1 cash cost FOB port per metric ton for iron ore fines ex-royalties totaled US$ 14.8/t,
increasing US$ 1.5/t vs. 2016, mainly as a result of the negative impacts of: (i) the 8.4% BRL
appreciation against the USD (US$ 1.1/t); (ii) procyclical iron ore price-linked cost factors (US$
0.6/t); and (iii) inflation (US$ 0.4/t). These were partially offset by the S11D ramp-up (US$ 0.4/t)
and the lower share of the Southern System and third party purchases in total sales (US$ 0.4/t).
Iron ore fines C1 cash cost variation 2017 vs. 2016
Sales volumes of iron ore fines reached 288.7 Mt in 2017, in line with 2016, mainly due to the
S11D ramp-up, the curtailment of high silica products in the Southern and Southeastern
Systems and build-up of offshore inventories.
Vale’s CFR/FOB wmt price for iron ore fines (ex-ROM) of US$ 64.2/t in 2017 increased by US$
9.8/t when compared to 2016, while the average Platts IODEX increased US$ 12.9/t in the
same period. The difference of US$ 3.1/t was mainly due to the negative impacts of pricing
systems mechanisms (US$ 4.2/t) and moisture adjustment (US$ 0.8/t) which was partially offset
by the following positive impacts: (i) premium/discounts and commercial conditions (US$ 1.3/t);
(ii) quality (US$ 0.4/t); and (iii) adjustment of FOB sales (US$ 0.2/t).

35
Reconciliation of Vale’s Price Realization 2017 vs. 2016
The US$ 4.2/t decrease linked to the Pricing Systems was mainly due to the provisional pricing
mechanism. The sharp increase in prices in 4Q16 drove up provisional prices set in 4Q16,
impacting significantly Vale’s average realized price in 2016, whereas this trend was not
observed in 2017, as the provisional prices set in 4Q17 were in line with the yearly Platts IODEX
for 2017.
The US$ 0.2/t increase in the adjustment of FOB sales was due to renegotiations of freight
reference for the FOB sales (US$ 0.9/t), which was partially offset by the increase in bunker oil
prices (US$ 0.7/t).
The US$ 0.8/t decrease related to moisture was a result of the increase in Platts IODEX, as the
moisture content remained at around 8%.
QUARTERLY PERFORMANCE
EBITDA
Adjusted EBITDA of iron ore fines was US$ 2.567 billion in 4Q17, 11.1% lower than in 3Q17,
mainly as a result of lower realized prices (US$ 324 million), impacted by the 7.5% reduction of
the Platts IODEX and by lower market premiums. Slightly higher costs and expenses24 were
partially offset by higher volumes.
SALES REVENUES AND VOLUME
Net sales revenues of iron ore fines, excluding pellets and Run of Mine (ROM), decreased to
US$ 5.023 billion in 4Q17 vs. US$ 5.131 billion in 3Q17, as a result of lower iron ore fines
realized prices (US$ 324 million) which were partially offset by higher sales volumes (US$ 216
million).
Sales volumes of iron ore fines reached 79.6 Mt in 4Q17 vs. 76.4 Mt in 3Q17, 4.2% higher than
in 3Q17, mainly due to the S11D ramp-up. In 4Q17, some sales were deliberately postponed
to 1Q18 for margin optimization.
24 After adjusting for the effects of exchange rate variations.
US$ / t 2017 (A) 2016 (B) (A) – (B)
Average Platts (dmt) 71.3 58.4 12.9
Quality 1.8 1.4 0.4
Premium/Discounts and commercial conditions 1.6 0.3 1.3
Pricing Systems (1,1) 3.1 (4.2)
Adjustment for FOB sales (3.6) (3.8) 0.2
Moisture (5.8) (5.0) (0.8)
Vale CFR/FOB Price (wmt) 64.2 54.4 9.8

36
CFR sales of iron ore fines totaled 55.6 Mt in 4Q17, representing 70% of all iron ore fines sales
volumes in 4Q17, remaining in line with the share of CFR sales in 3Q17.
Sales composition
Net operating revenue by product US$ million 4Q17 3Q17 4Q16 2017 2016
Iron ore fines 5,023 5,131 5,576 18,524 15,783
ROM 8 7 28 38 41
Pellets 1,422 1,441 1,216 5,653 3,828
Manganese & Ferroalloys 135 131 117 469 301
Others 110 110 110 445 397
Total 6,698 6,820 7,047 25,129 20,351
Volume sold ‘000 metric tons 4Q17 3Q17 4Q16 2017 2016
Iron ore fines 79,603 76,388 80,287 288,692 289,940
ROM 355 406 2,220 2,637 3,496
Pellets 13,579 13,135 13,190 51,775 47,709
Manganese ore 740 498 534 1,826 1,851
Ferroalloys 34 32 35 132 127

37
REALIZED PRICES
Pricing system breakdown
Price realization – iron ore fines
Vale’s CFR dmt reference price for iron ore fines (ex-ROM) was US$ 72.6/t, US$ 7.0/t higher
than the IODEX, but US$ 3.5/t lower than the US$ 76.1/t in 3Q17, mainly as a result of: (i) the
decrease in the IODEX (US$ 5.3/t) and (ii) lower premiums (US$ 2.0/t25), which were partially
offset by an increase in quality (US$ 0.3/t) and the positive pricing system adjustments (US$
3.1/t).
25 Difference between the US$ 3.9/t recorded in 3Q17 and the US$ 1.9/t recorded in 4Q17.

38
Vale’s CFR/FOB wmt price for iron ore fines (ex-ROM) decreased only 6.1% (US$ 4.1/t), after
adjusting for moisture and the effect of FOB sales, which accounted for 30% of total sales
volumes in 4Q17, while the IODEX reduced 7.5% (US$ 5.3/t), from US$ 67.2/t in 3Q17 to US$
63.1/t in 4Q17.
The ‘Premiums/Discounts and commercial conditions’ decreased by US$ 2.0/t, from US$ 3.9/t
in 3Q17 to US$ 1.9/t in 4Q17, mainly as a result of the decrease in the 65% Fe IOCJ premiums.
Price realization in 4Q17 was impacted by:
• Provisional prices set at the end of 3Q17 at US$ 62.7/t, which were later adjusted based
on the price of delivery in 4Q17, and negatively impacted prices in 4Q17 by US$ 0.5/t
compared to a positive impact of US$ 2.7/t in 3Q17 as a result of lower realized prices
of the indexes in 4Q17 compared to the indexes anticipated in the forward curve and
provisioned in 3Q17.
• Provisional prices set at the end of 4Q17 at US$ 72.8/t vs. the IODEX average of US$
65.6/t in 4Q17, which positively impacted prices in 4Q17 by US$ 2.4/t compared to a
negative impact of US$ 3.2/t in 3Q17.
• Quarter-lagged contracts, priced at US$ 66.6/t based on the average prices for Jun-
Jul-Aug, which positively impacted prices in 4Q17 by US$ 0.2/t compared to a positive
impact of US$ 0.3/t in 3Q17.
Iron ore sales of 32.3 Mt, or 40% of Vale’s sales mix, were recorded under the provisional
pricing system, which was set at the end of 4Q17 at US$ 72.8/t. The final prices of these sales
and the required adjustment to sales revenues will be determined and recorded in 1Q18.
Average prices US$/ metric ton 4Q17 3Q17 4Q16 2017 2016
Iron ore - Metal Bulletin 65% index 84.70 91.20 82.60 88.00 64.95
Iron ore - Platts' 62% IODEX 65.57 70.90 70.76 71.30 58.45
Iron ore fines CFR reference price (dmt) 72.60 76.10 79.10 88.00 62.34
Iron ore fines CFR/FOB realized price 63.10 67.17 69.40 64.17 54.44
ROM 22.55 17.24 12.61 14.41 11.73
Pellets CFR/FOB (wmt) 104.71 109.71 92.27 109.18 80.26
Manganese ore 119.34 175.81 162.92 159.01 110.87
Ferroalloys 1,361.31 1,380.30 857.14 1,353.72 757.67
COSTS
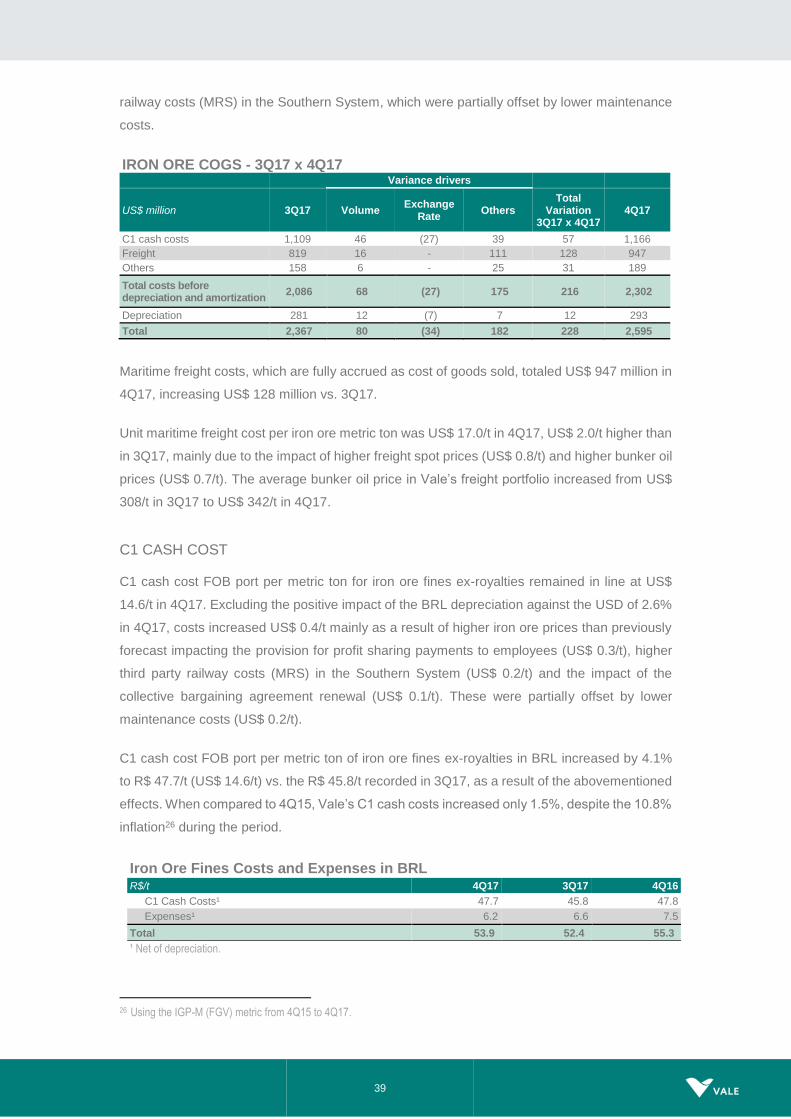
Costs for iron ore fines amounted to US$ 2.302 billion (or US$ 2.595 billion with depreciation
charges) in 4Q17. Costs increased by US$ 175 million when compared to 3Q17, after adjusting
for the effects of higher sales volumes (US$ 68 million) and the positive impact of exchange
rate variations (US$ 27 million). This increase was mainly due to higher than forecast iron ore
prices impacting the provision for profit sharing payments to employees and higher third party
39
railway costs (MRS) in the Southern System, which were partially offset by lower maintenance
costs.
IRON ORE COGS - 3Q17 x 4Q17 Variance drivers
US$ million 3Q17 Volume Exchange
Rate Others
Total Variation
3Q17 x 4Q17 4Q17
C1 cash costs 1,109 46 (27) 39 57 1,166
Freight 819 16 - 111 128 947
Others 158 6 - 25 31 189
Total costs before depreciation and amortization
2,086 68 (27) 175 216 2,302
Depreciation 281 12 (7) 7 12 293
Total 2,367 80 (34) 182 228 2,595
Maritime freight costs, which are fully accrued as cost of goods sold, totaled US$ 947 million in
4Q17, increasing US$ 128 million vs. 3Q17.
Unit maritime freight cost per iron ore metric ton was US$ 17.0/t in 4Q17, US$ 2.0/t higher than
in 3Q17, mainly due to the impact of higher freight spot prices (US$ 0.8/t) and higher bunker oil
prices (US$ 0.7/t). The average bunker oil price in Vale’s freight portfolio increased from US$
308/t in 3Q17 to US$ 342/t in 4Q17.
C1 CASH COST
C1 cash cost FOB port per metric ton for iron ore fines ex-royalties remained in line at US$
14.6/t in 4Q17. Excluding the positive impact of the BRL depreciation against the USD of 2.6%
in 4Q17, costs increased US$ 0.4/t mainly as a result of higher iron ore prices than previously
forecast impacting the provision for profit sharing payments to employees (US$ 0.3/t), higher
third party railway costs (MRS) in the Southern System (US$ 0.2/t) and the impact of the
collective bargaining agreement renewal (US$ 0.1/t). These were partially offset by lower
maintenance costs (US$ 0.2/t).
C1 cash cost FOB port per metric ton of iron ore fines ex-royalties in BRL increased by 4.1%
to R$ 47.7/t (US$ 14.6/t) vs. the R$ 45.8/t recorded in 3Q17, as a result of the abovementioned
effects. When compared to 4Q15, Vale’s C1 cash costs increased only 1.5%, despite the 10.8%
inflation26 during the period.
Iron Ore Fines Costs and Expenses in BRL R$/t 4Q17 3Q17 4Q16
C1 Cash Costs¹ 47.7 45.8 47.8
Expenses¹ 6.2 6.6 7.5
Total 53.9 52.4 55.3
¹ Net of depreciation.
26 Using the IGP-M (FGV) metric from 4Q15 to 4Q17.

40
Evolution of C1 Cash Cost¹ per ton in BRL
Iron ore fines cash cost and freight 4Q17 3Q17 4Q16 2017 2016
Costs (US$ million)
COGS, less depreciation and amortization 2,301 2,086 2,013 7,949 6,622
Distribution costs 54 51 25 163 95
Maritime freight costs 947 819 725 3,064 2,332
FOB at port costs (ex-ROM) 1,300 1,216 1,263 4,722 4,195
FOB at port costs (ex-ROM and ex-royalties) 1,166 1,109 1,159 4,263 3,856
Sales volumes (Mt)
Total iron ore volume sold 80.0 76.8 82.5 291.3 293.4
Total ROM volume sold 0.4 0.4 2.2 2.6 3.5
Volume sold (ex-ROM) 79.6 76.4 80.3 288.7 289.9
Vale's iron ore cash cost (ex-ROM, ex-royalties), FOB (US$ /t) 14.6 14.5 14.4 14.8 13.3
Freight
Maritime freight costs 947 819 725 3,064 2,332
% of CFR sales 70% 71% 69% 69% 66%
Volume CFR (Mt) 55.6 54.5 55.1 199.3 191.9
Vale's iron ore unit freight cost (US$/t) 17.0 15.0 13.2 15.4 12.2
EXPENSES
Iron ore expenses, net of depreciation, amounted to US$ 183 million in 4Q17, 15.8% higher
than in 3Q17. SG&A and other expenses totaled US$ 103 million in 4Q17, increasing US$ 14
million vs. 3Q17, mainly due to higher iron ore prices than previously forecast impacting the
provision for profit sharing payments to employees, the impact of the collective bargaining
agreement renewal and higher service expenses. R&D amounted to US$ 27 million, 22.7%
higher than in 3Q17, mainly due to the usual seasonality of disbursements. Pre-operating and
stoppage expenses, net of depreciation, amounted to US$ 53 million, increasing US$ 6 million
vs. 3Q17, mainly as a result of higher S11D pre-operating expenses.

41
Evolution of iron ore fines cash cost, freight and expenses
Evolution of iron ore fines sustaining per ton

42
Iron ore pellets
ANNUAL PERFORMANCE
EBITDA
Adjusted EBITDA for pellets was US$ 2.767 billion in 2017, representing 18% of Vale’s total
Adjusted EBITDA. The 52.0% increase vs. 2016 was mainly due to higher prices and premiums
(US$ 1.496 billion) and higher sales volumes (US$ 149 million), which were partially offset by
higher costs27 (US$ 583 million).
The average pellet premium increased from US$ 34/t in 2016 to US$ 46/t in 2017 and will
further increase in 2018 as the premiums for all contracts were settled at a premium average
of US$ 60/t due to the strong market demand.
Costs for pellets totaled US$ 2.876 billion (or US$ 3.247 billion with depreciation charges) in
2017. Costs increased by US$ 583 million excluding the effects of higher sales volumes (US$
181 million) and exchange rate variations (US$ 110 million), mainly due to the procyclical effect
of higher prices impacting leasing costs from the pelletizing plants (US$ 374 million) and higher
maintenance costs (US$ 63 million).
QUARTERLY PERFORMANCE
Adjusted EBITDA for pellets in 4Q17 was US$ 657 million, 3.2% lower than the US$ 679 million
recorded in 3Q17. The decrease of US$ 22 million was mainly a result of lower sales prices
(US$ 68 million) and higher costs27 (US$ 28 million), which were partially offset by higher
dividends received28 in 4Q17 (US$ 44 million) and higher sales volumes (US$ 20 million).
Net sales revenues for pellets amounted to US$ 1.422 billion in 4Q17, decreasing US$ 19
million from the US$ 1.441 billion recorded in 3Q17 as a result of lower realized prices (US$ 68
million), which decreased from an average CFR/FOB of US$ 109.7/t in 3Q17 to US$ 104.7/t in
4Q17. This decrease was mainly due to the US$ 5.3/t decrease in the Platts IODEX, but was
partially offset by higher sales volumes (US$ 49 million). Sales volumes increased from 13.1
Mt in 3Q17 to 13.6 Mt in 4Q17.
CFR pellet sales of 3.2 Mt in 4Q17 represented 24% of total pellet sales, slightly higher than
the 22% in 3Q17. FOB pellet sales amounted to 10.3 Mt in 4Q17, in line with the 10.2 Mt
recorded in 3Q17.
Pellet costs totaled US$ 779 million (or US$ 876 million with depreciation charges) in 4Q17.
After adjusting for the effects of higher volumes (US$ 29 million) and exchange rate variations
(US$ 11 million), costs increased by US$ 28 million vs. 3Q17, mainly due to higher leasing
27 After adjusting for the effects of higher volumes and exchange rate variations. 28 Dividends from leased pelletizing plants, which are usually paid every 6 months (in 2Q and 4Q).

43
costs. The reason for increased leasing costs was higher profits impacting the pre-determined
formula of the leasing contracts.
Pre-operating and stoppage expenses for pellets were US$ 2 million in 4Q17, in line with 3Q17.
SG&A and other expenses totaled US$ 22 million in 4Q17, in line with 3Q17.
EBITDA unit margin for pellets was US$ 48.4/t in 4Q17, 6.4% lower than in 3Q17.
Pellets - EBITDA
4Q17 3Q17
US$
million US$/wmt
US$ million
US$/wmt
Net Revenues / Realized Price 1,422 104.7 1,441 109.7
Dividends Received (Leased pelletizing plants) 44 3.2 0 0.0
Cash Costs (Iron ore, leasing, freight, overhead, energy and other) (779) (57.4) (733) (55.8)
Expenses (SG&A, R&D and other) (30) (2.2) (29) (2.2)
EBITDA 657 48.4 679 51.7
Iron ore fines and pellets cash break-even
Quarterly iron ore fines and pellets EBITDA break-even, measured by unit cash costs and
expenses on a landed-in-China basis (and adjusted for quality, pellets margins differential and
moisture, excluding ROM), increased US$ 3.9/t when compared to 3Q17, totaling US$ 33.9/dmt
in 4Q17, mainly as a result of the abovementioned higher freight costs and lower premiums.
Quarterly iron ore and pellets cash break-even on a landed-in-China basis, including sustaining
capex per ton of US$ 3.4/dmt, increased from US$ 32.9/dmt in 3Q17 to US$ 37.3/dmt in 4Q17.
Iron ore and pellets cash break-even landed in China¹ US$/t 4Q17 3Q17 4Q16 2017 2016
Vale's iron ore cash cost (ex-ROM, ex-royalties), FOB (US$ /t) 14.6 14.5 14.4 14.8 13.3
Iron ore fines freight cost (ex-bunker oil hedge) 17.0 15.0 13.2 15.4 12.2
Iron ore fines distribution cost² 0.7 0.7 0.3 0.6 0.3
Iron ore fines expenses³ & royalties 3.6 3.5 3.5 3.4 3.6
Iron ore fines moisture adjustment 3.1 2.9 2.7 3.0 2.6
Iron ore fines quality adjustment (3.9) (5.6) (2.1) (3.4) (1.7)
Iron ore fines EBITDA break-even (US$/dmt) 35.2 31.0 31.9 33.8 30.4
Iron ore fines pellet adjustment (1.3) (1.0) (1.5) (1.5) (1.5)
Iron ore fines and pellets EBITDA break-even (US$/dmt) 33.9 30.0 30.4 32.2 28.8
Iron ore fines sustaining investments 3.4 2.9 3.2 3.2 2.6
Iron ore fines and pellets cash break-even landed in China (US$/dmt) 37.3 32.9 33.6 35.5 31.4
¹ Measured by unit cost + expenses + sustaining investment adjusted for quality. ² Distribution cost per ton calculation method has been revised and adjusted retroactively, now dividing by total sales volume instead of CFR sales volume. ³ Net of depreciation and includes dividends received.
44
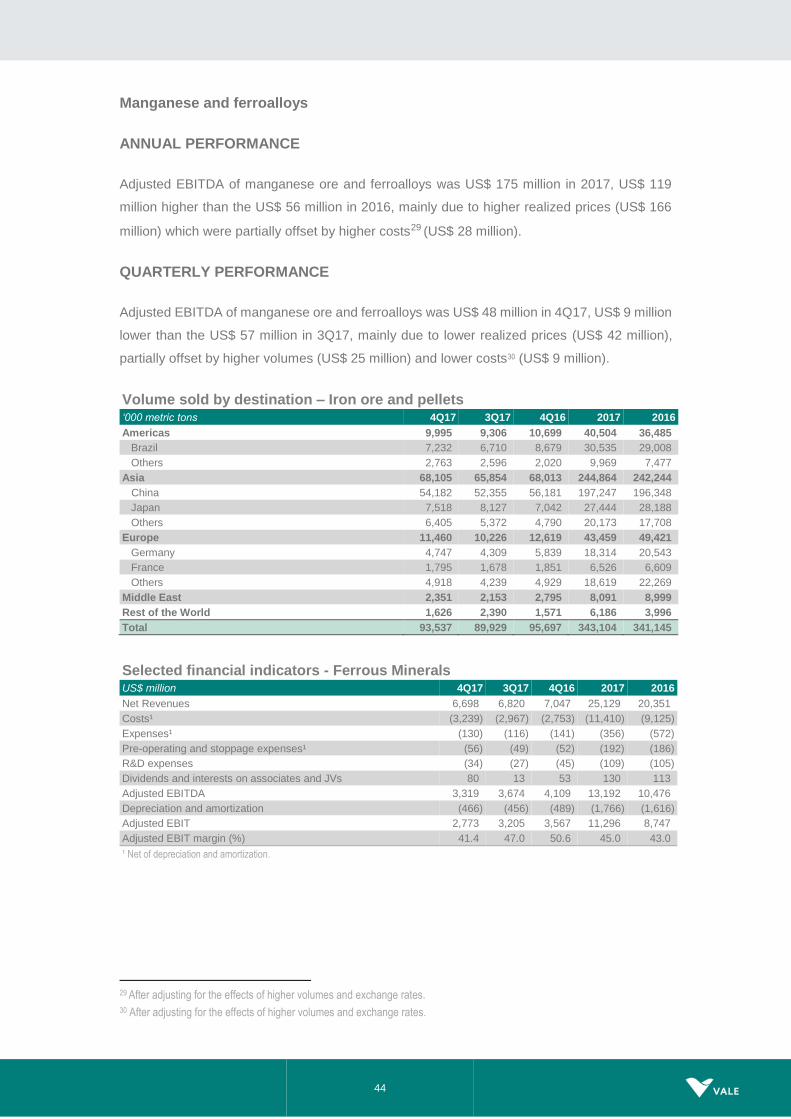
Manganese and ferroalloys
ANNUAL PERFORMANCE
Adjusted EBITDA of manganese ore and ferroalloys was US$ 175 million in 2017, US$ 119
million higher than the US$ 56 million in 2016, mainly due to higher realized prices (US$ 166
million) which were partially offset by higher costs29 (US$ 28 million).
QUARTERLY PERFORMANCE
Adjusted EBITDA of manganese ore and ferroalloys was US$ 48 million in 4Q17, US$ 9 million
lower than the US$ 57 million in 3Q17, mainly due to lower realized prices (US$ 42 million),
partially offset by higher volumes (US$ 25 million) and lower costs30 (US$ 9 million).
Volume sold by destination – Iron ore and pellets ‘000 metric tons 4Q17 3Q17 4Q16 2017 2016
Americas 9,995 9,306 10,699 40,504 36,485
Brazil 7,232 6,710 8,679 30,535 29,008
Others 2,763 2,596 2,020 9,969 7,477
Asia 68,105 65,854 68,013 244,864 242,244
China 54,182 52,355 56,181 197,247 196,348
Japan 7,518 8,127 7,042 27,444 28,188
Others 6,405 5,372 4,790 20,173 17,708
Europe 11,460 10,226 12,619 43,459 49,421
Germany 4,747 4,309 5,839 18,314 20,543
France 1,795 1,678 1,851 6,526 6,609
Others 4,918 4,239 4,929 18,619 22,269
Middle East 2,351 2,153 2,795 8,091 8,999
Rest of the World 1,626 2,390 1,571 6,186 3,996
Total 93,537 89,929 95,697 343,104 341,145
Selected financial indicators - Ferrous Minerals US$ million 4Q17 3Q17 4Q16 2017 2016
Net Revenues 6,698 6,820 7,047 25,129 20,351
Costs¹ (3,239) (2,967) (2,753) (11,410) (9,125)
Expenses¹ (130) (116) (141) (356) (572)
Pre-operating and stoppage expenses¹ (56) (49) (52) (192) (186)
R&D expenses (34) (27) (45) (109) (105)
Dividends and interests on associates and JVs 80 13 53 130 113
Adjusted EBITDA 3,319 3,674 4,109 13,192 10,476
Depreciation and amortization (466) (456) (489) (1,766) (1,616)
Adjusted EBIT 2,773 3,205 3,567 11,296 8,747
Adjusted EBIT margin (%) 41.4 47.0 50.6 45.0 43.0
¹ Net of depreciation and amortization.
29 After adjusting for the effects of higher volumes and exchange rates.
30 After adjusting for the effects of higher volumes and exchange rates.
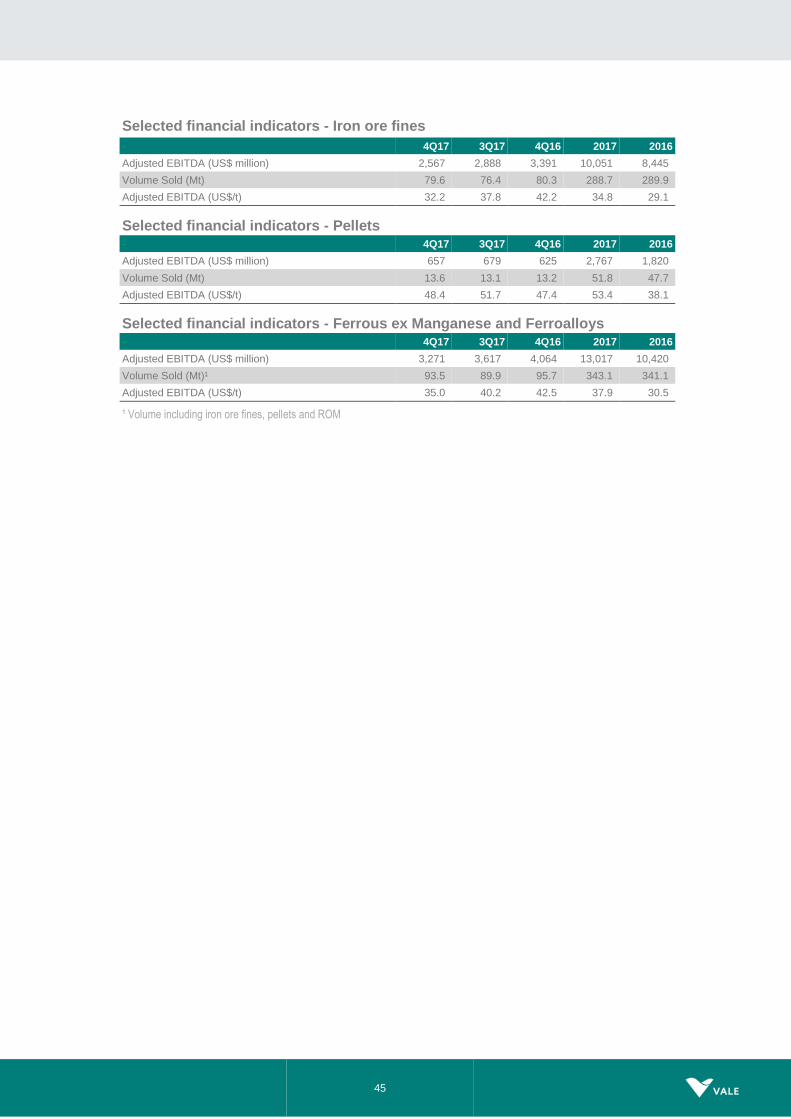
45
Selected financial indicators - Iron ore fines
- 4Q17 3Q17 4Q16 2017 2016
Adjusted EBITDA (US$ million) 2,567 2,888 3,391 10,051 8,445
Volume Sold (Mt) 79.6 76.4 80.3 288.7 289.9
Adjusted EBITDA (US$/t) 32.2 37.8 42.2 34.8 29.1
Selected financial indicators - Pellets - 4Q17 3Q17 4Q16 2017 2016
Adjusted EBITDA (US$ million) 657 679 625 2,767 1,820
Volume Sold (Mt) 13.6 13.1 13.2 51.8 47.7
Adjusted EBITDA (US$/t) 48.4 51.7 47.4 53.4 38.1
Selected financial indicators - Ferrous ex Manganese and Ferroalloys - 4Q17 3Q17 4Q16 2017 2016
Adjusted EBITDA (US$ million) 3,271 3,617 4,064 13,017 10,420
Volume Sold (Mt)¹ 93.5 89.9 95.7 343.1 341.1
Adjusted EBITDA (US$/t) 35.0 40.2 42.5 37.9 30.5
¹ Volume including iron ore fines, pellets and ROM

46
Base Metals
Annual performance
Base Metals adjusted EBITDA totaled US$ 2.139 billion in 2017, representing an increase of
US$ 291 million from the US$ 1.848 billion recorded in 2016. The increase was mainly due to
higher copper prices (US$ 642 million), higher nickel prices (US$ 257 million) and higher cobalt
prices (US$ 138 million). These price effects were partially offset by higher costs (US$ 237
million), lower volumes (US$ 203 million), higher expenses (US$ 148 million), and the
unfavorable effect of exchange rate variations (US$ 150 million). 2017 is marked as a year of
transition to a simpler and more efficient nickel flowsheet in the North Atlantic operations. This
transition aims to deliver stronger results from 2018 onwards, as well as lower volumes,
reflecting Vale’s commitment to value over volume in the nickel business.
Quarterly performance
Adjusted EBITDA was US$ 782 million in 4Q17, the highest quarterly level since 1Q11, with an
increase of US$ 221 million vs. 3Q17, mainly as a result of higher nickel and copper realized
prices (US$ 152 million), lower costs31 (US$ 55 million), higher by-product prices (US$ 40
million), higher nickel and copper volumes (US$ 25 million) and favourable exchange rate
variations32 (US$ 16 million), which were partially offset by lower by-product volumes (US$ 50
million) and higher expenses33 (US$ 16 million).
SALES REVENUES AND VOLUMES
Nickel sales revenues were US$ 941 million in 4Q17, increasing US$ 189 million vs. 3Q17 as
a result of higher nickel realized prices in 4Q17 (US$ 94 million) and higher sales volumes (US$
94 million). Sales volumes totaled 80 kt, 9 kt higher than in 3Q17.
Copper sales revenues were US$ 744 million in 4Q17, increasing US$ 61 million vs. 3Q17
mainly as a result of higher copper realized prices in 4Q17 (US$ 58 million). Sales volumes
were 111 kt in 4Q17, in line with 3Q17.
Sales revenues from gold contained as a by-product in nickel and copper concentrates
amounted to US$ 157 million in 4Q17, decreasing by US$ 4 million vs. 3Q17 mainly as a result
of lower volumes which were partially offset by higher gold by-product realized prices in 4Q17.
Sales volumes of gold as a by-product amounted to 108,000 oz in 4Q17, 30,000 oz lower than
in 3Q17.
31 Net of volume effect and exchange rate variations. 32 Exchange rate variations in COGS and expenses. 33 Net of exchange rate variations.
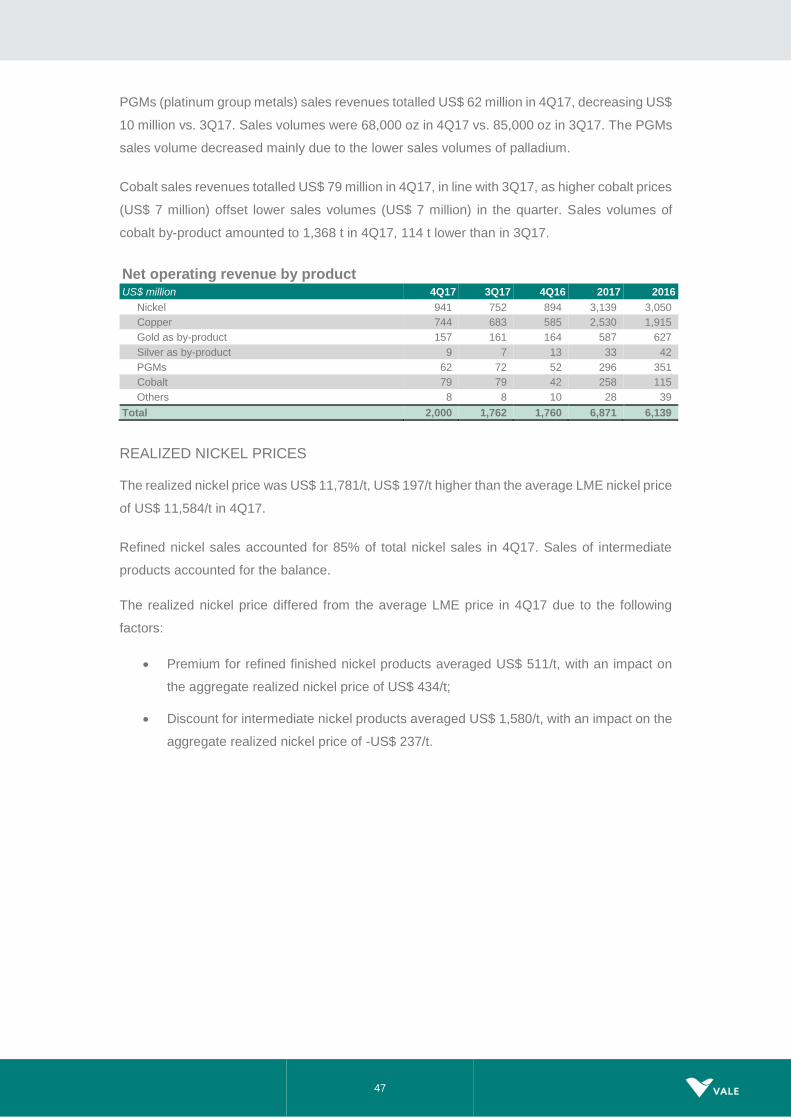
47
PGMs (platinum group metals) sales revenues totalled US$ 62 million in 4Q17, decreasing US$
10 million vs. 3Q17. Sales volumes were 68,000 oz in 4Q17 vs. 85,000 oz in 3Q17. The PGMs
sales volume decreased mainly due to the lower sales volumes of palladium.
Cobalt sales revenues totalled US$ 79 million in 4Q17, in line with 3Q17, as higher cobalt prices
(US$ 7 million) offset lower sales volumes (US$ 7 million) in the quarter. Sales volumes of
cobalt by-product amounted to 1,368 t in 4Q17, 114 t lower than in 3Q17.
Net operating revenue by product US$ million 4Q17 3Q17 4Q16 2017 2016
Nickel 941 752 894 3,139 3,050
Copper 744 683 585 2,530 1,915
Gold as by-product 157 161 164 587 627
Silver as by-product 9 7 13 33 42
PGMs 62 72 52 296 351
Cobalt 79 79 42 258 115
Others 8 8 10 28 39
Total 2,000 1,762 1,760 6,871 6,139
REALIZED NICKEL PRICES
The realized nickel price was US$ 11,781/t, US$ 197/t higher than the average LME nickel price
of US$ 11,584/t in 4Q17.
Refined nickel sales accounted for 85% of total nickel sales in 4Q17. Sales of intermediate
products accounted for the balance.
The realized nickel price differed from the average LME price in 4Q17 due to the following
factors:
• Premium for refined finished nickel products averaged US$ 511/t, with an impact on
the aggregate realized nickel price of US$ 434/t;
• Discount for intermediate nickel products averaged US$ 1,580/t, with an impact on the
aggregate realized nickel price of -US$ 237/t.

48
Price realization – nickel
REALIZED COPPER PRICES
The realized copper price was US$ 6,735/t, US$ 73/t lower than the average LME copper price
of US$ 6,808/t in 4Q17. Vale’s copper products are sold on a provisional pricing basis during
the quarter with final prices determined in a future period, generally one to four months
forward34.
The realized copper price differed from the average LME price in 4Q17 due to the following
factors:
• Current period price adjustments: mark-to-market of invoices still open in the quarter
based on the copper price forward curve35 at the end of the quarter (US$ 236/t);
• Prior period price adjustment: variance between the price used in final invoices (and in
the mark-to-market of invoices from previous quarters still open at the end of the
quarter) and the provisional prices used for sales in previous quarters (US$ 242/t);
• TC/RCs, penalties, premiums and discounts for intermediate products (-US$ 551/t).
34 On Dec 31st, 2017, Vale had provisionally priced copper sales totaling 106,178 tons valued at a LME forward price of US$
7,232/t, subject to final pricing over the following months. 35 Includes a small number of final invoices that were provisionally priced and settled within the quarter.
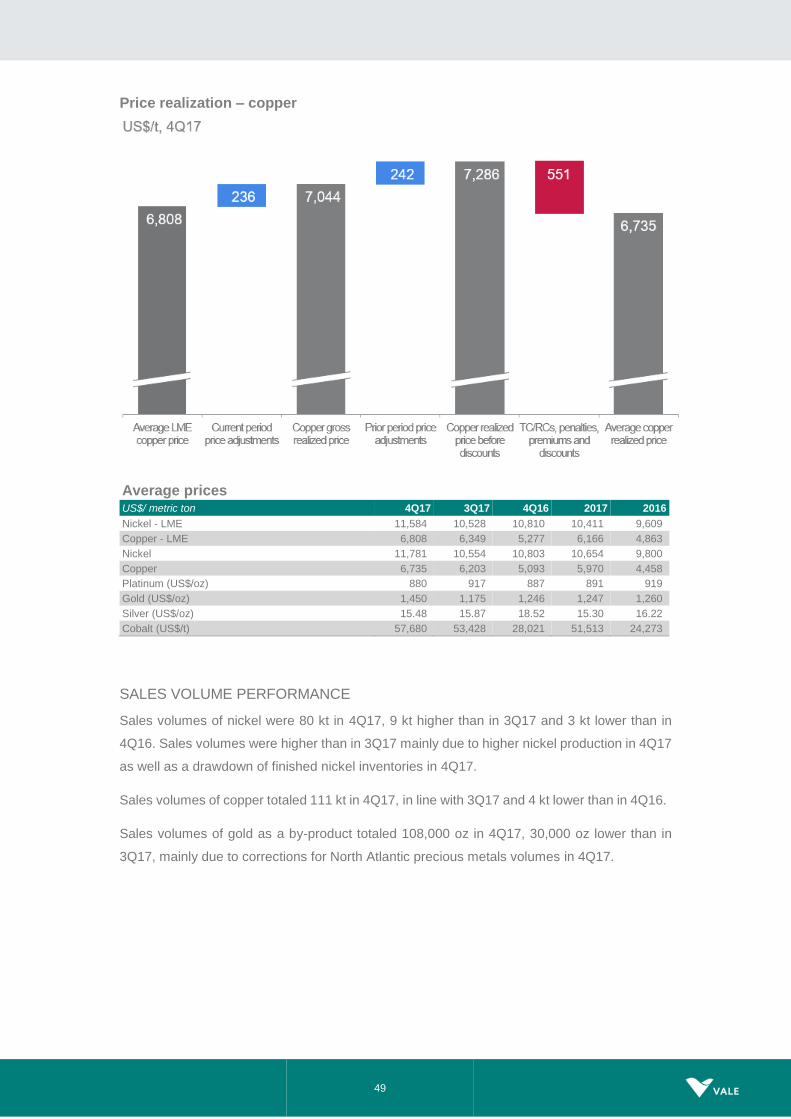
49
Price realization – copper
Average prices US$/ metric ton 4Q17 3Q17 4Q16 2017 2016
Nickel - LME 11,584 10,528 10,810 10,411 9,609
Copper - LME 6,808 6,349 5,277 6,166 4,863
Nickel 11,781 10,554 10,803 10,654 9,800
Copper 6,735 6,203 5,093 5,970 4,458
Platinum (US$/oz) 880 917 887 891 919
Gold (US$/oz) 1,450 1,175 1,246 1,247 1,260
Silver (US$/oz) 15.48 15.87 18.52 15.30 16.22
Cobalt (US$/t) 57,680 53,428 28,021 51,513 24,273
SALES VOLUME PERFORMANCE
Sales volumes of nickel were 80 kt in 4Q17, 9 kt higher than in 3Q17 and 3 kt lower than in
4Q16. Sales volumes were higher than in 3Q17 mainly due to higher nickel production in 4Q17
as well as a drawdown of finished nickel inventories in 4Q17.
Sales volumes of copper totaled 111 kt in 4Q17, in line with 3Q17 and 4 kt lower than in 4Q16.
Sales volumes of gold as a by-product totaled 108,000 oz in 4Q17, 30,000 oz lower than in
3Q17, mainly due to corrections for North Atlantic precious metals volumes in 4Q17.
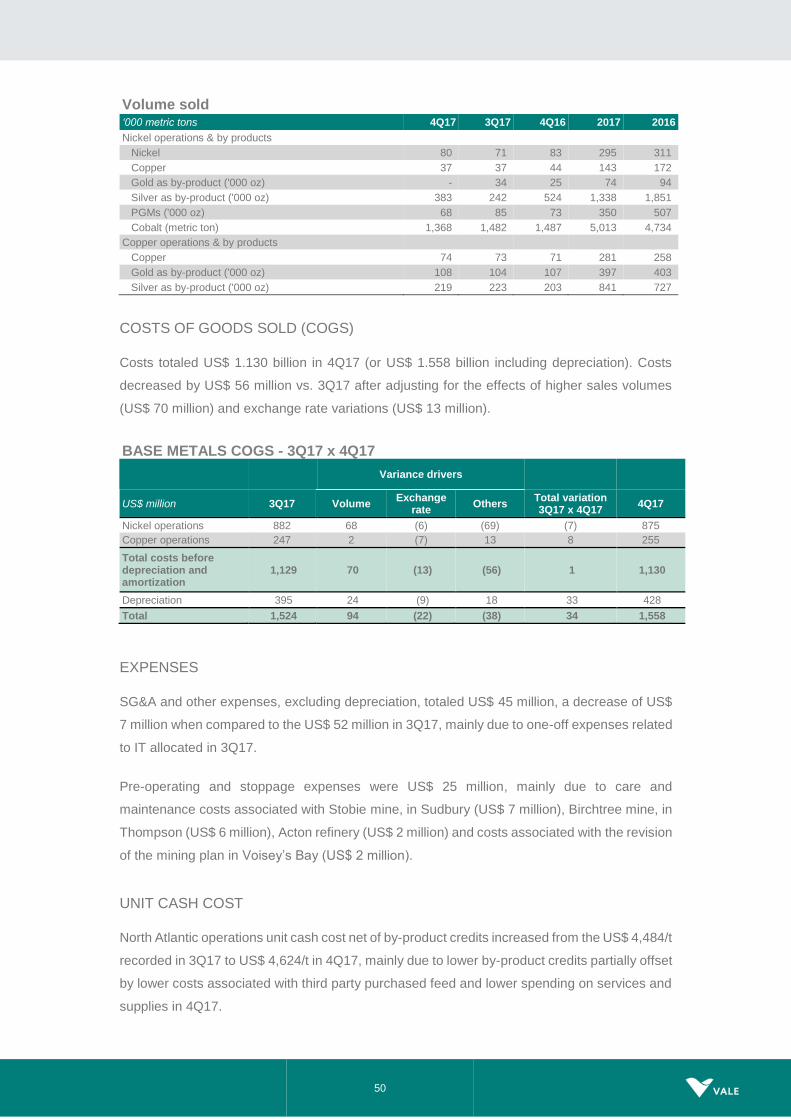
50
Volume sold ‘000 metric tons 4Q17 3Q17 4Q16 2017 2016
Nickel operations & by products
Nickel 80 71 83 295 311
Copper 37 37 44 143 172
Gold as by-product ('000 oz) - 34 25 74 94
Silver as by-product ('000 oz) 383 242 524 1,338 1,851
PGMs ('000 oz) 68 85 73 350 507
Cobalt (metric ton) 1,368 1,482 1,487 5,013 4,734
Copper operations & by products
Copper 74 73 71 281 258
Gold as by-product ('000 oz) 108 104 107 397 403
Silver as by-product ('000 oz) 219 223 203 841 727
COSTS OF GOODS SOLD (COGS)
Costs totaled US$ 1.130 billion in 4Q17 (or US$ 1.558 billion including depreciation). Costs
decreased by US$ 56 million vs. 3Q17 after adjusting for the effects of higher sales volumes
(US$ 70 million) and exchange rate variations (US$ 13 million).
BASE METALS COGS - 3Q17 x 4Q17
Variance drivers
US$ million 3Q17 Volume Exchange
rate Others
Total variation 3Q17 x 4Q17
4Q17
Nickel operations 882 68 (6) (69) (7) 875
Copper operations 247 2 (7) 13 8 255
Total costs before depreciation and amortization
1,129 70 (13) (56) 1 1,130
Depreciation 395 24 (9) 18 33 428
Total 1,524 94 (22) (38) 34 1,558
EXPENSES
SG&A and other expenses, excluding depreciation, totaled US$ 45 million, a decrease of US$
7 million when compared to the US$ 52 million in 3Q17, mainly due to one-off expenses related
to IT allocated in 3Q17.
Pre-operating and stoppage expenses were US$ 25 million, mainly due to care and
maintenance costs associated with Stobie mine, in Sudbury (US$ 7 million), Birchtree mine, in
Thompson (US$ 6 million), Acton refinery (US$ 2 million) and costs associated with the revision
of the mining plan in Voisey’s Bay (US$ 2 million).
UNIT CASH COST
North Atlantic operations unit cash cost net of by-product credits increased from the US$ 4,484/t
recorded in 3Q17 to US$ 4,624/t in 4Q17, mainly due to lower by-product credits partially offset
by lower costs associated with third party purchased feed and lower spending on services and
supplies in 4Q17.

51
PTVI unit cash cost increased from the US$ 5,866/t recorded in 3Q17 to US$ 6,609/t in 4Q17,
mainly due to lower favorable inventory adjustments and higher energy costs.
VNC unit cost net of by-product credits decreased from the US$ 9,841/t recorded in 3Q17 to
US$ 8,420/t in 4Q17, mainly due to the favorable impact of 13% higher production on fixed cost
dilution and lower spending on services and supplies in 4Q17.
Onça Puma unit cash cost decreased from the US$ 7,944/t recorded in 3Q17 to US$ 7,536/t in
4Q17, mainly due to lower costs with maintenance services and supplies as well as the
favourable impact of exchange rate variations.
Sossego unit cost increased from the US$ 2,951/t recorded in 3Q17 to US$ 3,270/t in 4Q17,
mainly due to lower ore grades being processed at the mill and one-off maintenance costs.
Salobo unit costs decreased from the US$ 792/t recorded in 3Q17 to US$ 679/t in 4Q17, mainly
due to higher gold by-product volumes and prices.
Base Metals – unit cash cost of sales per operation, net of by-product credits¹
US$ / t 4Q17 3Q17 4Q164 2017 2016
NICKEL
North Atlantic operations2 4,624 4,484 5,125 5,287 4,489
PTVI2 6,609 5,866 5,770 6,515 5,518
VNC3 8,420 9,841 11,375 10,053 12,458
Onça Puma 7,536 7,944 9,204 8,642 8,319
COPPER
Sossego 3,270 2,951 3,207 2,935 2,866
Salobo 679 792 589 1,009 838 1 North Atlantic figures include Clydach and Acton refining costs. 2 Prior periods restated to include royalties, freight and other period costs. 3 Unit cash cost restated for periods prior to 1Q17 to exclude pre-operating and other operating expenses. 4 We realigned our unit cash cost of sales methodology in 1Q17 to include all freight, royalty and other costs reported as cost of goods sold
and to exclude other operating expenses and pre-operating expenses for certain operations. Considering the previous criteria, the unit cash cost figures would be as follows: North Atlantic, US$ 3,412/t in 4Q16; PTVI, US$ 5,695/t in 4Q16, and; VNC, US$ 11,017/t in 4Q16.
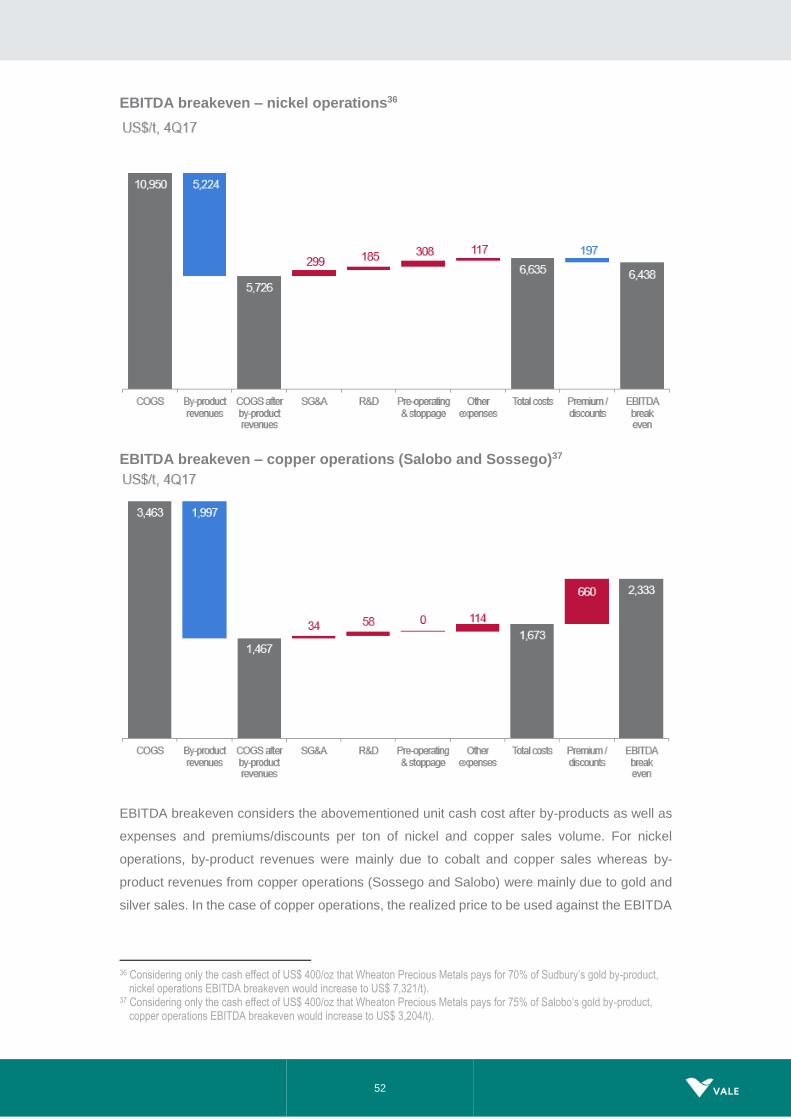
52
EBITDA breakeven – nickel operations36
EBITDA breakeven – copper operations (Salobo and Sossego)37
EBITDA breakeven considers the abovementioned unit cash cost after by-products as well as
expenses and premiums/discounts per ton of nickel and copper sales volume. For nickel
operations, by-product revenues were mainly due to cobalt and copper sales whereas by-
product revenues from copper operations (Sossego and Salobo) were mainly due to gold and
silver sales. In the case of copper operations, the realized price to be used against the EBITDA
36 Considering only the cash effect of US$ 400/oz that Wheaton Precious Metals pays for 70% of Sudbury’s gold by-product,
nickel operations EBITDA breakeven would increase to US$ 7,321/t). 37 Considering only the cash effect of US$ 400/oz that Wheaton Precious Metals pays for 75% of Salobo’s gold by-product,
copper operations EBITDA breakeven would increase to US$ 3,204/t).

53
breakeven should be the copper realized price before discounts (US$ 7,286/t), given that
TC/RCs and other discounts are already part of the EBITDA breakeven build-up.
Performance by operation
The breakdown of the Base Metals EBITDA components per operation is detailed below.
Base Metals EBITDA overview – 4Q17
US$ million North
Atlantic PTVI Site
VNC Site
Onça Puma
Sossego Salobo Others Total Base
Metals
Net Revenues 973 181 133 91 170 472 (20) 2,000
Costs (597) (130) (121) (58) (91) (165) 32 (1,130)
SG&A and others 13 (5) 2 (3) (11) (1) (40) (45)
Pre-operating and stoppage
(20) - - (1) - - (4) (25)
R&D (7) (3) (3) (1) (3) - (1) (18)
EBITDA 362 43 11 28 65 306 (33) 782
Ni deliveries1 (kt) 42 20 10 8 - - - 80
Cu deliveries (kt) 37 - - - 22 51 - 111 1 North Atlantic sales consider sales from these operations as well as inventory eliminations between PTVI/VNC and our refineries, either
in Asia Pacific or North Atlantic operations. Hence, a managerial perspective that separates these effects would lead nickel sales of 47 kt in North Atlantic Operations and -5 kt in Others.
EBITDA
Details of Base Metals’ adjusted EBITDA by operation are as follows:
(i) The North Atlantic operations EBITDA was US$ 362 million, increasing by US$ 125
million vs. 3Q17 mainly due to higher nickel and copper realized prices (US$ 116
million).
(ii) PTVI’s EBITDA was US$ 43 million, increasing by US$ 9 million vs. 3Q17 mainly due
higher realized nickel prices (US$ 29 million) which were partially offset by higher
costs38 (US$ 15 million) and higher expenses (US$ 4 million).
(iii) VNC's EBITDA was US$ 11 million, increasing by US$ 18 million when compared to
3Q17, mainly as a result of lower costs39 (US$ 15 million), driven by dilution of fixed
costs, lower spending on services and supplies and reversals of an inventory and
expense provision (US$ 6 million) and also as a result of higher realized cobalt prices
(US$ 4 million), which were partially offset by lower sales volumes (US$ 6 million).
(iv) Onça Puma’s EBITDA was US$ 28 million, increasing US$ 17 million vs. 3Q17, mainly
as a result of higher realized nickel prices (US$ 11 million) and higher sales volumes
(US$ 3 million).
38 Costs including volume effect. 39 Costs including volume effect.
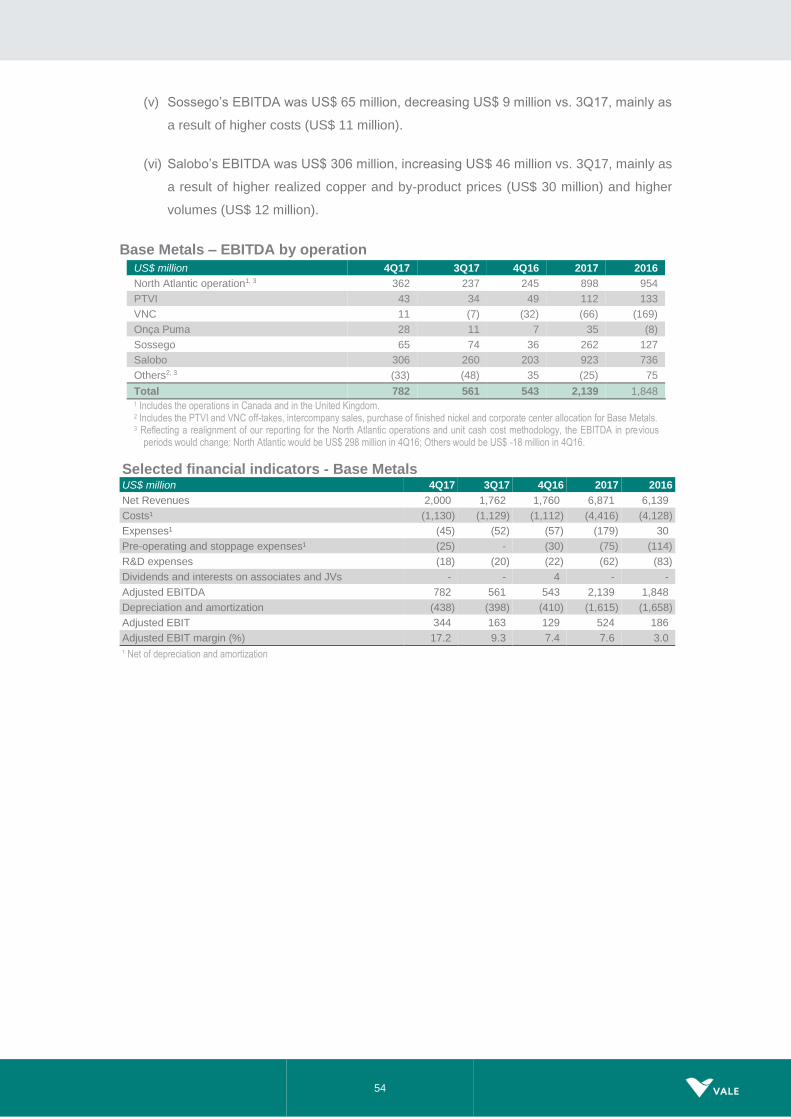
54
(v) Sossego’s EBITDA was US$ 65 million, decreasing US$ 9 million vs. 3Q17, mainly as
a result of higher costs (US$ 11 million).
(vi) Salobo’s EBITDA was US$ 306 million, increasing US$ 46 million vs. 3Q17, mainly as
a result of higher realized copper and by-product prices (US$ 30 million) and higher
volumes (US$ 12 million).
Base Metals – EBITDA by operation
Selected financial indicators - Base Metals US$ million 4Q17 3Q17 4Q16 2017 2016
Net Revenues 2,000 1,762 1,760 6,871 6,139
Costs¹ (1,130) (1,129) (1,112) (4,416) (4,128)
Expenses¹ (45) (52) (57) (179) 30
Pre-operating and stoppage expenses¹ (25) - (30) (75) (114)
R&D expenses (18) (20) (22) (62) (83)
Dividends and interests on associates and JVs - - 4 - -
Adjusted EBITDA 782 561 543 2,139 1,848
Depreciation and amortization (438) (398) (410) (1,615) (1,658)
Adjusted EBIT 344 163 129 524 186
Adjusted EBIT margin (%) 17.2 9.3 7.4 7.6 3.0
¹ Net of depreciation and amortization
US$ million 4Q17 3Q17 4Q16 2017 2016
North Atlantic operation1, 3 362 237 245 898 954
PTVI 43 34 49 112 133
VNC 11 (7) (32) (66) (169)
Onça Puma 28 11 7 35 (8)
Sossego 65 74 36 262 127
Salobo 306 260 203 923 736
Others2, 3 (33) (48) 35 (25) 75
Total 782 561 543 2,139 1,848 1 Includes the operations in Canada and in the United Kingdom. 2 Includes the PTVI and VNC off-takes, intercompany sales, purchase of finished nickel and corporate center allocation for Base Metals. 3 Reflecting a realignment of our reporting for the North Atlantic operations and unit cash cost methodology, the EBITDA in previous
periods would change: North Atlantic would be US$ 298 million in 4Q16; Others would be US$ -18 million in 4Q16.

55
Coal
Annual performance
Adjusted EBITDA for the coal shipped through Nacala port reached US$ 410 million, driving
the improvement of the Coal business adjusted EBITDA to US$ 330 million in 2017, the first
annual positive result since 2010. The increase of US$ 384 million in comparison to the negative
US$ 54 million recorded in 2016 was mainly due to higher realized prices (US$ 386 million) and
higher sales volumes from Mozambique (US$ 129 million). These higher prices and sales
volumes were partially offset by the higher costs and expenses40 (US$ 73 million), due to the
impact of the logistics tariff applied after the deconsolidation of the Nacala Logistic Corridor,
and by lower EBITDA from Australia (US$ 57 million), where operations were discontinued with
the sale of Carborough Downs in November 2016.
Quarterly performance
EBITDA
Adjusted Coal business EBITDA in 4Q17 was US$ 66 million, with coal shipped through Nacala
port representing US$ 84 million. The business result was US$ 20 million higher than the US$
46 million recorded in 3Q17, mainly due to higher realized prices (US$ 68 million) which were
partially offset by higher costs and expenses40 (US$ 46 million).
SALES REVENUES AND VOLUMES
Coal business net sales revenues increased to US$ 402 million in 4Q17 from US$ 360 million
in 3Q17, as a result of higher prices (US$ 68 million) that were partially offset by lower sales
volumes (US$ 26 million).
Sales volumes of metallurgical coal in 4Q17 totaled 1.715 Mt while sales volumes of thermal
coal totaled 1.228 Mt, 8% and 4% lower than in 3Q17 respectively. An already addressed failure
of one of the hydraulic excavators affected production volumes and consequently sales
volumes.
METALLURGICAL COAL
In 4Q17, 77% of the metallurgical coal sales were priced based on a market index, including
index lagged prices, 19 % were sold based on fixed prices (spot shipments and trial cargos)
and 4 % were linked to the quarterly index benchmark.
40 Net of provision for Nacala Logistics Corridor’s debt service to Vale.

56
Metallurgical coal prices US$/ metric ton 4Q17 3Q17 4Q16
Premium Low Vol HCC index price 1 204.7 188.8 168.2
HCC benchmark price 192.2 170.3 200
Vale’s metallurgical coal realized price 178.5 141.8 165.2
¹Platts Premium Low Vol Hard Coking Coal FOB Australia.
The metallurgical coal realized price increased US$ 36.6/t in the quarter while the seaborne
index price increased US$ 15.9/t in the same period. The better price realization was mainly
due to a higher exposure to current and lagged index linked contracts and to lower penalties
and commercial discounts compared to 3Q17. Lower production and sales volumes,
concentrated at the end of the quarter, coincided with the higher index price period, partially
offsetting the gains obtained.
Price realization – metallurgical coal from Mozambique
US$/t 4Q17
THERMAL COAL
In 4Q17, 86% of thermal coal sales were priced based on index prices with the remaining 14%
based on fixed prices.
The realized price of thermal coal was US$ 78.6/t in 4Q17, 6.4% higher than in 3Q17, and in
line with the increase of the index in the period.
Price realization for thermal coal compared to the index was mainly impacted by the quality
adjustment against the reference index, given our lower calorific values and higher ash levels,
which negatively affected prices by US$ 14.1/t.

57
Price realization – thermal coal from Mozambique
US$/t, 4Q17
COSTS AND EXPENSES
Pro forma Coal business costs and expenses41 totaled US$ 336 million in 4Q17 (or US$ 398
million with depreciation charges), increasing US$ 22 million against the US$ 314 million
recorded in 3Q17, mainly as a result of lower dilution of mine and logistics fixed costs (US$ 29
million) and a higher logistics tariffs42 (US$ 10 million), which were partly offset by the impact
of lower volumes (US$ 24 million).
Pro forma unitary cash cost through Nacala was US$ 104.4/t in 4Q17, US$ 10.6/t higher than
in 3Q17 due to the impact of higher operational costs (US$ 21.3/t) and higher tariffs charged
by NLC in 4Q17 (US$ 4.6/t). These were partially offset by the higher provision for NLC’s debt
service to Vale (US$ 15.4/t). Operational costs43 increased mainly due to: (i) lower dilution of
fixed costs, as a result of the hydraulic excavator failure, which impacted production in 4Q17,
(ii) and higher services costs to prepare the Nacala railway for the wet season, while NLC debt
service to Vale was higher as result of the retroactive charge in 4Q17 to adjust the tariff in
accordance with the Project Finance.
Cash cost through Nacala US$ / metric ton 4Q17 3Q17 4Q16
Operational cost (A) 92.6 71.3 97.8
NLC tariff (B) 52.0 47.4 -
NLC’s debt service to Vale (C) 40.2 24.8 -
Pro forma production cost (A + B – C) 104.4 93.8 97.8
41 Includes mine, plant, railway, port and royalties costs, excluding inventory movement, and expenses, net of provision for
Nacala Logistics Corridor’s debt service to Vale. 42 Net of provision for Nacala Logistics Corridor’s debt service to Vale. 43 Includes mine, plant, railway, port operational costs, excluding royalties and inventory movement per ton of coal sold.

58
Pro forma production costs through the Nacala Logistics Corridor
US$/t
Net operating revenue by product US$ million 4Q17 3Q17 4Q16 2017 2016
Metallurgical coal 306 266 300 1,240 587
Thermal coal 96 94 76 327 252
Total 402 360 376 1,567 839
Average prices US$/ metric ton 4Q17 3Q17 4Q16 2017 2016
Metallurgical coal 178.4 141.8 217.0 172.7 119.5
Thermal coal 78.6 73.8 67.7 71.0 46.2
Volume sold ‘000 metric tons 4Q17 3Q17 4Q16 2017 2016
Metallurgical coal 1,715 1,869 1,382 7,178 4,907
Thermal coal 1,228 1,279 1,121 4,602 5,457
Total 2,943 3,148 2,503 11,780 10,365
Selected financial indicators - Coal US$ million 4Q17 3Q17 4Q16 2017 2016
Net Revenues 402 360 376 1,567 839
Costs¹ (433) (368) (185) (1,354) (872)
Expenses¹ (12) (9) (10) (44) 35
Pre-operating and stoppage expenses¹ - - (18) (4) (41)
R&D expenses (3) (4) (7) (14) (15)
Dividends and interests on associates and JVs 112 67 - 179 -
Adjusted EBITDA 66 46 156 330 (54)
Depreciation and amortization (62) (56) (111) (300) (190)
Adjusted EBIT (108) (77) 45 (149) (244)
Adjusted EBIT margin (%) (27) (21) 12 (10) (29)
¹ Net of depreciation and amortization

59
Financial indicators of non-consolidated companies
For selected financial indicators of the main non-consolidated companies, see our quarterly
financial statements on www.vale.com / investors / information to the market / financial
statements.
Conference call and webcast
Vale will host two conference calls and webcasts on Wednesday, February 28th, to discuss its
4Q17 performance. The first, in Portuguese (non-translated), will begin at 10:00 a.m. Rio de
Janeiro time. The second, in English, at 12:00 p.m. Rio de Janeiro time (10:00 a.m. US Eastern
Standard Time, 3:00 p.m. British Standard Time).
Dial in to conference calls/webcasts:
In Portuguese:
Participants from Brazil: (55 11) 3193-1001 or (55 11) 2820-4001
Participants from the US: (1 800) 492-3904
Participants from other countries: (1 646) 828-8246
Access code: VALE
In English:
Participants from Brazil: (55 11) 3193-1001 or (55 11) 2820-4001
Participants from the U.S.: (1 800) 492-3904
Participants from other countries: (1 646) 828-8246
Access code: VALE
Instructions for participation will be available on the website: www.vale.com/investors. A
podcast will be available on Vale’s Investor Relations website.
This press release may include statements that present Vale’s expectations about future events or results. All statements, when based upon
expectations about the future, involve various risks and uncertainties. Vale cannot guarantee that such statements will prove correct. These
risks and uncertainties include factors related to the following: (a) the countries where we operate, especially Brazil and Canada; (b) the global
economy; (c) the capital markets; (d) the mining and metals prices and their dependence on global industrial production, which is cyclical by
nature; and (e) global competition in the markets in which Vale operates. To obtain further information on factors that may lead to results
different from those forecast by Vale, please consult the reports Vale files with the U.S. Securities and Exchange Commission (SEC), the
Brazilian Comissão de Valores Mobiliários (CVM) and the French Autorité des Marchés Financiers (AMF), and in particular the factors discussed
under “Forward-Looking Statements” and “Risk Factors” in Vale’s annual report on Form 20-F.

60
ANNEX 1 – SIMPLIFIED FINANCIAL STATEMENTS
Income statement US$ million 4Q17 3Q17 4Q16 2017 2016
Net operating revenue 9,167 9,050 9,265 33,967 27,488
Cost of goods sold (5,791) (5,412) (5,103) (21,039) (17,648)
Gross profit 3,376 3,638 4,162 12,928 9,840
Gross margin (%) 36.8 40.2 44.9 38.1 35.8
Selling, general and administrative expenses (146) (129) (136) (531) (507)
Research and development expenses (104) (91) (112) (340) (319)
Pre-operating and stoppage expenses (125) (83) (129) (413) (453)
Other operational expenses (104) (151) (152) (420) (267)
Impairment and others results in non-current assets (417) (169) (1,145) (294) (1,240)
Operating profit 2,480 3,015 2,488 10,930 7,054
Financial revenues 149 152 52 481 170
Financial expenses (562) (826) (762) (3,276) (2,677)
Gains (losses) on derivatives, net (29) 365 96 454 1,256
Monetary and exchange variation (845) 529 11 (678) 3,094
Equity results in associates and joint ventures (66) 115 (83) 98 309
Impairment and others results in associates and joint ventures
(59) (26) (74) (180) (1,220)
Income (loss) before taxes 1,068 3,324 1,728 7,829 7,986
Current tax 243 (522) (125) (849) (943)
Deferred tax (85) (457) 67 (646) (1,838)
Net Earnings (loss) from continuing operations 1,226 2,345 1,670 6,334 5,205
Loss attributable to noncontrolling interest 32 (7) 33 (21) 8
Gain (loss) from discontinued operations (487) (108) (1,178) (806) (1,231)
Net earnings (attributable to the Company's stockholders)
771 2,230 525 5,507 3,982
Earnings (loss) per share (attributable to the Company's stockholders - US$)
0.15 0.43 0.10 1.06 0.77
Diluted earnings (loss) per share (attributable to the Company's stockholders - US$)
0.15 0.43 0.10 1.06 0.77
Equity income (loss) by business segment US$ million 4Q17 3Q17 4Q16 2017 % 2016 %
Ferrous Minerals 77 91 41 329 333.7 179 (49.4)
Coal - 4 4 20 20.4 (4) (4.8)
Base Metals - 1 - 1 1.0 (4) -
Logistics - - - - - - -
Steel (115) 9 (140) (222) (226.5) 57 168.7
Others (28) 10 14 (30) (28.6) 81 (14.5)
Total (66) 115 (81) 98 100.0 309 100.0
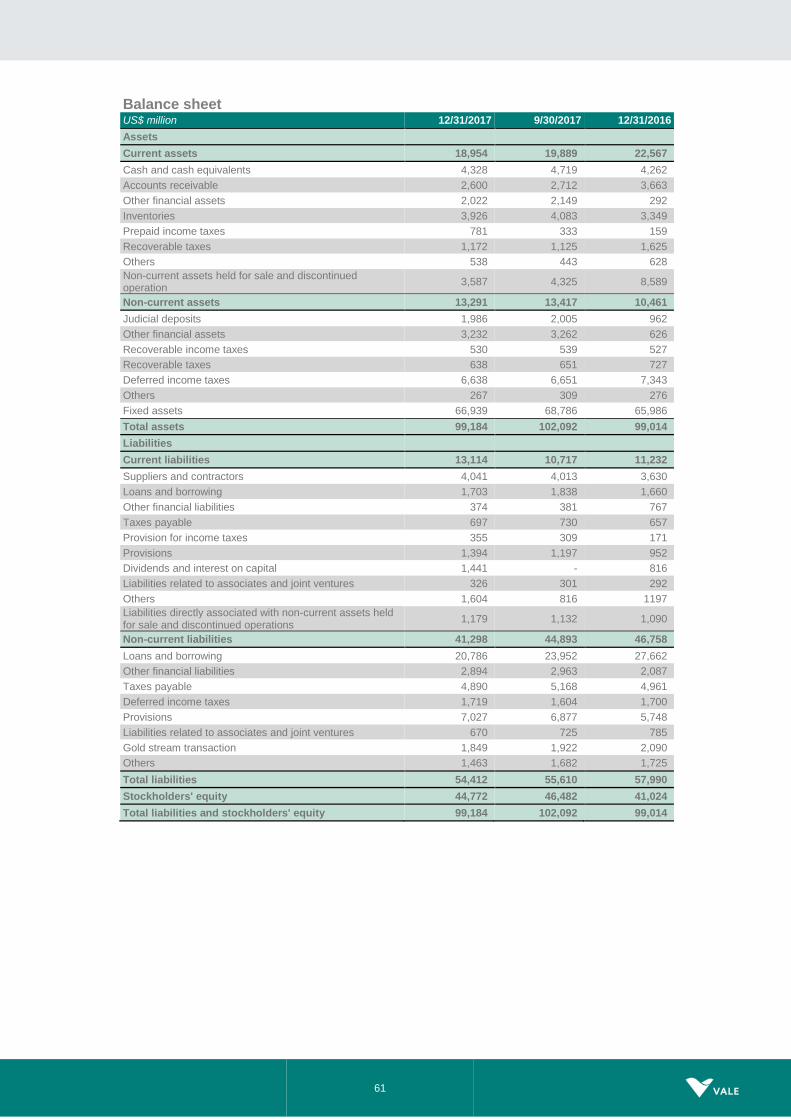
61
Balance sheet US$ million 12/31/2017 9/30/2017 12/31/2016
Assets
Current assets 18,954 19,889 22,567
Cash and cash equivalents 4,328 4,719 4,262
Accounts receivable 2,600 2,712 3,663
Other financial assets 2,022 2,149 292
Inventories 3,926 4,083 3,349
Prepaid income taxes 781 333 159
Recoverable taxes 1,172 1,125 1,625
Others 538 443 628
Non-current assets held for sale and discontinued operation
3,587 4,325 8,589
Non-current assets 13,291 13,417 10,461
Judicial deposits 1,986 2,005 962
Other financial assets 3,232 3,262 626
Recoverable income taxes 530 539 527
Recoverable taxes 638 651 727
Deferred income taxes 6,638 6,651 7,343
Others 267 309 276
Fixed assets 66,939 68,786 65,986
Total assets 99,184 102,092 99,014
Liabilities
Current liabilities 13,114 10,717 11,232
Suppliers and contractors 4,041 4,013 3,630
Loans and borrowing 1,703 1,838 1,660
Other financial liabilities 374 381 767
Taxes payable 697 730 657
Provision for income taxes 355 309 171
Provisions 1,394 1,197 952
Dividends and interest on capital 1,441 - 816
Liabilities related to associates and joint ventures 326 301 292
Others 1,604 816 1197
Liabilities directly associated with non-current assets held for sale and discontinued operations
1,179 1,132 1,090
Non-current liabilities 41,298 44,893 46,758
Loans and borrowing 20,786 23,952 27,662
Other financial liabilities 2,894 2,963 2,087
Taxes payable 4,890 5,168 4,961
Deferred income taxes 1,719 1,604 1,700
Provisions 7,027 6,877 5,748
Liabilities related to associates and joint ventures 670 725 785
Gold stream transaction 1,849 1,922 2,090
Others 1,463 1,682 1,725
Total liabilities 54,412 55,610 57,990
Stockholders' equity 44,772 46,482 41,024
Total liabilities and stockholders' equity 99,184 102,092 99,014

62
Cash flow US$ million 4Q17 3Q17 4Q16 2017 2016
Cash flows from operating activities:
Net income (loss) before taxes on income 1,068 3,324 1,726 7,829 7,984
Adjustments to reconcile
Depreciation, depletion and amortization 976 920 1,006 3,708 3,487
Equity Income 66 (115) 83 (98) (309)
Other items from non-current assets 417 169 45 294 1,240
Impairment on assets and investments 59 26 1,174 180 1,220
Items of the financial result 1,287 (220) 603 3,019 (1,843)
Variation of assets and liabilities
Accounts receivable 173 (936) (1,557) 1,277 (2,744)
Inventories 157 (52) 396 (339) 288
Suppliers and contractors (131) 37 (163) 232 243
Payroll and related charges 210 205 106 372 133
Tax assets and liabilities, net (246) (114) (7) (297) (109)
Goldstream transaction 0 0 0 0 524
Others 262 (121) 273 (615) 441
Net cash provided by operations 4,298 3,123 3,685 15,562 10,555
Interest on loans and financing (352) (407) (420) (1,686) (1,663)
Derivatives received (paid), net (17) (113) (548) (240) (1,602)
Remuneration paid to debentures (65) 0 (47) (135) (84)
Income taxes (74) (84) (50) (563) (388)
Income taxes - settlement program (123) (124) (113) (488) (417)
Net cash provided by operating activities from continuing operations
3,667 2,395 2,507 12,450 6,401
Net cash provided by operating activities from discontinued operations
9 87 24 87 180
Net cash provided by operating activities 3,676 2,482 2,531 12,537 6,581
Cash flows from investing activities:
Additions to investments (19) (57) (9) (93) (239)
Acquisition of subsidiary 0 0 0 0 0
Additions to property, plant and equipment (978) (856) (1,310) (3,831) (4,951)
Proceeds from disposal of assets and investments 201 198 203 922 543
Dividends and interest on capital received from joint ventures and associates
124 21 79 227 193
Proceeds from goldstream transaction 0 0 0 0 276
Others (168) (131) (163) (583) (239)
Net cash used in investing activities from continued operations
(840) (825) (1,200) (3,358) (4,417)
Net cash used in investing activities from discontinued operations
(90) (71) (86) (305) (281)
Net cash used in investing activities (930) (896) (1,286) (3,663) (4,698)
Cash flows from financing activities:
Loans and financing
Additions 175 351 788 1,976 6,994
Repayments (3,210) (2,818) (2,775) (8,998) (7,717)
Payments to shareholders:
Dividends and interest on capital (2) 0 (250) (1,456) (250)
Dividends and interest on capital attributed to noncontrolling interest
(2) (116) (87) (126) (291)
Other transactions with noncontrolling interest 0 0 0 (98) (17)
Net cash provided by (used in) financing activities from continuing operations
(3,039) (2,583) (2,324) (8,702) (1,281)
Net cash provided by (used in) financing activities from discontinued operations
0 (34) (6) (34) (17)
Net cash provided by (used in) financing activities (3,039) (2,617) (2,330) (8,736) (1,298)
Increase (decrease) in cash and cash equivalents (293) (1,031) (1,085) 138 585
Cash and cash equivalents in the beginning of the period 4,719 5,720 5,369 4,262 3,591
Effect of exchange rate changes on cash and cash equivalents (98) 28 (22) (60) 86
Cash of subsidiaries disposed 0 2 0 0 0
Cash and cash equivalents, end of period 4,328 4,719 4,262 4,328 4,262
Non-cash transactions:
Additions to property, plant and equipment - interest capitalization
73 111 90 370 653

63
ANNEX 2 – VOLUMES SOLD, PRICES AND MARGINS
Volume sold - Minerals and metals ‘000 metric tons 4Q17 3Q17 4Q16 2017 2016
Iron ore fines 79,603 76,388 80,287 288,692 289,940
ROM 355 406 2,220 2,637 3,496
Pellets 13,579 13,135 13,190 51,775 47,709
Manganese ore 740 498 534 1,826 1,851
Ferroalloys 34 32 35 132 127
Thermal coal 1,228 1,279 1,121 4,602 5,457
Metallurgical coal 1,715 1,869 1,382 7,178 4,907
Nickel 80 71 83 295 311
Copper 111 110 115 424 430
Gold as by-product ('000 oz) 108 138 132 471 497
Silver as by-product ('000 oz) 602 465 727 2,179 2,578
PGMs ('000 oz) 68 85 73 350 507
Cobalt (metric ton) 1,368 1,482 1,487 5,013 4,734
Average prices
US$/ton 4Q17 3Q17 4Q16 2017 2016
Iron ore fines CFR reference price (dmt) 72.60 76.10 79.10 88.00 62.34
Iron ore fines CFR/FOB realized price 63.10 67.17 69.40 64.17 54.44
ROM 22.55 17.24 12.61 14.41 11.73
Pellets CFR/FOB (wmt) 104.71 109.71 92.27 109.18 80.26
Manganese ore 119.34 175.81 162.92 159.01 110.87
Ferroalloys 1,361.31 1,380.30 857.14 1,353.72 757.67
Thermal coal 78.57 73.82 67.67 71.05 46.17
Metallurgical coal 178.38 141.84 217.01 172.69 119.54
Nickel 11,781 10,554 10,803 10,654 9,800
Copper 6,735 6,203 5,093 5,970 4,458
Platinum (US$/oz) 880 917 887 891 919
Gold (US$/oz) 1,450 1,175 1,246 1,247 1,260
Silver (US$/oz) 15.48 15.87 18.52 15.30 16.22
Cobalt (US$/t) 57,680 53,428 28,021 51,513 24,273
Operating margin by segment (EBIT adjusted margin) % 4Q17 3Q17 4Q16 2017 2016
Ferrous Minerals 41.4 47.0 50.6 45.0 43.0
Coal (26.9) (21.4) 12.0 (9.5) (29.1)
Base Metals 17.2 9.3 7.3 7.6 3.0
Total¹ 31.6 35.2 39.2 33.0 30.2
¹ Excluding non-recurring effects.

64
ANNEX 3 – RECONCILIATION OF IFRS AND “NON-GAAP” INFORMATION (a) Adjusted EBIT¹
US$ million 4Q17 3Q17 4Q16
Net operating revenues 9,167 9,050 9,265
COGS (5,791) (5,412) (5,103)
SG&A (146) (129) (136)
Research and development (104) (91) (112)
Pre-operating and stoppage expenses (125) (83) (129)
Other operational expenses (104) (151) (152)
Adjusted EBIT 2,897 3,184 3,633
¹ Excluding non-recurring effects.
(b) Adjusted EBITDA
EBITDA defines profit or loss before interest, tax, depreciation and amortization. Vale uses the term adjusted EBITDA to reflect exclusion of gains and/or losses on sale of assets, non-recurring expenses and the inclusion of dividends received from non-consolidated affiliates. However our adjusted EBITDA is not the measure defined as EBITDA under IFRS, and may possibly not be comparable with indicators with the same name reported by other companies. Adjusted EBITDA should not be considered as a substitute for operational profit or as a better measure of liquidity than operational cash flow, which are calculated in accordance with IFRS. Vale provides its adjusted EBITDA to give additional information about its capacity to pay debt, carry out investments and cover working capital needs. The following table shows the reconciliation between adjusted EBITDA and operational cash flow, in accordance with its statement of changes in financial position:
Reconciliation between adjusted EBITDA and operational cash flow US$ million 4Q17 3Q17 4Q16
Adjusted EBITDA 4,109 4,192 4,722
Working capital:
Accounts receivable 173 (936) (1,557)
Inventories 157 (52) 396
Suppliers (131) 37 (163)
Payroll and related charges 210 205 106
Others 16 (235) 266
Adjustment for non-recurring items and other effects (236) (88) (105)
Cash provided from operations 4,298 3,123 3,665
Income taxes paid - current (74) (84) (50)
Income taxes paid - settlement program (123) (124) (113)
Interest paid for third parties (352) (407) (420)
Participative stockholders' debentures paid (65) - (47)
Derivatives received (paid), net (17) (113) (548)
Net cash provided by (used in) operating activities 3,667 2,395 2,708
(c) Net debt US$ million 4Q17 3Q17 4Q16
Total debt 22,489 25,790 29,322
Cash and cash equivalents¹ 4,346 4,724 4,280
Net debt 18,143 21,066 25,042
¹ Including financial investments
(d) Total debt / LTM Adjusted EBITDA
US$ million 4Q17 3Q17 4Q16
Total debt / LTM Adjusted EBITDA (x) 1.5 1.6 2.4
Total debt / LTM operational cash flow (x) 1.8 2.3 4.6
(e) LTM Adjusted EBITDA / LTM interest payments
US$ million 4Q17 3Q17 4Q16
Adjusted LTM EBITDA / LTM gross interest (x) 9.0 9.1 6.8
LTM adjusted EBITDA / LTM interest payments (x) 9.1 9.1 7.2
LTM operational profit / LTM interest payments (x) 6.5 6.1 4.2