valeant announces first-quarter 2018...
TRANSCRIPT

International Headquarters 2150 St. Elzéar Blvd. West
Laval, Quebec H7L 4A8 Phone: 514.744.6792
Fax: 514.744.6272
Investor Contact: Media Contact: Arthur Shannon Lainie Keller [email protected] [email protected] (514) 856-3855 (908) 927-0617 (877) 281-6642 (toll free)
VALEANT ANNOUNCES FIRST-QUARTER 2018 RESULTS AND RAISES REVENUE AND ADJUSTED EBITDA (NON-GAAP) GUIDANCE
Outperformed Expectations in the First Quarter of 2018 o Revenues of $1.995 Billion o GAAP Net Loss of $2.693 Billion o GAAP Cash Flow from Operations of $438 Million o Adjusted EBITDA (non-GAAP)1 of $832 Million
Delivered Overall Organic Revenue Growth2 for the First Time since 2015, Driven by Branded Rx and Bausch + Lomb/International Segments
Raised 2018 Full-Year Revenue and Adjusted EBITDA (non-GAAP) Guidance Ranges
Company’s Name Will Change to Bausch Health Companies Inc. in July 2018 LAVAL, Quebec, May 8, 2018 – Valeant Pharmaceuticals International, Inc. (NYSE/TSX: VRX) (“Valeant” or the “Company” or “we”) today announced its first-quarter 2018 financial results. “Our first-quarter 2018 results demonstrate that we are making significant progress in our turnaround. For the first time since 2015, the Company delivered overall organic revenue growth2 that tracked above expectations and was driven by our Branded Rx and Bausch + Lomb/International segments,” said Joseph C. Papa, chairman and CEO, Valeant. “As a result, we are raising our full-year revenue and Adjusted EBITDA (non-GAAP) guidance ranges to reflect our strong performance in the first quarter.” Company Highlights Executing on Core Businesses and Advancing Pipeline
Reported revenue in the Bausch + Lomb/International segment decreased by 3% compared to the first quarter of 2017 primarily due to divestitures and discontinuations; revenue in this segment grew organically2 by 2% compared to the first quarter of 2017
1 Please see the tables at the end of this news release for a reconciliation of this and other non-GAAP measures to the nearest comparable
GAAP measure. 2 Organic growth, a non-GAAP metric, is defined as an increase on a period-over-period basis in revenues on a constant currency basis (if
applicable) excluding the impact of recent acquisitions, divestitures and discontinuations.

2 | Page
o Grew revenue in the Global Vision Care business by 15% compared to the first quarter of 2017; revenue in this business grew organically2 by 9% compared to the first quarter of 2017
o Grew revenue in the aggregate in China by 24% compared to the first quarter of 2017; revenue in this business grew organically2 by 15% compared to the first quarter of 2017
o Launches underway for additional two of the “Significant Seven” products, including: VYZULTA™, a treatment option for glaucoma LUMIFY™, the only over-the-counter eye drop with low-dose brimonidine for the treatment
of eye redness
Reported revenue in the Branded Rx segment decreased by 6% compared to the first quarter of 2017 primarily due to divestitures and discontinuations, and declines in the Ortho Dermatologics business; revenue in this segment grew organically2 by 8% compared to the first quarter of 2017 o Grew revenue in the Salix business by 40% compared to the first quarter of 2017
XIFAXAN® revenue increased by 49% compared to the first quarter of 2017 RELISTOR® franchise revenue increased by 54% compared to the first quarter of 2017 APRISO® revenue increased by 31% compared to the first quarter of 2017 UCERIS® franchise revenue increased by 27% compared to the first quarter of 2017
o The U.S. Food and Drug Administration (FDA) approved PLENVU®, a 1-liter bowel cleansing preparation for colonoscopies, which is expected to be available in the third quarter of 2018
o Continued to stabilize the Ortho Dermatologics business Increased dermatology sales force by approximately 25% in January 2018 Expanded the SILIQ™ launch after executing REMS certifications for more than 2,500
physicians, which includes more than 50% of the target prescribers Launched RETIN-A MICRO® 0.06% topical treatment for acne in January 2018 with sales
tracking above the Company’s expectations The FDA accepted New Drug Applications for:
• ALTRENO™3 (IDP-121), an acne treatment in lotion form; PDUFA action date of Aug. 27, 2018
• BRYHALI™3 (IDP-122), a topical treatment for plaque psoriasis; PDUFA action date of Oct. 5, 2018
Pivotal efficacy and safety data for DUOBRII™3 (IDP-118), a topical treatment for plaque psoriasis, was published in The Journal of the American Academy of Dermatology
Completed Phase 2 studies for IDP-120, a topical treatment for acne that contains a fixed dose combination of tretinoin and benzoyl peroxide gel; Phase 3 studies are expected to begin in the second half of 2018
Entered into an exclusive licensing agreement with Kaken Pharmaceutical Co., Ltd. to develop and commercialize products containing a new chemical entity that, if approved, would represent a novel drug with an alternate mechanism of action in the topical treatment of psoriasis
Reducing Debt and Extending Maturities
Repaid approximately $280 million of debt with cash on hand in the first quarter of 2018 o Repaid $200 million of the Company’s senior secured term loans, using cash on hand, in January
2018 o Redeemed remaining $71 million aggregate principal amount of our outstanding 7.000% Senior
Unsecured Notes due 2020, using cash on hand, on March 30, 2018
3 Provisional name

3 | Page
Issued $1.5 billion aggregate principal amount of 9.250% senior notes due 2026 on March 26, 2018 o Used net proceeds, along with cash on hand, to repurchase, through cash tender offers,
approximately $1.45 billion aggregate principal amount of outstanding Senior Notes due 2020 and 2021, and to pay fees and expenses
Resolving Legal Issues
Achieved dismissals or other positive outcomes in resolving and managing litigation and investigations in approximately 20 matters since Jan. 1, 2018 o The UCERIS® arbitration was decided in favor of Valeant with the Arbitral Tribunal issuing a
ruling that rejected the other party’s claims and ordering that they pay the entirety of Valeant’s legal costs
o Agreed to resolve the SOLODYN® antitrust litigations, with the class settlement ($58 million) being subject to final court approval
o Agreed to resolve California Department of Insurance matter relating to Philidor, with no finding of admission or liability by Valeant
o Summary judgment granted that upheld validity of RELISTOR® Injection patent, U.S. Patent No. 8,552,025, preventing generic competition until 2024
◦ First-Quarter 2018 Revenue Performance
Total reported revenues were $1.995 billion for the first quarter of 2018, as compared to $2.109 billion in the first quarter of 2017, a decrease of $114 million, or 5%. Excluding the impact of the 2017 divestitures and discontinuations of $214 million and the favorable impact of foreign exchange of $66 million, revenue grew organically2 by 2% compared to the first quarter of 2017, primarily driven by growth in the Salix business and the Bausch + Lomb/International segment. Organic2 revenue growth was partially offset by declines in the Ortho Dermatologics business and lower volumes in the U.S. Diversified Products segment, attributed to the previously reported loss of exclusivity for a basket of products. Revenues by segment for the first quarter of 2018 were as follows:
(in millions) 1Q 2018 1Q 20174
Reported Change
Reported Change
Change at Constant
Currency5
Organic2
Change
Segment
Bausch + Lomb/International $1,103 $1,134 ($31) (3 %) (8 %) 2 %
Branded Rx $593 $629 ($36) (6 %) (6 %) 8 %
U.S. Diversified Products $299 $346 ($47) (14 %) (14 %) (9 %)
Total Revenues $1,995 $2,109 ($114) (5 %) (9 %) 2 %
4 Effective in the first quarter of 2018, revenues from the U.S. Solta business included in the U.S. Diversified Products segment in prior periods
and revenues from the international Solta business included in the Bausch + Lomb/International segment in prior periods are presented in the Branded Rx segment. Prior period presentations of segment revenues have been conformed to the current segment reporting structure to allow investors to evaluate results between periods on a constant basis. Global Solta revenue was $29 million and $23 million for the first quarters of 2018 and 2017, respectively.
5 To assist investors in evaluating the Company’s performance, we have adjusted for changes in foreign currency exchange rates. Change at constant currency, a non-GAAP metric, is determined by comparing 2018 reported amounts adjusted to exclude currency impact, calculated using 2017 monthly average exchange rates, to the actual 2017 reported amounts.

4 | Page
Bausch + Lomb/International Segment Bausch + Lomb/International segment revenues were $1.103 billion for the first quarter of 2018, as compared to $1.134 billion for the first quarter of 2017, a decrease of $31 million, or 3%. Excluding the impact of divestitures and discontinuations of $113 million, and the favorable impact of foreign exchange of $65 million, the Bausch + Lomb/International segment grew organically2 by approximately 2% compared to the first quarter of 2017. Branded Rx Segment Branded Rx segment revenues were $593 million for the first quarter of 2018, as compared to $629 million for the first quarter of 2017, a decrease of $36 million, or 6%. Excluding the impact of divestitures and discontinuations of $83 million and the favorable impact of foreign exchange of $1 million, the Branded Rx segment grew organically2 by approximately 8% compared to the first quarter of 2017. Compared to the first quarter of 2017, the Salix business grew revenue by 40%, largely driven by sales growth in XIFAXAN® and other promoted products. U.S. Diversified Products Segment U.S. Diversified Products segment revenues were $299 million for the first quarter of 2018, as compared to $346 million for the first quarter of 2017, a decrease of $47 million, or 14%. The decline was primarily driven by decreases attributed to the previously reported loss of exclusivity for a basket of products and by the impact of the 2017 divestitures and discontinuations of $18 million. Operating Loss Operating loss was $2.281 billion for the first quarter of 2018, as compared to an operating income of $211 million for the first quarter of 2017, a decrease of $2.492 billion. The decrease in operating results for the first quarter of 2018 primarily reflects goodwill impairment charges of $2.213 billion related to the Salix and Ortho Dermatologics businesses. These charges were recognized when the Company adopted new accounting guidance from the Financial Accounting Standards Board in January 2018. Net Loss Net loss for the three months ended March 31, 2018 was $2.693 billion, as compared to net income of $628 million for the same period in 2017, a decrease of $3.321 billion. The decrease in net income is primarily attributed to a decrease in the benefit from income taxes and the goodwill impairment charges recorded in the first quarter of 2018. Net income in the first quarter of 2017 included an income tax benefit of $908 million from a non-cash internal restructuring in that quarter. Adjusted net income (non-GAAP) for the first quarter of 2018 was $312 million, as compared to $273 million for the first quarter of 2017, an increase of 14%. Operating Cash The Company delivered $438 million in operating cash in the first quarter of 2018, which was above expectations due to reductions in working capital and despite settlement payments of $170 million that were made in the first quarter for certain legacy legal matters, including the SOLODYN® Antitrust Class Actions and Allergan Shareholder Class Actions. Cash flow in the first quarter of 2018 decreased by $516 million, as compared to $954 million in the first quarter of 2017. The first quarter of 2017 included a one-time cash receipt attributed to our fulfillment agreement with Walgreens.

5 | Page
EPS GAAP Earnings Per Share (EPS) Diluted for the first quarter of 2018 was $(7.68), as compared to $1.79 for the first quarter of 2017. Adjusted EBITDA (non-GAAP) Adjusted EBITDA (non-GAAP) was $832 million for the first quarter of 2018, as compared to $861 million for the first quarter of 2017, a decrease of $29 million, primarily driven by the impact of the 2017 divestitures of $75 million, offset by growth in the Salix business. 2018 Financial Outlook Valeant has raised guidance for the full year of 2018 and has not changed anticipated dates for products losing exclusivity (LOE) later this year:
Full-Year Revenues in the range of $8.15 – $8.35 billion from $8.10 – $8.30 billion
Full-Year Adjusted EBITDA (non-GAAP) in the range of $3.15 – $3.30 billion from $3.05 – $3.20 billion
Other than with respect to GAAP Revenues, the Company only provides guidance on a non-GAAP basis. The Company does not provide a reconciliation of forward-looking Adjusted EBITDA (non-GAAP) to GAAP net income (loss), due to the inherent difficulty in forecasting and quantifying certain amounts that are necessary for such reconciliation. In periods where significant acquisitions or divestitures are not expected, the Company believes it might have a basis for forecasting the GAAP equivalent for certain costs, such as amortization, which would otherwise be treated as non-GAAP to calculate projected GAAP net income (loss). However, because other deductions (such as restructuring, gain or loss on extinguishment of debt and litigation and other matters) used to calculate projected net income (loss) vary dramatically based on actual events, the Company is not able to forecast on a GAAP basis with reasonable certainty all deductions needed in order to provide a GAAP calculation of projected net income (loss) at this time. The amount of these deductions may be material and, therefore, could result in projected GAAP net income (loss) being materially less than projected Adjusted EBITDA (non-GAAP). The guidance provided in this section represents forward-looking information, and actual results may vary. Please see the risks and assumptions referred to in the Forward-looking Statements section of this news release. Additional Highlights
Valeant’s cash and cash equivalents were $909 million at March 31, 2018
The Company’s availability under the Revolving Credit Facility was approximately $1.1 billion at March 31, 2018
Conference Call Details
Date: Tuesday, May 8, 2018
Time: 8:00 a.m. EDT
Web cast: http://ir.valeant.com/events-and-presentations
Participant Event Dial-in: (844) 428-3520 (North America)
(409) 767-8386 (International)
Participant Passcode: 6185877
Replay Dial-in: (855) 859-2056 (North America)
(404) 537-3406 (International)
Replay Passcode: 6185877 (replay available until July 8, 2018)

6 | Page
About Valeant Valeant Pharmaceuticals International, Inc. (NYSE/TSX: VRX) is a global company whose mission is to improve people’s lives with our health care products. We develop, manufacture and market a range of pharmaceutical, medical device and over-the-counter products, primarily in the therapeutic areas of eye health, gastroenterology and dermatology. We are delivering on our commitments as we build an innovative company dedicated to advancing global health. More information can be found at www.valeant.com. Forward-looking Statements This press release contains forward-looking information and statements, within the meaning of applicable securities laws (collectively, “forward-looking statements”), including, but not limited to, statements regarding Valeant's future prospects and performance including the Company’s 2018 revised full-year guidance, the anticipated approval and launch dates for certain of our products, the anticipated timing of the commencement of studies for certain of our pipeline products, the anticipated timing of loss of exclusivity for certain of our products and the final court approval of the settlements of the Allergan securities litigation and SOLODYN® antitrust litigation. Forward-looking statements may generally be identified by the use of the words “anticipates,” “expects,” “intends,” “plans,” “should,” “could,” “would,” “may,” “will,” “believes,” “estimates,” “potential,” “target,” “tracking,” or “continue” and variations or similar expressions, and phrases or statements that certain actions, events or results may, could, should or will be achieved, received or taken, or will occur or result, and similar such expressions also identify forward-looking information. These forward-looking statements, including the Company’s full-year guidance, are based upon the current expectations and beliefs of management and are provided for the purpose of providing additional information about such expectations and beliefs and readers are cautioned that these statements may not be appropriate for other purposes. These forward-looking statements are subject to certain risks and uncertainties that could cause actual results and events to differ materially from those described in these forward-looking statements. These risks and uncertainties include, but are not limited to, the risks and uncertainties discussed in the Company's most recent annual and quarterly reports and detailed from time to time in the Company's other filings with the Securities and Exchange Commission and the Canadian Securities Administrators, which risks and uncertainties are incorporated herein by reference. In addition, certain material factors and assumptions have been applied in making these forward-looking statements (including the Company’s 2018 full-year guidance), including that the risks and uncertainties outlined above will not cause actual results or events to differ materially from those described in these forward-looking statements, and additional information regarding certain of these material factors and assumptions may also be found in the Company’s filings described above. The Company believes that the material factors and assumptions reflected in these forward-looking statements are reasonable, but readers are cautioned not to place undue reliance on any of these forward-looking statements. These forward-looking statements speak only as of the date hereof. Valeant undertakes no obligation to update any of these forward-looking statements to reflect events or circumstances after the date of this press release or to reflect actual outcomes, unless required by law. Non-GAAP Information To supplement the financial measures prepared in accordance with U.S. generally accepted accounting principles (GAAP), the Company uses certain non-GAAP financial measures including (i) Adjusted EBITDA (non-GAAP), (ii) organic growth and (iii) constant currency. As discussed below, we also provide Adjusted Net Income (non-GAAP) to provide supplemental information to readers. Management uses these non-GAAP measures as key metrics in the evaluation of company performance and the consolidated financial results and, in part, in the determination of cash bonuses for its executive officers. The Company

7 | Page
believes these non-GAAP measures are useful to investors in their assessment of our operating performance and the valuation of our Company. In addition, these non-GAAP measures address questions the Company routinely receives from analysts and investors, and in order to assure that all investors have access to similar data, the Company has determined that it is appropriate to make this data available to all investors. However, these measures are not prepared in accordance with GAAP nor do they have any standardized meaning under GAAP. In addition, other companies may use similarly titled non-GAAP financial measures that are calculated differently from the way we calculate such measures. Accordingly, our non-GAAP financial measures may not be comparable to similar non-GAAP measures. We caution investors not to place undue reliance on such non-GAAP measures, but instead to consider them with the most directly comparable GAAP measures. Non-GAAP financial measures have limitations as analytical tools and should not be considered in isolation. They should be considered as a supplement to, not a substitute for, or superior to, the corresponding measures calculated in accordance with GAAP. The reconciliations of these historic non-GAAP measures to the most directly comparable financial measures calculated and presented in accordance with GAAP are shown in the tables below. However, as indicated above, for guidance purposes, the Company does not provide reconciliations of projected Adjusted EBITDA (non-GAAP) to projected GAAP net income (loss), due to the inherent difficulty in forecasting and quantifying certain amounts that are necessary for such reconciliations. Specific Non-GAAP Measures Adjusted EBITDA (non-GAAP) Adjusted EBITDA (non-GAAP) is GAAP net income (its most directly comparable GAAP financial measure) adjusted for certain items, as further described below. Management of the Company believes that Adjusted EBITDA (non-GAAP), along with the GAAP measures used by management, most appropriately reflect how the Company measures the business internally and sets operational goals and incentives, especially in light of the Company’s new strategies. In particular, the Company believes that Adjusted EBITDA (non-GAAP) focuses management on the Company’s underlying operational results and business performance. As a result, the Company uses Adjusted EBITDA (non-GAAP) both to assess the actual financial performance of the Company and to forecast future results as part of its guidance. Management believes Adjusted EBITDA (non-GAAP) is a useful measure to evaluate current performance. Adjusted EBITDA (non-GAAP) is intended to show our unleveraged, pre-tax operating results and therefore reflects our financial performance based on operational factors. In addition, commencing in 2017, cash bonuses for the Company’s executive officers and other key employees are based, in part, on the achievement of certain Adjusted EBITDA (non-GAAP) targets. Adjusted EBITDA (non-GAAP) reflect adjustments based on the following items: • Restructuring and integration costs: Since 2016 and for the foreseeable future, while the Company
has undertaken fewer acquisitions, the Company has incurred additional restructuring costs as it implements its new strategies, which will involve, among other things, improvements to our infrastructure and other operational improvements, internal reorganizations and impacts from the divestiture of assets and businesses. With regard to infrastructure and operational improvements which the Company has taken to improve efficiencies in the businesses and facilities, these tend to be costs intended to right size the business or organization that fluctuate significantly between periods in amount, size and timing, depending on the improvement project, reorganization or transaction. As a result, the Company does not believe that such costs (and their impact) are truly representative of the underlying business. The Company believes that the adjustments of these items provide supplemental information with regard to the sustainability of the Company’s

8 | Page
operating performance, allow for a comparison of the financial results to historical operations and forward-looking guidance and, as a result, provide useful supplemental information to investors.
• Acquired in-process research and development costs: The Company has excluded expenses associated with acquired in-process research and development, as these amounts are inconsistent in amount and frequency and are significantly impacted by the timing, size and nature of acquisitions. Furthermore, as these amounts are associated with research and development acquired, they are not a representation of the Company’s research and development efforts during the period.
• Asset Impairments: The Company has excluded the impact of impairments of finite-lived and indefinite-lived intangible assets, as well as impairments of assets held for sale, as such amounts are inconsistent in amount and frequency and are significantly impacted by the timing and/or size of acquisitions and divestitures. The Company believes that the adjustments of these items correlate with the sustainability of the Company’s operating performance. Although the Company excludes intangible impairments from its non-GAAP expenses, the Company believes that it is important for investors to understand that intangible assets contribute to revenue generation.
• Share-based Compensation: The Company excludes the impact of costs relating to share-based compensation. The Company believes that the exclusion of share-based compensation expense assists investors in the comparisons of operating results to peer companies. Share-based compensation expense can vary significantly based on the timing, size and nature of awards granted.
• Acquisition- related adjustments excluding amortization of intangible assets and depreciation expense: The Company has excluded the impact of acquisition-related contingent consideration non-cash adjustments due to the inherent uncertainty and volatility associated with such amounts based on changes in assumptions with respect to fair value estimates, and the amount and frequency of such adjustments is not consistent and is significantly impacted by the timing and size of the Company’s acquisitions, as well as the nature of the agreed-upon consideration. In addition, the Company has excluded the impact of fair value inventory step-up resulting from acquisitions as the amount and frequency of such adjustments are not consistent and are significantly impacted by the timing and size of its acquisitions.
• Loss on extinguishment of debt: The Company has excluded loss on extinguishment of debt as this represents a cost of refinancing our existing debt and is not a reflection of our operations for the period. Further, the amount and frequency of such charges are not consistent and are significantly impacted by the timing and size of debt financing transactions and other factors in the debt market out of management’s control.
• Other Non-GAAP Charges: The Company has excluded certain other amounts, including legal and other professional fees incurred in connection with recent legal and governmental proceedings, investigations and information requests respecting certain of our distribution, marketing, pricing, disclosure and accounting practices, litigation and other matters, and net (gain)/loss on sale of assets. In addition, the Company has excluded certain other expenses that are the result of other, non-comparable events to measure operating performance. These events arise outside of the ordinary course of continuing operations. Given the unique nature of the matters relating to these costs, the Company believes these items are not normal operating expenses. For example, legal settlements and judgments vary significantly, in their nature, size and frequency, and, due to this volatility, the Company believes the costs associated with legal settlements and judgments are not normal operating expenses. In addition, as opposed to more ordinary course matters, the Company considers that each of the recent proceedings, investigations and information requests, given their nature and frequency, are outside of the ordinary course and relate to unique circumstances. The Company believes that the exclusion of such out-of-the-ordinary-course amounts provides

9 | Page
supplemental information to assist in the comparison of the financial results of the Company from period to period and, therefore, provides useful supplemental information to investors. However, investors should understand that many of these costs could recur and that companies in our industry often face litigation.
Finally, to the extent not already adjusted for above, Adjusted EBITDA (non-GAAP) reflects adjustments for interest, taxes, depreciation and amortization (EBITDA represents earnings before interest, taxes, depreciation and amortization). Adjusted Net Income (Loss) (non-GAAP) Historically, management has used adjusted net income (loss) (non-GAAP) (the most directly comparable GAAP financial measure for which is GAAP net income (loss)) for strategic decision making, forecasting future results and evaluating current performance. This non-GAAP measure excludes the impact of certain items (as further described below) that may obscure trends in the Company’s underlying performance. By disclosing this non-GAAP measure, it was management’s intention to provide investors with a meaningful, supplemental comparison of the Company’s operating results and trends for the periods presented. It was management’s belief that this measure was also useful to investors as such measure allowed investors to evaluate the Company’s performance using the same tools that management had used to evaluate past performance and prospects for future performance. Accordingly, it was the Company’s belief that adjusted net income (loss) (non-GAAP) was useful to investors in their assessment of the Company’s operating performance and the valuation of the Company. It is also noted that, in recent periods, our GAAP net income was significantly lower than our adjusted net income (non-GAAP). Commencing in 2017, management of the Company identified and began using certain new primary financial performance measures to assess the Company’s financial performance. However, management still believes that adjusted net income (loss) (non-GAAP) may be useful to investors in their assessment of the Company and its performance. In addition to certain of the adjustments described above (namely restructuring and integration costs, acquired in-process research and development costs, loss on extinguishment of debt, asset impairments, acquisition-related adjustments, excluding amortization, and other non-GAAP charges), adjusted net income (non-GAAP) also reflects adjustments based on the following additional items: • Amortization of intangible assets: The Company has excluded the impact of amortization of
intangible assets, as such amounts are inconsistent in amount and frequency and are significantly impacted by the timing and/or size of acquisitions. The Company believes that the adjustments of these items correlate with the sustainability of the Company’s operating performance. Although the Company excludes amortization of intangible assets from its non-GAAP expenses, the Company believes that it is important for investors to understand that such intangible assets contribute to revenue generation. Amortization of intangible assets that relate to past acquisitions will recur in future periods until such intangible assets have been fully amortized. Any future acquisitions may result in the amortization of additional intangible assets.
Organic Growth Organic Growth, a non-GAAP metric, is defined as an increase on a period-over-period basis in revenues on a constant currency basis (if applicable) excluding the impact of recent acquisitions, divestitures and discontinuations. Organic Growth is growth in GAAP Revenue (its most directly comparable GAAP financial measure) adjusted for certain items, as further described below, of businesses that have been owned for one or more years. The Company uses organic revenue and organic growth to assess performance of its business units and operating and reportable segments, and the Company in total,

10 | Page
without the impact of foreign currency exchange fluctuations and recent acquisitions, divestitures and product discontinuations. The Company believes that such measures are useful to investors as it provides a supplemental period-to-period comparison. Organic revenue growth reflects adjustments for: (i) the impact of period-over-period changes in foreign currency exchange rates on revenues and (ii) the revenues associated with acquisitions, divestitures and discontinuations of businesses divested and/ or discontinued. These adjustments are determined as follows:
Foreign currency exchange rates: Although changes in foreign currency exchange rates are part of our business, they are not within management’s control. Changes in foreign currency exchange rates, however, can mask positive or negative trends in the business. The impact for changes in foreign currency exchange rates is determined as the difference in the current period reported revenues at their current period currency exchange rates and the current period reported revenues revalued using the monthly average currency exchange rates during the comparable prior period.
Acquisitions, divestitures and discontinuations: In order to present period-over-period organic revenues (non-GAAP) on a comparable basis, revenues associated with acquisitions, divestitures and discontinuations are adjusted to include only revenues from those businesses and assets owned during both periods. Accordingly, organic revenue (non-GAAP) growth excludes from the current period, revenues attributable to each acquisition for twelve months subsequent to the day of acquisition, as there are no revenues from those businesses and assets included in the comparable prior period. Organic revenue (non-GAAP) growth excludes from the prior period (but not the current period), all revenues attributable to each divestiture and discontinuance during the twelve months prior to the day of divestiture or discontinuance, as there are no revenues from those businesses and assets included in the comparable current period.
Constant Currency Changes in the relative values of non-U.S. currencies to the U.S. dollar may affect the Company’s financial results and financial position. To assist investors in evaluating the Company’s performance, we have adjusted for foreign currency effects. Constant currency impact is determined by comparing 2018 reported amounts adjusted to exclude currency impact, calculated using 2017 monthly average exchange rates, to the actual 2017 reported amounts. Please also see the reconciliation tables below for further information as to how these non-GAAP measures are calculated for the periods presented. FINANCIAL TABLES FOLLOW

11 | Page
Valeant Pharmaceuticals International, Inc. Table 1
Condensed Consolidated Statements of Operations For the Three Months Ended March 31, 2018 and 2017 (unaudited)
Three Months Ended
March 31,
(in millions) 2018 2017
Revenues Product sales $ 1,965 $ 2,076 Other revenues 30 33
1,995 2,109 Expenses Cost of goods sold (exclusive of amortization and impairments of intangible assets) 560 584 Cost of other revenues 13 12 Selling, general and administrative 591 661 Research and development 92 96 Amortization of intangible assets 743 635 Goodwill impairments 2,213 — Asset impairments 44 138 Restructuring and integration costs 6 18 Acquired in-process research and development costs 1 4 Acquisition-related contingent consideration 2 (10 )
Other expense (income), net 11 (240 )
4,276 1,898 Operating (loss) income (2,281 ) 211 Interest income 3 3 Interest expense (416 ) (474 )
Loss on extinguishment of debt (27 ) (64 )
Foreign exchange and other 27 29
Loss before benefit from income taxes (2,694 ) (295 )
Benefit from income taxes (3 ) (924 )
Net (loss) income (2,691 ) 629 Less: Net income attributable to noncontrolling interest 2 1
Net (loss) income attributable to Valeant Pharmaceuticals International, Inc. $ (2,693 ) $ 628

12 | Page
Valeant Pharmaceuticals International, Inc. Table 2
Reconciliation of GAAP Net (Loss) Income to Adjusted Net Income (non-GAAP) For the Three Months Ended March 31, 2018 and 2017 (unaudited) Three Months Ended
March 31,
(in millions) 2018 2017
Net (loss) income attributable to Valeant Pharmaceuticals International, Inc. $ (2,693 ) $ 628 Non-GAAP adjustments: (a) Amortization of intangible assets 743 635 Asset impairments 44 138 Goodwill impairments 2,213 — Restructuring and integration costs 6 18 Acquired in-process research and development costs 1 4 Acquisition-related adjustments excluding amortization of intangible assets 2 (10 )
Loss on extinguishment of debt 27 64 Legal and other professional fees 5 10 Litigation and other matters 11 77 Net gain on sale of assets — (317 )
Other (1 ) — Tax effect of non-GAAP adjustments (46 ) (974 )
Total non-GAAP adjustments 3,005 (355 )
Adjusted net income attributable to Valeant Pharmaceuticals International, Inc.
(non-GAAP) $ 312
$ 273
(a) The components of (and further details respecting) each of these non-GAAP adjustments and the financial statement line item
to which each component relates can be found on Table 2a.

13 | Page
Valeant Pharmaceuticals International, Inc. Table 2a
Reconciliation of GAAP to Non-GAAP Financial Information For the Three Months Ended March 31, 2018 and 2017 (unaudited) Three Months Ended
March 31,
(in millions) 2018 2017
Selling, general and administrative reconciliation: GAAP Selling, general and administrative $ 591 $ 661 Legal and other professional fees (a) (5 ) (10 )
Other Selling, general and administrative (b) 1 —
Adjusted selling, general and administrative (non-GAAP) $ 587 $ 651
Amortization of intangible assets reconciliation: GAAP Amortization of intangible assets $ 743 $ 635 Amortization of intangible assets (c) (743 ) (635 )
Adjusted amortization of intangible assets (non-GAAP) $ — $ — Goodwill impairment reconciliation:
GAAP Goodwill impairment $ 2,213 $ — Goodwill impairment (d) (2,213 ) — Adjusted goodwill impairment (non-GAAP) $ — $ —
Restructuring and integration costs reconciliation: GAAP Restructuring and integration costs $ 6 $ 18 Restructuring and integration costs (e) (6 ) (18 )
Adjusted restructuring and integration costs (non-GAAP) $ — $ — Acquired in-process research and development costs reconciliation:
GAAP Acquired in-process research and development costs $ 1 $ 4 Acquired in-process research and development costs (f) (1 ) (4 )
Adjusted acquired in-process research and development costs (non-GAAP) $ — $ — Asset impairments reconciliation:
GAAP Asset impairments $ 44 $ 138 Asset impairments (g) (44 ) (138 )
Adjusted asset impairments (non-GAAP) $ — $ — Acquisition-related contingent consideration reconciliation:
GAAP Acquisition-related contingent consideration $ 2 $ (10 )
Acquisition-related contingent consideration (h) (2 ) 10 Adjusted acquisition-related contingent consideration (non-GAAP) $ — $ —
Other expense (income), net reconciliation: GAAP Other expense (income), net $ 11 $ (240 )
Litigation and other matters (i) (11 ) (77 )
Net gain on sale of assets (j) — 317 Adjusted other expense (income) (non-GAAP) $ — $ —
Loss on extinguishment of debt reconciliation: GAAP Loss on extinguishment of debt $ (27 ) $ (64 )
Loss on extinguishment of debt (k) 27 64 Adjusted loss on extinguishment of debt (non-GAAP) $ — $ —

14 | Page
Table 2a (continued)
Three Months Ended
March 31,
(in millions) 2018 2017
Benefit from income taxes reconciliation: GAAP Benefit from income taxes $ (3 ) $ (924 )
Tax effect of non-GAAP adjustments (l) 46 974
Adjusted provision for income taxes (non-GAAP) $ 43 $ 50
(a) Represents the sole component of the non-GAAP adjustment of “Legal and other professional fees” (see Table 2). Legal and
other professional fees incurred during the three months ended March 31, 2018 and 2017 in connection with recent legal and
governmental proceedings, investigations and information requests related to, among other matters, our distribution,
marketing, pricing, disclosure and accounting practices.
(b) Represents the sole component of the non-GAAP adjustment of “Other” (see Table 2).
(c) Represents the sole component of the non-GAAP adjustment of “Amortization of intangible assets” (see Table 2).
(d) Represents the sole component of the non-GAAP adjustment of “Goodwill impairment” (see Table 2).
(e) Represents the sole component of the non-GAAP adjustment of “Restructuring and integration costs” (see Table 2).
(f) Represents the sole component of the non-GAAP adjustment of “Acquired in-process research and development costs” (see
Table 2).
(g) Represents the sole component of the non-GAAP adjustment of “Asset impairments” (see Table 2).
(h) Represents the sole component of the non-GAAP adjustment of “Acquisition-related adjustments excluding amortization of
intangible assets” (see Table 2).
(i) Represents the sole component of the non-GAAP adjustment of "Litigation and other matters" (see Table 2).
(j) Represents the sole component of the non-GAAP adjustment "Net gain on sale of assets" (see Table 2). Net gain on sale of
assets of $317 million during the three months ended March 31, 2017 includes the $319 million gain on the sale of CeraVe,
AcneFree and AMBI skincare brands in March of 2017.
(k) Represents the sole component of the non-GAAP adjustment of “Loss on extinguishment of debt” (see Table 2).
(l) Represents the sole component of the non-GAAP adjustment of “Tax effect of non-GAAP adjustments” (see Table 2).

15 | Page
Valeant Pharmaceuticals International, Inc. Table 2b
Reconciliation of GAAP Net (Loss) Income to Adjusted EBITDA (non-GAAP) For the Three Months Ended March 31, 2018 and 2017 (unaudited) Three Months Ended
March 31,
(in millions) 2018 2017
Net (loss) income attributable to Valeant Pharmaceuticals International, Inc. $ (2,693 ) $ 628
Interest expense, net 413 471
Benefit from income taxes (3 ) (924 )
Depreciation and amortization 786 674 EBITDA (1,497 ) 849 Adjustments: Asset impairments 44 138
Goodwill impairments 2,213 —
Restructuring and integration costs 6 18
Acquired in-process research and development costs 1 4
Acquisition-related adjustments excluding amortization and depreciation 2 (10 )
Loss on extinguishment of debt 27 64
Share-based compensation 21 28
Other adjustments: Legal and other professional fees (a) 5 10
Litigation and other matters 11 77
Net gain on sale of assets (b) — (317 )
Other (1 ) —
Adjusted EBITDA (non-GAAP) $ 832 $ 861
(a) Legal and other professional fees incurred during the three months ended March 31, 2018 and 2017 in connection with recent
legal and governmental proceedings, investigations and information requests related to, among other matters, our distribution,
marketing, pricing, disclosure and accounting practices.
(b) Net gain on sale of assets of $317 million during the three months ended March 31, 2017 includes the $319 million gain on
the sale of CeraVe, AcneFree and AMBI skincare brands in March of 2017.

16 | Page
Valeant Pharmaceuticals International, Inc. Table 3
Organic Growth (non-GAAP) - by Segment For the Three Months Ended March 31, 2018 and 2017 (unaudited) Calculation of Organic Revenue
Three Months Ended
March 31, 2018 Three Months Ended
March 31, 2017 Change in
Organic Revenue Revenue
as
Reported
Changes
in
Exchange
Rates (a)
Organic
Revenue (Non-
GAAP) (b)
Revenue
as
Reported
Divested
Revenues
Organic
Revenue (Non-
GAAP) (b) (in millions) Amount Pct.
Bausch + Lomb/International Global Vision Care $ 195 $ (10 ) $ 185 $ 170 $ — $ 170 $ 15 9 %
Global Surgical (c) 171 (12 ) 159 154 (1 ) 153 6 4 %
Global Consumer Products 330 (17 ) 313 375 (63 ) 312 1 — %
Global Ophtho Rx 143 (5 ) 138 143 — 143 (5 ) (3 )%
International Rx (c)(d) 264 (21 ) 243 292 (49 ) 243 — — %
Total Bausch + Lomb/International (e) 1,103 (65 ) 1,038 1,134 (113 ) 1,021 17 2 %
Branded Rx Salix 422 — 422 302 — 302 120 40 %
Ortho Dermatologics (f) 112 — 112 194 — 194 (82 ) (42 )%
Global Solta (d) 29 (1 ) 28 23 — 23 5 18 %
Dentistry 30 — 30 28 (1 ) 27 3 11 %
Other revenues — — — 82 (82 ) — — — Total Branded Rx 593 (1 ) 592 629 (83 ) 546 46 8 %
U.S. Diversified Products (d) Neuro & Other 209 — 209 243 — 243 (34 ) (14 )%
Generics 90 — 90 85 — 85 5 6 %
Other revenues (f) — — — 18 (18 ) — — — Total U.S. Diversified Products 299 — 299 346 (18 ) 328 (29 ) (9 )%
Total revenues $ 1,995 $ (66 ) $ 1,929 $ 2,109 $ (214 ) $ 1,895 $ 34 2 %
(a) The impact for changes in foreign currency exchange rates is determined as the difference in the current period reported
revenues at their current period currency exchange rates and the current period reported revenues revalued using the monthly
average currency exchange rates during the comparable prior period.
(b) To supplement the financial measures prepared in accordance with U.S. generally accepted accounting principles (GAAP),
the Company uses certain non-GAAP financial measures. For additional information about the Company’s use of such non-
GAAP financial measures, refer to the body of the press release to which these tables are attached. Organic revenue (non-
GAAP) for the three months ended March 31, 2018 is calculated as revenue as reported adjusted for the impact for changes in
exchange rates (previously defined in this press release). Organic revenue (non-GAAP) for the three months ended March 31,
2017 is calculated as revenue as reported less revenues attributable to divestitures and discontinuances during the twelve
months prior to the day of divestiture or discontinuance, as there are no revenues from those businesses and assets included in
the comparable current period. Organic revenue is also adjusted for acquisitions, however, during the three months ended
March 31, 2018 and 2017, there were no acquisitions.
(c) As of the third quarter of 2017, one product has been removed from the Global Surgical business unit and added to the
International Rx business unit. This change has been made as management believes that the product better aligns with the
International Rx business unit, as this product, although acquired as part of the acquisition of certain surgical assets, is an
injectable product. Prior period presentations of business unit revenue have been conformed to the current business unit
reporting structure to allow investors to evaluate results between period on a consistent basis.
17 | Page
Valeant Pharmaceuticals International, Inc. Table 3 (continued)
Organic Growth (non-GAAP) - by Segment For the Three Months Ended March 31, 2018 and 2017 (unaudited)
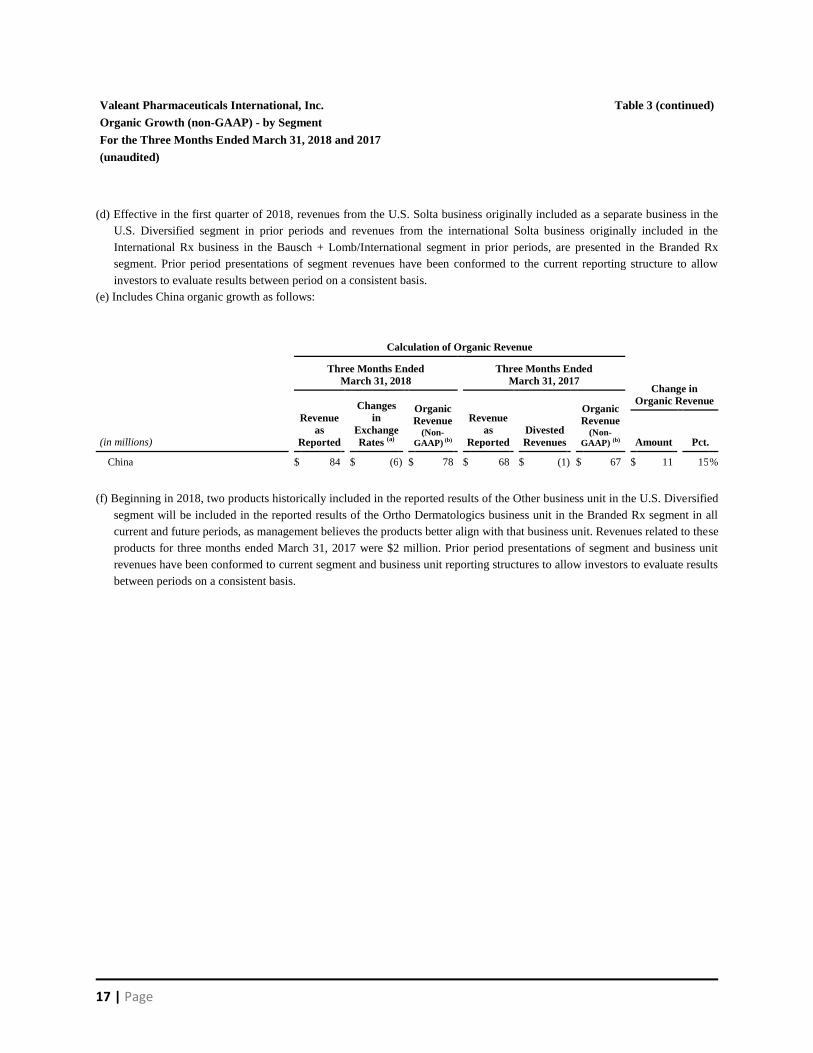
(d) Effective in the first quarter of 2018, revenues from the U.S. Solta business originally included as a separate business in the
U.S. Diversified segment in prior periods and revenues from the international Solta business originally included in the
International Rx business in the Bausch + Lomb/International segment in prior periods, are presented in the Branded Rx
segment. Prior period presentations of segment revenues have been conformed to the current reporting structure to allow
investors to evaluate results between period on a consistent basis.
(e) Includes China organic growth as follows:
Calculation of Organic Revenue
Three Months Ended
March 31, 2018 Three Months Ended
March 31, 2017 Change in
Organic Revenue Revenue
as
Reported
Changes
in
Exchange
Rates (a)
Organic
Revenue (Non-
GAAP) (b)
Revenue
as
Reported
Divested
Revenues
Organic
Revenue (Non-
GAAP) (b) (in millions) Amount Pct.
China $ 84 $ (6 ) $ 78 $ 68 $ (1 ) $ 67 $ 11 15 %
(f) Beginning in 2018, two products historically included in the reported results of the Other business unit in the U.S. Diversified
segment will be included in the reported results of the Ortho Dermatologics business unit in the Branded Rx segment in all
current and future periods, as management believes the products better align with that business unit. Revenues related to these
products for three months ended March 31, 2017 were $2 million. Prior period presentations of segment and business unit
revenues have been conformed to current segment and business unit reporting structures to allow investors to evaluate results
between periods on a consistent basis.

18 | Page
Valeant Pharmaceuticals International, Inc. Table 4
Consolidated Balance Sheet and Other Financial Information (unaudited)
(in millions) March 31,
2018 December 31,
2017
Cash Balances Cash and cash equivalents $ 909 $ 720 Restricted cash — 77
Cash, cash equivalents and restricted cash $ 909 $ 797
Debt Balances
Senior Secured Credit Facilities: Revolving Credit Facility $ 250 $ 250 Series F Tranche B Term Loan Facility 3,225 3,420
Senior Secured Notes 4,941 4,939 Senior Unsecured Notes:
5.375% Senior Unsecured Notes due March 2020 688 1,699 7.00% Senior Unsecured Notes due October 2020 — 71 6.375% Senior Unsecured Notes due October 2020 294 656 9.25% Senior Unsecured Notes due 2026 1,480 — All other Senior Unsecured Notes 14,376 14,394
Other 14 15
Total long-term debt, net of unamortized discounts and issuance costs 25,268 25,444 Plus: Unamortized discounts and issuance costs 299 308
Maturities of debt $ 25,567 $ 25,752
Maturities of Debt
Remainder of 2018 $ 2 $ 209 2019 — — 2020 1,237 2,690 2021 3,103 3,175 2022 5,115 5,115 2023 6,098 6,051 Thereafter 10,012 8,512
Maturities of debt $ 25,567 $ 25,752
2018 2017
Cash provided by operating activities - Three months ended March 31 $ 438 $ 954