vaibhav global limited - amazon web services
TRANSCRIPT

Vaibhav Global
LimitedFinancial Results Presentation – Q4 & FY2020
Global Retailer of Fashion Jewellery,
Accessories, Lifestyle and Essential Products on
Home Shopping TV and e-Commerce Platforms

Investor Presentation May 2020
Certain statements in this document may be forward-looking statements. Such forward-looking statements are
subject to certain risks and uncertainties like regulatory changes, local political or economic developments and
many other factors that could cause our actual results to differ materially from those contemplated by the relevant
forward-looking statements.
Vaibhav Global Limited will not be in any way responsible for any action taken based on such statements and
undertakes no obligation to publicly update these forward looking statements to reflect subsequent events or
circumstances.
2

Investor Presentation May 2020
MD’s Message“The year 2020 began on an unexpected and a difficult note with the entire world coming to a standstill due to
the spread of the COVID-19 pandemic. Economic activity, manufacturing operations, global supply chains have
been disrupted and consumption patterns altered - impacting established frameworks both at macro as well as
micro levels.
Now more than ever, our commitment to all our stakeholders remains un-wavered. Adapting rapidly to the new
normal, we implemented best practices for the safety of our employees while ensuring business continuity.
Stepping up to the situation, we realigned our business to meet customer needs through uninterrupted supply of
essentials. As an expression of gratitude to frontline healthcare workers, we donated ~127,500 masks to
hospitals / care homes. Extending support to the government, post announcement of the lockdown, VGL donated
~1.6 million meals to migrants and people in need through Akshay Patra in Jaipur, India. Overall, through our
CSR initiative, the ‘One for One’ program, we have provided nearly 37 million meals to school children across
India, US, and UK.
I am glad to share that our global operations have been delivering on both societal as well as economic goals.
On constant currency basis, Shop LC, US, marked a growth of 9% y-o-y and TJC, UK, marked a growth of
17% y-o-y in Q4FY20. Despite higher returns witnessed during the quarter, the Company reported strong
profitability. We remain focused on strategic objectives of expanding the 4R’s underlying business performance –
widening Reach, growing new customer Registrations, improving customer Retention, and increasing Repeat
purchases. Success on these parameters has resulted in expanding market share, higher margins, and strong cash
flows. During the quarter, our Board of Directors approved a special dividend of Rs. 19.74 per equity share and
recommended a final dividend of Rs. 7 per share.
Going into FY21, we look forward to continuing our secular growth in the world where last mile delivery has
become the ‘new normal’. We remain confident about actualizing our business goals by delivering on our
responsibilities to our stakeholders.’
3
Commenting on Q4 & FY20performance, Mr. SunilAgrawal, Managing Director,Vaibhav Global said:

Investor Presentation May 2020
Covid-19 – VGL Response
4
Customers
Continued retail operations
in US & UK
Promptly altered product
offering to include over
250 essential items (hand
sanitizers, face masks, food
supplements etc.)
Necessary precautions
taken while delivering
products
Provided respite through
engaging
broadcasts/content
Team - VGL
Several initiativesundertaken to ensuremental, physical andfinancial well-being of ourteam
Adhered to high standardsof safety / sanitation
Smooth transition to Work-from-Home
Weekly ‘All Hands Meet’calls where managementaddresses the team toprovide comfort, inspireconfidence and allayconcerns
Community
Continued focus onmaintaining a healthyBalance Sheet
Cash and cash equivalentsof Rs. 257 crore as onMarch 31, 2020
Focused cost rationalization
Sustained pay-back in theform of dividends /buyback (Rs. 72 crorebuyback; Interim dividendof Rs. 7, Special dividendof Rs. 19.74 & Finaldividend recommended ofRs. 7 per equity share)
Investors
Donated ~1,27,500 masksto hospitals/care homesacross US, UK & India
Offered to give away freemasks to anyone whocannot afford it
Provided ~1.6 millionmeals to migrants andpeople in need throughAkshay Patra in Jaipur,India

Investor Presentation May 2020
Retail CustomersGlobal Supply Chain IT Support
Business Continuity During Covid - 19
Steady traction on retail platforms
resulting from expanded product
offering, shut down of traditional retail,
increased media consumption
Undisrupted call center functioning -
work-from-home set up for inhouse
customer service team; auto-routing to
outsourced call centers; integration of
Five9 software into our IVR system
supported high traffic on the platforms
Delivered system enhancements at a
high velocity to support business in
selling essential items that need special
capabilities
Ancillary services like delivery services
remained functional all through
pandemic at both US and UK.
Robust regional supply chain - wholly
owned subsidiaries/operations in key
sourcing geographies (India, China,
Thailand & Indonesia)
Temporary shut down in China balanced
by efficiently managing inventory &
leveraging global supply chain -
Resumed operations on March 02, 2020
End-March lockdown in India resulted in
temporary closure of operations – work-
from-home facilitated wherever possible
– resumed partial operations on April
27, 2020
Sourcing infrastructure enabled prudent
time to market of essential products
Processes set up for virtual
buying/sourcing
IT staff created a “Borderless
workforce” to support business globally
with no latency
Facilitated virtual meetings in a secured
manner
Remote TV production and broadcast
solution built and validated - made
available as a contingency plan
Zero downtime for critical systems
(Order Management system, Website,
Mobile and Production systems)
5

Investor Presentation May 2020
Table of Contents
6
07 13 19Business
Background
Details
Q4 & FY20
Financial
Performance
Financial
Performance
Trends

Business
Background Details

Investor Presentation May 2020 8
End-to-end B2C business model
Significant geographical cost arbitrage
Proprietary TV home-shopping and e-
commerce platforms
Entire B2C sales is through credit cards
Professional management team with deep
industry knowledge
Strong and Independent Board with
global retail experience
KPMG – Global Auditors
Investments in customer interface,
production, warehousing facilities, supply
chain, CRM & ERP
Scalable model with limited capex
requirement
TV Homes accessed (*FTE) - 99 million
Growing online presence
Improving customer engagement metrics –
customer base, retention rate, repeat
purchases
Omni-channel B2C retail presence in
developed markets – unique achievement
for an Indian Company
Growing recognition of deep value
fashion jewellery enables scaling to
adjacent categories
Every piece sold results in one meal for a
school-going child
Provided ~37 mn meals so far across
India, US and UK
Vertically-
integrated
fashion retailer
on electronic
retail platforms
Shop LC and
TJC are brands
with strong
customer
visibility
Robust customer
engagement
Exceptional
one-for-one
social program
Solid
infrastructure
backbone
Strong
management
and governance
*FTE - Full Time Equivalent

Investor Presentation May 2020
Adaptative Business Model
9
Mobile sales contributed 60% of web revenue in FY20
Omni-channel customer has a higher lifetime value
Cord-cutting in the US is addressed through increased outreach on
the OTA platforms; deeper penetration in the OTT space81%
19%
FY16
67%
33%
FY20
Non-jewellery categories provides synergistic adjacency to our
fashion jewellery portfolio at similar price points
Helps target a larger wallet share
Enables deeper customer engagement
Effected quick turnaround in product offering to include essentials
Launched ‘Budget Pay’ in 2016 offering products on EMI
Low risk of bad-debts on account of auto-charge to customer
credit card & efficient collection systems61%
39%
FY20
92%
8%
FY16
91%
9%
FY16
78%
22%
FY20
Note - B2C revenue breakup

Investor Presentation May 2020
74 million households
State-of-the-art auction/scheduling system
Shop LC live stream available on multiple platforms like Youtube, Facebook
25 million households
State-of-the-art auction/scheduling system
TjC live stream available on multiple platforms like Youtube, Facebook
https://www.shoplc.com/
SAP Hybris platform
Pimcore – Digital Experience Platform
Targeted behavioral marketing through IBM Unica platform
https://www.tjc.co.uk/
Salesforce DemandWare platform
Europe delivery available through E-commerce platform
Targeted behavioral marketing through IBM Unica platform
Shop LC Mobile app for iOS and Android TJC Mobile app for iOS and Android
Shop LC broadcasts on Amazon Live
Available of Amazon (FBA), Google Marketplace, eBay, Walmart
Available on Amazon and eBay
Presence in 13 million Over The Air (OTA) households
Presence on several OTT platforms on Smart TV devices (android TV, Roku, Samsung Smart TV, Apple TV, Amazon Fire TV, LG smart TV) and linear streaming devices (Xumo, YoutubeLive and Facebook Live)
Presence in18.5 million Over the Air (OTA) households on Freeview & FreeSAT
Presence on several OTT platforms including Roku and Apple TV
Omni Channel Sales Platform
10
USA UK
www

Investor Presentation May 2020
Mitigating "Cord-Cutting" Trend in the US
11
83% 88%
64%
83%
Adults in the age group 18-44 Adults in the age group 45+
Pay -TV Service Subscribers
2013 2019
Source: Leichtman Research Group (LRG)
Over-the-Air (OTA) Presence
Over-the-Top (OTT) Reach
Shop LC is live with Smart Devices And Several Linear
Streaming Platforms
Strengthening Presence On Other Platforms
VGL’s Target Demographics Still Prefers Watching Traditional Pay-TV
Source: Kagan (S&P Global Market Intelligence)
Proprietary Web Platforms
Marketplaces
Social media Platforms
Mobile Devices
1719
1113
FY19 FY20
OTA Households (HH)US - OTA HH
Shop LC - OTA HH

Investor Presentation May 2020
Global Supply Chain
• ISO 9001:2008 facilities in Jaipur, Rajasthan
• Fully-integrated building at SEZ, Jaipur - IGBC certified
• Diamond jewelry manufacturing and sourcing unit in Mumbai
• Around 2,900 employees in India
• Low-Cost operations with one of the lowest levels of wastages in the industry
ManufacturingChina
US
UK
India
Thailand
Indonesia
• Supply chain capability of 12 million pieces from across the globe
• Sourcing from appropriate micro-markets in Asia, Europe and US
• Focus on best price to customer through bottom price discovery
• Robust vendor evaluation process
• Assess value perception –design / fashion trend / price in target markets
Sourcing
12
Q4 & FY20
Financial
Performance

Investor Presentation May 2020
Financials – Q4 & FY20 Performance (Revenue Breakdown – Rs. crore)
462 498
1,814 1,986
Q4FY19
Q4FY20
FY19 FY20
Revenue
282 326
1,157 1,285
Q4FY19
Q4FY20
FY19 FY20
TV Sales
153 169
510
633
Q4FY19
Q4FY20
FY19 FY20
Web Sales
27 3
147
69
Q4FY19
Q4FY20
FY19 FY20
B2B
Fashion Jewelry, Accessories & Lifestyle Products
14
Note:
• Revenue includes exchange gain as per Ind-AS
• B2B has been a non-core and opportunistic business segment
• In view of strong growth opportunities in B2C, the Company has been scaling down B2B

Investor Presentation May 2020
Financials – Q4 & FY20 Performance (Revenue Breakdown - Local Currency)
44.6 48.7
170.6
192.2
Q4 FY19 Q4 FY20 FY19 FY20
Shop LC (USD million)
15
12.7 14.9
51.4
60.9
Q4 FY19 Q4 FY20 FY19 FY20
TJC UK (GBP million)

Investor Presentation May 2020
Retail Performance Trends – Q4 & FY20 (Volume and ASP)
16
26.8
29.5
26.4
29.9
Q4 FY19 Q4 FY20 FY19 FY20
Average Selling Price US$
Web Sales
1,017 1,067
3,522 4,113
Q4 FY19 Q4 FY20 FY19 FY20
Sales Volume ('000s)
21.4
21.9
20.7
21.7
Q4 FY19 Q4 FY20 FY19 FY20
Average Selling Price US$
TV Sales
1,496 1,529
6,275 6,070
Q4 FY19 Q4 FY20 FY19 FY20
Sales Volume ('000s)
Investor Presentation May 2020
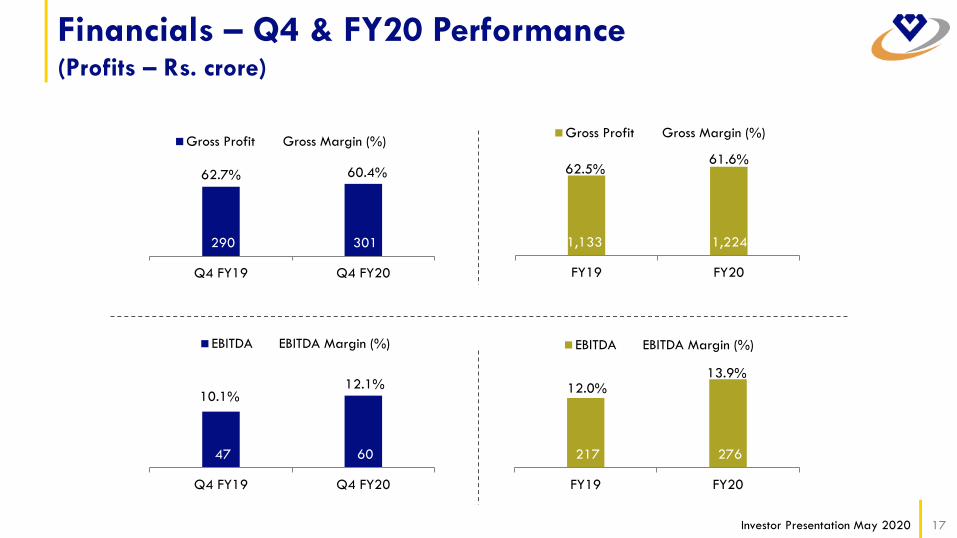
Financials – Q4 & FY20 Performance (Profits – Rs. crore)
17
290 301
62.7% 60.4%
Q4 FY19 Q4 FY20
Gross Profit Gross Margin (%)
47 60
10.1%12.1%
Q4 FY19 Q4 FY20
EBITDA EBITDA Margin (%)
217 276
12.0%13.9%
FY19 FY20
EBITDA EBITDA Margin (%)
1,133 1,224
62.5%61.6%
FY19 FY20
Gross Profit Gross Margin (%)

Investor Presentation May 2020
Financials – Q4 & FY20 Performance (Profits – Rs. crore)
18
154 190
8.5%9.6%
FY19 FY20
PAT PAT Margin (%)
9.95 12.25
47.2758.65
Q4 FY19 Q4 FY20 FY19 FY20
EPS (Rs.)
33 40
7.0%8.0%
Q4 FY19 Q4 FY20
PAT PAT Margin (%)

Financial
Performance
Trends
Investor Presentation May 2020
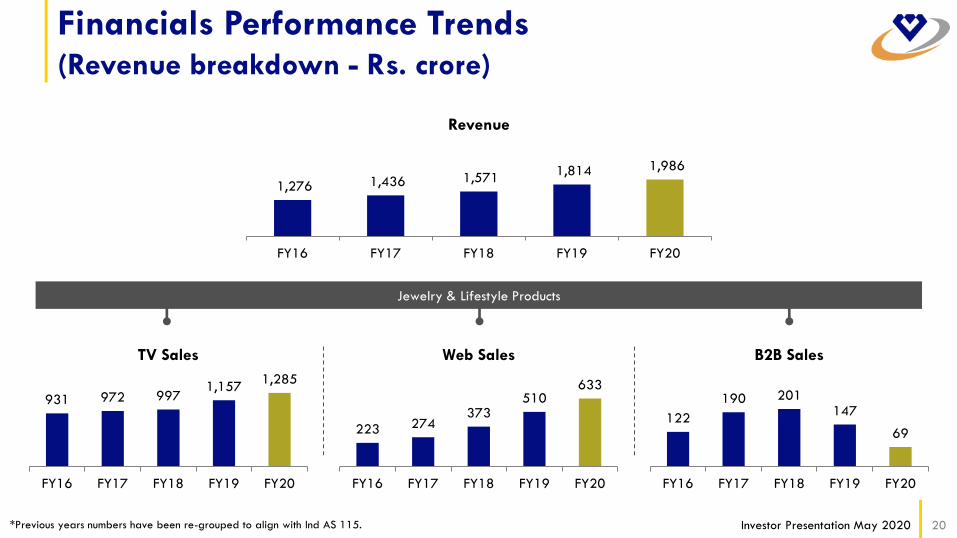
Financials Performance Trends (Revenue breakdown - Rs. crore)
20
1,276 1,436 1,571 1,814 1,986
FY16 FY17 FY18 FY19 FY20
Revenue
Jewelry & Lifestyle Products
122
190 201147
69
FY16 FY17 FY18 FY19 FY20
B2B Sales
931 972 9971,157
1,285
FY16 FY17 FY18 FY19 FY20
TV Sales
*Previous years numbers have been re-grouped to align with Ind AS 115.
223 274373
510633
FY16 FY17 FY18 FY19 FY20
Web Sales
Investor Presentation May 2020
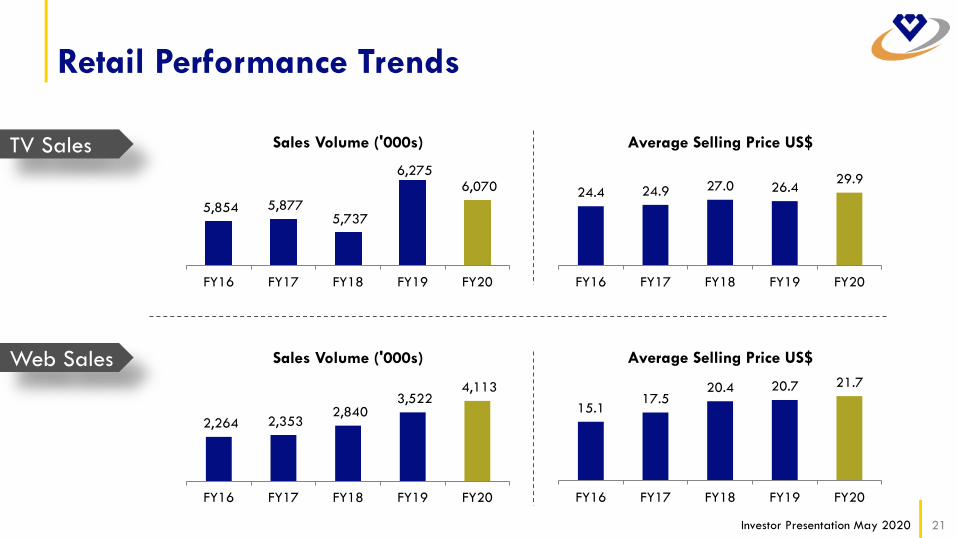
Retail Performance Trends
21
24.4 24.9 27.0 26.429.9
FY16 FY17 FY18 FY19 FY20
Average Selling Price US$
Web Sales
2,264 2,353 2,840
3,522 4,113
FY16 FY17 FY18 FY19 FY20
Sales Volume ('000s)
15.117.5
20.4 20.7 21.7
FY16 FY17 FY18 FY19 FY20
Average Selling Price US$
TV Sales
5,854 5,877 5,737
6,275 6,070
FY16 FY17 FY18 FY19 FY20
Sales Volume ('000s)

Investor Presentation May 2020
Financials Performance Trends (Profits – Rs. crore)
22
804 865 936 1,133 1,224
63.0% 60.1% 59.6%62.5%
61.6%
FY16 FY17 FY18 FY19 FY20
Gross Profit Gross Margin (%)
75 102 159 217 276
5.9%7.1%
10.1%12.0%
13.9%
FY16 FY17 FY18 FY19 FY20
EBITDA EBITDA Margin (%)

Investor Presentation May 2020
Financials Performance Trends (Profits – Rs. crore)
23
40 65 113 154 1903.1%
4.5%
7.2%
8.5%
9.6%
FY16 FY17 FY18 FY19 FY20
PAT PAT Margin (%)
12.2719.85
34.5547.27
58.65
FY16 FY17 FY18 FY19 FY20
EPS (Rs.)

Investor Presentation May 2020
Financial Performance Trends(Balance Sheet - Rs. crore)
24
129 126 120 117
** 163
FY16 FY17 FY18 FY19 FY20
Fixed assets including intangibles
55 6
(13)
(181)(194)
FY16 FY17 FY18 FY19 FY20
Net Debt
305 314
417 399 ** 394
FY16 FY17 FY18 FY19 FY20
Net Assets ***
379434
550
697 ** 751
FY16 FY17 FY18 FY19 FY20
Shareholders’ Equity
Note:
** Ind AS 116 – Leases, has become effective beginning 01 April 2019. The Group has adopted the standard beginning 01 April 2019.
*** Net Assets is the balancing figure arrived at by excluding shareholders equity, net debt, and fixed assets including intangibles

Investor Presentation May 2020
Financial Performance Trends (Cash Flow – Rs. crore)
25
(77)
52 20
181
61
176
FY16 FY17 FY18 FY19 Q4FY20 FY20
Free Cash Flow
(28)
70 38
203
68
211
FY16 FY17 FY18 FY19 Q4FY20 FY20
Operating Cash flow
Free Cash Flow: Operating Cash Flow – Capital
expenditure
Operating Cash Flow: PBT+ Depreciation-(Changes
in working capital) + adjustment for non-cash items
Note: Interest charges have been deducted and
Interest income has been added while calculating
operating cash flow.

Investor Presentation May 2020
Financial Performance Trends (Key Ratios)
26
13%18%
27%
37%
46%
FY16 FY17 FY18 FY19 FY20
ROCE (TTM)
12%16%
23% 25% 26%
FY16 FY17 FY18 FY19 FY20
ROE (TTM)
Note -
ROE – based on average net worth
ROCE – based on average capital employed

Investor Presentation May 2020
• Recognized as a ‘Great Place to Work’ in Greater China,
UK and India based on employee surveys conducted
• Shop LC received the ‘Governor’s Achievement Level’
recognition from Quality Texas Foundation for on-going
quality improvement and high performance.
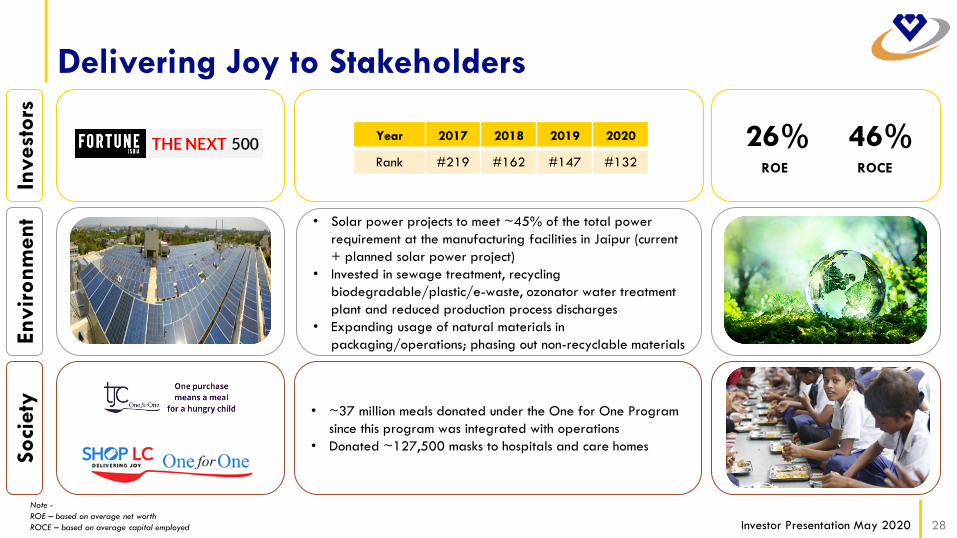
Delivering Joy to Stakeholders
27
• Unique Customers – 361,915 (FY20)
• Average qty. per customer – 30 pieces (FY20)
• High quality products & Exotic designs
• Lowest Price Guarantee – high quality, high affordability
• Omni-channel access
• Budget Pay (monthly installments) available on higher value
products
• Easy Returns available
Cust
om
ers
Em
plo
yees
https://quality-texas.org/
Investor Presentation May 2020
Delivering Joy to Stakeholders
28
• ~37 million meals donated under the One for One Program
since this program was integrated with operations
• Donated ~127,500 masks to hospitals and care homes
Soci
ety
• Solar power projects to meet ~45% of the total power
requirement at the manufacturing facilities in Jaipur (current
+ planned solar power project)
• Invested in sewage treatment, recycling
biodegradable/plastic/e-waste, ozonator water treatment
plant and reduced production process discharges
• Expanding usage of natural materials in
packaging/operations; phasing out non-recyclable materials En
vir
onm
ent
Invest
ors
26% 46%ROE ROCE
Year 2017 2018 2019 2020
Rank #219 #162 #147 #132
Note -
ROE – based on average net worth
ROCE – based on average capital employed

Investor Presentation May 2020
VGL Shareholder Base – As on 31st March, 2020
29
Promoter & Promoter Group
58.6%
Foreign Institutions (FPI,
FII) & NRI22.9%
Domestic Institutions (MF,
IFI))7.7%
AIF1.1%
Individual - >1%3.7% Others
6.0%
Shareholding PatternKey Shareholders (Holding 1%+)
Holding as on
31-Mar-2020
Promoter & Promoter Group 58.6%
Nalanda India Fund Limited (FII) 10.4%
Motilal Oswal Multicap 35 Fund (MF) 7.7%
Malabar India Fund Limited (FPI) 6.8%
Taiyo Greater India Fund Ltd (FPI) 2.3%
Vijay Kedia (Individual) 2.2%
Ashish Kacholia (Individual) 1.5%
Malabar Value Fund (AIF) 1.1%
Investor Presentation May 2020
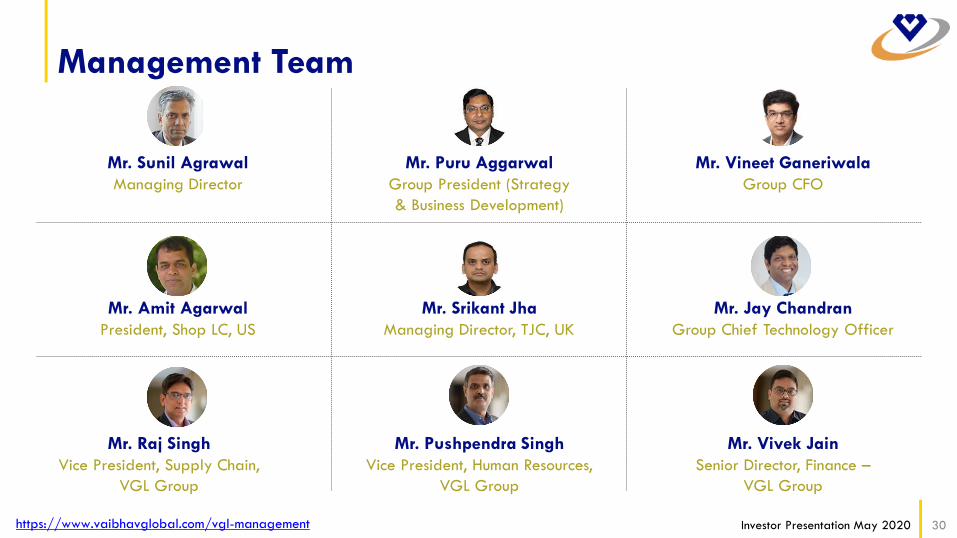
Management Team
30
Mr. Sunil Agrawal
Managing Director
Mr. Puru Aggarwal
Group President (Strategy
& Business Development)
Mr. Amit Agarwal
President, Shop LC, US
Mr. Jay Chandran
Group Chief Technology Officer
Mr. Srikant Jha
Managing Director, TJC, UK
Mr. Raj Singh
Vice President, Supply Chain,
VGL Group
Mr. Vivek Jain
Senior Director, Finance –
VGL Group
Mr. Pushpendra Singh
Vice President, Human Resources,
VGL Group
Mr. Vineet Ganeriwala
Group CFO
https://www.vaibhavglobal.com/vgl-management

Investor Presentation May 2020
Contact Information
31
For more information on
Vaibhav Global Limited,
please contact:
Vaibhav Global Limited
+91-141-2771975
Vineet Ganeriwala
Dipti Rajput
Shiv Muttoo
Karl Kolah
CDR India
+91 98335 57572 / 98330 10478

Thank You