vacuum drying of actual transuranic waste from hanford tanks · pnnl-14670 vacuum drying of actual...
TRANSCRIPT

PNNL-14670
Vacuum Drying of Actual Transuranic Waste from Hanford Tanks J. M. Tingey May 2004 Prepared for the U.S. Department of Energy under Contract DE-AC06-76RL01830

DISCLAIMER This report was prepared as an account of work sponsored by an agency of theUnited States Government. Neither the United States Government nor anyagency thereof, nor Battelle Memorial Institute, nor any of their employees,makes any warranty, express or implied, or assumes any legal liability orresponsibility for the accuracy, completeness, or usefulness of anyinformation, apparatus, product, or process disclosed, or represents thatits use would not infringe privately owned rights. Reference herein to any specific commercial product, process, or service by trade name, trademark,manufacturer, or otherwise does not necessarily constitute or imply itsendorsement, recommendation, or favoring by the United States Governmentor any agency thereof, or Battelle Memorial Institute. The views and opinionsof authors expressed herein do not necessarily state or reflect those of theUnited States Government or any agency thereof. PACIFIC NORTHWEST NATIONAL LABORATORY operated by BATTELLE for the UNITED STATES DEPARTMENT OF ENERGY under Contract DE-ACO6-76RLO183O Printed in the United States of America Available to DOE and DOE contractors from the Office of Scientific and Technical Information, P.O. Box 62, Oak Ridge, TN 37831-0062; ph: (865) 576-8401 fax: (865) 576-5728 email: [email protected] Available to the public from the National Technical Information Service, U.S. Department of Commerce, 5285 Port Royal Rd., Springfield, VA 22161 ph: (800) 553-6847 fax: (703) 605-6900 email: [email protected] online ordering: http://www.ntis.gov/ordering.htm
This document was printed on recycled paper. (8/00)

PNNL-14670
Vacuum Drying of Actual Transuranic Waste from Hanford Tanks
J. M. Tingey May 2004 Prepared for the U.S. Department of Energy under Contract DE-AC06-76RL01830 Pacific Northwest National Laboratory Richland, WA 99352

iii
Executive Summary
Composites of sludge from Tanks 241-B-203 (B-203), 241-T-203 (T-203), 241-T-204 (T-204), and 241-T-110 (T-110) at the Hanford Site were prepared at the Hanford 222-S Lab-oratory from core samples retrieved from these tanks. These tank composites may not be representative of the entire contents of the tank but provide some indication of the properties of the waste within the underground storage tanks. The composite samples were diluted with water at the Radiochemical Processing Laboratory at Pacific Northwest National Laboratory to represent the slurries that are expected to be received from tank retrieval operations and processed to produce a final waste stream. The dilutions were vacuum dried at 60°C and 26 in. of mercury (~ 100 torr). Semi-quantitative measurements of stickiness and cohesive strength were made on these dilutions as a function of drying time. Mass loss as a function of drying time and total solids concentration of the initial dilution and at the conclusion of drying were also measured. Visual observations of the sludge were recorded throughout the drying process.
The dilutions were prepared from the homogenized samples by adding distilled water to each and stirring the dilution to form a slurry with a water-to-sludge ratio of 1:1 by mass. Because the as-received T-110 samples had dried out during storage, an initial dilution was prepared by adding distilled water to prepare a composite that was more representative of the actual solids concentration when the sample was initially taken. Water was then added to this modified composite at a 1:1 ratio, mass of water to mass of modified composite. The solids content of all of the samples was measured by drying each sample in an oven at 105°C.
The behavior of nonradioactive waste simulants was compared with that of the dilutions from
these Hanford tank samples. A chemical simulant prepared for laboratory and pilot scale drying tests performed by RWE NUKEM Corporation at the laboratory and pilot facilities of Littleford Day, Inc., was included as one of these simulants. Other nonradioactive simulants consisted of clay (80% kaolin and 20% bentonite) mixed either with distilled water or with aqueous salt solutions of compositions similar to those observed in the tanks. The drying and settling behavior of the simulants prepared with distilled water were more representative of tank sample behavior than simulants prepared with aqueous salt solutions because the higher ionic strength in the salt solutions causes the clay particles to flocculate and settle.
The dilutions from Tanks B-203, T-203, and T-204 did not exhibit significant stickiness prior to drying. A Tank T-110 dilution at higher solids concentration (48.4 wt% total solids) exhibited some stickiness. At higher total solids concentrations obtained by vacuum drying, samples from Tanks B-203, T-203, and T-204 became sticky, as determined by weighing the amount of sludge adhering to a metal probe that had been inserted into and then removed from the sludge. These tank samples became sticky at solids contents between 18 and 30 wt%. The clay simulants suspended in water also became sticky at similar solid contents. Clay/aqueous salt solution simulants and the vacuum dried samples from Tank T-110 did not become as sticky as the other

iv
three actual waste samples and the clay/water simulants. The chemical simulant behaved like the Tank T-110 dilutions and became sticky at higher solid contents (approximately 50 wt% solids). Measurable cohesive strengths were observed only for the T-200 and B-200 series samples and the clay/water simulants at solids contents between 18 and 30 wt%. At higher water con-tents the samples were thin slurries and sludges, and at lower water contents these samples became hard chunks that did not adhere to one another. None of the clay/aqueous salt solution simulants exhibited significant cohesive strength. The 1:1 dilution from T-110 did not produce a cohesive material over the range of solid contents measured. Particle densities of the vacuum dried tank waste samples were measured by displacement in dodecane. The particle densities of all four tank composites were similar (2.34 to 2.64 g/mL). These particle densities are similar to the theoretical densities of the constituent nitrate and phosphate salts of sodium and potassium.

v
Contents
Executive Summary....................................................................................................................... iii
1.0 Introduction.............................................................................................................................1.1
1.1 Transuranic Process Wastes ............................................................................................1.1 1.2 Core Samples...................................................................................................................1.2 1.3 Clay Simulants ................................................................................................................1.5 1.4 Chemical Simulant ..........................................................................................................1.6
2.0 Methodology...........................................................................................................................2.1
2.1 Total Solids Concentration by Oven Drying...................................................................2.1 2.2 Stickiness.........................................................................................................................2.1 2.3 Cohesive Strength ...........................................................................................................2.2 2.4 Mass Loss........................................................................................................................2.2 2.5 Density ............................................................................................................................2.2
3.0 Results.....................................................................................................................................3.1
3.1 Mass Loss as a Function of Drying Time .......................................................................3.1 3.2 Stickiness.........................................................................................................................3.6 3.3 Cohesive Strength ...........................................................................................................3.8 3.4 Particle Density ...............................................................................................................3.9 3.5 Visual Observations ......................................................................................................3.10
4.0 Conclusions.............................................................................................................................4.1
5.0 References...............................................................................................................................5.1
Appendix: Mass Loss as a Function of Drying Time .................................................................A.1

vi
Figures 1.1 Tank Composite from Tank B-203 ...................................................................................... 1.3 1.2 Tank Composite from Tank T-110 ...................................................................................... 1.3 1.3 Dilutions of Composites T-203, B-203, T-204, and T-110 ................................................. 1.4 1.4 Clay Simulants Used in Vacuum Drying Tests ................................................................... 1.5 1.5 Batch of Six Samples Including Four Replicates of DMJM Chemical 2 Simulant............. 1.7 3.1 Mass Loss in wt% for the 200 Series Liquid Simulant........................................................ 3.2 3.2 Mass Loss in wt% for Clay Simulant at 15 wt% Total Solids Suspended in
200 Series Liquid Simulant.................................................................................................. 3.2 3.3 Mass Loss in wt% for the 1:1 Dilution of the Tank B-203 Composite ............................... 3.3 3.4 Mass Loss in wt% for the 1:1 Dilution of the Tank T-110 Composite ............................... 3.3 3.5 Mass Loss in wt% for the DMJM Chemical Simulant ........................................................ 3.4 3.6 Comparison of the Relative Mass Loss Percent for Each Sample Type
as a Function of Drying Time .............................................................................................. 3.5 3.7 Mass Loss of the T-204 Samples as a Function of Drying Time......................................... 3.5 3.8 Drying Time Comparison .................................................................................................... 3.6 3.9 Stickiness of Tank Samples ................................................................................................. 3.7 3.10 Stickiness of Clay/Water Simulants Compared with Tank T-204 Samples ........................ 3.8 3.11 Tank T-204 and Clay/Water Simulants at Conclusion of Drying Test.............................. 3.11 3.12 Replicates of DMJM Chemical #2 Simulant and 15 and 18 wt% Total Solid Simulants . 3.12 3.13 Clay/Aqueous Salt Solution Simulants at Conclusion of Drying Test .............................. 3.12 3.14 Chemical Simulant and Clay/Water Simulants at Conclusion of Drying Test.................. 3.12

vii
Tables 1.1 Water Concentrations of Original Core Samples and Archived Tank Composites.............. 1.3 1.2 Tank Sample Dilutions ......................................................................................................... 1.4 1.3 Compositions of the Aqueous Salt Solutions........................................................................ 1.6 1.4 Solids Content of the Vacuum Drying Samples ................................................................... 1.6 1.5 Chemical Composition of DMJM Chemical 2 Simulant...................................................... 1.7 3.1 Particle Densities .................................................................................................................. 3.9 3.2 Constituent Salt Densities ................................................................................................... 3.10

1.1
1.0 Introduction
Supplemental technologies are being identified to accelerate the Hanford tank waste cleanup. Methods and equipment to solidify and package the transuranic (TRU) process wastes contained in 10 single-shell tanks (SSTs) are part of the supplemental technologies being evaluated. The resulting TRU package and waste must be acceptable for disposal at the Waste Isolation Pilot Plant (WIPP).
A modified dry retrieval process has been proposed to remove the waste from these 10
Hanford SSTs. A recycled aqueous stream flowing at approximately 1 to 5 gpm will be used to mobilize the waste in the tanks and transfer the diluted waste to a storage vessel. A significant fraction of the liquid in this diluted waste stream must then be removed to meet the WIPP disposal criteria. A vacuum drying method has been selected for removing the free moisture from this diluted waste. An absorbent may be added to the waste package to prevent separation of free liquid during handling and transport.
Scoping studies are needed to provide initial data on the physical properties of the waste and
selected simulants during vacuum drying and to validate simulant tests in the prototypical vacuum drying system. These scoping studies must include vacuum drying data on actual tank waste samples and on potential surrogates for the vacuum drying process to confirm the validity of the surrogates.
1.1 Transuranic Process Wastes To date, 13 Hanford waste tanks have been designated as potentially containing TRU process
wastes. The TRU wastes are found in three double-shell tanks (DSTs) (AW-103, AW-105, and SY-102) and 10 single-shell tanks (SSTs) (B-201 through B-204, T-201 through T-204, T-110, and T-111). Waste from Tank T-110 was initially classified as low-level waste but is being considered a candidate for designation as potentially containing TRU process waste (Gasper et al. 2002).
The sludge contained in Tank SY-102 was produced in the Plutonium Finishing Plant, and
the sludges in Tanks AW-103 and AW-105 were produced from chemical dissolution of the Zircaloy cladding on irradiated nuclear fuel elements processed in the Plutonium Uranium Extraction (PUREX) Plant.
The waste in SSTs B-201 through B-204 and T-201 through T-204 was initially produced in
the 224-B or 224-T Building operation as part of the plutonium concentration cycle in the bismuth phosphate process (DuPont 1944). The waste in SSTs T-110 and T-111 also received waste from the 224-T Building as well as second plutonium decontamination cycle waste (2C) produced in the 221-T Plant, also as part of the bismuth phosphate process (DuPont 1944). The

1.2
224-B/224-T Building waste and 2C waste comprised solid and supernatant fractions. The solids were settled in these tanks (Gasper et al. 2002; Anderson 1990). The bulk of the fission product and plutonium activity settled out with precipitated phosphates and lanthanum fluoride. Fission-product activity of the supernatant fraction of these wastes was low enough (<0.001% of the activity in the source material) to permit ground disposal.
1.2 Core Samples
Samples of waste from Tanks B-203, T-203, T-204, and T-110 were obtained in top-to-bottom cores. Hanford tank waste composites were prepared from segments of these core samples that were archived in the hot cells of the 222-S Laboratory. The core composites were prepared in the 222-S Laboratory and transferred to the Radiochemical Processing Laboratory at Pacific Northwest National Laboratory (PNNL). A detailed description of the composite preparation is provided in a Fluor Hanford, Inc., letter.(a)
Chemical and radiochemical analysis of similar composites from the same Hanford tanks (B-203, T-110, T-203, and T-204) are provided in a separate report by Cooke (2003). An assess-ment of the physical properties of the TRU process wastes has been published based on previous results obtained on Hanford tank core samples from the 10 SSTs considered TRU process waste tanks (Rassat et al. 2003a). The results of the rheological and physical properties measurements for these four composites and dilutions (30 wt%, 1:1, and 1:4) of these composites were reported previously (Tingey et al. 2003). During handling and storage of these core samples water evaporated, resulting in composites with water concentrations lower than initially observed for these materials. The original water concentrations of core samples from Tanks T-110, T-204, B-203, and T-203 range from 64 to 82 wt% (Rassat et al. 2003a). Table 1.1 summarizes the water concentrations of the original core samples, the corresponding archived samples based on weight percent solids measurements after drying at 105°C, and the range of possible water loss. Composites from Tanks B-203, T-203, and T-204 maintained enough water to form a moist sludge (Figure 1.1). The composite from Tank T-110 contained some moisture but was dry and crumbly (Figure 1.2).
Based on the measured solids concentration of the composite samples, water was slowly added to the tank samples to prepare composites at solids concentrations similar to those of the cores retrieved from the tanks (approximately 30 wt% solids, or 70 wt% water). The resulting slurry was stirred to form a homogeneous sample. More water was added to a subsample of each composite to form dilutions at water-to-composite mass ratios of 1:1 to simulate the water added during retrieval. The four 1:1 dilutions from these tank composites are shown in Figure 1.3.
(a) Cooke GA. 2003. "Large Composite and Shipment: Mission Acceleration Initiative (MAI) Transuranic (TRU) Large Composite Preparation and Shipment to Pacific Northwest National Laboratory (PNNL)." Letter FH-0301349, Fluor Hanford Inc., Richland, WA.

1.3
Table 1.1. Water Concentrations of Original Core Samples and Archived Tank Composites
Water Concentration (wt%) Tank Core Original Core
Samples Archived Tank
Composites
Range of Water Loss(wt%)
241-B-203 120, 122 64 – 82 60 4 – 22 241-T-203 190 73 – 76 66 7 – 10 241-T-204 188 72 – 80 69 3 – 11 241-T-110 180, 181 73 – 80 38 35 – 42
Figure 1.1. Tank Composite from Tank B-203 (composites from Tanks T-203 and T-204 had a similar appearance)
Figure 1.2. Tank Composite from Tank T-110

1.4
Figure 1.3. Dilutions of Composites T-203 (32), B-203 (31), T-204 (26), and T-110 (25)
Because the water concentration of the composite from Tank T-110 was so much lower than that observed in the original core samples, the 1:1 dilution of the Tank T-110 composite was based on a 1:1 mass ratio of water to T-110 tank sample. The solids concentration was equiva-lent to the average solids concentration of the core composites from the other three tanks, as measured by thermogravimetric analysis (TGA) (37.6 wt% solids). The 1:1 dilutions were homogenized by mixing the water into the composite sample with a plastic spatula. In some instances, large chunks of solids were reduced in size by applying pressure with the spatula. The ratio of water to the as-received tank composite for each dilution is summarized in Table 1.2. For the Tank T-110 composite, this ratio represented an addition of approximately 1.2 parts of water to 1 part composite to prepare a sample that was more repre-sentative of the waste in the tank. This sample was then diluted with 1 part water to 1 part diluted sample to produce a final dilution that represents a 1:1 dilution of water to existing tank waste. Overall, this dilution was actually prepared by adding 2.43 parts of water to 1 part of the as-received composite from Tank T-110 (see Table 1.2).
Table 1.2. Tank Sample Dilutions
Tank No. Ratio of Water added to As-Received Composite
T-110 2.43 T-204 1.00 B-203 1.00 T-203 1.00

1.5
1.3 Clay Simulants
Nonradioactive simulants will be needed to test the vacuum drying system before drying radioactive samples. The ideal simulant would be nonradioactive and nonhazardous and mimic the behavior of the actual waste during the vacuum drying process. Eight clay simulants were tested along with the four 1:1 dilutions of the tank waste composites. The eight clay simulants are shown in Figure 1.4.
Figure 1.4. Clay Simulants Used in Vacuum Drying Tests. Samples are shown after 1 hour of settling. The simulants are, from left to right:
1. 200 series liquid simulant with no clay added 2. 200 series liquid simulant with clay added to obtain a slurry with 15% total solids
(including dissolved salts) 3. 200 series liquid simulant with 15% clay by mass 4. T-110 liquid simulant with no clay added 5. T-110 liquid simulant with clay added to obtain a slurry with 15% total solids
(including dissolved salts) 6. T-110 liquid simulant with 15% clay by mass 7. Clay added to distilled water to obtain a slurry with 15 wt% total solids 8. Clay added to distilled water to obtain a slurry with 18 wt% total solids.
An 80% kaolin and 20% bentonite clay mix was used for these tests. Aqueous salt solutions that simulated the liquid fraction of the actual tank waste and distilled water were used as the suspending media. The compositions of the aqueous salt solutions are described in detail in Rassat et al. (2003b) and are summarized in Table 1.3. The aqueous salt solutions do not include the ammonia and oxalate that have been included in the latest liquid simulants, but the absence of these compounds should not affect the results of these tests significantly. The total solids, dissolved solids, and undissolved solids concentrations of these simulants as well as the suspending media are described in Table 1.4. The total solids concentrations of the 1:1 dilutions of the tank waste samples tested are also reported in Table 1.4.

1.6
Table 1.3. Compositions of the Aqueous Salt Solutions
Concentration, M Chemical Formula B- and T-200 Series Tanks
(pH 12 Target) Tank T-110
(pH 8.4 Target) NaO2CCH3 0.00400 0.00092 NaCl 0.0224 0.0372 NaF 0.284 0.221 Na3PO4.12H2O 0.0139 NA(a)
Na2HPO4.7H2O NA 0.1139 Na2SO4 0.0025 0.0402 NaNO3 0.617 1.172 KNO3 0.133 0.00813 Na2SiO3.5H2O 0.0021 0.00303 Na2CrO4.4H2O 0.00152 0.000731 NaOH 0.020 NA NaNO2 0.0210 0.0087 Na2CO3 0.181 NA
(a) NA = Not added.
Table 1.4. Solids Content of the Vacuum Drying Samples
Solids Content (wt%) Sample Dissolved Solids Undissolved Solids Total Solids
Simulant (suspending media) T-110 Liquid 7 0 7 15% Clay (T-110)(a) 5 15 20 15% TS (T-110)(a) 6 9 15 200 Series Liquid 5 0 5 15% Clay (200)(b) 3.5 15 18.5 15% TS (200)(b) 4 11 15 15% Clay (water) 0 15 15 18% Clay (water) 0 18 18 Tank Waste T-110 15.9 T-204 15.9 B-203 20.7 T-203 17.1 (a) Tank T-110 liquid simulant with a target pH of 8.4 (see Table 1.3). (b) B- and T-200 series tank liquid simulant at a target pH of 12 (see Table 1.3).
1.4 Chemical Simulant Laboratory and pilot-scale drying tests of several tank waste simulants were performed by RWE NUKEM Corporation at the laboratory and pilot facilities of Littleford Day, Inc. A concentrate dryer that used heat in conjunction with a vacuum was used for these drying tests.

1.7
To simulate the behavior of the actual tank wastes better, chemical simulants were prepared for additional drying tests. A sample of one of these chemical simulants (DMJM Chem 2 Simulant) was transferred to PNNL, and vacuum tests similar to those performed on the clay simulants and actual wastes were performed with this simulant. These chemical simulants are shown in Figure 1.5. The composition of this simulant is provided in Table 1.5.
Figure 1.5. Batch of Six Samples Including Four Replicates of the DMJM Chemical 2 Simulant. Samples 5 and 6 are 15 and 18 wt%, respectively, of the 80% kaolin and 20% bentonite clay mixture suspended in distilled water.
Table 1.5. Chemical Composition of DMJM Chemical 2 Simulant
Analyte Concentration (M) Compound Concentration
(M) Al3+ 0.0124 Al(OH)3 0.0124 Bi3+ 0.0474 Bi(NO3)3·5H2O 0.0474 Ca2+ 0.0216 Ca(OH)2 0.0216 F- 0.0862 NaF 0.0862 Fe3+ 0.0396 Fe(NO3)3·9H2O 0.0396 K+ 0.0168 KOH 0.0168 La3+ 0.0058 La(NO3)3.6H2O 0.0058 Mn2+ 0.0173 Mn(NO3)2·6H2O 0.0173 Na+ 0.7108 NO2
- 0.0633 NaNO2 0.0633 NO3
- 0.3129 PO4
3- 0.1166 Na2HPO4·7H2O 0.1166 Si 0.0307 Na2SiO3·5H2O 0.0307 SO4
2- 0.0445 Na2SO4 0.0445 TIC 0.0684 Na2CO3 0.0684 TOC 0.0407 Na2C2O4 0.0204 Target pH 8.4 Target Solids 21%
2.1
2.0 Methodology The physical properties of the four tank composites during vacuum drying were measured and compared with those of simulants under these same drying conditions. A small quantity (~30 g) of a 1:1 dilution from each of the composites (~15 wt% solids) was vacuum dried at approximately 60ºC and a vacuum of 26 inches of mercury (Hg). This vacuum corresponds to a pressure of approximately 100 torr. These conditions are similar to the drying conditions being evaluated for full-scale operations. The moisture content of the samples was measured at the start and end of vacuum drying. At various times during the drying process, stickiness and cohesive strength were measured on the sample by a soil penetrometer. Mass loss as a function of drying time was also measured on each sample. Visual observations during the drying process were also recorded. Before each measurement, the samples were agitated with a vortex mixer. The mixing served not only to homogenize the sample but also to shear-thin or shear-thicken the sample to more accurately reflect its properties under projected process conditions (i.e., with agitation). All mass measurements were conducted using a calibrated balance. The calibration of the balance was checked before each batch using a standard weight to ensure that the balance was operating properly.
2.1 Total Solids Concentration by Oven Drying
Total solids concentrations of the tank samples and simulants were determined in duplicate according to PNNL technical procedure RPL-COLLOID-02.(a) More than 2 g of material was weighed and then dried to obtain the total solids concentration. The mass of the sample was measured before and after drying. A digital controller was used to control the temperature in the drying oven at 105 ± 2°C. A calibrated thermometer was used to measure the temperature in the oven. After 24 hours of drying, the samples were removed from the oven and allowed to cool, and the mass of the sample was measured. The samples were again placed in the oven at 105°C for a minimum of 15 hours. The dried samples were weighed again to ensure that no significant additional mass was lost (<2% difference).
2.2 Stickiness A qualitative evaluation of the “stickiness” of the sample was determined by weighing the amount of material that adhered to the surface of a 15-mm-diameter cylindrical stainless steel plate after it was pushed into the sample. The plate was 7 mm thick and was pushed into the
(a) RPL-COLLOID-02, “Measurement of Physical and Rheological Properties of Solutions, Slurries, and Sludges,” Rev. 0.

2.2
sample until the sides were completely immersed but the top not covered. After the plate was removed from the sample, it was allowed to drain until no additional drops were observed. The plate was then weighed to determine the mass of sludge adhering to the plate.
2.3 Cohesive Strength A semi-quantitative indication of the cohesive strength of the samples was determined by measuring the force required to push the 15-mm-diameter cylindrical plate 7 mm into the sample. The force required to penetrate the sample divided by the surface area of the plate provides an indication of the cohesive strength of the sample. Similar methods are used to determine the cohesive strength of soils (Sowers 1963).
2.4 Mass Loss The mass of each sample was measured as a function of drying time. Each time samples were removed from the vacuum drying oven, they were weighed before and after, measuring stickiness and cohesive strength. Although some sample mass is lost during stickiness and co-hesive strength measurements, weighing before and after these tests monitors sample loss and allows accurate calculation of water loss as a function of time. A duplicate sample was dried for many of the simulants and tank samples where only mass loss measurements were made. These samples served as a check to ensure that sample loss from stickiness and cohesive strength did not interfere with water loss determinations.
2.5 Density The densities of the vacuum-dried wastes from Tanks T-110, T-204, B-203, and T-203 were measured in duplicate by displacement. A small mass (1 to 2 grams) of the vacuum-dried sample was placed in a volumetric flask and weighed. Dodecane was then added to the flask to the volume mark, and the added mass of dodecane was measured. A 10-mL volumetric flask was used to make the measurements for Tanks T-204, B-203, and T-203, and a 100-mL volumetric flask was used to make the measurements on the Tank T-110 sample. The density of dodecane used was measured in a 100-mL volumetric flask similar to those used to determine the density of the Tank T-110 sample. From the density and mass of dodecane and the total (sample plus dodecane) mass and volume, the volume and density of the sample can be calculated. One of the duplicates from each sample was pulverized to determine whether using dodecane resulted in an offset in the data due to incomplete wetting of the particles.

3.1
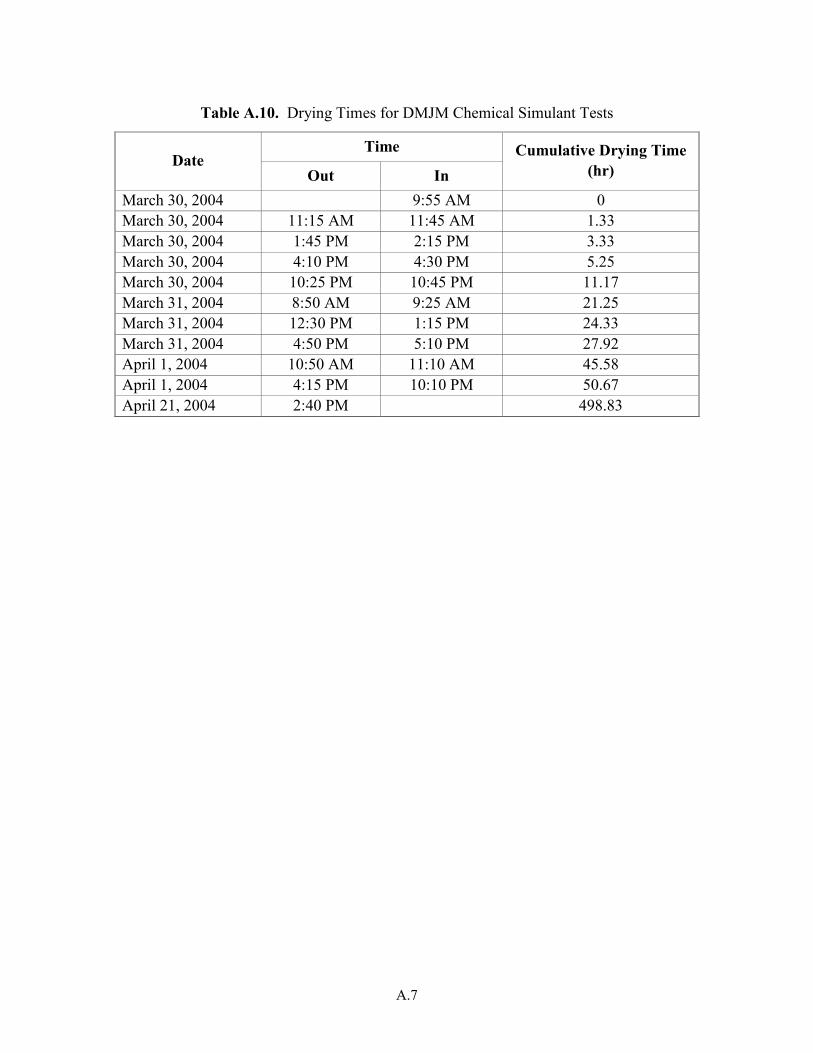
3.0 Results Duplicate samples of the 1:1 dilution of each of the four tank composites (T-203, B-203, T-204, and T-110) were dried in a vacuum oven at 60ºC and a vacuum of 26 inches of Hg (0.87 atm of vacuum or 0.13 atm of pressure). Mass loss of the sample was measured as a function of drying time. Measurements of stickiness and cohesive strength were also made on these samples as a function of drying time. Duplicate samples of six clay/aqueous salt solution simulants were dried and tested under similar conditions. The two aqueous salt solutions represented the liquid fraction of the T-110 and 200 series tanks. Additional drying tests were performed on duplicate samples of the 1:1 dilution of the Tank T-204 composite to obtain more data at the drying times when the samples appeared to be the stickiest. Two additional clay/water simulants were prepared and added to these tests to see whether these simulants better represented the physical properties of the tank samples. Additional drying tests were also performed on duplicate samples of the DMJM chemical simulant. Measurements of stickiness and cohesive strength as well as mass loss (moisture content) as a function of drying time were made on two samples of the chemical simulant. Mass loss as a function of drying time was the only measurement made on two other subsamples of the chemical simulant. Samples of the clay/water simulants were tested alongside this chemical simulant to provide a direct comparison of these simulants. The results from these additional tests were compared with the results from previous tests. The times at which measurements were made on each set of samples and the cumulative drying times are reported in the appendix (Tables A.8, A.9, and A.10). Multiple measurements were made during the initial 24 hours of drying. After the first 24 hours, measurements were taken less frequently, with cumulative drying times approaching 500 hours during one of the vacuum drying tests.
3.1 Mass Loss as a Function of Drying Time The mass loss of each sample is provided as a function of time in the appendix. Mass loss as a function of time was the only measurement made on one of the duplicate samples. Cohesive strength and stickiness as well as mass loss were measured on the other duplicate sample; there-fore, the actual mass loss from drying had to be calculated based on the amount of material lost to the penetrometer probe during these other tests. A comparison of the results from these duplicate samples for each type of sample from the initial tests (e.g., liquid simulant, liquid simulant with clay, tank waste, and chemical simulant) is provided in Figures 3.1 through 3.5. The horizontal dotted line is the water concentration in weight percent measured by oven drying at 105°C.

3.2
Drying Time (hours)0 30 60 90 120 150
Mas
s Lo
ss (w
t%)
0
20
40
60
80
100
Bulk SampleMass Loss Sample
Figure 3.1. Mass Loss in wt% for the 200 Series Liquid Simulant
Drying Time (hours)0 30 60 90 120 150
Mas
s Lo
ss (w
t%)
0
20
40
60
80
100
Bulk SampleMass Loss Sample
Figure 3.2. Mass Loss in wt% for Clay Simulant at 15 wt% Total Solids Suspended in 200 Series Liquid Simulant

3.3
Drying Time (hours)0 30 60 90 120 150
Mas
s Lo
ss (w
t%)
0
20
40
60
80
100Bulk SampleMass Loss Sample
Figure 3.3. Mass Loss in wt% for the 1:1 Dilution of the Tank B-203 Composite
Drying Time (hours)0 30 60 90 120 150
Mas
s Lo
ss (w
t%)
0
20
40
60
80
100Bulk SampleMass Loss Sample
Figure 3.4. Mass Loss in wt% for the 1:1 Dilution of the Tank T-110 Composite

3.4
Drying Time (hours)0 30 60 90 120 150
Mas
s Lo
ss (w
t%)
0
20
40
60
80
100Bulk SampleMass Loss Sample
Figure 3.5. Mass Loss in wt% for the DMJM Chemical Simulant
The results of the duplicate samples were fairly consistent even with the calculation that was required to correct for the sample lost due to other testing in one of the duplicates. The mass loss results from the liquid simulants (aqueous salt solutions) and clay simulants suspended in these two aqueous salt solutions are compared in Figure 3.6. The mass loss is reported as the percent-age of mass loss during vacuum drying with respect to the total mass loss measured in a drying oven at 105°C. The mass losses for all four sample types as a function of drying time are very similar even though the final products from the drying of these samples are significantly different. In Figures 3.1 through 3.5, the early drying data indicate that drying rate (i.e., slope of the curve) may be slowing, but the lack of data between the last two points (24 and 138 hours) does not allow the drying behavior after 24 hours to be accurately determined. Additional tests were performed on duplicate samples of a single tank dilution (T-204) to better determine the drying behavior of the samples after 24 hours. Additional testing was performed on only one tank sample because similar drying behavior was observed for all tank samples, as shown in Figure 3.6. A comparison of the mass loss of these additional samples and the initial sample is provided in Figure 3.7. The data suggest that the majority of the drying is complete in approximately 48 hours. Fairly good agreement was observed among these samples. Drying rates of the 1:1 dilution from Tank T-204 are compared with all of the simulants and 1:1 dilutions of other tank samples in Figure 3.8. It appears that all of the samples and simulants have similar drying rates.

3.5
Drying Time (hours)0 30 60 90 120 150
Rel
ativ
e M
ass
Loss
(wt%
)
0
20
40
60
80
100Clay/Liquid SimulantLiquid SimulantT-110T- & B-200 Series
Figure 3.6. Comparison of the Relative Mass Loss Percent for Each Sample Type as a Function of Drying Time
Drying Time (hours)0 30 60 90 120 150
Rel
ativ
e M
ass
Loss
(wt%
)
0
20
40
60
80
100
Second TestSecond Test Duplicate
Initial Test
Figure 3.7. Mass Loss of the T-204 Samples as a Function of Drying Time. The solid line is the regression of all three data sets.

3.6
Drying Time (hours)0 30 60 90 120 150
Rel
ativ
e M
ass
Loss
(wt%
)
0
20
40
60
80
100
Clay/Salt Solution Simulant
Aqueous Salt SolutionT-110T- & B-200 SeriesT-204 Second TestClay/Water Simulant
Chemical Simulant
Figure 3.8. Drying Time Comparison. The solid line is a regression of all the data.
3.2 Stickiness The stickiness of the four tank samples was evaluated by the method described in Sec-tion 2.2. The results of the evaluation on the tank composite samples and dilutions of these composite samples are reported by Tingey (2003). A 20-mm cylindrical shoe was used to evaluate the stickiness of these samples instead of the 15-mm cylindrical shoe used in the vacuum drying tests. The results from these two tests have been normalized by dividing the mass of sample remaining on the shoe by the surface area of the shoe. The results are plotted as a function of solids concentration in Figure 3.9. The solid line is provided as an estimate of the behavior of all the T-204 samples and is not a curve fit of the data. The results indicate that adding a small amount of water to these tank samples produces a material that is much stickier than the original composite, but adding even more water results in thin slurries that do not stick to metal surfaces. Tests of the 1:1 and 4:1 dilutions of all of the tank composites resulted in minimal retention of material on the stainless steel cylinder. Tank T-110 samples behaved differently than the B- and T-200 series samples, but all the samples became sticky as the water content decreased from the original 1:1 dilutions. At water contents less than 45 wt% (>55 wt% total solids), none of the dried samples adhered to the plate. The B-200 and T-200 series dried into small hard chunks of waste, while the T-110 samples

3.7
0
200
400
600
800
1000
1200
1400
0 10 20 30 40 50 60 70 80 90 100
Total Solids Content (wt%)
Stic
kine
ss (g
/m2)
T-110
T-204
B-203
T-203
T-204 Drying
B-203 Drying
T-203 Drying
DryStickyWet
Figure 3.9. Stickiness of Tank Samples. The solid line is an estimate of the behavior of all T-204 samples (both dilution and drying tests).
formed thin brittle plates that were easily ground. Pressures up to 4 kg of force applied with the 15-mm-diameter penetrometer shoe did not break the chunks from the 200 series tanks. The stickiness of the clay and chemical simulants was also evaluated and compared with the T-204 and T-110 samples (Figure 3.10). Some stickiness was observed with the chemical simulant and the clay simulants prepared with distilled water. The clay simulants were not as sticky as the tank wastes (maximum value of approximately 400 g/m2 compared with 1000 g/m2 for the tank waste samples), but the sticky samples were observed at approximately the same water content (18 to 30 wt% solids) as was observed for the B- and T-200 series samples. The stickiness of the chemical simulant was similar to the Tank T-110 sample stickiness in both magnitude and water content. The clay simulants prepared with the aqueous salt solutions did not produce sticky materials over the entire range of water contents measured and did not result in hard chunks of material after drying. The ionic strength of these aqueous salt solutions is approximately 0.8; therefore, the clay is deflocculated and the clay particles do not interact to form a sticky material. The physical properties of these simulants (clay in a high ionic strength liquid) do not mimic the behavior of the tank wastes. Clay simulants prepared with low ionic strength liquids (e.g., water) form flocs that result in increased viscosity and stickiness of the clay slurry.

3.8
Solids Content (wt%)0 20 40 60 80 100
Stic
kine
ss (g
/m2 )
0
200
400
600
800
1000
1200T-204
18 Wt% Clay/Water15 wt% Clay/Water
Chemical SimulantT-110
Figure 3.10. Stickiness of Clay/Water Simulants Compared with Tank T-204 Samples
3.3 Cohesive Strength Cohesive strength was measured on the 1:1 dilution of each of the tank composites and each time the samples were removed from the vacuum drying oven. Similar measurements were made on each of the simulant samples. Measurements were also made on wet sand, kaolin clay, and bentonite clay of known water content to provide an indication that the penetrometer was working properly. Measurable cohesive strengths were observed only for the T-200 and B-200 series samples, chemical simulant, and clay simulants prepared in water. None of the clay slurries prepared with the aqueous salt solutions exhibited significant cohesive strength. The 1:1 dilution from T-110 did not produce a cohesive material over the range of solid contents measured. The maximum cohesive strength observed was 30 g/cm2 on the 200 series tanks compared with a cohesive strength of 50 g/cm2 for an 18.75 wt% bentonite slurry prepared with water. The wet sand (77 wt% sand) and kaolin clay (51 wt% clay) had strengths of >250 and <20 g/cm2. The strength of Hanford tank sludges was minimal until the solids content of the samples approached 30 wt%. Additional drying of the sludges resulted in unfissured cohesive materials where the sludge broke into smaller clumps that could not be broken further by the force applied by the penetrometer. The cohesive strength of these materials could not be measured by the penetrometer.

3.9
3.4 Particle Density The particle densities of the vacuum dried tank wastes (100 wt% solids) from Tanks T-110, T-204, B-203, and T-203 were measured in duplicate by displacement in dodecane. The density of dodecane used was measured in a 100-mL volumetric flask similar to those used to determine the density of the Tank T-110 sample. The measured density was 0.7454, which is close to (<0.5% lower) the reported value of 0.7487 g/mL at 20ºC relative to the density of water at 4ºC (Lide 1990). One of the duplicates from each sample was pulverized to eliminate void inclusion and determine whether the sample contained closed porosity or the nonpolar dodecane failed to wet the sludge particles and fill all the open porosity. The results from these samples indicate that the dried samples contained minimal closed porosity, and all open porosity was filled with dodecane because the density of the pulverized sample was slightly lower (<10%) than the unmodified particles. The as-dried, pulverized, and average densities for each of the tank samples are listed in Table 3.1. Densities of the major salt species observed in the liquid of these tanks are reported in Table 3.2. The major salt species identified was NaNO3. Other major species in the liquid include phosphate, fluoride, and carbonate salts of sodium and potassium and potassium nitrate. In Tank T-110, nitrite salts were also observed at significant concentrations. The major water-insoluble metal, bismuth, is likely present as Bi2O3 or BiPO4 (Rapko and Lumetta 2000). During the drying of these sludges, the water in the liquid evaporated, leaving the dissolved salts with the undissolved solids. The measured particle density is the combination of these dissolved salts and undissolved solids from the tank samples. The results indicate that the density of the Tank T-204 vacuum dried sample is slightly higher than the other samples, but the particle densities of all four tank composites are similar (2.34 to 2.64 g/mL) to those of the constituent nitrate, carbonate, fluoride, and phosphate salts of sodium and potassium. The bulk densities of the tank waste samples as a function of water content were reported by Tingey (2003). The bulk densities of the clay simulants in water were also reported previously (Rassat 2003b).
Table 3.1. Particle Densities
Density (g/mL) Tank
As-Dried Pulverized Average T-110 2.49 2.24 2.36 T-204 2.73 2.55 2.64 B-203 2.34 2.34 2.34 T-203 2.41 2.37 2.39
3.10
Table 3.2. Constituent Salt Densities
Na+ Salts K+ Salts Water-Insoluble Compounds
Chemical Formula Density (g/mL)
Chemical Formula
Density (g/mL)
Chemical Formula
Density (g/mL)
NaNO3 2.261 KNO3 2.109 Bi2O3 8.20-8.90 Na3PO4 2.536 K3PO4 2.564 BiPO4 6.323 Na2HPO4·12 H2O 1.520 NaF· Na3PO4·12 H2O 2.217 NaF 2.558 KF 2.48 Na2CO3· NaHCO3·2 H2O 2.112 K2CO3 2.428 NaNO2 2.168 KNO2 1.915
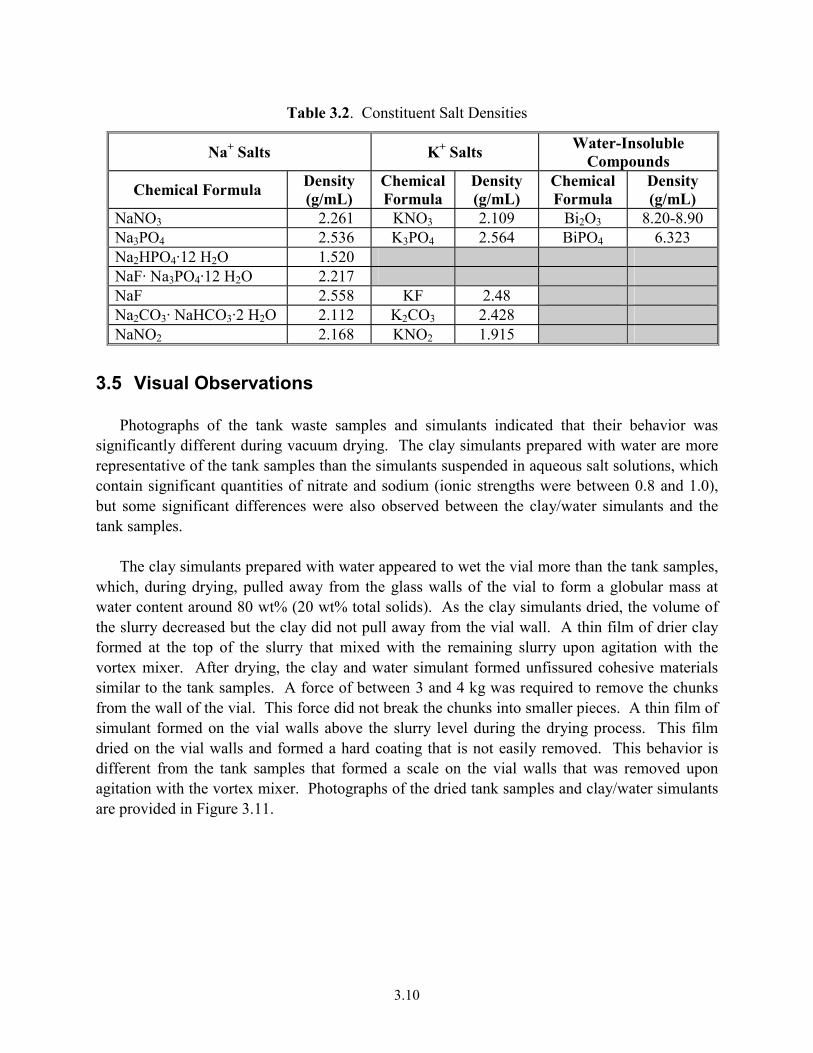
3.5 Visual Observations Photographs of the tank waste samples and simulants indicated that their behavior was significantly different during vacuum drying. The clay simulants prepared with water are more representative of the tank samples than the simulants suspended in aqueous salt solutions, which contain significant quantities of nitrate and sodium (ionic strengths were between 0.8 and 1.0), but some significant differences were also observed between the clay/water simulants and the tank samples. The clay simulants prepared with water appeared to wet the vial more than the tank samples, which, during drying, pulled away from the glass walls of the vial to form a globular mass at water content around 80 wt% (20 wt% total solids). As the clay simulants dried, the volume of the slurry decreased but the clay did not pull away from the vial wall. A thin film of drier clay formed at the top of the slurry that mixed with the remaining slurry upon agitation with the vortex mixer. After drying, the clay and water simulant formed unfissured cohesive materials similar to the tank samples. A force of between 3 and 4 kg was required to remove the chunks from the wall of the vial. This force did not break the chunks into smaller pieces. A thin film of simulant formed on the vial walls above the slurry level during the drying process. This film dried on the vial walls and formed a hard coating that is not easily removed. This behavior is different from the tank samples that formed a scale on the vial walls that was removed upon agitation with the vortex mixer. Photographs of the dried tank samples and clay/water simulants are provided in Figure 3.11.

3.11
Figure 3.11. Photographs of Tank T-204 and Clay/Water Simulants at the Conclusion of the Drying Test
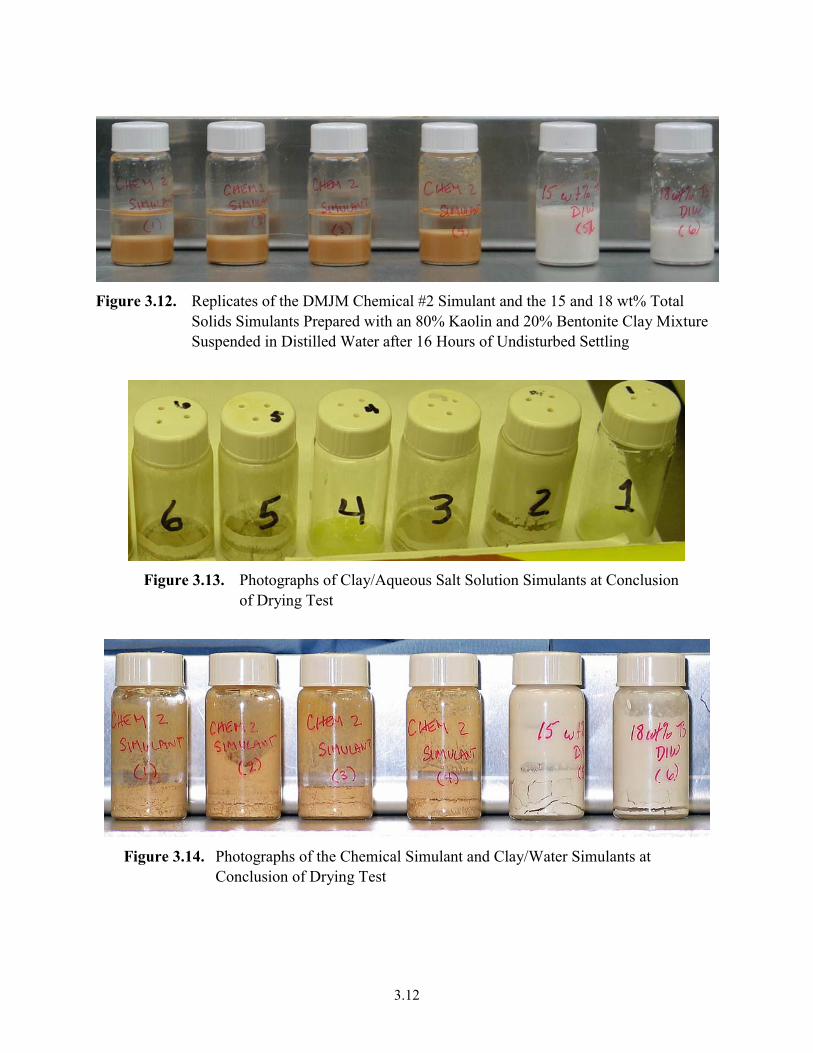
Because of the high ionic strength of the clay simulants prepared with salt solutions and the chemical simulant, the particles in these simulants were deflocculated and the particles settled much more rapidly than was observed in the tank waste samples or the clay simulants prepared with water. The settling of the chemical simulant and the clay/water simulants after 16 hours of undisturbed settling are compared in Figure 3.12. The settling in the clay simulants prepared with salt solutions is apparent in Figure 1.4. Significantly different drying behavior including the morphology of the dried solids is observed in slurries that settle compared to non-settling slurries (stable suspensions). Figures 3.13 and 3.14 are photographs of the clay/aqueous salt solution simulants and the chemical simulant, respectively, at the completion of the vacuum drying test.
3.12
Figure 3.12. Replicates of the DMJM Chemical #2 Simulant and the 15 and 18 wt% Total Solids Simulants Prepared with an 80% Kaolin and 20% Bentonite Clay Mixture Suspended in Distilled Water after 16 Hours of Undisturbed Settling
Figure 3.13. Photographs of Clay/Aqueous Salt Solution Simulants at Conclusion of Drying Test
Figure 3.14. Photographs of the Chemical Simulant and Clay/Water Simulants at Conclusion of Drying Test

4.1
4.0 Conclusions Based on lab-scale (20-mL) tests, vacuum drying is a viable method for removing free liquid from the TRU process wastes at the Hanford Site given sufficient drying time. Both the tank samples and simulants had similar drying rates, and at this scale the majority of the drying was complete in approximately 48 hours. Fairly good agreement was observed in the drying rates among duplicate samples and between simulants and actual tank samples. The amount of moisture removed from the tank and simulant samples at the completion of the vacuum drying tests was similar to the amount of moisture removed by drying the samples at 105ºC for 24 hours in a drying oven. The kaolin and bentonite clay simulants prepared with water behaved more like the tank samples than the simulants suspended in aqueous salt solutions, and the chemical simulant prepared for the pilot-scale tests behaved more like the Tank T-110 sample than the other simulants. High salt contents in the suspending medium cause the bentonite and kaolin clays to flocculate, resulting in quicker settling of the solids fraction. Attapulgite, a clay mineral with a needle-like structure, produces stable suspensions at higher salt contents (Tallard 1997). If a clay simulant suspended in an aqueous salt solution is desired, attapulgite should be considered as an alternative to the bentonite/kaolin clay mixture. During the vacuum drying process, a sticky mass was produced at solids contents between 18 and 30 wt%. Clay simulants prepared with distilled water were not as sticky as the tank wastes (maximum value of approximately 400 g/m2 compared with 1000 g/m2 for the tank waste samples), but the sticky samples were observed at approximately the same solids contents. Clay/ aqueous salt solution simulants did not produce sticky materials over the entire range of solids contents tested. The Tank T-110 sample also did not become sticky as the sample dried, but did become sticky (approximately 300 g/m2) as water was added to the composite to prepare a dilu-tion with approximately 50 wt% solids. The chemical simulant became sticky as it was vacuum dried at approximately the same water content as the Tank T-110 sample (~50 wt% water). The cohesive strength of the tank samples and clay simulants prepared in water was measur-able over the same solid content range as the stickiness measurements. The strength was much less than observed for wet sand but similar to that of bentonite clay sludges prepared with distilled water. The cohesive strengths of the clay/aqueous salt solution simulants and the sample from Tank T-110 were less than could be measured accurately with the penetrometer. The particle densities of the vacuum dried tank samples measured by displacement in dodecane are approximately 2.4 g/mL. The density of the Tank T-204 vacuum-dried sample is slightly higher than that of the other samples at 2.6 g/mL. These particle densities are similar to those of sodium and potassium salts observed in the liquid fraction of the waste in these tanks.

5.1
5.0 References Anderson JD. 1990. History of the 200 Area Tank Farms. WHC-MR-0132, Westinghouse Hanford Company, Richland, WA.
Cooke GA. 2003. Tanks 241-B-203, 241-T-110, 241-T-203, and T-204: MAI TRU Composite Preparation and Analytical Results for the Final Report. HNF-15703 Rev. 0, Fluor Hanford Inc., Richland, WA.
Lide DR (ed.). 1990. CRC Handbook of Chemistry and Physics, 71st ed., p. 3-224. CRC Press, Ann Arbor, MI.
EI DuPont de Nemours & Company, Inc. 1944. Hanford Technical Manual. Section C. Separations. HW-10475-C, General Electric Hanford Atomic Products Operation, Richland, WA.
Gasper KA, KD Boomer, ME Johnson, GW Reddick Jr, AF Choho, and JS Garfield. 2002. Recommendation for Supplemental Technologies for Potential Mission Acceleration. RPP-11261 Rev. 0, CH2M HILL Hanford Group, Inc., Richland, WA.
Rapko BM and GJ Lumetta. 2000. Status Report on Phase Identification in Hanford Tank Sludges. PNNL-13394, Pacific Northwest National Laboratory, Richland, WA.
Rassat SD, LA Mahoney, BE Wells, DP Mendoza, and DD Caldwell. 2003a. Assessment of Physical Properties of Transuranic Waste in Hanford Single-Shell Tanks. PNNL-14221, Pacific Northwest National Laboratory, Richland, WA.
Rassat SD, LM Bagaasen, LA Mahoney, RL Russell, DD Caldwell, and DP Mendoza. 2003b. Physical and Liquid Chemical Simulant Formulations for Transuranic Wastes in Hanford Single-Shell Tanks. PNNL-14333, Pacific Northwest National Laboratory, Richland, WA.
Sowers GF. 1963. “Strength Testing of Soils.” Laboratory Shear Testing of Soils. ASTM Special Technical Publication #361, American Society for Testing and Materials, Philadelphia.
Tallard G. 1997. “Self-Hardening Slurries and Stable Grouts from Cement-Bentonite to IMPERMIX®.” Barrier Technologies for Environmental Management: Summary of a Workshop. National Academies Press, National Academy of Sciences, Washington, DC.
Tingey JM, J Gao, CH Delegard, LM Bagaasen, and BE Wells. 2003. Physical Property and Rheological Testing of Actual Transuranic Wastes from Hanford Single-Shell Tanks. PNNL-14365, Pacific Northwest National Laboratory, Richland, WA.

Appendix
Mass Loss as a Function of Drying Time

A.1
Appendix
Mass Loss as a Function of Drying Time
The drying times in Tables A.1 through A.7 is the cumulative drying time reported in Tables A.8 through A.10. This drying time includes only the time that the sample was in the vacuum oven at temperature. Cohesive strength and stickiness as well as mass loss were measured on the “bulk sample,” while only mass loss was measured on the “loss sample.” The mass loss reported on the bulk sample was adjusted to correct for the sample removed during the cohesive strength and stickiness measurements.

A.2
Table A.1. Mass Loss as a Function of Drying Time for the Tank Sample Dilutions During the Initial Drying Test
Bulk Sample Loss Sample Bulk Sample Loss Sample Bulk Sample Loss Sample Bulk Sample Loss Sample0 0.0 0.0 0.0 0.0 0.0 0.0 0.0 0.0
0.5 0.9 0.9 0.7 0.8 0.9 0.8 0.41.58 3.0 1.7 3.2 3.4 2.2 2.9 3.2 4.22.75 8.8 4.3 6.7 9.2 5.0 6.8 6.2 9.3
19.42 44.3 38.1 30.8 32.1 38.1 49.6 42.3 56.922.17 49.3 39.5 36.6 34.4 41.2 56.4 47.5 60.423.75 50.6 40.5 37.4 35.3 41.8 58.1 48.3 61.8
137.33 83.0 83.3 77.8 79.8 82.4 79.7 83.9 83.4
T-204Mass Loss (%)
Drying Time (hrs) T-110 B-203 T-203
Table A.2. Mass Loss as a Function of Drying Time for the Tank T-204 Samples
Bulk Sample Loss Sample Bulk Sample Loss Sample0 0.0 0.0 0.0 0.0 0.0 0.0
0.5 0.8 0.41.58 3.2 4.22.75 6.2 9.35.08 11.8 34.2 16.5 30.319.42 42.3 56.922.17 47.5 60.423.75 48.3 61.823.91 64.5 83.3 80.7 83.327.91 66.9 83.3 81.5 83.344.66 82.2 83.3 83.6 83.349.50 83.7 84.4 84.0 84.067.25 83.7 83.7 84.2 83.7136.25 84.8 85.2 85.2 84.8137.33 83.9 83.4
Drying Time (hrs) Initial Test
Bulk Sample Loss Sample Sample2nd Test
Mass Loss (%)
Duplicate

A.3
Table A.3. Mass Loss as a Function of Drying Time for the Clay Simulant Suspended in the T-110 Liquid Simulant
Bulk Sample Loss Sample Bulk Sample Loss Sample Bulk Sample Loss Sample0 0.0 0.0 0.0 0.0 0.0 0.0
0.5 0.6 0.6 0.3 1.2 0.3 1.11.58 3.7 2.7 2.0 3.5 2.0 3.52.75 12.4 6.8 11.4 5.3 11.0 6.019.42 61.2 90.7 41.9 33.0 43.4 83.522.17 65.9 90.9 44.2 34.7 47.2 83.023.75 67.2 91.1 44.9 35.6 48.4 83.3137.33 93.4 93.4 85.1 85.3 81.0 84.9
Drying Time (hrs) Liquid 15 wt% Solids 15 wt% ClayMass Loss (%)
Table A.4. Mass Loss as a Function of Drying Time for the Clay Simulant Suspended in the 200 Series Liquid Simulant
Bulk Sample Loss Sample Bulk Sample Loss Sample Bulk Sample Loss Sample0 0.0 0.0 0.0 0.0 0.0 0.0
0.5 0.4 0.5 0.6 1.2 0.8 1.01.58 1.7 2.5 2.1 3.4 2.0 3.32.75 5.9 6.8 6.7 5.4 6.4 5.019.42 38.1 41.6 43.5 42.1 30.7 33.522.17 40.6 43.4 44.7 44.0 32.6 35.223.75 41.3 44.4 45.7 44.8 33.4 36.6137.33 94.6 94.8 85.1 85.4 81.9 82.4
Drying Time (hrs)Mass Loss (%)
Liquid 15 wt% Solids 15 wt% Clay

A.4
Table A.5. Mass Loss as a Function of Drying Time for the Clay Simulant Suspended in the Distilled Water
Bulk Sample Loss Sample Bulk Sample Loss Sample0 0.0 0.0 0.0 0.04 4.3 10.1 3.8 11.0
20.75 31.9 84.7 26.6 82.225.58 41.8 85.1 36.0 82.242.33 85.5 85.1 83.2 82.6111.33 86.3 85.9 83.7 83.3
Drying Time (hrs) 15 wt% Solids 18 wt% SolidsMass Loss (%)
Table A.6. Mass Loss as a Function of Drying Time for the Clay/Water Simulant Dried with the Chemical Simulant
15 wt% Solids 18 wt% Solids0 0.0 0.0
1.33 2.5 7.53.33 10.3 30.05.25 19.0 57.611.17 50.6 82.721.25 85.1 82.724.33 85.2 82.827.92 85.2 82.945.58 85.4 83.150.67 85.4 83.2498.83 85.9 83.9
Mass Loss (%)Drying Time (hrs)

A.5
Table A.7. Mass Loss as a Function of Drying Time for the Chemical Simulant
Bulk Sample Loss Sample Bulk Sample Loss Sample0 0.0 0.0 0.0 0.0
1.33 2.7 2.3 2.4 2.33.33 8.5 10.0 8.4 8.05.25 13.5 15.1 13.1 13.811.17 32.7 32.6 31.0 30.521.25 65.1 62.8 60.7 59.924.33 75.5 71.8 72.5 70.827.92 81.6 75.7 80.9 78.745.58 82.3 81.9 82.5 80.350.67 82.4 82.1 82.6 80.4498.83 83.1 82.8 83.2 81.2
Drying Time (hrs)Mass Loss (%)
Sample Duplicate

A.6
Table A.8. Drying Times for the Initial Tests
Time Date
Out In Cumulative Drying Time
(hr)
November 25, 2003 11.35 AM 0 November 25, 2003 12:05 PM 12:45 PM 0.5 November 25, 2003 1:50 PM 2:25 PM 1.58 November 25, 2003 3:35 PM 4:10 PM 2.75 November 26, 2003 8:50 AM 9:50 AM 19.42 November 26, 2003 12:35 PM 1:20 PM 22.17 November 26, 2003 2:55 PM 3:35 PM 23.75 December 01, 2003 9:10 AM 137.33
Table A.9. Drying Times for Additional Tests
Time Date
Out In Cumulative Drying Time
(hr)
December 9, 2003 10:25 AM 0 December 9, 2003 3:30 PM 4:00 PM 5.08 December 10, 2003 10:50 AM 12:30 PM 23.91 December 10, 2003 4:30 PM 5:00 PM 27.91 December 11, 2003 9:45 AM 10:30 AM 44.66 December 11, 2003 3:20 PM 3:45 PM 49.50 December 12, 2003 9:30 AM 12:15 PM 67.25 December 15, 2003 9:15 AM 136.25
A.7
Table A.10. Drying Times for DMJM Chemical Simulant Tests
Time Date
Out In Cumulative Drying Time
(hr)
March 30, 2004 9:55 AM 0 March 30, 2004 11:15 AM 11:45 AM 1.33 March 30, 2004 1:45 PM 2:15 PM 3.33 March 30, 2004 4:10 PM 4:30 PM 5.25 March 30, 2004 10:25 PM 10:45 PM 11.17 March 31, 2004 8:50 AM 9:25 AM 21.25 March 31, 2004 12:30 PM 1:15 PM 24.33 March 31, 2004 4:50 PM 5:10 PM 27.92 April 1, 2004 10:50 AM 11:10 AM 45.58 April 1, 2004 4:15 PM 10:10 PM 50.67 April 21, 2004 2:40 PM 498.83

PNNL-14670
Distr.1
Distribution
No. of Copies ONSITE DOE Richland Operations Office
T. P. Pietrok K8-50 DOE-Office of River Protection
B. M. Mauss H6-60 10 CH2M HILL
K. D. Boomer L4-07 P. M. Branson S7-65 W. E. Bryan S7-70 M. E. Johnson L4-07 J. G. Kristofzski H6-03
R. E. Raymond H6-22 D. B. Smet S7-65 A. R. Tedeschi (3) H6-22
No. of Copies 24 Pacific Northwest National Laboratory
L. M. Bagaasen (3) K6-28 S. Q. Bennett K7-90 T. M. Brouns K9-69 C. H. Delegard P7-25 G. B. Josephson K6-69 M. E. Lerchen K7-97 L. A. Mahoney K7-15 A. P. Poloski P7-25 S. D. Rassat K6-28 R. L. Russell K6-24 J. M. Tingey (10) P7-25 Information Release (2) K1-06