v1647 orionis: one year into quiescence - … were reduced with the gemini iraf data re-duction gmos...
TRANSCRIPT

V1647 Orionis: One Year into Quiescence
Colin AspinInstitute for Astronomy, University of Hawaii,
640 N. A’ohoku Place, Hilo, HI [email protected]
Tracy L. BeckGemini Observatory, 670 N. A’ohoku Place, Hilo, HI 96720
Bo ReipurthInstitute for Astronomy, University of Hawaii,
640 N. A’ohoku Place, Hilo, HI [email protected]
ABSTRACT
We present new optical, near-IR, and mid-IR observations of the young eruptive variable starV1647 Orionis that went into outburst in late 2004 for approximately two years. Our observationswere taken one year after the star had faded to its pre-outburst optical brightness and show thatV1647 Ori is still actively accreting circumstellar material. We compare and contrast these datawith existing observations of the source from both pre-outburst and outburst phases. From near-IR spectroscopy we identify photospheric absorption features for the first time that allow us toconstrain the classification of the young star itself. Our best fit spectral type is M0±2 sub-classeswith a visual extinction of 19±2 magnitudes and a K-band veiling of rK ∼1.5±0.2. We estimatethat V1647 Ori has a quiescent bolometric luminosity of ∼9.5 L� and a mass accretion rate of∼1×10⁻⁶ M� yr−1. Our derived mass and age, from comparison with evolutionary models, are0.8±0.2 M� and � 0.5 Myrs, respectively. The presence towards the star of shock excited optical[S II] and [Fe II] emission as well as near-IR H2 and [Fe II] emission perhaps suggests that a newHerbig-Haro flow is becoming visible close to the star.
Subject headings: stars: individual (V1647 Ori) – Reflection nebulae – Accretion, accretion disks
1. INTRODUCTION
A significant event in the recent history of starformation studies occurred in late 2003 when theyoung pre-main sequence star V1647 Orionis wentinto outburst. This eruption, and the associatedone hundred fold increase in optical brightness, re-sulted in the appearance of a monopolar reflectionnebula now known as ”McNeil’s Nebula” after theamateur astronomer, Jay McNeil, who discoveredit (McNeil 2004). The star and nebula remained
bright for approximately 18 months before fadingrapidly over a six month period. V1647 Ori wasfound to be again close to its pre-outburst (SloanDigital Sky Survey, SDSS) optical brightness inearly 2006. A widely accepted interpretation ofsuch eruptions is one involving a heated disk anda ‘mass dumping’ episode from a circumstellar diskonto a stellar photosphere. The five magnitude in-crease in optical brightness seen in V1647 Ori hasbeen attributed to both the addition of significantaccretion luminosity and a partial dust clearing
1

due to the high-velocity wind (up to 600 km s−1)emanating from the star/disk engine (Reipurth &Aspin 2004; McGehee et al. 2004).
Both star and nebula have been widely studiedfrom the period soon after the outburst occurredthrough to its fading to its pre-outburst bright-ness. In our discussions below, we refer to theperiod before November 2004 as the pre-outburstphase (Briceno et al. 2004), the period fromNovember 2004 to February 2006 as the outburstphase, and the period from February 2006 onwardsas the quiescent phase of V1647 Ori. Observationsspanning all spectral regimes, from x-ray into theoptical to the near-IR and on to the far-IR/sub-mm/radio, have been published by many authorsin a large number of papers. Readers are referredto these for detailed background information onV1647 Ori and McNeil’s Nebula. These papersare, in alphabetical order: Abraham et al. (2004 -the pre-outburst infrared characteristics), Acosta-Pulido et al. (2007 - optical and near-IR imagingphotometry, near-IR spectroscopy and polarime-try during the outburst, henceforth AP07), An-drews, Rothberg, & Simon (2004 – mid-IR andsub-mm observations during the outburst), As-pin et al. (2006 – an historical study of previ-ous outbursts), Briceno et al. (2004 – the opti-cal outburst history, pre-outburst and during theoutburst), Fedele et al. (2007a,b – optical andnear-IR properties during the outburst), Gibb etal. (2006 – near-IR spectroscopy during the out-burst), Grosso et al. (2005 – x-ray observationsduring the outburst), Kastner et al. (2004 – x-rayemission pre-outburst and during the outburst),Kastner et al. (2006 – x-ray evolution during theoutburst), Kospal et al. (2005 – optical photome-try during the outburst), McGehee et al. (2004 –optical and near-IR photometry pre-outburst andduring the outburst), Mosoni et al. (2005 – mid-IRinterferometric observations during the outburst),Muzerolle et al. (2005 – Spitzer observations dur-ing the outburst), Ojha et al. (2004 – near-IRimaging during the outburst), Ojha et al. (2006 –optical photometry and spectroscopy, and near-IRimaging during the outburst), Reipurth & Aspin(2004 – optical and near-IR imaging photometryand spectroscopy during the outburst), Rettig etal. (2005 – high spectral resolution near-IR ob-servations during the outburst), Semkov (2004 –optical photometry during the outburst), Semkov
(2006 – optical light curve during the outburst),Tsukagoshi et al. (2005 – mm continuum obser-vations during the outburst), Vacca, Cushing, &Simon (2004 – near-IR spectroscopy during theoutburst), Vig et al. (2006 – radio observationsduring the outburst), and Walter et al. (2004 –optical photometry and spectroscopy during theoutburst).
The significance of eruptive outbursts, similarto the one undergone by V1647 Ori lies in the factthat these periods are considered times when massaccretion rates increase dramatically (Hartmann& Kenyon 1996, henceforth HK96). During peri-ods of outburst, mass accretion rates have been di-rectly observed to increase by up to several ordersof magnitude from a pseudo-steady-state value of∼10−9 to −7 M� yr−1 for classical T Tauri stars(Hartmann et al. 1998) to ∼10−6 to −5 M� yr−1
for EXor variables, and as high as ∼10−4 M� yr−1
for the extremely energetic FUor variables (Hart-mann & Kenyon 1985). FUors and EXors are sonamed after the prototypes of their classes, namelyFU Orionis and EX Lupi, respectively (Herbig1989).
Whether all young stars undergo EXor and/orFUor eruptions and, if so, whether these twotypes of outbursts events are fundamentally thesame (on perhaps different scales) or different (interms of the mechanism involved and the trigger-ing of the eruption) is still a matter of debate.EXor eruptions are distinct from FUor eruptionsin that they are much shorter lived, months toyears rather than decades to centuries, and havebeen empirically determined to be repetitive (Her-big 1989; 2007). For example, EX Lupi itself hasgone into outburst on several occasions, with thelast being in 1993–94 (Lehmann et al. 1995, Her-big et al. 2001). V1647 Ori is likely another ex-ample of an EXor since its recent activity lastedonly two years and it was previously observed inoutburst from 1966–67 (Aspin et al. 2006) onarchival photographic plates. Mechanisms thathave been proposed to initiate an eruptive event,be it EXor-like or FUor-like, include: thermal diskinstabilities resulting in a runaway accretion con-dition (Bell & Lin 1994), periodic overloading ofthe inner regions of the circumstellar disk and sub-sequent magnetic collapse (HK96), and the closeapproach of a companion in an eccentric orbit dis-turbing the stability of the inner regions of the
2

disk (Bonnell & Bastien 1992).In this paper, we present new optical, near-IR,
and mid-IR observations of V1647 Ori and Mc-Neil’s Nebula taken approximately one year afterthe source reached its pre-outburst optical bright-ness. Below, we compare and contrast our obser-vations with those taken during the pre-outburstand outburst phases of the eruption and attemptto better understand the nature and characteris-tics of the underlying young star and its circum-stellar environment.
2. OBSERVATIONS & DATA REDUC-TION
In order to study the on-set of the quiescentphase of V1647 Ori, we undertook an observingcampaign involving optical, near-IR, and mid-IRinstrumentation. Table 1 relates the log of obser-vations obtained together with associated photo-metric values derived from those datasets. All theoptical and mid-IR observations were acquired onthe “Frederick C. Gillett” Gemini North 8-metertelescope on Mauna Kea, Hawaii during the periodUT February 13 to April 5 2007. At this time,V1647 Ori had returned to its pre-outburst quies-cent brightness for about one year. Additionally,near-IR images and spectroscopy were acquired inFebruary 2007 using the University of Hawaii 2.2mand the NASA IRTF 3.5m telescopes, respectively,both also located on Mauna Kea.
2.1. Optical Imaging & Spectroscopy
Optical imaging data using Gemini North andGMOS-N (Davies et al. 1997) were obtained un-der Gemini queue program ID GN-2007A-Q-33 onUT February 22, 2007. Images in the SDSS g’, r’,i’, and z’ filters were acquired in queue mode withan exposure time of 10 minutes per filter. Thedata were reduced with the Gemini IRAF data re-duction gmos package (v1.9) using standard proce-dures for bias subtraction, flat-fielding (using mas-ter twilight flats), cosmic ray rejection, and imagecombination. Photometric calibration was per-formed using a photometric sequence of six fieldstars from SDSS images of the region. Since thisis a region of active star formation with the likeli-hood of some stars being intrinsically variable, weconsidered using as many as six field stars as cal-ibrators to be an acceptable way to ensure insen-
sitivity to such temporal changes. A detailed dis-cussion of the calibration sequence definition andproperties will be presented in a subsequent pa-per on our two year outburst phase Gemini/IRTFoptical, near-IR, and mid-IR monitoring programon V1647 Ori (Aspin & Reipurth, in prep.). TheGMOS CCDs were binned 2×2 to match the natu-ral seeing of ∼0.′′55. A ’true-color’ image of the re-gion containing V1647 Ori, made from these data,is shown in Fig. 1. Also shown is a similar imagetaken some three years earlier during the outburstphase (February 2004).
Additionally, optical spectroscopy of V1647 Oriwas obtained on UT February 21, 2007, againusing Gemini North and the GMOS-N in queuemode. We utilized the R400 grating with λc=7000 Aand a 0.′′75 wide long-slit. This resulted in a spec-tral resolution of R∼1280 and wavelength cover-age of ∼5000–9150 A. Seven 1800s exposures weretaken giving a total on-source exposure time of3.5 hours. V1647 Ori was moved along the slitbetween each observation and, at the time of ouroptical spectroscopy, it had an r’ magnitude of23.26±0.15. The data were again reduced usingthe Gemini IRAF gmos package (v1.9) using flat-field and arc images from the facility calibrationunit, GCAL. In order to obtain the best sky-linesubtraction in the far-red, we subtracted pairsof reduced 1800s images before residual sky-linesubtraction and optimal point-source extraction.These steps were performed using the StarlinkFIGARO package. The seven extracted spectraof V1647 Ori were inter-compared to eliminatespurious noise spikes before combination. Thecombined spectrum was flux calibrated using ob-servations of the spectrophotometric standard starFeige 34. Fig. 2 shows the final optical spectrumof V1647 Ori with all significant atomic lines iden-tified.
2.2. Near-IR Imaging & Spectroscopy
We obtained near-IR images of V1647 Ori onUT February 13, 2007 on the University of Hawaii2.2 m telescope on Mauna Kea using ULBCAM(Hall et al. 2004). This instrument consists offour Hawaii-2 1–5 µm arrays but operates in theJ and H band only due to thermal background is-sues. The field of view of the camera is 17′×17′
with a pixel scale of 0.′′25. A standard “MaunaKea” H-band filter was used for the observations
3

and the total on-source exposure time was 6 min-utes. Target images were dithered and medianfiltered to obtain sky images and flat-field imageswere taken by observing the inside of the telescopedome with lights on and off. Data reduction wasperformed using the Gemini IRAF quirc data re-duction package (v1.9). For photometric calibra-tion we used 2MASS sources within the field ob-served. Fig. 3 shows the region immediately sur-rounding V1647 Ori from these H-band images.At the time of the observations, V1647 Ori hadan H-band magnitude of 11.96±0.1 and is labeledin Fig. 3 together with LkHα 301 and HH 22-IRS(Muzerolle et al. 2005).
We used the NASA IRTF and the near-IR spec-trometer SpeX (Rayner et al. 2003) to obtainnear-IR 1–4.1 µm spectroscopy of V1647 Ori onUT February 22, 2007. We observed using theSXD and LXD grisms with total exposure timesof 1600 and 1200 seconds, respectively. The datawere reduced using the SpeXtools software pack-age (Cushing, Vacca, & Rayner 2004). An ob-servation of an A0 V star close to the airmass ofthe target was used as a telluric calibrator andapplied using the template fitting method definedin Vacca, Cushing, & Rayner (2003). V1647 Oriwas nodded along the 0.′′8 slit in an ABBA pat-tern to allow good sky definition and subtrac-tion. The final reduced and combined spectrumwas flux calibrated using the H-band magnitude(H=11.96) from our ULBCAM imaging taken 9days prior to eliminate slit-losses during the vari-able seeing conditions encountered. The conver-sion of H magnitude to flux was performed us-ing the Tokunaga & Vacca (2005) values, forwhich a zero H magnitude star has a flux ofFλ=1.18 10−9 W m−2 µm−1. The combined SXDand LXD spectrum of V1647 Ori is presentedin Fig. 4, where all major absorption and emis-sion lines and bands are identified. An expandedview of the 2.1–2.35 µm region of the spectrum ofV1647 Ori is shown in Fig. 5.
2.3. Mid-IR Imaging & Spectroscopy
On UT March 18, 2007 we obtained GeminiNorth Michelle images of V1647 Ori in queue modeusing the N’ (λ c=11.2 µm) and Qa (λ c=18.5 µm)filters. The total on-source exposure time was100 seconds in each filter. The chopped and nod-ded images were processed using the Gemini IRAF
midir package (v1.9), specifically task msreduce.Photometric calibration was performed using ob-servations of the bright photometric standards56 Ori and HD37160. Since V1647 Ori appearedin both images as a point-source with N’ and Qaband full width half maximum seeing of 0.′′48 and0.′′66, respectively, they are not explicitly shownhere. From these images, however, we find thatV1647 Ori had flux values of 0.23 Jy at 11.2 µmand 0.44 Jy at 18.5 µm.
Additionally, mid-IR spectroscopy covering the8–14 µm wavelength regime (the N-band) was ob-tained on Gemini North using Michelle with the’low N’ grating on UT April 5, 2007. The slitused was 0.′′4 wide and resulted in a spectral res-olution of R∼200. The on-source exposure timewas 400 seconds and chopping along the long-slit(±10′′) was employed. A spectroscopic standardstar (BS2473, spectral type G8 Ib) was observedimmediately after the science observation and usedto remove telluric features from the target spec-trum. Spectroscopic reduction was performed us-ing the Gemini IRAF midir package (v1.9) to givea reduced 2D spectral image, and the Starlink FI-GARO package was used for optimal spectroscopicextraction and telluric correction.
3. RESULTS
3.1. The Optical Appearance
In Fig. 1 we compare V1647 Ori and McNeil’sNebula on images taken in February 2004 andthree years later in February 2007. The imagesare derived from three optical passbands, the leftimage (February 2004) uses the g’, r’, and i’ im-ages while the right image (February 2007) usesthe r’, i’, and z’ data. Note that the optical r’-band flux from V1647 Ori is ∼170× smaller inFebruary 2007 than in February 2004, the latterbeing 2–3 months after the initial outburst. Wealso note that in February 2007, some 12 monthsafter V1647 Ori had returned to its pre-outburstbrightness, we barely detect the reflection nebu-losity and now see the HH 22 region (blue, to thenorth and slightly east of V1647 Ori) much moredistinctly. Even though the reflection nebula isvery faint, all the physical features of it are still de-tected in the February 2007 image, specifically thefan-shaped region extending from the star to thenorth-west, the dark bands crossing the nebula on
4

the eastern side of the monopolar lobe, the right-angled feature directly north of V1647 Ori, andthe small nebulous blob a few arcseconds north-east. Since we are observing the nebula in re-flection (for example, see the polarization map ofAP07), the brightness of the nebula should ap-proximately mirror the brightness of V1647 Oriitself with appropriate delays for light-travel time(AP07). We conclude, therefore, that the under-lying structure observed in the reflection nebula isquasi-static and independent of the eruption andbrightness changes that have taken place.
Qualitatively, the scenario for the rapid bright-ening and fading of McNeil’s Nebula is as follows.The initial explosive eruption blew away and/orsublimated considerable obscuring dust along bothour direct line-of-sight and the line-of-sight fromV1647 Ori into the nebula (Reipurth & Aspin2004; Walter et al. 2004). This was the directresult of both the initiation of an intense stel-lar wind and the enhancement to the UV/opticalflux from the star due to the increased accretionrate. We note that the bolometric luminosity,Lbol, of V1647 Ori increased from Lbol ∼3.5 L�pre-outburst to Lbol ∼50 L� during outburst (An-drews, Rothberg, & Simon 2004) due to the ad-dition of enhanced accretion luminosity (Lacc).The addition of the Lacc component and the blowout/sublimation of surrounding dust resulted inthe brightening of V1647 Ori and hence, via re-flection, McNeil’s Nebula. The reverse is alsolikely true, i.e. the decline of the Lacc compo-nent and the slowing of the intense stellar windresulted in the condensation of dust restricting thedirect flux and the flux propagating into the neb-ula. Dust sublimation was recently discussed byAP07 who commented on its reversibility i.e. sub-limation during the outburst, and re-condensationafter fading, and how such behavior was consistentwith the documented evidence of at least one pre-vious outburst (Aspin et al. 2006).
It has been proposed that the existence andshape of McNeil’s Nebula is the result of eithera remnant wide-angle molecular outflow creatinga cavity in the ambient molecular cloud materialnear V1647 Ori (Reipurth & Aspin 2004), or thatsuch nebulae are the result of space motion of theyoung star through the ambient molecular cloud(Goodrich 1987). In the former case, an oppos-ing outflow lobe would extend into the molecular
cloud (since the visible lobe is tilted towards us –AP07) and hence be hidden from view by cloudmaterial. As yet, there is no observational evi-dence for an active or remnant molecular outflowemanating from V1647 Ori (Lis, Menten, & Zylka1999, Andrews, Rothberg, & Simon 2004). Simi-larly, there has been no observational determina-tion of space motion associated with V1647 Ori.
3.2. The Optical Spectrum
In Fig. 2 we present the optical spectrum ofV1647 Ori taken in February 2007. The top ofthe three panels shows the complete optical spec-trum from 5000 A to 9150 A. We note that at thetime this spectrum was taken, V1647 Ori had anoptical brightness of r’=23.3±0.1. The spectrumseen is that of an object with a red continuumsuper-imposed with a variety of emission features.The brightest emission lines are those from theCa II triplet at 8498, 8542, and 8662 A. A pro-nounced Hα emission feature, together with weakhigh-order H I Paschen series P10, P11 and P12lines, are also present. Weaker emission lines arepresent also, specifically [S II] at 6716 and 6731 A,O I at 5579 and 8449 A, [Fe II] at 8617 A, veryweak Fe I lines at 7912, 8467, and 8689 A, andweak Fe II at 8600 A. The absorption feature at7600 A is the telluric O2-A band. The middle andbottom panels of Fig. 2 show expanded views ofthe optical spectrum near Hα (middle) and theCa II triplet (bottom). The Li I absorption line at6707 A is indicated, however, it is not clear thatit is really detected. Table 2 shows the equivalentwidths and line fluxes for the optical (and near-IR)emission features.
3.2.1. Shock-excited [S II] emission
An interesting aspect of the optical spectrumis the presence of weak [S II] emission lines withequivalent widths of –16.3 A (6716 A) and –22.0 A(6731 A). Such [S II] emission features were alsodetected by Fedele et al. (2007a) in their January2006 observations. They interpreted these as pos-sible evidence for the presence of a Herbig-Haro(HH) object close to the star. We shall considerthis interpretation further below.
We have made a careful study of the GMOStwo-dimensional spectroscopic images to examinewhether the [S II] emission is present directly on
5

the location of V1647 Ori or is also seen at otherspatial positions along the long-slit used. Ourfindings indicate that there is no [S II] emissionat all at any other location along the 90′′ long-slit and we conclude that the shock-excited [S II]emission lines are directly associated with the cir-cumstellar region of V1647 Ori and are not due toforeground or background shocked nebulosity.
What evidence is there to support the interpre-tation that the [S II] lines originate in a shock-excited HH object? First, Eisloffel & Mundt(1997) considered that HH 23, located 155′′ northof V1647 Ori and close to the axis of McNeil’sNebula, originated from V1647 Ori. Second, aswell as [S II], the optical and near-IR spectrum ofV1647 Ori shows weak [Fe II] emission at 8617 Aand 1.644 µm, and weak H2 v=1-0 S(1) emissionat 2.122 µm. Some of these lines are often associ-ated with shock-excited HH objects (Gredel 1994,1996; Hamann et al. 1994). Third, it is becom-ing more widely recognized that there very likelyexists a relationship between the creation of anHH object and the outburst phenomenon (Dopita1978; Reipurth 1989).
If we assume that HH 23 was ejected fromV1647 Ori in perhaps an earlier outburst, then,with an inclination of the ejection axis with re-spect to the line-of-sight of ∼60 degrees (AP07)and assuming a typical HH object space velocityof ∼200 km s−1, HH 23 would have been ejectedfrom V1647 Ori approximately 2000 years ago fora source distance of 450 pc. However, it is, as yet,not definitively proven that HH 23 originates fromV1647 Ori. In Fig. 6 we show the region containingV1647 Ori, HH 22, and HH 23 imaged in narrow-band [S II] using GMOS-S on the Gemini Southtelescope on UT October 10 and 11, 2005. Thisdeep image clearly shows shock-excited nebulositybetween V1647 Ori/McNeil’s Nebula and HH 23which resembles an intermediate bow shock with atrailing extended tail. These features were identi-fied as HH23 C by Eisloffel & Mundt (1997). Closeinspection of Fig. 6, suggests that it is equallyconceivable that HH23 C and, in fact, the mainHH 23 knots (A and B) could have originated fromHH 22. Within the HH 22 A shock-excited nebu-losity lies a deeply embedded young Class I proto-stellar source first detected by Spitzer (Muzerolleet al. 2005). We henceforth refer to this source asHH22-IRS and identify its location in Fig. 6 with
a white cross. Muzerolle et al. (2005) consideredthat HH22-IRS drives the east–west HH 22 colli-mated flow and additionally noted that this flowis approximately orthogonal to the HH 23 flow. IfHH22-IRS drives both the HH 22 and HH 23 flowsthen it is perhaps a young binary system in whicheach component drives a (non-aligned) collimatedflow. Proper motion and radial velocity studies ofboth flows may clarify their origin.
If the presence of shock-excited optical andnear-IR emission lines does indicate the presenceof a new HH object close to V1647 Ori, when wasthis HH flow created? We have investigated thepossibility that these shock-excited [S II] lines werepresent before January 2006, and hence could havebeen created in the explosive outburst itself. Inthis case, the [S II] lines would have been presentin spectra of V1647 Ori taken prior to January2006 but were perhaps overwhelmed by the then100× brighter continuum flux. We note that inJanuary 2006, V1647 Ori had faded significantlyfrom it outburst maximum brightness of r’=17.4(Reipurth & Aspin 2004). We have simulated ob-serving the same line strength [S II] emission fea-tures on such an enhanced continuum. In addi-tion to considerably reducing the visibility of thelines on the high continuum level, a factor 100×increase in continuum flux implies the addition of10× the photon shot noise to the data. Underthese conditions the [S II] equivalent widths be-come 100× smaller and the noise becomes 10×larger. We measure the root-mean square (rms)noise in a continuum subtracted region of theV1647 Ori spectrum close to the [S II] lines at3.5×10−21 W m−2 µm−1 while the peak signal inthe [S II] lines is 5×10⁻²⁰ W m−2 µm−1. Thisimplies a signal-to-noise ratio (S:N) of ∼14. If weincrease the photon shot noise by a factor ×10 theS:N drops to ∼1.4 and would mean that the [S II]lines of the same strength would likely not be de-tected during the outburst phase.
What we can conclude therefore, is that [S II]emission was present in our February 2007 spec-trum of V1647 Ori as well as the January 2006spectrum of Fedele et al. (2007a). We have shownthat the emission is isolated to the point-source it-self but cannot determine whether these emissionlines have recently formed or if they were presentin earlier spectra and swamped by the enhancedcontinuum from V1647 Ori. Again, if we assume
6

an HH space velocity of ∼200 km s−1 and an in-clination of ∼60 degrees, a new HH object wouldtake ∼13 years to move ∼1′′ (for a distance of450 pc).
The fact that [S II] emission lines are present,however, implies that shocks exist in the imme-diate vicinity of the accreting young star. Sincethe [S II] 6716 A/6731 A line ratio is only weaklydependent on temperature, it can be used as a di-agnostic of the electron density in the [S II] emit-ting region. Using the IRAF nebular.temdenroutine and our February 2007 observed line ra-tio of ∼0.8, we estimate that the electron den-sity, ne, was ∼1400 cm−3 for an assumed elec-tron temperature, Te, of 104 K (a value consistentwith mild shock excitation). If we vary Te overthe range 5000–20000 K (the temperature rangeover which [S II] emission can occur), a ratio of0.8±0.1 gives a range of ne of ∼1000–1800 cm−3.This derived value is a factor ∼14× lower than the[S II] critical density of ∼2×104 cm−3 (Bacciotti2002). Performing the same analysis for the Fedeleet al. (2007a) data from January 2006, we find a[S II] line ratio of ∼0.6±0.1 and an electron den-sity value of ne∼4200 cm−3 with a range for validTe values of 3200–5300 cm−3. The Fedele et al.(2007a) value is perhaps a little larger than thanfound in February 2007 although the errors on theratios are significant. A difference in this line ra-tio would mean that conditions in the region wherethe shock-excitation occurs have evolved over theintervening year and could be interpreted as ei-ther physical electron density changes or changesin the local ionization fraction. There is some ev-idence that in HH flows, higher electron densitiesmay occur closer to the exciting sources (Cohen &Jones 1987; Buhrke, Mundt, & Ray 1988; Heath-cote & Reipurth 1992; Beck et al. 2007). If theabove ratio decrease is real, then we can speculatethat perhaps the shocked region has moved furtheraway from the star.
3.2.2. Hα emission
The equivalent width of the Hα emission inour spectrum is Wλ=–124±10 A, the large uncer-tainty being due to the very weak continuum fluxpresent at the wavelength of Hα. The observedWλ value is considerably larger than that last re-ported: Ojha et al. (2006) found Wλ=–40.75 onUT September 28, 2005. This is also likely to be
a result of the weak observed continuum flux.The Hα emission line flux in our spectrum is
Fλ=1.0×10⁻¹⁸ W m−2 and we can compare thisdirectly to the outburst phase Hα line fluxes pre-sented in AP07, Ojha et al. (2006), and Walter etal. (2004). AP07 plot their own Hα line fluxes,together with those of Ojha et al. (2006) andWalther et al. (2004), against time (their Fig. 12)from soon after the outburst was detected in early2004 through late 2005. Their plot shows a declin-ing Hα line flux during the outburst period, froma peak in early 2004 of ∼2.0×10⁻¹⁷ W m−2 to∼4.0×10⁻¹⁸ W m−2 in late 2005. Our quiescentphase value from early 2007 is lower still by a fac-tor ×4 and follows the outburst trend. As pointedout by AP07, H I emission lines are often directlyrelated to the accretion process. This trend couldrepresent declining accretion over the outburst toquiescent phase period although as we shall seebelow, changes in visual extinction could also af-fect the observed fluxes. We defer a discussion ofderived accretion rates during these phases to Sec-tion 3.7.3 where we consider the near-IR spectrumof V1647 Ori in relation to the models of Muzerolleet al. (1998, 2001).
We additionally note that the Hα line profileappears somewhat asymmetric in shape. Specifi-cally, the red wing appears truncated with respectto the blue wing and with respect to the profile ofother emission lines (e.g. Ca II). Such a red-wingtruncation has not, to our knowledge, been seenbefore in V1647 Ori.1 We can perhaps attributethis asymmetry to redshifted absorption from in-falling cool neutral gas although higher spectralresolution optical data would be required before aconclusive decision can be made.
3.2.3. Ca II triplet emission
In the quiescent-phase spectrum shown inFig. 2, the Ca II triplet lines at 8498, 8542, and8662 A have equivalent widths, Wλ, of –30.6±1 A,–35.4±1 A, and –34.2±1 A, respectively. The ra-tio of these lines, specifically, ∼1.7:2:1.9, is some-what different from that found by Walter et al.(2004) in spectra from the outburst period takenbetween February and April 2004. They reported
1A recent high spectral resolution Keck II/NIRSPEC near-IR spectrum of V1647 Ori taken by us shows a similarlytruncated Brγ emission line.
7

a Ca II triplet ratio of ∼2:2:1, a pattern consid-ered unique to T Tauri and Herbig Ae/Be stars(Herbig & Soderblom 1980; Hamann & Persson1990), and inconsistent with the expected ratiofrom (optically thin) transition strengths (gf) i.e.1:9:5. The 2:2:1 line ratio was also noted to be dif-ferent from that produced by either simple opticaldepth effects or chromospheric models (Hamann& Persson 1992). We have compared the obser-vations and model predictions presented in bothFig. 8 of Hamann & Persson (1992) and in Fig. 3of Herbig & Soderblom (1980) with our derived ra-tios to investigate the physical conditions in whichCa II lines arise. We note that in the above pa-pers, the quantities used are Wλ(8498)/Wλ(8542)and Wλ(8662)/Wλ(8542). Our measured ratiosof ∼1.7:2:1.9 therefore become 0.86±0.05 and0.97±0.05, respectively. A similar ratio was alsofound by Gibb et al. (2006) and Vacca et al.(2004) in their post-outburst spectra. In Fig. 8of Hamann & Persson (1992), V1647 Ori wouldlie close to the loci of models for either i) a veryhigh optical depth (τ ∼1000) isothermal LTE slab,or ii) a somewhat lower optical depth isothermalnon-LTE slab (τ ∼50, but still optically thick).The location of V1647 Ori is distinctly separatedfrom both the majority of T Tauri stars they ob-served (i.e. with mean ratios of ∼1,0.8), and chro-mospheric model values (i.e. 0.6,0.8). FollowingHamann & Persson (1992), ratios close to unity asin our case, indicate that collisional decay is dom-inant over radiative decay and requires conditionswith τne ≥1013 cm−3 where ne is the electrondensity. It seems, therefore, that regardless ofLTE or non-LTE conditions, in February 2007 theCa II triplet lines in V1647 Ori were extremelysaturated and produced in a very high densitymedium. This is also supported by the locationof V1647 Ori in Fig. 3 of Herbig & Soderblom(1980), where V1647 Ori would lie close to theoptically thick LTE slab location. At this lo-cation, several T Tauri stars are found, specifi-cally, GW Ori (0.93,0.95), V380 Ori (0.88,0.87),V1121 Oph (0.85, 0.91), and RW Aur (1.02,0.84).We finally noting that it appears the Ca II tripletratio changed sometime during the post-outburstphase between March and November 2004 suggest-ing a fundamental physical change in the regionwhere the Ca II lines are emitted.
3.3. The Near-IR Appearance
Of primary interest in our H-band image shownin Fig. 3 is the fact that V1647 Ori itself is neb-ulous and not just a point-source. The nebu-losity takes the form of curving tails extendingfrom the star to the north-east and north-west.These features were also observed in the K-bandby Reipurth & Aspin (2004), in J, H, and K byOjha et al. (2004) and in J and K by AP07. Ourimage shows somewhat more extensive nebulosity,particularly at very faint levels, reaching as far asHH 22-IRS. These curving ’cometary’ tails mostlikely trace the cavity walls of a remnant outflowcavity (although, as we have noted, no such out-flow has yet been found). However, it has alsobeen suggested that such a cavity may be a rem-nant of infall to the circumstellar envelope (Whit-ney & Hartmann 1993; Kenyon et al. 1993; andHartmann, Calvet, & Boss 1996).
Such cavities, be they from infall or outflow,have been modeled by Reipurth et al. (2000) andlater Stark et al. (2006). The purely geometricmodels of Reipurth et al. (2000) were appliedto HST NICMOS images of Herbig-Haro energysources and predicted the cavity shape for differentopening angles and inclinations. A cursory com-parison between the McNeil’s Nebula optical im-age from February 2004 (Fig. 1) and their resultssuggests that an inclination with respect to theline-of-sight, θ, of ∼60 degrees and cavity open-ing angle, α, of ∼30 degrees is appropriate. Morequantitatively, applying formulae (1) for θ and (2)for α from Reipurth et al. (2000) we obtain valuesof θ ∼65 degrees and α ∼30 degrees.
In the models of Stark et al. (2006), the cav-ity walls are assumed to be seen in reflected light.They predict the near-IR outflow cavity geome-try for a variety of physical parameters associ-ated with both the circumstellar disk and an ex-tended infalling envelope. They also consider theeffect of cavity inclination and the shape/form ofthe cavity e.g. a ’streamline’ cavity with straightwalls extending away from the central star, ora ’curved cavity’ (as we see in V1647 Ori) onthe derived morphology. Although these modelswere created specifically to interpret HST NIC-MOS images of young stellar objects in Tau-rus (e.g. IRAS 04302+2247, DG Tau B, andCoKu Tau/1), their use as a qualitative compari-
8

son to our V1647 Ori H-band image seems appro-priate. Of the NICMOS observations consideredin Stark et al. (2006), those of CoKu Tau/1 ap-pear most similar in morphology to our near-IRdata on V1647 Ori although the spatial scales con-sidered are clearly much different. The numericalmodel that best fits the CoKu Tau/1 data involvesa curving (bipolar) cavity with opening angle 20degrees and inclination to the line-of-sight of 64degrees, an infalling envelope with infall rate of2×10−7 M�yr−1, and a disk with a 50 AU radiusdisk. Clearly, we cannot make any claim that thebest-fit parameters for CoKu Tau/1 are appropri-ate for V1647 Ori, only that such parameters pro-duce a model that qualitatively resembles the cav-ity walls observed. An important point, however,is that the models predict that the extent of thecavity wall illumination changes significantly withoutflow axis inclination and that the most appro-priate model for CoKu Tau/1 has an inclination of64 degrees, a value close to that derived by AP07.
In addition to V1647 Ori, the H-band im-age shown in Fig. 3 contains several other point-sources including the interesting near-IR objectHH 22-IRS. The nebulous extensions seen in theIRAC images of this source are also detected inour H-band images and likely take the form ofcavity walls extending to the west from HH 22-IRS. These cavity walls appear more streamlinedthan curved. Higher spatial resolution, high sig-nal:noise data may shed light on the origin of bothtypes of cavities.
3.4. The Near-IR Spectroscopic Features
Fig. 4 shows the near-IR spectrum of V1647 Orifrom 1 to 4.1 µm taken with SpeX on the NASAIRTF telescope. The top panel shows the com-plete spectrum while the middle and bottom pan-els show expanded views of the J and H band(middle), and K band (bottom). Numerous spec-tral emission and absorption features are identifiedfrom both atomic and molecular transitions. In-spection of Fig. 4 shows that a year after the out-burst had subsided, V1647 Ori shows broad wa-ter vapor absorption features (1.3–1.6 µm, 1.75–2.2 µm, and 2.35–2.5 µm), as well as deep wa-ter ice absorption (2.8–3.3 µm). Particularly sig-nificant is the presence of weak CO overtone ab-sorption (2.294 µm), weak atomic Na I absorption(2.206 µm), and weak Ca I absorption (2.264 µm).
These features are best seen in the expanded 2.1–2.4 µm spectrum in Fig. 5. In emission, we seerelatively strong Brγ (2.166 µm), weak H2 v=1-0S(1) (2.122 µm), weak [Fe II] (1.275, 1.533, 1.644,and 1.809 µm), and several other H I lines fromthe Paschen and Brackett series, the longest inwavelength being Brα (4.05 µm).
Of particular note is the evolution of the COovertone features from 2.3–2.5 µm through theoutburst. In the near-IR spectra of Reipurth &Aspin (2004) and Vacca et al. (2004), taken inFebruary and March 2004, respectively, the COovertone bandheads were strongly in emission. Asthe outburst progressed the CO emission band-heads faded and in the May 2006 spectrum ofAP07 the 2.3–2.5 µm region was featureless andremained so in their August 2006 spectrum. Inour spectrum from February 2007, however, we arenow seeing weak CO bandheads in absorption. Aswe shall see below (Section 3.5), we believe thatwe are observing CO, Na I and Ca I absorptionfrom the stellar photosphere of V1647 Ori.
The Brγ emission flux from V1647 Ori was alsotracked by AP07. They found an approximatelylinear decline in Brγ flux from 2.2×10⁻¹⁶ W m−2
in March 2004 to 3.3×10⁻¹⁷ W m−2 in September2006. Our Brγ flux of 2.3×10⁻¹⁷ W m−2 in Febru-ary 2007 follows this trend. A similar trend isfound in both He I (1.083 µm) and Paβ (1.282 µm)emission with an approximately linear trend de-clining by factors ∼ ×30 and ∼ ×17, respectively,from March 2004 to February 2007.
The broadest features present in the near-IRspectrum of V1647 Ori are due to water molecules.Specifically, we see water vapor absorption fea-tures in the J, H, and K bands, and water iceabsorption in the L band. While the water ice ab-sorption feature has been observed in V1647 Orifrom the very first observations at 3 µm (Vacca etal. 2004), water vapor absorption is detected forthe first time.
We find that the water ice absorption depthand profile in our spectrum appears very similarto the profiles found in the spectra presented byRettig et al. (2005) and Gibb et al. (2006). Thisperhaps suggests that the ice mantle grains werenot significantly affected by the outburst itself.
The presence of water vapor absorption sug-gests that we are observing a cool photosphere
9

of spectral type later-M. However, Shiba et al.(1993) suggested that a significant fraction ofyoung low-mass stars show water vapor absorp-tion in excess of their true spectral type. This wasinterpreted as evidence for absorption in the ex-tended atmosphere of a circumstellar disk. Qual-itatively the water vapor absorption we observein V1647 Ori seems inconsistent with the atomiclines and molecular band absorption seen in the Kband. A more detailed discussion of this is givenbelow where we apply stellar models to the ob-served spectrum to derive physical parameters as-sociated with the young star itself and the circum-stellar material.
3.5. Near-IR spectral modeling
The detection of neutral Na (2.206 µm) and Ca(2.265 µm) atomic absorption, and ro-vibrationalmolecular CO v=2-0 bandhead (2.294 µm) absorp-tion in the near-IR spectrum of V1647 Ori can beinterpreted as evidence that we are detecting fluxfrom a stellar photosphere. However, it is alsopossible that these spectral features are createdin a disk atmosphere. The atmospheres of cir-cumstellar disks are considered to be low-surfacegravity environments similar in many ways to theatmospheres of cool supergiants. In such atmo-spheres, molecular CO bandhead absorption hasbeen found to be extremely strong with respectto neutral atomic Na and Ca absorption. Exam-ples of such disk-dominated near-IR spectra canbe found in FUors where the 2µm spectrum isoften relatively featureless besides deep, broad-ened CO absorption (see for example Fig. 1 inReipurth & Aspin 1997). In V1647 Ori, unlessthe CO absorption is significantly diluted by COemission, the strength of the Na and Ca lines withrespect to the CO absorption suggests that the en-vironment of the absorption region is more dwarf-like than supergiant-like. However, we find it isnot perfectly dwarf-like but intermediate betweendwarf and giant values. This is consistent withV1647 Ori being a young, pre-main sequence dwarfstar still contracting along Hayashi tracks. In thediscussion and analysis that follows, therefore, weassume that the Na, Ca, and CO absorption fea-tures are from the stellar photosphere of V1647 Oribut note that this assumption is not unambigu-ously determined.
By modeling the strength of photospheric ab-
sorption features, using, for example, spectraltemplate stars, allows us to derive estimates of theunderlying stellar type, the characteristics of theIR excess emission, and the extinction toward thephotosphere. We have first applied the modelingmethod of Prato, Greene & Simon (2003) to the K-band spectra of V1647 Ori. This is the spectral re-gion where the aforementioned photospheric linesare found. The spectrum was fit with a series ofmodels of spectral type template stars which wereveiled with infrared emission excess and reddenedby extinction using the ISM extinction law:
Aλ = Av[0.55/λ]1.6 (1)
taken from Prato, Greene & Simon (2003)where 0.55 and λ are in microns. The K-bandveiling, rK , is defined as the ratio of the infraredexcess at 2.22 µm to the intrinsic stellar continuumflux. The results of Muzerolle et al. (2003) andBeck (2007) show that IR excess can be describedby blackbody emission with a single character-istic temperature and hence, for the purpose ofthe K-band models, we use an IR excess with ablackbody temperature, Tdust, of 1000 K. A χ2
search for the optimum rK value and the best-fitAV was performed for a range of stellar templatestars from K5 to M3. The reader is referred toPrato, Greene & Simon (2003) and Beck (2007)for more details of the models.
In Fig. 7, we plot the K-band spectrum ofV1647 Ori (in black) with the best-fit models forthree template stellar types, K7 V, M0 V andM1 V. Stellar types in the K5 to M2 range providethe best average fit to the detected photosphericfeatures: stars with much earlier types (i.e. ∼K3or earlier) have Mg I (2.281 µm) absorption whichshould have been detected at the same strength asCa (2.265 µm), and stars with much later stellartypes (i.e. ∼M3 and later) have much strongerNa I (2.206 µm) absorption relative to Ca I. Thisis true for both dwarf stars and giants. The stel-lar templates were taken from the NASA IRTFSpeX stellar spectral library located on the IRTFweb site2. From the K-band model fits, the best-fit values give Av ∼29 magnitudes, and rk=1.4–1.5. However, early in the process of modelingthe K-band spectra, it became apparent that the
2http://irtfweb.ifa.hawaii.edu/ spex/spexlibrary/IRTFlibrary.html
10

spectrum at wavelengths greater than ∼2.3 µm de-viated significantly from the models which best-fitthe photospheric absorption features (see Fig. 7).This deviation is best explained by excess absorp-tion from water vapor often seen, for example, inFUors (Greene & Lada 1996). The presence of wa-ter vapor features significantly affects the extinc-tion values determined by modeling the K-bandalone. Fitting the steep slope of the K-band spec-tra at λ <2.3 µm (made steeper by the 1.9–2.2 µmwater vapor band) requires extinction value of ∼29magnitudes. This is a much larger AV than pre-viously associated with V1647 Ori (i.e. 6–14 mag-nitudes, Aspin & Reipurth 2004; Briceno et al.2004; Abraham et al. 2004; Andrews et al. 2004;Vacca et al. 2004, Ojha et al. 2006, AP07) and,since water vapor absorption occurs shortward of2.2 µm also, we conclude that the K-band modelsare likely affected by the presence of water vaporand are therefore inadequate for the derivation ofphysical characteristics.
To further investigate the above models valid-ity, we have extended the near-IR spectral mod-eling of Prato, Greene, & Simon (2003) and theversion used by Beck (2007) to include the full1.0–4.1 µm spectral range in the hope of placingmore stringent constraints on both AV and rK .The extended synthesis model was adapted fromthe K-band spectral code to use an optical depthmodel which included water ice absorption, and aninfrared excess model that included water vaporabsorption. The model of the observed 1–4.1 µmspectrum is defined as:
Fobs = C × [(Fint + k(λ))e−τ(λ)] (2)
where Fint is the intrinsic photospheric flux ofthe young star estimated from the spectral tem-plate star. The wavelength dependent opticaldepth, τ(λ), has two components: first from theISM extinction law as described in Eqn. 1 above,and second from an optical depth component, τice,derived directly from laboratory absorbance datafor water ice (Gerakines et al. (1995; 19963). Theparameter C is a scaling constant to normalize themodel to unity at 2.22 µm. The value k(λ) is thewavelength dependent emission excess, which isdescribed using black-body radiation with a tem-
3Laboratory water ice absorbance data are available onlineat: http://www.strw.leidenuniv.nl/∼lab
perature, Tdust, constrained by the required rK
value at 2.22 µm determined by the K-band mod-els (Muzerolle et al. 2003). We have made animportant modification to the Muzerolle et al. in-frared excess model by incorporated an estimateof water vapor absorption. To accomplish this,we have multiplied the blackbody curve that de-scribes the infrared excess emission by a smoothedtemplate model of water vapor absorption. The re-sults are presented in Fig. 8. The red curve is theblackbody IR excess with a temperature of 1000 K,and the blue curve is this blackbody multipliedby the water vapor absorption model. The watervapor absorption model was constructed by i) re-moving all photospheric absorption features froma M7 V star (using the SpexTool “xcleanspec”routine – Cushing, Vacca, & Rayner 2004), ii)smoothing the cleaned spectrum using a 10-pixelboxcar, iii) dividing the smoothed spectrum by ablack-body of temperature 2600 K to remove theM7 V spectral continuum shape, and iv) normal-izing the flux of the water vapor model to unity at2.22 µm. An M7 V stellar spectrum was adoptedsince it best fit the water absorption observed inV1647 Ori. Since water vapor characteristics arenot derived by the fitting procedure and only al-low us to obtain more meaningful values of thefree-parameters, we deemed this methodology ac-ceptable.
A χ2 minimization search was performed overthe three parameters, Av, Tdust and τice as in Beck(2007). To obtain meaningful uncertainties on thederived values, we have generated a range of χ2
surfaces for Av and Tdust values for the K5 toM2 range of stellar types which best fit the K-band spectrum (e.g. Fig. 7). A χ2 minimizationsearch was performed over the three parameters,Av, Tdust and τice. As found by Beck (2007), theoptical depth of the water-ice absorption featuredid not affect the models appreciably in that onlysmall changes in τice are seen for a wide range ofAv and Tdust values. For the analysis involvinga range of stellar types, the infrared veiling valuewas adopted to be rk=1.5 and the shape of theIR excess incorporated water vapor excess as inFig. 8. Fig. 9 presents the χ2=1.01, 2.0 and 3.0surfaces in Av and Tdust for the models using K5 V(red), K7 V (green), M0 V (blue), M1 V (cyan),and M2 V (magenta) spectral template stars. Be-cause the models are fitting a broad spectral range,
11

the 1σ surface (approximated by χ2=3.0) is verynarrow in Av and Tdust. Best-fit Av values rangefrom 17.5 to 21.5 magnitudes, while best-fit Tdust
values span the range 900 K to 1150 K. Basedon these results and the K-band fits, we adopt theM0 V stellar template star to be the most accuratemodel, with an uncertainty of ±2 spectral classes.
To further define the uncertainties in the spec-tral models, a second χ2 set of searches was per-formed over Av and Tdust. For this search, a spec-tral type of M0 V was adopted and the infraredveiling value, rk, was the free parameter. Fig. 10presents the χ2=1.01, 2.0 and 3.0 surfaces for Av
vs. Tdust using rk=1.3 (red), 1.4 (green), 1.5(blue), 1.6 (cyan) and 1.7 (magenta). Again, for arange of infrared veiling values, models that fit thebroad 1.0–4.1 µm spectral range show very smallvariation in the χ2 surface. Based on these analy-ses, the best-fit model for the 1.0–4.1 µm near-IRspectra of V1647 Ori (including the effects of wa-ter vapor absorption) is adopted to be an M0±2star with Av=19±1 magnitude, rk=1.5±0.2, anda Tdust=1000 K±100 K.
Fig. 11 presents the full 1.0–4.1 µm spectrumof V1647 Ori with the best-fit model overplot-ted in red. Unfortunately, the models cannot ex-plain the known long-wavelength absorption wingto the 3.0 µm water-ice absorption feature (the3.27–3.70 µm region was excluded from the spec-tral model fits – Smith et al. 1989; Beck 2007).Fig. 12 shows the full χ2=1.01, 2.0, 3.0, 6.0, and10.0 surfaces for the model using an M0 V tem-plate star. The χ2=10.0 surface is a measure ofthe 3σ uncertainties in the model. Visual extinc-tions as low as ∼11 magnitudes Av as measured byother studies (e.g. AP07) are excluded at a >3σlevel of confidence in our models.
3.6. Additional determinations of visualextinction
Of crucial importance to the determination ofthe physical parameters of V1647 Ori is the deter-mination of reliable visual extinction values. Withthe dramatic optical fading of V1647 Ori of over5 magnitudes, AV values towards the young starlikely vary with time as suggested by Reipurth &Aspin (2004). McGehee et al. (2004) determinedthat at optical wavelengths the change in color ofthe source was a result of both an AV change andthe addition of significant blue accretion luminos-
ity. However, in the near-IR, the effect of suchan increase in optical brightness would probablybe much smaller. Below, we examine our near-IRphotometry and spectroscopy and attempt to de-rive AV values using several different and indepen-dent methods and compare them to AV ∼19±1derived from the spectral template fitting.
3.6.1. AV from Near-IR colors
From our calibrated near-IR spectrum we canobtain estimates of the broad-band J, H, and Kmagnitudes of V1647 Ori. The determination ofJ and K magnitudes from this spectrum was per-formed using our ULBCam H band imaging mag-nitude of 11.96 to determine an absolute calibra-tion. Using the conversion defined by Tokunaga &Vacca (2005) for J and K bands, we obtain J=14.8,H=11.96, and K=9.87 and hence J-H=2.8 and H-K=2.1. Dereddening these values along a redden-ing vector to the CTTS locus defined by Meyer etal. (1997) gives an AV ∼17±4 magnitudes wherethe uncertainty is derived from the errors on thephotometric values.
An interesting feature of the published near-IR colors for V1647 Ori is that values from Octo-ber 1998 (2MASS), March 2004 (Reipurth & As-pin 2004), and May 2006 (AP07) all lie close tothe same reddening vector and have a range ofAV values from ∼9 (at the peak of the outburstphase) to ∼17 magnitudes (one year into the qui-escent phase). This trend demonstrates that theAV towards the star decreases during outburstand increase as the source fades toward quies-cence. Fig. 13 shows this graphically where we plotpublished J-H and H-K colors covering the pre-outburst, outburst and the quiescent phase (ourdata). Using these published near-IR colors, wehave derived the AV values for each observation bydereddening onto the CTTS locus. The estimatedAV values are plotted against time in Fig. 14.It is clear from this plot that the AV towardsV1647 Ori is considerably larger in its quiescentphase than during the outburst phase. We haveconsidered whether a change in Tdust near the starcould mimic the change in AV seen in Fig. 14.Near-IR J-H and H-K colors for pure Planck func-tions with temperatures in the range 950 K to1350 K do give similar colors as V1647 Ori exhibitsin Fig. 14, however, for this to be the underly-ing cause of the observed color changes from out-
12

burst to quiescence we would have to be observingpurely thermal emission from the cool black-bodywith an insignificant contribution from the stellarphotosphere. Since we detected photospheric fea-tures in the quiescent phase K-band spectrum ofV1647 Ori, this interpretation is clearly invalid.
It also appears that i) the near-IR colors ofV1647 Ori are little effected by the addition of thehot accretion component to the luminosity duringthe outburst phase, and ii) that the near-IR ther-mal excess remained approximately constant fromthe outburst to the quiescent phase with a changein visual extinction of ∆AV ∼8 magnitudes. Theonly way (i) above can occur is if the accretion lu-minosity is ’gray’ at near-IR wavelengths i.e. theaccretion luminosity increases the emergent fluxbut does not change the observed near-IR colorsof the source. Gray absorption has been previouslyobserved in accreting young stars in Orion A byCarpenter, Hillenbrand, & Skrutskie (2001) andinterpreted as being due to large particles. How-ever, whether a similar mechanism can be invokedfor emission is unclear. As to (ii) above, it wouldseem that the level of accretion in the pre-outburstphase (when the near-IR colors were measured by2MASS i.e. October 1998) must have been similarto that in quiescence (in February 2007), otherwisethe SEDs would not be close to identical.
3.6.2. AV from near-IR [Fe II] line ratios
Reipurth et al. (2000) used the two near-IR[Fe II] lines at 1.275 and 1.644 µm to obtain an es-timate of the visual extinction towards the [Fe II]emitting region in a number of HH energy sources.This is possible since the transitions forming thelines arise from the same upper level and thereforethe line ratio is fixed. We note that the estimateobtained will be the line-of-sight extinction to the[Fe II] emitting region which may be located somedistance from the stellar photosphere and possi-bly extended in nature. Nonetheless, using theformula shown in Reipurth et al. (2000), invertedto estimate AV i.e.
AV = −25 × log10((I1.275/I1.644)/1.36) (3)
for an extinction law that gives AV ∼10×EJ−H,the [Fe II] line fluxes in Table 2 give a ratioI1.275/I1.644=0.3 and therefore an AV ∼16±3 mag-
nitudes. The error is estimated from repeat mea-surement of the (weak) line fluxes.
3.6.3. AV from the 3 µm water ice absorptionfeature
As outlined in Beck (2007), deriving AV val-ues from the 3 µm water ice absorption featureis somewhat unreliable for AV >20 magnitudesdue to uncertainties in the relationship between iceband optical depth and AV . Also, grains nearerto the star that still contribute to the line-of-sightextinction, may not have ice mantles if the localtemperature is >200 K. Nonetheless, since all in-dications are that for V1647 Ori we are dealingwith AV values <20 magnitudes (e.g. AP07), weproceed with the derivation.
Following Beck (2007) and using the relationpresented in Teixeira & Emerson (1999) betweenwater column density, N(H2O), and AV , for apeak optical depth in the water band τpeak ∼0.7,and a FWHM of the band of 320 cm−1, we ob-tain N(H2O)∼1.0 1018 cm−2. This value is almostidentical to that derived by Rettig et al. (2006) i.e.1.2 1018 cm−2. From Fig. 5a in Teixeira & Emer-son (1999), we see that the above column densitycorresponds to an AV ∼13±4 magnitudes. How-ever, as found in Beck (2007), changing the valueof AV used resulted in only small changes in themodel continuum level and did not substantiallychange the derived ice absorption optical depth.In light of this, we consider that the AV derivedusing the ice absorption optical depth is likely notas accurate as the values from the other determi-nations above.
3.6.4. AV from near-IR H I line ratios
Another method for determining AV towardsthe emitting region is the measured ratio of theH I lines Brγ (2.166 µm) and Brα (4.052 µm).This determination requires the assumption thatonly Lyα photons are optically thick (i.e. Case Bof Baker & Menzel 1938) over a wide range of tem-peratures and densities. If that assumption is cor-rect then the ratio Brα/Brγ should be in the range2.85–3.17 (Hummer & Storey 1987). Due to therelatively low signal to noise of Brα it is difficult toestimate the line flux accurately. Our best value ofthe above ratio, obtained from repeated measure-ments of the Brα line flux, is 2.0±0.6. This sug-
13

gests that the Brα line flux is less that expectedfrom Case B and, hence, the Case B assumptionis likely invalid. As a result of this, we do not at-tempt to derive AV values from the H I emissionratios.
3.6.5. Summary of derived AV values
To summarize, our four independent determi-nations of AV i.e. from spectral template fit-ting (19±1), near-IR colors (17±4), [Fe II] lineratios (16±3), and 3 µm ice absorption opticaldepth (13±4), all give reasonably consistent re-sults. However, since we put lower weight onthe value determined from the 3 µm ice absorp-tion feature, and are most confident in the AV
value derived from our spectral template fitting,we adopt AV ∼19±2 magnitudes as the visual ex-tinction towards V1647 Ori in February 2007 andnote that the AV values derived from near-IR col-ors and [Fe II] line ratios are consistent with thisvalue (within the associated uncertainties). Addi-tionally we have found that there was a systematicdecrease in AV towards V1647 Ori during the out-burst phase. This was mirrored by an increase inAV as the source faded to, and into, quiescence.
3.7. Derived physical parameters
3.7.1. Luminosity and absolute magnitude
Above, we determined that V1647 Ori is likelya star of spectral type M0±2 with a Teff of∼3800 K, a visual extinction AV ∼19±2 magni-tudes (in February 2007), a veiling of rK=1.5±0.2,and an apparent K magnitude of mK ∼9.90 (inFebruary 2007). Using the bolometric correction(Mbol–Mv=-1.3) and M0 color (V–K=3.7) fromTable A5 in Kenyon & Hartmann (1995) and theequations for Mbol and L∗ from Greene & Lada(1997), we estimate that V1647 Ori has an abso-lute bolometric magnitude of Mbol ∼2.9±0.4 anda luminosity of L∗ ∼5.2±2 L� for a distance ofd=450 pc (m-M=8.3). The error on our value ofL∗ takes into account the uncertainties on rK , AV ,and the spectral type quoted above, but not un-certainties in distance. Thus, we estimate that thestar has a radius, R∗, of ∼5 R� using the standardTeff vs. L∗ relationship.
3.7.2. Stellar mass and age
Using the stellar luminosity and spectral typederived above, we can place V1647 Ori on pre-main sequence stellar tracks using results fromnumerical models. Our adopted values areL∗ ∼5.2±2 L� and Teff ∼3800±350 K. Thetemperature (and associated uncertainty) comesfrom our adopted spectral type of M0 (±2 sub-classes) using the values in Table A5 of Kenyon& Hartmann (1995). We have placed V1647 Orion the evolutionary tracks of both Baraffe et al.(1998) and Siess et al. (2000). Figs. 15 and 16show its location on these model tracks. Themodels give masses and ages for V1647 Ori of1 M�/<0.5 Myrs, and 0.55 M�/<0.5 Myrs, re-spectively. We conclude therefore that, conserva-tively, V1647 Ori is probably of mass 0.8±0.2 M�with an age of < 0.5 Myrs.
3.7.3. Mass accretion rate and accretion lumi-nosity
It is possible to determine mass accretion ratesfor young stars like V1647 Ori using H I emis-sion line strengths. Following Muzerolle, Hart-mann, & Calvet (1998), we can use the dereddenedflux of the near-IR emission lines Paβ and Brγ toderive accretion luminosities, Lacc, and followingGullbring et al. (1998) determine a mass accre-tion rate, M. The reader is referred to Eqns. 1 &2 in Muzerolle, Hartmann, & Calvet (1998) andEqn. 8 in Gullbring et al. (1998) for further de-tails of the derivation. For the calculations below,we assume Mstar=0.8±0.2 M�, L∗=5.2±2 L�,Tstar=3800 K, Rin=5 Rstar, AV =19, the extinc-tion law shown in Eqn. 1 above, and d=450 pc.Rin is the inner radius of the accretion disk.
Dereddened fluxes and derived Aλ values forall detected optical and near-IR emission lines areshown in Table 2. Using the dereddened Paβflux, we obtain Lacc ∼3.5 L� and log(M)∼–6.1or M∼8.8 10−7 M� yr−1. With the uncertain-ties associated with the parameters in the for-mula used, the range of possible values for Lacc
are 2.1–5.5 L� and for M is 5.4 10−7 to 1.4 10−6
M� yr−1. Similarly, for the dereddened Brγ flux,we obtain Lacc ∼4.6 L� and a log(M)∼–5.92 orM∼1.2 10−6 M� yr−1. Considering the quoteduncertainties, we obtain a range of possible val-ues of Lacc of 2.8–7.7 L� and M=7.2 10−7 to
14

2.0 10−6 M� yr−1.Another method to derive M was discussed by
White & Basri (2003) and Natta et al. (2004).This derivation relates the width of the opticalHα emission line to accretion rate. The quan-tity used for this is the Hα full width at 10%peak intensity and an approximately linear rela-tionship was found between this and log(M) byNatta et al. (2004). Even though the Hα line pro-file appears asymmetric we apply this techniqueto investigate its applicability. Using Eqn. 1 fromWhite & Basri (2003), and a measured Hα at 10%width of 740 km s−1, we obtain a log(M)∼–5.7or M∼2 10−6 M� yr−1. This derivation assumesthat the Hα emission is solely the result of the ac-cretion processes and not contaminated by stellarwinds (absorption/emission) and/or HH flows/jets(emission) which, due to the presence of an asym-metric profile, may not be the case. However, wenote that if we double the blue-wing 10% emissionwidth to compensate for the red-shifted absorp-tion, we would obtain a larger value of Hα at 10%and hence, a larger accretion rate.
To summarize, our two estimates of accretionluminosity and rate give reasonably consistent re-sults and we adopt values of Lacc ∼4±2 L� andM∼1.0±0.5 10−6 M� yr−1, respectively.
3.7.4. Bolometric Luminosity
Our estimate of Lbol is the sum of our derivedL∗ and Lacc values, or, Lbol=9.2±3 L�. An-drew, Rothberg, & Simon (2004) calculated anoutburst luminosity of Lbol ∼3.5 L� and notedit was similar to the one derived by Lis, Menten,& Zylka (1999) once a distance correction was ap-plied (they assumed d=400 pc). They also con-sidered their luminosity estimate a lower limit dueto the lack of information on the spectral energydistribution (SED) peak in the far-IR and the lin-ear interpolation used to define the SED. We notethat the Lbol estimate from Lis, Menten, & Zylka(1999) only considered emission from two modifiedPlanck functions that fitted the IRAS and sub-mm fluxes and did not include a stellar compo-nent. In addition, it is clear that the IRAS fluxescan contain contributions from nebular emissionand from other stars in the beam thus contami-nating the measurements. We also note that An-drews, Rothberg, & Simon (2004) did not quoteany formal uncertainty on their Lbol determina-
tion. The error value is probably significant inlight of the points related above. We consider ourestimate of Lbol to be robust in that it has consid-ered both stellar luminosity and accretion lumi-nosity independent of the source SED. Since theSED of V1647 Ori is very similar pre-outburst andin the quiescent phase (see Section 3.7.5), we con-sider that the Lbol of the source during both theseperiods is 9.2±3 L�.
3.7.5. Spectral Energy Distribution
The SED of V1647 Ori is shown in Fig. 17.The open stars are the data from February 2007while the open boxes and solid points are the pre-outburst and outburst SEDs, respectively. Wehave used the same data as Andrews, Rothberg, &Simon (2004) longward of 25 µm (i.e. IRAS, andJCMT data) and note that they state that thepre-outburst and outburst photometry from 350–1300 µm was unchanged by the eruption. It is ob-vious that the quiescent phase SED is almost iden-tical in shape and flux level to the pre-outburstSED. This suggests that the state of V1647 Oriin February 2007 was very similar to that in thepre-outburst period.
3.8. The Mid-IR Characteristics
In Fig. 18 we show the mid-IR N-band spectrumof V1647 Ori from UT 5 April 2007. These datawere calibrated using the mid-IR photometric datapresented in Table 2. The spectrum is featurelessapart from a change in slope around ∼9.5 µm.Shortward of this wavelength the spectrum is rel-atively flat. At ∼9.5 µm, however, the slope in-creases rapidly to the edge of the band. A previousmid-IR spectrum from Andrews, Rothberg, & Si-mon (2004) taken in March 2004 did not show thischange in spectral index. Their spectrum rose tothe red with a power-law fit Fν ∼ λ2.5. A similarfit to the 9.2–13 µm region of our spectrum givesFν ∼ λ2.8.
One difference between our N-band spectrumand that of Andrews et al. is that the flux level hasdecreased significantly from ∼7 Jy to ∼0.14 Jy at10 µm, a decline of a factor ×50. In a study of thepre-outburst infrared characteristics of V1647 Ori,Abraham et al. (2004) presented ISOCAM pho-tometry at 6.7 and 14.3 µm. If we interpolatethese values to 10 µm we obtain a pre-outburst
15

brightness of ∼0.4 Jy. In addition, the IRAS12 µm point-source flux for IRAS 05426-0007 is0.53 Jy. Given the uncertainties in the nature ofthe emission included in both the ISOCAM andIRAS beams, we consider this a reasonable agree-ment.
We consider that the aforementioned change inspectral slope at ∼9.5 µm is in fact indicative ofthe presence of weak silicate absorption throughthe passband. We follow the analysis of Quanzet al. (2007), who studied a number of FUorsin the mid-IR using ISO and IRS spectroscopicdata. They fitted a linear continuum between8 µm and 13 µm and subtracted the observedspectrum from the result of the fitting procedure.In Fig. 18 we show such a linear fit as a dashedline. Subtracting a dereddened (with AV =19) ob-served spectrum from this fit and converting theresult from flux to optical depth, τ , we obtain theplot shown in Fig. 19 where a relatively shallowyet typical silicate absorption band seen with amaximum optical depth of τ ∼0.35. Convertingthis value to an extinction at the absorption min-imum i.e. 9.2 µm (we termed this A9.2) resultsin a value of 0.38±0.15 magnitudes. For com-parison, the expected extinction at 9.2 µm for anAV =19 is A9.2 ∼0.2. Additionally, comparing oursilicate absorption plot with those from Quanz etal. (2007, their Fig. 15) we see a number of FUorswith similarly shaped band, specifically, V346 Norand Z CMa, which also have similar maximum op-tical depth to V1647 Ori (of τ ∼0.3). A cursorycomparison of the silicate absorption band shapewith the model silicate bands from Quanz et al.(2007, their Fig. 16) suggests that the V1647 Orisilicate band is most similar to that modeled usingastronomical silicates as defined by Weingartner &Draine (2001) and Draine (2003).
In the observations of Andrews, Rothberg, &Simon (2004) from UT March 11 2004, there is noevidence for any silicate feature be it in absorptionor emission. The mid-IR spectra of Quanz et al.(2007), from three epochs (UT October 20 2004,UT March 11 2005, and UT March 24 2005) wereall found to show weak 10 µm silicate emissionfeatures. Mosoni et al. (2005) shows an mid-IRspectrum of V1647 Ori taken UT March 1 2005.This showed a similar weak silicate emission fea-ture seen by Quanz et al. Fedele et al. (2007a) alsopresented 10 µm spectra from three epochs (UT
March 8 2004, UT February 21 2005, and UT Jan-uary 10 2006). In these, we believe that silicateemission is weakly present in only the February2005 spectrum. The progression therefore seemsto be that i) silicate emission developed from afeatureless red continuum between UT March 112004 and UT October 20 2004, ii) the emissionpersisted until at least UT March 24 2005, and iii)by UT January 10 2006 there was perhaps weaksilicate absorption which grew a little deeper astime progressed to the level shown in our 10 µmspectrum from UT April 05 2007. This result im-plies that there must have been significant dustevolution in V1647 Ori over the outburst periodfrom March 2004 to April 2007.
It is well known that some young eruptive vari-able stars show a 10 µm silicate feature in emissione.g. the FUors FU Ori, BBW 76, and V1057 Cyg(Green et al. 2006). Others, however, showa 10 µm silicate feature in absorption e.g. theFUors V346 Nor, Z CMa, L1551 IRS5 (Greenet al. 2006). Silicate absorption is clearly pro-duced when dense, cool silicate dust is locatedbetween the radiation source and the observer.Silicate emission occurs when heated, opticallythin, silicate dust, at a higher temperature thanthe source of the 10 µm continuum emission, isdirectly visible to the observer. In addition toV1647 Ori, Quanz et al. (2007), studied of a num-ber of FUors, using Spitzer and ISO data, andsuggested that two categories exist, one with ab-sorption created in a dense, dusty, and icy enve-lope (Category 1, herein C1), and the other withemission from the heated surface layers of a cir-cumstellar/accretion disk (Category 2, herein C2).They considered the progression from C1 to C2evolutionary in nature and related to the size ofthe cold, icy dust envelope. Hence, C1 FUorswould be younger objects that still possess ex-tensive, dense, cold envelopes through which weare observing the FUor. C2 FUors would be moreevolved in nature with only remnant envelopes anda more exposed accretion disk. Since FUor erup-tions are thought to repeat many times throughthe Class I to Class II stages, this is clearly a possi-bility although system orientation with respect tothe line-of-sight may be important. Even thoughV1647 Ori is not considered a FUor, perhaps theclearing/sublimation of dust towards the star re-sulted in the accretion disk being revealed (C2)
16

and as the eruption and wind subsided significantdust re-accumulated/condensed along the line-of-sight, obscuring the accretion disk, and creatingenough column density to create the weak silicateabsorption feature (C1).
We defer further consideration of the 10 µmspectra to a future paper in which we will con-sider dust evolution more comprehensively usingall published and archival 10 µm spectra togetherwith new 10 µm spectra taken during our twoyear Gemini monitoring campaign (Aspin et al.,in prep). We conclude by noting thati) the ap-pearance (and disappearance) of silicate emissionsupports the interpretation that the mid-IR fluxoriginates from the circumstellar disk as suggestedby Muzerolle et al. (2005) and Abraham et al.(2006), and ii) the appearance of silicate absorp-tion suggests that the line-of-sight column densityof cold dust increased as the outburst faded andthe source returned to its quiescent state.
4. CONCLUSIONS
From our optical, near-IR, and mid-IR imagingand spectroscopy of V1647 Ori dating from Febru-ary to April 2007, approximately one year after itsreturn to its pre-outburst optical brightness, wecan conclude that:
• The associated nebula, McNeil’s Nebula, re-mained faintly visible suggesting that quasi-static nebula material is still being illumi-nated by V1647 Ori.
• We confirm the findings of Fedele et al.(2007a) in that signposts of shock-excitedemission, specifically, in the emission linesof [S II], [Fe II], and H2 are present. Weconsider that it is a distinct possibilitythat these emission lines result from a newHerbig-Haro flow.
• Our near-IR spectrum shows, for the firsttime, molecular overtone absorption fromCO and atomic absorption from neutral Naand Ca. We interpret this as evidence thatwe are now observing the stellar photosphereof V1647 Ori.
• We have modeled the near-IR spectrum us-ing a template stellar spectrum including
both water vapor and water ice absorp-tion and have determined a best-fit param-eter set of spectral type M0±2 sub-classes,AV =19±2 magnitudes, rK=1.5±0.2.
• We derive values of Mbol=2.9±0.4 magni-tudes and L∗=5.2±2 L� for V1647 Ori.From comparison with theoretical evolu-tionary tracks, find that, for the adoptedTeff ∼3800 K, the star has a mass and ageof 0.8±0.2 M� and �0.5 Myrs, respectively.
• From near-IR H I line flux and the AV
values derived above, we estimate the ac-cretion luminosity and mass accretion ratein February 2007 was Lacc=4.0±2 L� andM=1.0×10⁻⁶ M� yr−1, respectively. Thisimplies that V1647 Ori is still actively ac-creting circumstellar material even thoughit is almost optically invisible and that theaccretion rate during the outburst must havebeen considerably larger that this value.
• V1647 Ori is found to have a quiescent phaseLbol of 9.25±3 L�.
• For the first time, we see evidence for sili-cate dust evolution in the mid-IR spectrumof V1647 Ori over the outburst to quiescenceperiod. We now observe weak silicate ab-sorption at 10 µm whereas previously thesilicate band was either absent or weakly inemission.
• Finally we note that, in February 2007,the spectral energy distribution, SED, ofV1647 Ori appears remarkably similar to itspre-outburst SED suggesting that perhapsthe derived accretion rate is the normal qui-escent phase accretion rate for this object.
AcknowledgmentsBased on observations obtained at the Gemini
Observatory (under program identification GN-2007A-Q-33 and GS-2005B-Q-13), which is oper-ated by the Association of Universities for Re-search in Astronomy, Inc., under a cooperativeagreement with the NSF on behalf of the Gem-ini partnership: the National Science Founda-tion (United States), the Particle Physics andAstronomy Research Council (United Kingdom),
17

the National Research Council (Canada), CON-ICYT (Chile), the Australian Research Council(Australia), CNPq (Brazil) and CONICET (Ar-gentina).
Colin Aspin and Tracy Beck were visiting as-tronomers at the Infrared Telescope Facility, whichis operated by the University of Hawaii under Co-operative Agreement no. NCC 5-538 with the Na-tional Aeronautics and Space Administration, Sci-ence Mission Directorate, Planetary AstronomyProgram.
This material is based upon work supported bythe National Aeronautics and Space Administra-tion through the NASA Astrobiology Institute un-der Cooperative Agreement No. NNA04CC08Aissued through the Office of Space Science.
REFERENCES
Acosta-Pulido, J. A., et al. 2007, AJ, 133, 2020(AP07)
Abraham, P., Kospal, A., Csizmadia, S., Moor, A.,Kun, M., & Stringfellow, G. 2004, A&A, 419,L39
Andrews, S. M., Rothberg, B., & Simon, T. 2004,ApJ, 610, L45
Aspin, C., Barbieri, C., Boschi, F., Di Mille, F.,Rampazzi, F., Reipurth, B., & Tsvetkov, M.2006, AJ, 132, 1298
Bacciotti, F. 2002, Rev. Mex. Astron. AstrofisConference Series, v13, p8
Baker, J. G., & Menzel, D. H. 1938, ApJ, 88, 52
Baraffe, I., Chabrier, G., Allard, F., & Hauschildt,P. H. 1998, A&A, 337, 403
Beck, T. L. 2007, AJ, 133, 1673
Beck, T. L., Riera, A., Raga, A. C., & Reipurth,B. 2007, AJ, 133, 1221
Bell, K. R., & Lin, D. N. C. 1994, ApJ, 427, 987
Briceno, C., et al. 2004, ApJ, 606, L123
Bonnell, I. & Bastien, P. 1992, ApJ, 401, L31
Buhrke, T., Mundt, R., & Ray, T. P. 1988, A&A,200, 99
Carpenter, J. M., Hillenbrand, L. A., & Skrutskie,M. F. 2001, AJ, 121, 3160
Cohen, M. & Jones, B. F. 1987, ApJ, 321, 846
Cushing, M. C., Vacca, W. D., & Rayner, J. T.2004, PASP, 116, 362
Davies, R. L., et al. 1997, Proc. SPIE, 2871, 1099
Dopita, M. A. 1978, ApJS, 37, 117
Draine, B. T. 2003, ARA&A, 41, 241
Eisloffel, J. & Mundt, R. 1997, AJ, 114, 280
Fedele, D., van den Ancker, M. E., Petr-Gotzens,M. G., Ageorges, N., & Rafanelli, P. 2007,ArXiv e-prints, 707, arXiv:0707.0672 (a)
Fedele, D., van den Ancker, M. E., Petr-Gotzens,M. G., & Rafanelli, P. 2007, ArXiv e-prints,706, arXiv:0706.3281 (b)
Gerakines, P. A., Schutte, W. A., Greenberg,J. M., & van Dishoeck, E. F. 1995, A&A, 296,810
Gerakines, P. A., Schutte, W. A., & Ehrenfreund,P. 1996, A&A, 312, 289
Gibb, E. L., Rettig, T. W., Brittain, S. D.,Wasikowski, D., Simon, T., Vacca, W. D.,Cushing, M. C., & Kulesa, C. 2006, ApJ, 641,383
Goodrich, R. W. 1987, PASP, 99, 116
Gredel, R. 1996, A&A, 305, 582
Gredel, R. 1994, A&A, 292, 580
Green, J. D., Hartmann, L., Calvet, N., Watson,D. M., Ibrahimov, M., Furlan, E., Sargent, B.,& Forrest, W. J. 2006, ApJ, 648, 1099
Greene, T. P., & Lada, C. J. 1997, AJ, 114, 2157
Gullbring, E., Hartmann, L., Briceno, C., & Cal-vet, N. 1998, ApJ, 492, 323
Grosso, N., Kastner, J. H., Ozawa, H., Richmond,M., Simon, T., Weintraub, D. A., Hamaguchi,K., & Frank, A. 2005, A&A, 438, 159
Hall, D. N. B., Luppino, G., Hodapp, K. W., Gar-nett, J. D., Loose, M., & Zandian, M. 2004,Proc. SPIE, 5499, 1
18

Hamann, F. & Persson, S. E. 1990, Cool Stars,Stellar Systems, and the Sun, v9, p304
Hamann, F. & Persson, S. E. 1992, ApJS, 82, 247
Hamann, F., Simon, M., Carr, J. S., & Prato, L.1994, ApJ, 436, 292
Hartmann, L., Calvet, N., & Boss, A. 1996, ApJ,464, 387
Hartmann, L., Calvet, N., Gullbring, E., &D’Alessio, P. 1998, ApJ, 495, 385
Hartmann, L. & Kenyon, S. J. 1985, ApJ, 299, 462
Hartmann, L. & Kenyon, S. J. 1996, ARA&A, 34,207
Heathcote, S. & Reipurth, B. 1992, AJ, 104, 2193
Herbig, G. H. 1977, ApJ, 217, 693
Herbig, G. H. 1989, in ESO Workshop on LowMass Star Formation and Pre-main SequenceObjects, ed. Bo Reipurth, p233
Herbig, G. H., Aspin, C., Gilmore, A. C., Imhoff,C. L., & Jones, A. F. 2001, PASP, 113, 1547
Herbig, G. H. & Soderblom, D. R. 1980, ApJ, 242,628
Hummer, D. G. & Storey, P. J. 1987, MNRAS,224, 801
Kastner, J. H., et al. 2004, Nature, 430, 429
Kastner, J. H., et al. 2006, ApJ, 648, L43
Kenyon, S. J., Whitney, B. A., Gomez, M., &Hartmann, L. 1993, ApJ, 414, 773
Kenyon, S. J. & Hartmann, L. 1995, ApJS, 101,117
Kospal, A., Abraham, P. A.-P. J., Csizmadia, S.,Eredics, M., Kun, M., & Racz, M. 2005, Infor-mational Bulletin on Variable Stars, 5661
Lehmann, T., Reipurth, B., & Brandner, W. 1995,A&A, 300, L9
Lis, D. C., Menten, K. M., & Zylka, R. 1999, ApJ,527, 856
McGehee, P. M., Smith, J. A., Henden, A. A.,Richmond, M. W., Knapp, G. R., Finkbeiner,D. P., Ivezic, Z., & Brinkmann, J. 2004, ApJ,616, 1058
McNeil, J. W. 2004, IAU Circ., 8284
Meyer, M. R., Calvet, N., & Hillenbrand, L. A.1997, AJ, 114, 288
Mosoni, L., Ratzka, T., Abraham, P., Kospal, A.,& Henning, T. 2005, Astron. Nach., 326, 565
Muzerolle, J., Hartmann, L., & Calvet, N. 1998,AJ, 116, 2965
Muzerolle, J., Calvet, N., & Hartmann, L. 2001,ApJ, 550, 944
Muzerolle, J., Hillenbrand, L., Calvet, N., Briceno,C., & Hartmann, L. 2003, ApJ, 592, 266
Muzerolle, J., Megeath, S. T., Flaherty, K. M.,Gordon, K. D., Rieke, G. H., Young, E. T., &Lada, C. J. 2005, ApJ, 620, L107
Natta, A., Testi, L., Muzerolle, J., Randich, S.,Comeron, F., & Persi, P. 2004, A&A, 424, 603
Ojha, D. K., Kusakabe, N., & Tamura, M. 2004,IAU Circ., 8306
Ojha, D. K., et al. 2005, Bull. Astron. Soc. India,33, 370
Ojha, D. K., et al. 2006, MNRAS, 368, 825
Pollack, J. B., Hollenbach, D., Beckwith, S., Si-monelli, D. P., Roush, T., & Fong, W. 1994,ApJ, 421, 615
Prato, L., Greene, T. P., & Simon, M. 2003, ApJ,584, 853
Quanz, S. P., Henning, T., Bouwman, J., vanBoekel, R., Juhasz, A., Linz, H., Pontoppidan,K. M., & Lahuis, F. 2007, ArXiv e-prints, 706,arXiv:0706.3593
Rayner, J. T., Toomey, D. W., Onaka, P. M., De-nault, A. J., Stahlberger, W. E., Vacca, W. D.,Cushing, M. C., & Wang, S. 2003, PASP, 115,362
Reipurth, B. 1989, Nature, 340, 42
Reipurth, B. & Aspin, C. 1997, AJ, 114, 2700
19

Reipurth, B., Yu, K. C., Heathcote, S., Bally, J.,& Rodrıguez, L. F. 2000, AJ, 120, 1449
Reipurth, B., & Aspin, C. 2004, ApJ, 606, L119
Rettig, T. W., Brittain, S. D., Gibb, E. L., Simon,T., & Kulesa, C. 2005, ApJ, 626, 245
Semkov, E. H. 2004, Informational Bulletin onVariable Stars, 5578
Semkov, E. H. 2006, Informational Bulletin onVariable Stars, 5683
Shiba, H., Sato, S., Yamashita, T., Kobayashi, Y.,& Takami, H. 1993, ApJS, 89, 299
Siess, L., Dufour, E., & Forestini, M. 2000, A&A,358, 593
Smith, R. G., Sellgren, K., & Tokunaga, A. T.1989, ApJ, 344, 413
Stark, D. P., Whitney, B. A., Stassun, K., &Wood, K. 2006, ApJ, 649, 900
Teixeira, T. C. & Emerson, J. P. 1999, A&A, 351,292
Tokunaga, A. T. & Vacca, W. D. 2005, PASP, 117,1459
Tsukagoshi, T., Kitamura, Y., Kawabe, R., Saito,M., Yokogawa, S., & Kurono, Y. 2005, PASJ,57, L21
Vacca, W. D., Cushing, M. C., & Rayner, J. T.2003, PASP, 115, 389
Vacca, W. D., Cushing, M. C., & Simon, T. 2004,ApJ, 609, L29
Vig, S., Ghosh, S. K., Kulkarni, V. K., & Ojha,D. K. 2006, A&A, 446, 1021
Walter, F. M., Stringfellow, G. S., Sherry, W. H.,& Field-Pollatou, A. 2004, AJ, 128, 1872
Weingartner, J. C. & Draine, B. T. 2001, ApJ,548, 296
White, R. J. & Basri, G. 2003, ApJ, 582, 1109
Whitney, B. A. & Hartmann, L. 1993, ApJ, 402,605
This 2-column preprint was prepared with the AAS LATEXmacros v5.2.
20

Table
1
V1647
OriO
bserving
Log
UT
Dat
eM
JDa
Tel
esco
pe/I
nst.
Filt
ers/
Gri
sm/λ
C/S
litW
idth
Exp
osur
eT
imes
Seei
ngP
hoto
met
ry
2005
1010
/11
3654
/5G
emin
i-S/
GM
OS-
S[S
II]
1200
s0.
65′′
–20
0702
1341
44U
H2.
2/U
LB
Cam
H36
0s
0.80
′′11
.96m
±0.1
m
2007
0221
4152
Gem
ini-N
/GM
OS-
NR
400/
700
nm/0
.75′
′3.
5hr
s0.
76′′
–20
0702
2241
53G
emin
i-N
/GM
OS-
Ng’
600
s0.
66′′
26.2
1m±0
.2m
2007
0222
4153
Gem
ini-N
/GM
OS-
Nr’
600
s0.
53′′
23.2
6m±0
.15m
2007
0222
4153
Gem
ini-N
/GM
OS-
Ni’
600
s0.
59′′
21.1
4m±0
.1m
2007
0222
4153
Gem
ini-N
/GM
OS-
Nz’
600
s0.
63′′
19.0
5m±0
.1m
2007
0222
4153
IRT
F/S
peX
SXD
,LX
D/0
.8′′
1600
s,12
00s
0.90
′′–
2007
0318
4177
Gem
ini-N
/Mic
helle
N’(11
.2µm
)10
0s
0.48
′′0.
23±0
.02
Jy20
0703
1841
77G
emin
i-N
/Mic
helle
Qa(
18.5
µm
)10
0s
0.66
′′0.
44±0
.05
Jy20
0704
05G
emin
i-N
/Mic
helle
low
N/0
.4′′
800
s0.
80′′
–
aM
odifi
edJu
lian
Dat
e.24
5000
0+
21
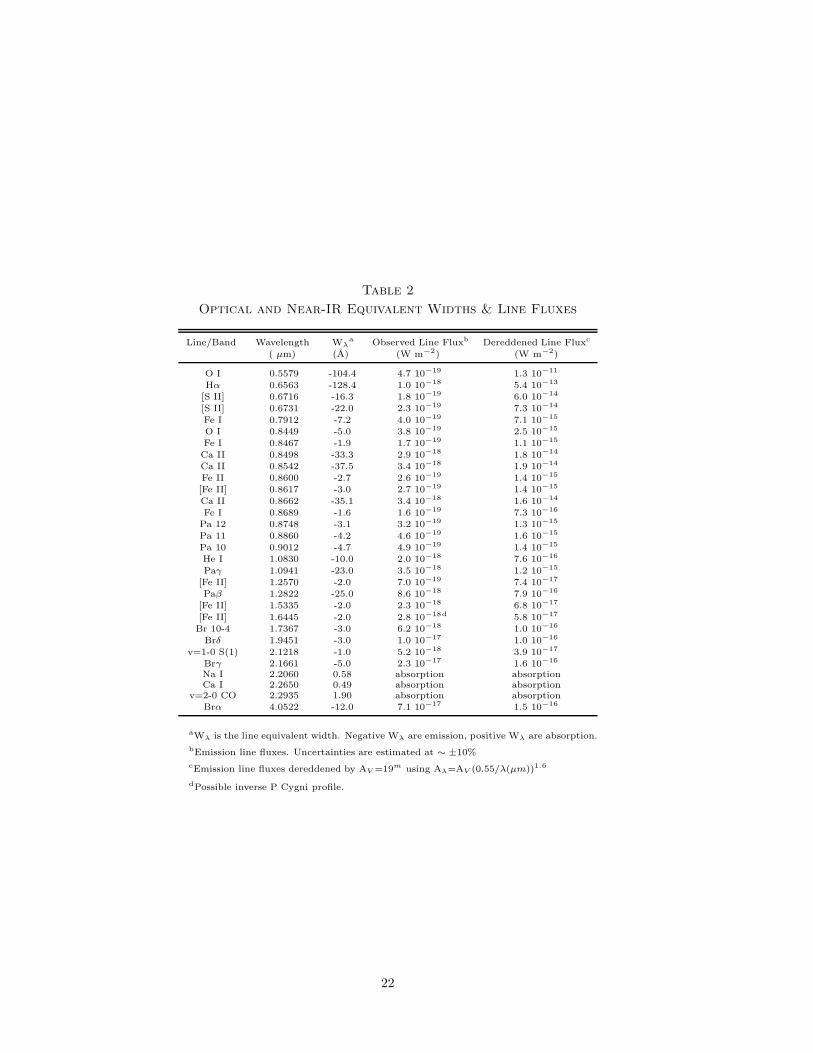
Table 2
Optical and Near-IR Equivalent Widths & Line Fluxes
Line/Band Wavelength Wλa Observed Line Fluxb Dereddened Line Fluxc
( µm) (A) (W m−2) (W m−2)
O I 0.5579 -104.4 4.7 10−19 1.3 10−11
Hα 0.6563 -128.4 1.0 10−18 5.4 10−13
[S II] 0.6716 -16.3 1.8 10−19 6.0 10−14
[S II] 0.6731 -22.0 2.3 10−19 7.3 10−14
Fe I 0.7912 -7.2 4.0 10−19 7.1 10−15
O I 0.8449 -5.0 3.8 10−19 2.5 10−15
Fe I 0.8467 -1.9 1.7 10−19 1.1 10−15
Ca II 0.8498 -33.3 2.9 10−18 1.8 10−14
Ca II 0.8542 -37.5 3.4 10−18 1.9 10−14
Fe II 0.8600 -2.7 2.6 10−19 1.4 10−15
[Fe II] 0.8617 -3.0 2.7 10−19 1.4 10−15
Ca II 0.8662 -35.1 3.4 10−18 1.6 10−14
Fe I 0.8689 -1.6 1.6 10−19 7.3 10−16
Pa 12 0.8748 -3.1 3.2 10−19 1.3 10−15
Pa 11 0.8860 -4.2 4.6 10−19 1.6 10−15
Pa 10 0.9012 -4.7 4.9 10−19 1.4 10−15
He I 1.0830 -10.0 2.0 10−18 7.6 10−16
Paγ 1.0941 -23.0 3.5 10−18 1.2 10−15
[Fe II] 1.2570 -2.0 7.0 10−19 7.4 10−17
Paβ 1.2822 -25.0 8.6 10−18 7.9 10−16
[Fe II] 1.5335 -2.0 2.3 10−18 6.8 10−17
[Fe II] 1.6445 -2.0 2.8 10−18d 5.8 10−17
Br 10-4 1.7367 -3.0 6.2 10−18 1.0 10−16
Brδ 1.9451 -3.0 1.0 10−17 1.0 10−16
v=1-0 S(1) 2.1218 -1.0 5.2 10−18 3.9 10−17
Brγ 2.1661 -5.0 2.3 10−17 1.6 10−16
Na I 2.2060 0.58 absorption absorptionCa I 2.2650 0.49 absorption absorption
v=2-0 CO 2.2935 1.90 absorption absorptionBrα 4.0522 -12.0 7.1 10−17 1.5 10−16
aWλ is the line equivalent width. Negative Wλ are emission, positive Wλ are absorption.
bEmission line fluxes. Uncertainties are estimated at ∼ ±10%
cEmission line fluxes dereddened by AV =19m using Aλ=AV (0.55/λ(µm))1.6
dPossible inverse P Cygni profile.
22

Fig. 1.— Two images of V1647 Ori and McNeil’s Nebula. The left image is a composite of g’, r’, and i’images taken on UT February 14, 2004. The right image is a composite of r’, i’, and z’ images was taken onUT February 22 2007. North is at the top, East to the left in both images. The images are approximately70′′ by 80′′ in size at a pixel scale of 0.144′′/pixel. For comparison, V1647 Ori, at the apex of the nebula, is∼5.6 magnitudes brighter in the Feb 2004 image taken a few months after the initial outburst.
23

Fig. 2.— Optical spectroscopy of V1647 Ori taken on Gemini North using GMOS UT 22 February 2007.The R400 grating was used with a λc=7000 A. This resulted in a spectral resolution, R, of ∼1280. The toppanel shows the complete optical spectrum of V1647 Ori. Note, the turnover in flux at 8900 A is an artifactof the data reduction. The middle panel is a zoom of the region around Hα, while the bottom panel is azoom around the Ca II triplet lines. Flux, Fλ, is in W m−2 µm−1 and has been normalized to unity at8000 A by division by 5.1×10⁻¹⁹.
24

5:46:20 19 18 17 16 15 14 13 12 11
05:00
10
20
30
40
50
-0:06:00
10
20
30
40
R.A. (J2000)
Dec
. (J2
000)
Fig. 3.— A near-IR H band image of the region containing V1647 Ori and McNeil’s Nebula. This imagewas taken on the University of Hawaii 2.2m telescope on UT 13 February 2007. V1647 Ori, the HH 22-IRSsource, and Lk Hα 301 are indicated. V1647 Ori has an H-band magnitude of 11.96.
25

Fig. 4.— Near-IR spectroscopy of V1647 Ori taken on the NASA IRTF using SpeX on UT 22 February2007. Both the SXD and LXD grisms were used producing X-dispersed spectra of the 1 to 2.5 µm and 2.5to 4.1 µm region, respectively. The top panel shows the complete spectrum while the middle and bottompanels show the J+H and K band spectral regions, respectively. The spectrum is calibrated in units of Fλ
such that the flux at 1.65 µm is 1.94 10−14 W m−2 µm−1. The spectrum was normalized to unity at 2.2 µmwhere the flux is 4.54 10−14 W m−2 µm−1.
26

Fig. 5.— An expanded view of the 2.1–2.35 µm region of the near-IR spectroscopy of V1647 Ori. The spec-trum is calibrated in units of Fλ and normalized to unity at 2.2 µm where the flux is 4.54 10−14 W m−2 µm−1.Note the presence of weak CO bandhead absorption at 2.294 µm.
27

X
HH 22a
Bow shock?
HH 22 jet
V1647 Ori
HH 23
Fig. 6.— An optical narrowband [S II] image of V1647 Ori, McNeil’s Nebula, and the HH object HH 22 andHH 23. North is at the top, east is to the left. HH 23 is 155′′ north of V1647 Ori and appears to originatefrom it. A possible intermediate bow shock is marked as are the HH 22 jet, and the far-IR source detectedby Spitzer, HH22-IRS (Muzerolle et al. 2004).
28

NaI
CaI
MgI
Fig. 7.— A plot of the K-band spectrum of V1647 Ori (black) overlaid by model fits using the method ofPrato, Greene, & Simon (2003). Three different model fits are shown for spectral types M1 V (orange),M0 V (green), and K7 V (blue). These produce the best overall fit to the data. The derived AV and rK
values for these models are 29 and 1.5, respectively. The poor fit longward of 2.3 µm is due to the presenceof excess water vapor absorption from the circumstellar environment.
29

Fig. 8.— A plot of our adopted near-IR disk excess emission model. The red curve shows the shape of thenear-IR disk excess emission of temperature 1000 K. In the blue curve, we have incorporated a rudimentarymodel for water vapor absorption by adding the shape of the water vapor features of an M7 V star. Thiswas achieved by i) removing all other spectral features from the M7 V data, ii) smoothing the data, and iii)removing the M7 V continuum shape by subtracting an appropriate black-body curve.
30

Fig. 9.— The χ2 surface plot for model fits to the V1647 Ori 1–4 µm spectrum. In this plot we used an M0 Vstar as representative of V1647 Ori to plot the derived AV and Tdust values for different rK values rangingfrom 1.3 to 1.7. The surfaces for χ2 = 1.01, 2, and 3 are shown. The 3.0 surface corresponds approximatelyto 1σ. The range of acceptable values of AV and Tdust, ∆AV and ∆Tdust, are ∼2 magnitudes and ∼250 K,respectively.
31

Fig. 10.— A similar plot to that shown in 9 but for a range of spectral types, K5 V to M2 V for fixedrK=1.5. Again, the 1σ surface corresponds to a range of ∆AV ∼2 and ∆Tdust ∼250 K.
32

Fig. 11.— A plot of the observed (black) and best-fit model spectrum (red) using an M0 V spectral typetemplate star, AV =19, rK=1.5, the water vapor model defined in the text (Fig. 8), and incorporating amodel ice absorption band from laboratory ices. The poor fit from 3.2 to 3.8 µm is due to the model notincluding the long-wavelength wing of the 3.1 µm water ice absorption feature that has, as yet, an unknowncause.
33

Fig. 12.— A χ2 surface plot for the final adopted values for the best-fit model. Specifically, these are anM0 V star, rK=1.5 and the water vapor model. The χ2=10 surface corresponds approximately to 3σ.
34

Fig. 13.— A near-IR J-H vs. H-K color-color diagram showing the published photometry for V1647 Orifrom the pre-outburst and outburst phases together with our quiescent phase values. The photometric valuesare shown as solid circles and the ID numbers refer to the source and time of the observations. The legendshows the identification of the photometry, relating ID number to source of data and observing time. Point1 is from 2MASS data, point 2 from Reipurth & Aspin (2004) Gemini data, point 3 from the United StatesNaval Observatory telescope as presented in McGehee et al. (2004), points 4 and 6 are from the HimalayanChandra Telescope (HCT) presented in Ojha et al. (2006), point 5 is from the Telescopio Carlos Sanchez(TCS) at the Teide Observatory presented by Acosta-Pulido et al. (2007), and point 7 is from the datapresented here. The colors of main sequence dwarfs (labeled V), giants (labeled III), and classical T Tauristars (labeled CTTS) are also shown. The CTTS locus (the dashed line) is from Meyer et al. (1997).Reddening vectors corresponding to AV =20 magnitudes are shown extending from the extremes of the mainsequence/giant branch (solid lines) and the same reddening vector is shown extending from the extreme ofthe CTTS colors (dash-dotted line).
35

Fig. 14.— A plot of AV vs. Modified Julian Date (MJD) showing the change in AV with time from pre-outburst to outburst, and into quiescence. The AV values were derived from the J-H and H-K colors inFig. 13 by dereddening onto the CTTS locus from Meyer et al. (1997). The dashed line represents the AV
value derived from the 2MASS J, H, and K’ colors which we adopt as our pre-outburst value. The outburstvalues are those from February 2004 to February 2006 while the quiescent value is from our February 2007data. Clearly, in early 2006 V1647 Ori reverted to its pre-outburst color. The difference in AV between thepre-outburst and outburst values is ∆AV ∼8.5 magnitudes.
36

Fig. 15.— A comparison of our derived stellar luminosity L∗=5.2 L� and effective temperature Teff=3800 Kwith evolutionary track models from Baraffe et al. (1998). The location of V1647 Ori is indicated by a filledstar with associated uncertainties displayed. The location of V1647 Ori in this plot suggests it is a star ofmass ∼1 M� with an age younger than �0.5 Myr.
37

Fig. 16.— A similar plot to that shown in Fig. 15 but for the evolutionary tracks models of Siess et al.(2000). Again, V1647 Ori is indicated by the filled star with associated uncertainties displayed. The locationof V1647 Ori in this plot suggests a stellar mass of ∼0.55 M� and an age of <0.5 Myrs.
38

Fig. 17.— The spectral energy distribution (SED) of V1647 Ori. Plotted are the pre-outburst SED (opensquares) and the outburst SED (filled dots) both from Andrews, Rothberg, & Simon (2004), and the quiescentphase SED from our data (open stars). Uncertainties on the quiescent phase data are indicated. Note thatthe pre-outburst and quiescent phase SEDs are very similar.
39

Fig. 18.— The 8–13 µm spectrum of V1647 Ori taken with the Gemini Michelle imaging spectrometer onUT April 5, 2007. The spectrum was ratioed with a telluric standard star and calibrated using the Michellephotometry shown in Table 1. Hence, the flux at 11.2 µm is 0.23 Jy. The dashed line is a linear interpolationbetween 8 and 13 µm (see text for details).
40

Fig. 19.— A plot of the 8–13 µm silicate absorption band optical depth extracted from the observed spectrumshown in Fig. 18 by subtracting the observed the spectrum of V1647 Ori from the UT April 5, 2007 data.The silicate absorption flux at each wavelength was subtracted from the flux from the linear interpolationas in Quanz et al. (2007). The resultant profile was then converted to optical depth, τ .
41