v . 9 no. 4 m /a 2006 immigration reform: implications for ... · vol. 9 no. 4 mar/apr 2006...
TRANSCRIPT
VOL 9 NO 4 MARAPR 2006 Immigration Reform Implications for Agriculture
by
Philip Martin
About half of US farm workers are not authorized to work in the United States Pending immigration reforms aim to prevent the entry and employment of more unauthorized foreigners
but differ on what to do about unauthorized workers already in the United StatesEcirc
About 95000 foreigners a day arrive in the United States About 90000 are nonimmigrant tourists busi-
ness people and foreign students and workers welcomed at airports and border crossings About 3000 are immigrants who have been invited to become perma-nent residents of the United States and almost 2000 are unauthorized foreigners usually Mexicans who evade border con-trols enter the United States and settle
Is the arrival of 30 million nonimmi-grants a million immigrants and 500000 to 700000 unauthorized foreigners a year something to be welcomed or feared
Opinion polls consistently find that most Americans want the US govern-ment to take additional steps to prevent illegal migration A December 2005 Wash-ington Post-ABC News poll reported that 80 percent of Americans think the federal government should do more to reduce ille-gal immigration and 56 percent agree that unauthorized migrants hurt the United States more than they help it
In December 2005 the House approved the Border Protection Antiterrorism and Illegal Immigration Control Act (HR 4437) on a 239 to 182 vote President Bush commended the bill saying ldquoI applaud the House for passing a strong immigra-tion reform billhellip I urge the Senate to take action on immigration reform so that I can sign a good bill into lawrdquo
If eventually enacted into law HR 4437 would require US employers within two years to submit Social Security and other data on newly hired workers to govern-ment agencies by telephone or computer If the data do not match that in government records employers are to notify workers to correct the problem within 30 days or the worker could no longer be employed Employers would have six years to verify the legal status of their current employees HR 4437 also cracks down on unauthor-ized foreigners in the United States by making ldquoillegal presencerdquo in the United States a felony which may make it hard for such persons to eventually become legal immigrants and introduces penal-ties on those who support or shield illegal migrants which could affect churches and other migrant support groups
Perhaps the most controversial item in HR 4437 is a provision that calls for 700 miles of additional fencing along the Mexico-US border Adding to the 106 miles already in place this would extend the fencing to over a third of the 2000 mile border Even though President Bush has been calling for a guest-worker pro-gram since his election in 2000 HR 4437 does not include such a program
In March 2006 the Senate began to take up immigration reform Unlike the House the leading proposals in the Senate would legalize unauthorized foreigners
Also in this issue
Democracy and Environmental Quality
by Y Hossein Farzin and Craig A Bond5
Are International Beef Prices Converging and if so Why
by Lovell S Jarvis Joseacute E Bervejillo and Joseacute P Cancino9
In the next issue
Energy Prices and Agriculture How Vulnerable is California
by David Roland-Holst
mployed in the US but they differ in what happens to
Figure 1 Authorized and Unauthorized US Crop Workers 1989-2002
Giannini Foundation of Agricultural Economics
e
100 90 80 70 60 50 40 30 20 10
0
Per
cen
t
1989-90 91-92 93-94 95-96 97-98 99-2000 01-02 Source NAWS US Department of Labor
Authorized Unauthorized
newly legalized workers at the end of six years of legal US work
Under the Secure America and Orderly Immigration Act of 2005 (S 1033) introduced by Senators John McCain (R-AZ) and Edward Kennedy (D-MA) unau-thorized foreigners in the United States could apply for guest worker visas by showing a US work history and passing background checks If they continued working in the United States for six years passed additional security and background checks and paid a feefine of at least $2000 they could qualify for immigrant visas Legal guest workers under McCain-Kennedy could change US employers an effort to protect them from unscrupulous employers and more visas would be made available so that foreigners who earn immigrant visas by working could have their families join them in the United States Like the House bill the McCain-Ken-nedy bill would create a new electronic work-authoriza-tion system that would ultimately replace the current paper-based system
Senators John Cornyn (R-TX) and Jon Kyl (R-AZ) also aim to make currently unauthorized foreign work-ers in the United States legal Their Comprehensive Enforcement and Immigration Reform Act of 2005 would require unauthorized foreigners in the United States to register return to their countries of origin and then re-enter with renewable three-year work permits At the end of six years these legal guest workers would be expected to leave the United States for good Like the House bill Cornyn-Kyl would dramatically increase funding for border and interior enforcement and intro-duce machine-readable tamper-resistant Social Secu-rity cards to help employers determine the legal status of newly hired workers
There are several other proposals that share the goals of reducing the influx of unauthorized foreigners and
ensuring that workers employed in the United States are legal However the differences are clear should the US government try an enforcement-first and guest workers-later strategy as in the House bill or launch new enforcement and guest-worker programs simulta-neously as in the Senate bills Another issue is what happens to guest workers when their work visas expire can they become legal immigrants or must they leave the United States Finally an issue of special impor-tance to agriculture is how easy it will be to obtain addi-tional legal guest workers
Unauthorized Farm Workers An estimated 103 million unauthorized foreigners were in the United States in March 2004 Their number has been increasingbyover 700000 ayear in the pastdecade so that in recent years the inflow of illegal migrants has exceeded that of legal immigrants The fact that almost 30 percent of the 36 million foreign-born US residents are unauthorized as are 55 percent of the 11 million Mexican-born US residents is a major reason why Congress is considering immigration reform
Most unauthorized foreigners in the United States are not employed in agriculture Almost two million are children under 18 and others are housewives or are retired so that seven to eight million unauthorized are in the US labor force of 150 million Most are between the ages of 18 and 40 and half arrived since 1995
There are no reliable data on the number of unau-thorized farm workers and their importance to US agriculture The US Department of Labor (DOL) has been surveying workers employed on crop farms for the past 15 years and found that the percentage of unau-thorized workers has been above 50 percent since the late 1990s However more recent surveys suggest that the unauthorized share of the crop work force has fallen slightly perhaps because tougher border enforcement is slowing new entries while the boom in construction and other nonfarm labor markets has drawn newly arrived unauthorized seasonal workers into nonfarm jobs
There are no government estimates of unauthorized workers in livestock but livestock workers are more likely to be legal because a higher share have year-round jobs and benefits such as housing
When USDA relied on the Current Population Survey to estimate the number of farm workers they estimated there were 25 million farm workers defined as persons employed for wages on farms sometime during a typical year including 18 million in crops and 700000 in live-stock If 45 percent of the crop workers and 25 percent
2
Giannini Foundation of Agricultural Economics
Giannini Foundation of Agricultural Economics
of the livestock workers are unauthorized there would be almost one million unauthorized US farm workers If the unauthorized percentage is higher say two-thirds of the crop workers and a third of the livestock work-ers there would be about 14 million unauthorized farm workers
The number and share of unauthorized workers varies by well-known factors including size of employer and commodity with large labor contractors providing workers to harvest less-perishable crops such as citrus having the highest shares of unauthorized workers However differences between less-perishable citrus and more-perishable strawber-
disappearance of workers The Senate bills of course allow currently unauthorized workers to become legal guest workers
The seasonal farm labor market resembles a revolving door in the sense the newcomers arrive are employed for about a decade and then return to their countries of origin or more often find nonfarm jobs and settle in the United States If there is 10 percent annual turn-over 250000 farm workers exit each year and must be replaced to keep the farm work force at current levels
Since virtually all new entrants to the farm labor force are born outside the United States farm employers are
very interested in government ries have been disappearing as ldquoSince virtually all new rules that regulate their access unauthorized workers spread to foreign workers If increased entrants to the farm labor Indeed areas in which foreign- border and interior enforcement born workers are a recent devel- force are born outside the slows the influx of unauthorized opment including many Mid- workers and turnover remains at United States farm employers western and southeastern states current levels farm employers may have higher shares of unau- are very interested in govern- would be interested in at least thorized workers than states that 250000 new guest workers ament rules that regulate their have long relied on foreign work- year far more than the 40000 a ers such as California access to foreign workersrdquo year requested under the current
Even though almost half of crop workers may be unauthorized few farm employers are fined for employing such workers There are several reasons First there is little enforcement of laws against hiring unauthorized workers In FY04 the Immigration and Customs Enforcement agency issued only three notices of intent to fine (NIF) employers for violations of employer sanctions laws down from 1000 to 2000 NIFs a year in the 1990s Second most employers pro-tect themselves from fines by copying the documents presented by newly hired workers
Agriculturersquos Stake Agriculturersquos three major interests in pending immigra-tion reform proposals deal with currently unauthor-ized workers future guest workers and enforcement Although some farmers fear that hundreds of thousands of currently unauthorized workers will disappear over-night this is a highly unlikely scenario
The House bill does not include a guest-worker pro-gram that legalizes currently unauthorized workers but it does include a two-year phase-in of the Internet-based system to verify the legal status of new hires and a six-year phase-in of the requirement to verify current employees Thus even under a worse-case scenario for farmers worried about ldquolosingrdquo unauthorized employ-ees there would likely be attrition rather than a sudden
H-2A program The H-2A program presumes that US farmers will
normally find sufficient US workers Farmers antici-pating too few US workers must file a job order at their local employment service (ES) office and ask the DOL to certify their need for foreign H-2A workers Before certification the ES and the farmer seek US workers but since farmers do not request certification to employ H-2A workers until they have found them abroad most do not really want US workers and recruitment usu-ally finds few
Making the request for H-2A workers alerts unions and advocates who sometimes sue employers who do not hire the US workers who respond to the farmerrsquos ads In addition farm employers requesting H-2A work-ers must offer approved housing which means that DOL inspectors arrive to check housing Applying to the government for H-2A workers in areas that often have double-digit unemployment rates tends to bring unwelcome attention to farm employers who may have been operating out of the limelight with unauthorized workers explaining why many farmers say the H-2A program is ldquounworkablerdquo Proposals to make the H-2A program more employer-friendly include the AgJOBS proposal described below
The third uncertainty for agriculture is enforcement Fines on employers who knowingly hire unauthorized
3
Giannini Foundation of Agricultural Economics
workers were introduced by the Immigration Reform and Control Act of 1986 to ldquodemagnetize the US labor marketrdquo The theory was that foreigners would quickly discover that even if they eluded the Border Patrol they could not get US jobs but this theory failed to deter illegal migration because of the availability of false doc-uments and little enforcement
A mandatory Internet-based verification system could make enforcement easier For example if employ-ers learn that the data on a newly hired worker was suspect but continue to employ the worker after 30 days there could be a presumption that they knew the worker was unauthorized Similarly by having all employers submit data on newly hired workers it will be easy for enforcers to spot problem industries areas and employers
AgJOBS One of the immigration reform proposals the Agri-cultural Job Opportunity Benefits and Security Act (AgJOBS) would deal only with unauthorized farm workers As the number of unauthorized farm workers rose in the 1990s farmers asked Congress to approve a new guest-worker program for agriculture that did not require DOL certification or housing President Clinton opposed these proposals and threatened to veto any that reached his desk and Congress did not approve a new guest-worker program However the Senate approved a version of what became AgJOBS as an amendment to an appropriations bill in 1998 as farmers gained support of their effort to win a new guest-worker program
After the 2000 election of Vicente Fox in Mexico and George W Bush in the United States farm employers and worker advocates reached a compromise to deal with unauthorized farm workers Farm employers wanted a new guest-worker program with two major features no certification and no housing while worker advocates wanted a system under which currently unauthorized workers could become immigrants The compromise that became AgJOBS satisfied farmers by allowing them to self-certify their need for guest workers and to pay housing allowances to out-of-area workers rather than provide housing Worker advocates won the promise of a temporary legal status for unauthorized farm work-ers and a path to immigrant status for such workers and their families This ldquoamnestyrdquo provision prompted opposition from law-and-order members of Congress and the December 2000 compromise was not enacted
The bipartisan version of AgJOBS pending in the Senate would offer currently unauthorized farm workers
a path to immigrant status for themselves and their children and offer farmers easier access to legal guest workers Supported by a coalition of over 400 employer union and advocate groups AgJOBS got 53 votes when it was attached to an emergency military-spending bill in the Senate on April 19 2005 but since 60 votes were needed it was not approved A competing bill offered by Senator Saxby Chambliss (R-GA) that would have simply made the current H-2A program more employer-friendly was defeated 77-21
Conclusions As Congress debates immigration reform there could be comprehensive reform dealing with all unauthor-ized workers in the United States or piecemeal reform such as enacting only AgJOBS If there is comprehen-sive reform Congress could mandate enforcement first and guest workers or legalization later as in the House bill or have new enforcement measures introduced together with guest workers and legalization as in the Senate bills In 1986 IRCA had legalization first and enforcement second an approach absent from the 2006 discussion
Agriculture has a higher stake in the 2006 debate than it did in the 1986 debate First labor-intensive agriculture is far larger than it was two decades ago Second there are more unauthorized workers and they are far more widely dispersed so that more farmers would likely be affected
However the major change between 1986 and 2006 is that experience has taught what does not work A gen-erous legalization program and weak enforcement as in the late 1980s increased illegal migration and spread unauthorized workers throughout the United States Two decades later there may be much tougher enforce-ment and fewer opportunities for currently unauthor-ized workers to become legal immigrants
Agriculture is cooperating with worker advocates to preserve the labor status quo under AgJOBS which would legalize currently unauthorized workers and provide easier access to additional guest workers These guest workers could become a point of contention between advocates and farm employers
For additional information Martin Philip and Bert Mason 2004 Hired Workers on
California Farms in Jerry Siebert ed California Agri-culture UC Div of Agricultural and Natural Resources
Philip Martin is a professor in the agricultural and resource econo-mics department at UC Davis He can be reached at martinprimal ucdavisedu
4
Giannini Foundation of Agricultural Economics
Democracy and Environmental Quality by
Y Hossein Farzin and Craig A Bond
The relationship between several local and global air pollutants and economic development is evaluated We find empirical support for our hypothesis that democracy provides the best conduit to environmental quality
relative to other governmental structures thus leading to decreased concentrations or emissions of pollution The results have policy implications for the developing world as well as the United StatesEcirc
The relationship between national income and environmental quality is of great interest to economists policy-makers and the public at
large This interest is reflected by growing conflicts between global environmental concerns and global economic development policy as seen by frequent uprisings at WTO meetings Previous literature on this relationship has focused on the so-called Envi-ronmental Kuznets Curve (EKC) which hypothesi-zes an inverted-U shape when pollution indicators are plotted against income per capita as shown in Figure 1 Explanations for this hypothesis generally focus on several primary factors that interact to pro-duce the shape Among these are (1) changes in the composition of aggregate output as economies evolve from agricultural to industrial to service-based goods and services (2) technological progress and (3) increases in demand for environmental quality as income grows
However the relationship between environmen-tal quality and economic development is not formed in isolation from political institutions that govern the process of policymaking in a particular coun-try Thus for example Dasgupta and Maumller aptly emphasized in 1995 ldquoThe connection between envi-ronmental protection and civil and political rights is a close one As a general rule political and civil lib-erties are instrumentally powerful in protecting the environmental resource-base at least when compared with the absence of such liberties in countries run by authoritarian regimesrdquo This observation raises sev-eral important questions How does public environ-mental policy influence the relationship between per capita income and pollution and how does that public policy represent the citizensrsquo preferences for environ-mental quality
We develop a model that directly incorporates the relationship between societal preferences and provision of public-pollution abatement utilizing
a measure of quality of governance as a proxy for weights on those preferences We call this quality of governance variable ldquopolityrdquo and define it to have a low value for authoritarian governments and higher values for governments that are more democratic We hypothesize that democracy and its associated freedoms provide the conduit through which agents can exercise their preferences for environmental quality more effectively than under an autocratic regime thus leading to reduced concentrations andor emissions of pollution We estimate an econometric model of the relationship between several local and global air pollutants and economic development measured by national income per capita The model explicitly accounts for critical aspects of the socio-political-economic regime of a country Additional variables such as income inequality age distribution and urbanization are also included
Relationship between Environmental Policy Governance and Preferences
One of the major determinants of environmental policy is the political regime of a particular country or ldquogovernancerdquo One study has argued that corrup-tion and rent-seeking behavior can influence the rela-tionship between income and the environment They show that corruption causes the turning points of an EKC to rise above the socially optimum level Another study has suggested that well-defined property rights democratic voting systems and respect of human rights can create synergies that lead to increased levels and efficacy of environmental policy
We propose a simple explanation of the role of political structure on the relationship between income and environmental quality based on the relationship between the demand and supply of environmental quality Because environmental quality is mostly a public good and in many cases the capital costs of the required infrastructures to abate pollution are huge
5
Giannini Foundation of Agricultural Economics
Income Per Capita
Pol
luti
on
Figure 1 Environmental Kuznets Curve
Explanation of the Curve It is claimed that many environmental health
indicators such as water and air pollution show the inverted U-shape in the beginning of economic development little weight is given to environmental concerns raising pollution along with industrialization After a threshold when basic physical needs are met interest in a clean environment rises reversing the trend Now society has the funds as well as willingness to spend to reduce pollution
The extension of the Kuznets Curve to environmental health in general has been doubted For example energy land and resource use (sometimes called the ldquoecological footprintrdquo) do not fall with rising income While the ratio of energy per real GDP has fallen total energy use is still rising in most developed countries In general Kuznets curves have been found for some environmental health concerns (such as air pollution) but not for others (such as landfills)
individuals or groups within a society are unable to effectively provide them As such it is usually the State that provides these goods However the Statersquos environmental policy is at least partly influenced by the societyrsquos preferences for environmental quality In particular the relationship between the publicrsquos preferred level of environmental quality and the level actually supplied by the State depends on the weights the policymakers place on the various societal prefer-ences
To illustrate consider the following simple model Suppose that the people in a society can be aggregated into two distinct groups based on some distinguishing characteristic The categorical distinction can be made along any number of characteristics that are likely to
affect environmental preferences for example ldquorich vs poorrdquo ldquoeducated vs non-educatedrdquo ldquourban vs ruralrdquo or ldquoyoung vs oldrdquo The groupsrsquo environmental preferences are assumed to be reflected by their pre-ferred levels of pollution-abatement expenditure to be undertaken by the state
Our model of public environmental-quality provi-sion highlights the importance of the type of political regime for the relationship between economic devel-opment and environmental quality It suggests that environmental-quality expenditures are partly a func-tion of the citizen groupsrsquo preferences but these pref-erences are subject to political distortions misrepre-sentation or neglect by the State The more open and democratic are the political institutions however the more likely it is that the citizensrsquo preferences will be reflected in actual policy decisions and environmen-tal quality as a normal public good will increase
General Results We tested the hypothesis of an inverted-U shaped relationship between the direct effects of national income per capita and pollution indicators conditional on the type of government population density and technology as well as the marginal effect of increasing the quality of the public institutions on environmental quality Results suggest that economic growth alone as measured by a change in GDP is insufficient to improve environmental quality Rather conscious environmental policy emanating from the existing political institutions as represented by the polity variable is necessary In other words the type of government in place clearly influences the chances of environmental policies being implemented
Of the five models estimated only one (emissions of non-methane volatile organic compounds [VOC]) supports the EKC hypothesis of an inverted-U shaped relationship The turning point for the VOC curve is inversely related to the quality of political institutions but tends to occur at GDP levels at the upper end of the distribution Our results support the findings of the previous literature namely growth in income per capita is not sufficient to explain increases in pollu-tion abatement as nations develop As emphasized in the statement by Dasgupta and Maumller quoted earlier conscious choices of environmental policy coming from people exercising their civil rights to express preferences are the key to understanding the relation-ship between economic development and environ-mental quality
6
Giannini Foundation of Agricultural Economics
Our testing of the effects of the government on the estimated relationship corroborates this hypothesis In all cases the marginal effect of the polity vari-able with respect to the pollutant is negative for the majority of the income range under consideration suggesting that countries with more democratic insti-tutions have a greater tendency to reduce pollution For those pollution measures for which the effect is dependent on income levels (CO
2 VOC and SO
2) the
marginal effect of democratization is intensified with income At very low levels of income for four of the five models however the estimated marginal effect of democratization of political institutions could be pos-itive This implies that in very lowndashincome countries for most government types the State and the people assign such a high priority to industrial development that pollution emissions increase However this effect is lessened as income per capita rises
Specific Results Thus environmental policy-making considerations are of paramount importance in describing the rela-tionship between economic development and the environment We turn now to the results of the model that decomposes the environmental-policy indicator variable We try to account for both the preferences of the society and the mechanism through which these preferences are translated into realized pollu-tion abatement
As expected the relationship between GDP per capita and the various pollution measures is similar to that estimated in the basic model However the NOx model now has an EKC relationship with a turning point well outside the sample range of income Never-theless the similarity in conditional results suggests that the decomposition is valid and that demand considerations based on societal preferences are an important determinant of overall environmental quality Income growth conditioned on greater polity scores is predicted to have a relatively smaller impact on increased emissions in four out of five cases Fur-thermore the marginal effects of increasing polity on pollution remain negative at the mean sample values This creates an inverted-U when plotting pollution versus polity just as in the EKC
Urbanization We now turn to the effects of the individual prefer-ence shifters on the pollution indicators conditional on the type of government in place in a given society Urbanization has an unambiguous net positive effect
on all pollution indicators with the exception of CO2
emissions at high levels of democracy and national income This suggests that the effects of increased fossil-fuel use in urban societies mostly dominate any economies of scale or preference effects
Income Inequality Another abatement demand shifter widely discussed (and disputed) in the literature is income inequality as it is hypothesized that the distribution of income may play a role in the incomeenvironment relation-ship In this application the proxy for income inequal-ity is found to have a negative relationship with envi-ronmental quality in three of the five regressions at the sample mean
Interestingly a distinction can be made here between greenhouse gasses (such as CO
2) and the
ozone and acid-rain generating chemicals The latter pollutants most often exhibit an EKC relationship because their consequent damages are primarily local in nature whereas carbon compounds are global in their environmental impacts One explanation for this intriguing result may be the relationship between income inequality and differences in environmental preferences of the poor and rich That is the poor are the primary victims of local air pollutants because they can neither afford the high local costs associated with environmental amenities nor can they choose environmental quality over having a job that is overly exposed to pollution They often have to live and work immediately downstream and downwind thus bear-ing a disproportionate burden of local pollution As such the environmental preferences of the poor are biased toward reduced local pollution
In contrast the rich who can afford and gain from environmental amenities have a lot of interest in amenity values associated with protection of rain-forest biodiversity endangered species and the like and have little interest in some kinds of local pollu-tion Thus assuming that the political behavior of each group (whether rich or poor) is self-interested environmental quality outcomes depend largely on which grouprsquos environmental interests get served by the State Government action in turn depends on politiciansrsquo sensitivity to the issue of environmental justice (both within and between generations) and on the effectiveness of each group to influence them
Age Distribution
A similar pattern appears in terms of the age distribution of the society as measured by the percentage of the
7
Giannini Foundation of Agricultural Economics
population less than fifteen years of age NOx and VOC emissions are negatively correlated with the proxy for youth independent of the level of national income A similar result holds for SO
2 emissions but the
relationship reverses with high GDP per capita levels (achieved by only 18 percent of the observations in the sample) This may partly reflect the empirical fact that infants and young children are the main victims of local ground-level ozone-producing pollutants and the greater sensitivity of politicians to health hazards of these pollutants among the very young Again however the greenhouse gas CO
2 emissions are
predicted to increase with the share of youngsters in the population and this marginal effect is intensified with increases in GDP per capita
Local versus Global Pollutants It appears that the nature of the pollutant may affect the policy weights given to preferences and thus the rate at which the preferred environmental policy is translated into actual policy At low-income levels more weights are seemingly given to abatement poli-cies aiming at local pollutants (such as NOx VOC and SO
2) The main victims of these pollutants are
the inner-city low-income groups and their dam-ages become visible in a relatively short period Con-versely less weight may be given to policies aiming to abate global or regional air pollutants (such as CO
2)
This means policies aiming to improve environmental amenities that benefit and support the lifestyle of the rich receive less weight And this is more likely to be the case the more democratic is the political regime of a society
Education The last preference shifter under consideration is the education of the populace as proxied by the illiteracy rate for people greater than fourteen years of age At least one education term is significant in all of the emissions models though no significant correlation could be determined for ambient SO
2 The relation-
ships all follow the same pattern with illiteracy posi-tively correlated with emissions at relatively low levels of income but the marginal effect reversing sign at higher levels
Conclusions This article discusses the link between income per capita and environmental quality Recognizing that the often-cited ldquoinverted U-shapedrdquo relationship or EKC is not an inevitable result of income growth a
model was developed that specifically accounted for different environmental-policy regimes reflecting the demand for environmental quality as a public good
Results of the exercise support the hypothesis that the qualities of political institutions and several indi-cators of societal preference interact with each other to create the inverted-U shape which is frequently cited in the environment-development literature Estimates of individual effects for each of the included prefer-ence shifters support the hypothesis that more demo-cratic governments respond favorably to environmen-tal demands by the populace
For additional information on this subject the authors recommend the following sources
Dasgupta P Maumller K-G 1995 Poverty institutions and the environmental resource-base in Behrman J Srinivaan TN (Eds) Handbook of Development Economics Vol 3A Elsevier Science Amsterdam Chapter 39
Ecological Economics (1998) Special Issue on the Envi-ronmental Kuznets Curve 25 (2) 143-229
Grossman GM Krueger AB 1995 Economic growth and the environment Quarterly Journal of Economics 110 (2) 353-377
Lopez R Mitra S 2000 Corruption pollution and the Kuznets environment curve Journal of Environ-mental Economics and Management 40 (2) 137-150
Panayotou T 1997 Demystifying the environmental Kuznets curve turning a black box into a policy tool Environment and Development Economics 2 465-484
Persson T Tabellini G 2000 Political Economics Explaining Economic Policy The MIT Press Cam-bridge Massachusetts
Rivera-Batiz FL 2002 Democracy governance and economic growth theory and evidence Review of Development Economics 6 (2) 225-247
Y Hossein Farzin is a professor and CA Bond received his PhD in the Department of Agricultural and Resource Economics at the University of California Davis Professor Farzin can be contacted by telephone at (530)752-7610 or by e-mail at farzinprimalucdavis edu
8
Giannini Foundation of Agricultural Economics
Are International Beef Prices Converging and if so Whyby
Lovell S Jarvis Joseacute E Bervejillo and Joseacute P Cancino
Beef export prices have converged implying liberalization of commercial and sanitary policies in many trading nations and a more competitive international beef market
During the 1980s and 1990s the United States received higher average prices for its beef exports than did most of its competitors Howe-
ver during this period the average US beef export price was declining relative to the beef export prices of other countries This trend appears to be part of a process of convergence among beef export prices from different countries as is shown in figure 1 This paper reports the results of efforts to test whether beef prices did con-verge from 1980-2002 and if they did to determine why What forces are determining international market prices and are such forces affecting US export prices
The United States was one of the worldrsquos largest beef exporters until a case of BSE was found in the state of Washington nearly two years ago US beef exports then declined precipitously The United States is attempting to demonstrate the safety of its beef and hopes to regain an important share of international beef markets US producers must examine the market within which they will compete in the future We hypothesize that US beef export prices have been declining relative to the prices of other countries because major export markets for US beef have become increasingly competitive Sev-eral important beef importers that previously gave pref-erence to US beef liberalized their imports allowing other countries to compete directly with the US
In addition exports from Brazil and Uruguay expanded These countries traditionally excluded from important markets because of endemic Foot and Mouth Disease (FMD) gained access to additional markets After World War II countries with FMD were largely unable to export fresh beef to countries that were free of FMD The international beef market was thus seg-mented In one part trade occurred between export-ers and importers that were FMD-free In another part trade occurred between importers and exporters that were FMD-compromised ie FMD was endemic occurred fairly regularly or was controlled through vaccination Prices in the FMD-free market primarily the Pacific Rim countries including the United States Canada Japan Australia and New Zealand were gen-erally significantly higher than prices in the FMD-com-promised market which included the rest of the world
the European Union (EU) and the Southern Cone of South America as well as the Middle East Eastern Europe and parts of Asia However in recent years Brazil and Uruguay have increasingly controlled FMD while several importers that traditionally excluded beef from exporters with FMD have begun to accept such beef with specific restrictions
Methodology and Data Studies utilizing beef prices often assume that beef is a homogeneous commodity This was a more reason-able assumption in the 1960s when trade was predomi-nantly in carcasses Today almost all beef is exported as differentiated cuts with roughly 85 percent as boneless cuts To compare price trends it is important to cat-egorize beef cuts into more homogeneous products We utilize bone-in beef and boneless beef as the two qual-ity categories Beef sold as carcasses half carcasses and quarters are classified as bone-in beef as are a number of rather simple bone-in cuts most of which involve little value-added in processing Boneless cuts generally imply a higher degree of processing Using these two categories we apply two common tests of price conver-gence to the prices of 17 exporting countries that each accounted for at least one percent of the international beef market in 2002 Collectively they accounted for 90 percent of world beef trade Using annual data we cal-culate the implicit beef export price for each countryrsquos beef products by dividing the value of exports by the quantity of exports We deflate each price series using the US Producer Price Index (PPI) for all commodities We tested for price convergence from 1961 to 2002 and because important changes occurred in markets around 1980 for the period 1980 to 2002 We also tested for price convergence using monthly data for a subset of seven important exporters for 1990-2002
We defined price convergence as a shrinking diver-gence over time in the prices obtained by the principal beef-exporting countries We tested the hypothesis of convergence using two variations of an approach previ-ously published to analyze changes in price dispersion One test utilized the mean of the absolute price differ-entials and the other utilized the standard deviation of
9
Giannini Foundation of Agricultural Economics
Table 1 Tests for Convergence of Beef Export Prices
A Annual data
Group 1 (All 17 Exporters) 1961- 1980-2002 2002
Bone-in C C
Boneless C C
Group 2 (10 European Exporters)
Bone-in C C
Boneless C C
Group 3 (8 Largest exporters including EU as one exporter)
Bone-in NSC NSC
Boneless DNS DNS
Group 4 (2 FMD free and 2 FMD endemic exporters)
Bone-in C C
Boneless C C
B Monthly data
7-Major Exporters Jan 1990-Dec 2002
Bone-in C
Boneless C Notes The tests use 1) absolute price differentials (APD) and 2) standard deviations of price differentials (SD) C corresponds to price convergence with Plt10 for both tests NSC corresponds to no significance for APD test and convergence for SD test while DNS correspond to price divergence for APD test and no significance for SD test
absolute price differentials We fit a linear trend to each of the series of annual observations The null hypoth-esis was that the estimated trends would be negative reflecting a tendency for the mean or the standard deviation of the differentials to decline over time We applied each test to the prices of a) bone-in beef and b) boneless beef for each period analyzed We analyzed convergence for the entire set of countries and for sev-eral subsets to determine whether any of the results appeared sensitive to the particular set of countries chosen The country sets were Group 1 The 17 principal exporters Argentina Aus-tralia Austria Belgium-Luxembourg Brazil Canada Denmark France Germany Ireland Italy Netherlands New Zealand Poland Spain United States and Uru-guay Group 2 The European exporters from Group 1 Aus-tria Belgium-Luxembourg Denmark France Germa-ny Ireland Italy Netherlands Poland Spain Group 3 The eight largest exporters from Group 1 excluding Poland and taking the EU as a single country with intra-bloc trade excluded
Group 4 The four major grass-fed exporters Aus-tralia New Zealand Uruguay and Brazil The first two countries have always been FMD-free whereas Uruguay and Brazil have almost always been FMD-endemic This set probably provides the best test of convergence between the FMD segments
Results Table 1 part A contains results for the tests applied to the prices of boneless and bone-in beef using annual data for 1961-2002 and 1980-2002 for the four sets of countries In almost every case the results are consistent with price convergence
The results suggest that price convergence occurred for all exporters taken together (Group 1) for the European exporters (Group 2) and for the matched set of FMD-free and FMD-endemic exporters (Group 4) in each case for bone-in and boneless beef and in both periods except for Group 4 which was not significant The prices of the largest exporters (Group 3) also show convergence for the prices of bone-in beef in both periods when the test uses the standard deviations of price differentials but not when the test uses the mean of the absolute price differentials When the same tests are applied to the prices of boneless beef the results from both tests support divergence in 1961-2002 and indicate a constant trend in 1980-2002 Note particularly that the prices in a matched set of FMD-free and FMD-endemic country
prices (Group 4) show convergence for both types of beef and in both periods except in one case which is insignificant Thus there is evidence that the price differential attributed to FMD has shrunk
Table 1 part B contains the results for the tests car-ried out using monthly data for 1990-2002 for Group 3 (excluding Argentina for which monthly data were not available) again for both bone-in and boneless beef The results provide strong evidence of price convergence for bone-in and boneless beef in 1990-2002 The use of annual data for 1990-2002 produced highly similar results with and without the inclusion of Argentina It seems clear that the tendency toward price conver-gence was strong throughout the 1990s
Why Have Prices Converged We believe that price convergence has been caused prin-cipally by 1) changes in commercial policy following the Uruguay Round 2) the erosion of the price penalty traditionally faced by beef-producing countries with endemic FMD and 3) the industryrsquos shift toward the
10
$M
etri
c T
ons
Giannini Foundation of Agricultural Economics
export of cuts instead of carcasses Historically Figure 1 Export Price of Fresh Beef Major Exporters beef trade has been strongly influenced by tar- 1961-2002 iffs quotas and other forms of commercial
9000 policy The last two decades have witnessed
8000 considerable liberalization in import quotas
7000 and a reduction of export subsidies by the 6000 EU The liberalization of commercial policy is
1961
2001
1999
1997
1995
1993
1991
1989
1987
1985
1983
1981
1979
1977
1975
1973
1971
1969
1967
1965
1963
probably a factor in the observed convergenceEcircof beef export prices and as such probablyEcircimplies significant global welfare gains in thisEcircimportant commodity marketEcirc
5000
4000
3000
2000 Qualitative analysis indicates that the great-
1000 est divergence among market prices at theEcirc0beginning of the period was the result of sev-
eral exporting countries having preferentialEcircaccess to several strongly protected marketsEcirc Germany US Australia Uruguay Argentina
For example the United States emerged as an important beef exporter largely in response to the preferential access it received in the Japanese and then the South Korean markets The United States received prices in these protected markets that were higher than it could have received in other markets However as Japan and South Korea liberalized their markets imports from Australia and New Zealand competed more strongly with US imports gradually driving down prices to more closely approximate prices in less-protected markets (Figure 1) Similarly the EUrsquos deci-sion to reduce the magnitude of its subsidies on beef exports to the ldquoAtlanticrdquo market gradually raised the average EU export price
Although FMD continues to segment the world beef market its effect appears to be decreasing Some pro-ducing countries have increasingly brought FMD under control Simultaneously greater scientific knowledge has shown that properly processed boneless beef from FMD-endemic countries poses little risk of contamina-tion On the basis of such evidence the EU altered its sanitary policy from that of ldquozero tolerancerdquo in which beef from FMD-endemic countries was strictly prohib-ited to one of ldquominimum riskrdquo in which properly pro-cessed deboned beef was accepted During the Uru-guay Round numerous other countries including the United States and Canada agreed to base their sani-tary policies on science-based information As a result these countries also began to import beef from export-ers with FMD provided that the beef had been prop-erly processed and deboned
The shift toward the disassembly of the carcass in the exporting country and the associated export of cuts instead of carcasses also allowed exporters to arbitrage
beef more effectively across markets domestically and internationally particularly within the context of declining trade restrictions Exporters who were previously restricted to selling carcasses to lower-priced markets can sell lower-quality cuts to these markets while selling higher-priced cuts to higher-priced markets Although this process is little studied we believe it also contributed to price convergence
Although world beef trade remains impeded by FMD and commercial policies such barriers have dimin-ished in the last two decades bringing economic ben-efit to producers and consumers of beef In the process US producers have lost some of the preferential ben-efits they once enjoyed and face greater competition in the United States and in international markets in the future Nonetheless US beef exports continued to rise over the period of price convergence that we have ana-lyzed at least until many foreign markets were closed following discovery of a case of BSE We may therefore expect that as foreign markets become persuaded that US beef is safe US beef will continue to be competi-tive in international markets
Adapted from Jarvis LS JP Cancino and JE Berve-jillo (2005) ldquoInternational Beef Prices Is There Evidence of Convergencerdquo Review of Agricultural Economics 27(3)1-7
Lovell Jarvis is a professor in the ARE department and an associate dean in the College of Agricultural and Environmental Sciences at UC Davis He can be reached by e-mail at lsjarvisucdavisedu Joseacute Bervejillo was an assistant project scientist in the Agricultural Issues Center and is now a rancher in Uruguay He can be reached at jeberveyahoocom Joseacute Cancino is a PhD candidate in the ARE department at UCD and can be reached at jpcancinoucdavisedu
11
Giannini Foundation of Agricultural Economics Update Co-Editors Steve Blank Richard Sexton David Sunding and David Zilberman Managing Editor and Desktop Publisher Julie McNamara
ARE Update is published six times per year by the University of California Giannini Foundation of Agricultural Economics Domestic subscriptions are available free of charge to interested parties
To subscribe to ARE Update by mail contact Julie McNamara Outreach Coordinator Visit our Web site at Department of Agricultural and Resource EconomicsUniversity of California httpgianniniucopedu One Shields Avenue Davis CA 95616 E-mail julieprimalucdaviseduPhone 530-752-5346 To receive notification when new issues of the ARE Update are available online submit an e-mail request to join our listserv to julieprimalucdavisedu Articles published herein may be reprinted in their entirety with the authorrsquos or editorsrsquo permissionPlease credit the University of California Giannini Foundation of Agricultural Economics ARE Update is available online at wwwageconucdaviseduoutreachareupdatephp
The University of California is an Equal OpportunityAffirmative Action employer
Department of Agricultural and Resource EconomicsUC Davis One Shields Avenue Davis CA 95616 3432
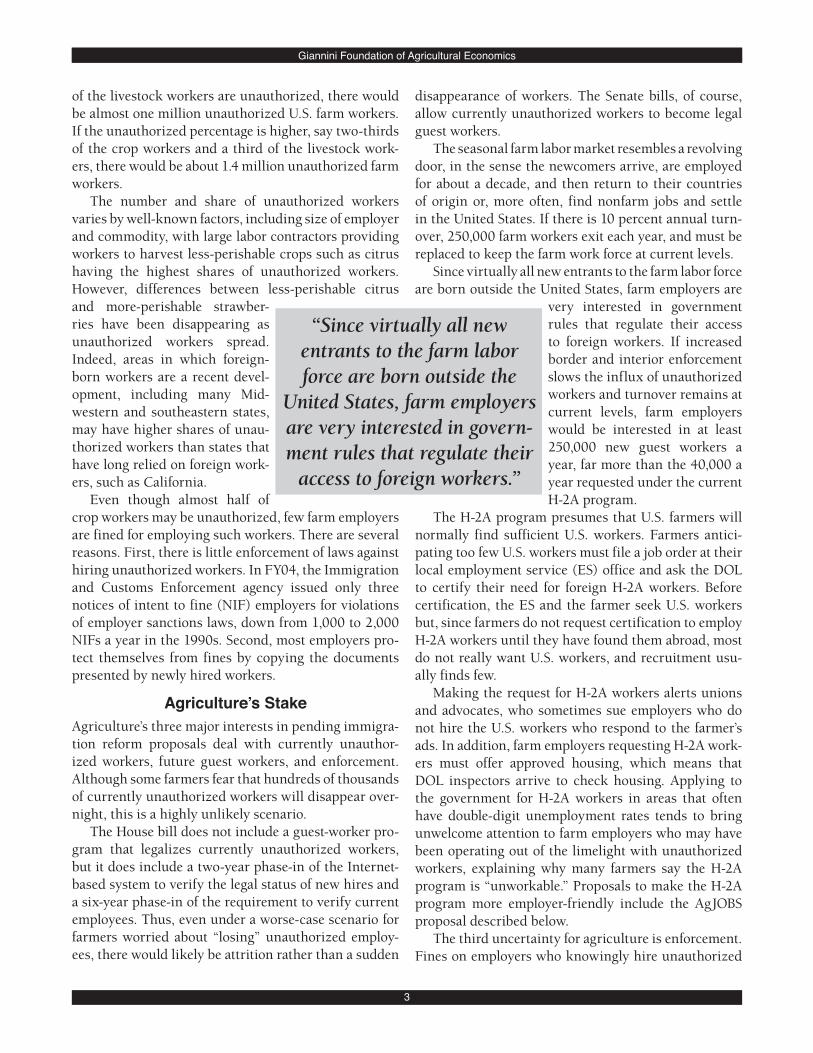
Giannini Foundation of Agricultural Economics
Giannini Foundation of Agricultural Economics
of the livestock workers are unauthorized there would be almost one million unauthorized US farm workers If the unauthorized percentage is higher say two-thirds of the crop workers and a third of the livestock work-ers there would be about 14 million unauthorized farm workers
The number and share of unauthorized workers varies by well-known factors including size of employer and commodity with large labor contractors providing workers to harvest less-perishable crops such as citrus having the highest shares of unauthorized workers However differences between less-perishable citrus and more-perishable strawber-
disappearance of workers The Senate bills of course allow currently unauthorized workers to become legal guest workers
The seasonal farm labor market resembles a revolving door in the sense the newcomers arrive are employed for about a decade and then return to their countries of origin or more often find nonfarm jobs and settle in the United States If there is 10 percent annual turn-over 250000 farm workers exit each year and must be replaced to keep the farm work force at current levels
Since virtually all new entrants to the farm labor force are born outside the United States farm employers are
very interested in government ries have been disappearing as ldquoSince virtually all new rules that regulate their access unauthorized workers spread to foreign workers If increased entrants to the farm labor Indeed areas in which foreign- border and interior enforcement born workers are a recent devel- force are born outside the slows the influx of unauthorized opment including many Mid- workers and turnover remains at United States farm employers western and southeastern states current levels farm employers may have higher shares of unau- are very interested in govern- would be interested in at least thorized workers than states that 250000 new guest workers ament rules that regulate their have long relied on foreign work- year far more than the 40000 a ers such as California access to foreign workersrdquo year requested under the current
Even though almost half of crop workers may be unauthorized few farm employers are fined for employing such workers There are several reasons First there is little enforcement of laws against hiring unauthorized workers In FY04 the Immigration and Customs Enforcement agency issued only three notices of intent to fine (NIF) employers for violations of employer sanctions laws down from 1000 to 2000 NIFs a year in the 1990s Second most employers pro-tect themselves from fines by copying the documents presented by newly hired workers
Agriculturersquos Stake Agriculturersquos three major interests in pending immigra-tion reform proposals deal with currently unauthor-ized workers future guest workers and enforcement Although some farmers fear that hundreds of thousands of currently unauthorized workers will disappear over-night this is a highly unlikely scenario
The House bill does not include a guest-worker pro-gram that legalizes currently unauthorized workers but it does include a two-year phase-in of the Internet-based system to verify the legal status of new hires and a six-year phase-in of the requirement to verify current employees Thus even under a worse-case scenario for farmers worried about ldquolosingrdquo unauthorized employ-ees there would likely be attrition rather than a sudden
H-2A program The H-2A program presumes that US farmers will
normally find sufficient US workers Farmers antici-pating too few US workers must file a job order at their local employment service (ES) office and ask the DOL to certify their need for foreign H-2A workers Before certification the ES and the farmer seek US workers but since farmers do not request certification to employ H-2A workers until they have found them abroad most do not really want US workers and recruitment usu-ally finds few
Making the request for H-2A workers alerts unions and advocates who sometimes sue employers who do not hire the US workers who respond to the farmerrsquos ads In addition farm employers requesting H-2A work-ers must offer approved housing which means that DOL inspectors arrive to check housing Applying to the government for H-2A workers in areas that often have double-digit unemployment rates tends to bring unwelcome attention to farm employers who may have been operating out of the limelight with unauthorized workers explaining why many farmers say the H-2A program is ldquounworkablerdquo Proposals to make the H-2A program more employer-friendly include the AgJOBS proposal described below
The third uncertainty for agriculture is enforcement Fines on employers who knowingly hire unauthorized
3
Giannini Foundation of Agricultural Economics
workers were introduced by the Immigration Reform and Control Act of 1986 to ldquodemagnetize the US labor marketrdquo The theory was that foreigners would quickly discover that even if they eluded the Border Patrol they could not get US jobs but this theory failed to deter illegal migration because of the availability of false doc-uments and little enforcement
A mandatory Internet-based verification system could make enforcement easier For example if employ-ers learn that the data on a newly hired worker was suspect but continue to employ the worker after 30 days there could be a presumption that they knew the worker was unauthorized Similarly by having all employers submit data on newly hired workers it will be easy for enforcers to spot problem industries areas and employers
AgJOBS One of the immigration reform proposals the Agri-cultural Job Opportunity Benefits and Security Act (AgJOBS) would deal only with unauthorized farm workers As the number of unauthorized farm workers rose in the 1990s farmers asked Congress to approve a new guest-worker program for agriculture that did not require DOL certification or housing President Clinton opposed these proposals and threatened to veto any that reached his desk and Congress did not approve a new guest-worker program However the Senate approved a version of what became AgJOBS as an amendment to an appropriations bill in 1998 as farmers gained support of their effort to win a new guest-worker program
After the 2000 election of Vicente Fox in Mexico and George W Bush in the United States farm employers and worker advocates reached a compromise to deal with unauthorized farm workers Farm employers wanted a new guest-worker program with two major features no certification and no housing while worker advocates wanted a system under which currently unauthorized workers could become immigrants The compromise that became AgJOBS satisfied farmers by allowing them to self-certify their need for guest workers and to pay housing allowances to out-of-area workers rather than provide housing Worker advocates won the promise of a temporary legal status for unauthorized farm work-ers and a path to immigrant status for such workers and their families This ldquoamnestyrdquo provision prompted opposition from law-and-order members of Congress and the December 2000 compromise was not enacted
The bipartisan version of AgJOBS pending in the Senate would offer currently unauthorized farm workers
a path to immigrant status for themselves and their children and offer farmers easier access to legal guest workers Supported by a coalition of over 400 employer union and advocate groups AgJOBS got 53 votes when it was attached to an emergency military-spending bill in the Senate on April 19 2005 but since 60 votes were needed it was not approved A competing bill offered by Senator Saxby Chambliss (R-GA) that would have simply made the current H-2A program more employer-friendly was defeated 77-21
Conclusions As Congress debates immigration reform there could be comprehensive reform dealing with all unauthor-ized workers in the United States or piecemeal reform such as enacting only AgJOBS If there is comprehen-sive reform Congress could mandate enforcement first and guest workers or legalization later as in the House bill or have new enforcement measures introduced together with guest workers and legalization as in the Senate bills In 1986 IRCA had legalization first and enforcement second an approach absent from the 2006 discussion
Agriculture has a higher stake in the 2006 debate than it did in the 1986 debate First labor-intensive agriculture is far larger than it was two decades ago Second there are more unauthorized workers and they are far more widely dispersed so that more farmers would likely be affected
However the major change between 1986 and 2006 is that experience has taught what does not work A gen-erous legalization program and weak enforcement as in the late 1980s increased illegal migration and spread unauthorized workers throughout the United States Two decades later there may be much tougher enforce-ment and fewer opportunities for currently unauthor-ized workers to become legal immigrants
Agriculture is cooperating with worker advocates to preserve the labor status quo under AgJOBS which would legalize currently unauthorized workers and provide easier access to additional guest workers These guest workers could become a point of contention between advocates and farm employers
For additional information Martin Philip and Bert Mason 2004 Hired Workers on
California Farms in Jerry Siebert ed California Agri-culture UC Div of Agricultural and Natural Resources
Philip Martin is a professor in the agricultural and resource econo-mics department at UC Davis He can be reached at martinprimal ucdavisedu
4
Giannini Foundation of Agricultural Economics
Democracy and Environmental Quality by
Y Hossein Farzin and Craig A Bond
The relationship between several local and global air pollutants and economic development is evaluated We find empirical support for our hypothesis that democracy provides the best conduit to environmental quality
relative to other governmental structures thus leading to decreased concentrations or emissions of pollution The results have policy implications for the developing world as well as the United StatesEcirc
The relationship between national income and environmental quality is of great interest to economists policy-makers and the public at
large This interest is reflected by growing conflicts between global environmental concerns and global economic development policy as seen by frequent uprisings at WTO meetings Previous literature on this relationship has focused on the so-called Envi-ronmental Kuznets Curve (EKC) which hypothesi-zes an inverted-U shape when pollution indicators are plotted against income per capita as shown in Figure 1 Explanations for this hypothesis generally focus on several primary factors that interact to pro-duce the shape Among these are (1) changes in the composition of aggregate output as economies evolve from agricultural to industrial to service-based goods and services (2) technological progress and (3) increases in demand for environmental quality as income grows
However the relationship between environmen-tal quality and economic development is not formed in isolation from political institutions that govern the process of policymaking in a particular coun-try Thus for example Dasgupta and Maumller aptly emphasized in 1995 ldquoThe connection between envi-ronmental protection and civil and political rights is a close one As a general rule political and civil lib-erties are instrumentally powerful in protecting the environmental resource-base at least when compared with the absence of such liberties in countries run by authoritarian regimesrdquo This observation raises sev-eral important questions How does public environ-mental policy influence the relationship between per capita income and pollution and how does that public policy represent the citizensrsquo preferences for environ-mental quality
We develop a model that directly incorporates the relationship between societal preferences and provision of public-pollution abatement utilizing
a measure of quality of governance as a proxy for weights on those preferences We call this quality of governance variable ldquopolityrdquo and define it to have a low value for authoritarian governments and higher values for governments that are more democratic We hypothesize that democracy and its associated freedoms provide the conduit through which agents can exercise their preferences for environmental quality more effectively than under an autocratic regime thus leading to reduced concentrations andor emissions of pollution We estimate an econometric model of the relationship between several local and global air pollutants and economic development measured by national income per capita The model explicitly accounts for critical aspects of the socio-political-economic regime of a country Additional variables such as income inequality age distribution and urbanization are also included
Relationship between Environmental Policy Governance and Preferences
One of the major determinants of environmental policy is the political regime of a particular country or ldquogovernancerdquo One study has argued that corrup-tion and rent-seeking behavior can influence the rela-tionship between income and the environment They show that corruption causes the turning points of an EKC to rise above the socially optimum level Another study has suggested that well-defined property rights democratic voting systems and respect of human rights can create synergies that lead to increased levels and efficacy of environmental policy
We propose a simple explanation of the role of political structure on the relationship between income and environmental quality based on the relationship between the demand and supply of environmental quality Because environmental quality is mostly a public good and in many cases the capital costs of the required infrastructures to abate pollution are huge
5
Giannini Foundation of Agricultural Economics
Income Per Capita
Pol
luti
on
Figure 1 Environmental Kuznets Curve
Explanation of the Curve It is claimed that many environmental health
indicators such as water and air pollution show the inverted U-shape in the beginning of economic development little weight is given to environmental concerns raising pollution along with industrialization After a threshold when basic physical needs are met interest in a clean environment rises reversing the trend Now society has the funds as well as willingness to spend to reduce pollution
The extension of the Kuznets Curve to environmental health in general has been doubted For example energy land and resource use (sometimes called the ldquoecological footprintrdquo) do not fall with rising income While the ratio of energy per real GDP has fallen total energy use is still rising in most developed countries In general Kuznets curves have been found for some environmental health concerns (such as air pollution) but not for others (such as landfills)
individuals or groups within a society are unable to effectively provide them As such it is usually the State that provides these goods However the Statersquos environmental policy is at least partly influenced by the societyrsquos preferences for environmental quality In particular the relationship between the publicrsquos preferred level of environmental quality and the level actually supplied by the State depends on the weights the policymakers place on the various societal prefer-ences
To illustrate consider the following simple model Suppose that the people in a society can be aggregated into two distinct groups based on some distinguishing characteristic The categorical distinction can be made along any number of characteristics that are likely to
affect environmental preferences for example ldquorich vs poorrdquo ldquoeducated vs non-educatedrdquo ldquourban vs ruralrdquo or ldquoyoung vs oldrdquo The groupsrsquo environmental preferences are assumed to be reflected by their pre-ferred levels of pollution-abatement expenditure to be undertaken by the state
Our model of public environmental-quality provi-sion highlights the importance of the type of political regime for the relationship between economic devel-opment and environmental quality It suggests that environmental-quality expenditures are partly a func-tion of the citizen groupsrsquo preferences but these pref-erences are subject to political distortions misrepre-sentation or neglect by the State The more open and democratic are the political institutions however the more likely it is that the citizensrsquo preferences will be reflected in actual policy decisions and environmen-tal quality as a normal public good will increase
General Results We tested the hypothesis of an inverted-U shaped relationship between the direct effects of national income per capita and pollution indicators conditional on the type of government population density and technology as well as the marginal effect of increasing the quality of the public institutions on environmental quality Results suggest that economic growth alone as measured by a change in GDP is insufficient to improve environmental quality Rather conscious environmental policy emanating from the existing political institutions as represented by the polity variable is necessary In other words the type of government in place clearly influences the chances of environmental policies being implemented
Of the five models estimated only one (emissions of non-methane volatile organic compounds [VOC]) supports the EKC hypothesis of an inverted-U shaped relationship The turning point for the VOC curve is inversely related to the quality of political institutions but tends to occur at GDP levels at the upper end of the distribution Our results support the findings of the previous literature namely growth in income per capita is not sufficient to explain increases in pollu-tion abatement as nations develop As emphasized in the statement by Dasgupta and Maumller quoted earlier conscious choices of environmental policy coming from people exercising their civil rights to express preferences are the key to understanding the relation-ship between economic development and environ-mental quality
6
Giannini Foundation of Agricultural Economics
Our testing of the effects of the government on the estimated relationship corroborates this hypothesis In all cases the marginal effect of the polity vari-able with respect to the pollutant is negative for the majority of the income range under consideration suggesting that countries with more democratic insti-tutions have a greater tendency to reduce pollution For those pollution measures for which the effect is dependent on income levels (CO
2 VOC and SO
2) the
marginal effect of democratization is intensified with income At very low levels of income for four of the five models however the estimated marginal effect of democratization of political institutions could be pos-itive This implies that in very lowndashincome countries for most government types the State and the people assign such a high priority to industrial development that pollution emissions increase However this effect is lessened as income per capita rises
Specific Results Thus environmental policy-making considerations are of paramount importance in describing the rela-tionship between economic development and the environment We turn now to the results of the model that decomposes the environmental-policy indicator variable We try to account for both the preferences of the society and the mechanism through which these preferences are translated into realized pollu-tion abatement
As expected the relationship between GDP per capita and the various pollution measures is similar to that estimated in the basic model However the NOx model now has an EKC relationship with a turning point well outside the sample range of income Never-theless the similarity in conditional results suggests that the decomposition is valid and that demand considerations based on societal preferences are an important determinant of overall environmental quality Income growth conditioned on greater polity scores is predicted to have a relatively smaller impact on increased emissions in four out of five cases Fur-thermore the marginal effects of increasing polity on pollution remain negative at the mean sample values This creates an inverted-U when plotting pollution versus polity just as in the EKC
Urbanization We now turn to the effects of the individual prefer-ence shifters on the pollution indicators conditional on the type of government in place in a given society Urbanization has an unambiguous net positive effect
on all pollution indicators with the exception of CO2
emissions at high levels of democracy and national income This suggests that the effects of increased fossil-fuel use in urban societies mostly dominate any economies of scale or preference effects
Income Inequality Another abatement demand shifter widely discussed (and disputed) in the literature is income inequality as it is hypothesized that the distribution of income may play a role in the incomeenvironment relation-ship In this application the proxy for income inequal-ity is found to have a negative relationship with envi-ronmental quality in three of the five regressions at the sample mean
Interestingly a distinction can be made here between greenhouse gasses (such as CO
2) and the
ozone and acid-rain generating chemicals The latter pollutants most often exhibit an EKC relationship because their consequent damages are primarily local in nature whereas carbon compounds are global in their environmental impacts One explanation for this intriguing result may be the relationship between income inequality and differences in environmental preferences of the poor and rich That is the poor are the primary victims of local air pollutants because they can neither afford the high local costs associated with environmental amenities nor can they choose environmental quality over having a job that is overly exposed to pollution They often have to live and work immediately downstream and downwind thus bear-ing a disproportionate burden of local pollution As such the environmental preferences of the poor are biased toward reduced local pollution
In contrast the rich who can afford and gain from environmental amenities have a lot of interest in amenity values associated with protection of rain-forest biodiversity endangered species and the like and have little interest in some kinds of local pollu-tion Thus assuming that the political behavior of each group (whether rich or poor) is self-interested environmental quality outcomes depend largely on which grouprsquos environmental interests get served by the State Government action in turn depends on politiciansrsquo sensitivity to the issue of environmental justice (both within and between generations) and on the effectiveness of each group to influence them
Age Distribution
A similar pattern appears in terms of the age distribution of the society as measured by the percentage of the
7
Giannini Foundation of Agricultural Economics
population less than fifteen years of age NOx and VOC emissions are negatively correlated with the proxy for youth independent of the level of national income A similar result holds for SO
2 emissions but the
relationship reverses with high GDP per capita levels (achieved by only 18 percent of the observations in the sample) This may partly reflect the empirical fact that infants and young children are the main victims of local ground-level ozone-producing pollutants and the greater sensitivity of politicians to health hazards of these pollutants among the very young Again however the greenhouse gas CO
2 emissions are
predicted to increase with the share of youngsters in the population and this marginal effect is intensified with increases in GDP per capita
Local versus Global Pollutants It appears that the nature of the pollutant may affect the policy weights given to preferences and thus the rate at which the preferred environmental policy is translated into actual policy At low-income levels more weights are seemingly given to abatement poli-cies aiming at local pollutants (such as NOx VOC and SO
2) The main victims of these pollutants are
the inner-city low-income groups and their dam-ages become visible in a relatively short period Con-versely less weight may be given to policies aiming to abate global or regional air pollutants (such as CO
2)
This means policies aiming to improve environmental amenities that benefit and support the lifestyle of the rich receive less weight And this is more likely to be the case the more democratic is the political regime of a society
Education The last preference shifter under consideration is the education of the populace as proxied by the illiteracy rate for people greater than fourteen years of age At least one education term is significant in all of the emissions models though no significant correlation could be determined for ambient SO
2 The relation-
ships all follow the same pattern with illiteracy posi-tively correlated with emissions at relatively low levels of income but the marginal effect reversing sign at higher levels
Conclusions This article discusses the link between income per capita and environmental quality Recognizing that the often-cited ldquoinverted U-shapedrdquo relationship or EKC is not an inevitable result of income growth a
model was developed that specifically accounted for different environmental-policy regimes reflecting the demand for environmental quality as a public good
Results of the exercise support the hypothesis that the qualities of political institutions and several indi-cators of societal preference interact with each other to create the inverted-U shape which is frequently cited in the environment-development literature Estimates of individual effects for each of the included prefer-ence shifters support the hypothesis that more demo-cratic governments respond favorably to environmen-tal demands by the populace
For additional information on this subject the authors recommend the following sources
Dasgupta P Maumller K-G 1995 Poverty institutions and the environmental resource-base in Behrman J Srinivaan TN (Eds) Handbook of Development Economics Vol 3A Elsevier Science Amsterdam Chapter 39
Ecological Economics (1998) Special Issue on the Envi-ronmental Kuznets Curve 25 (2) 143-229
Grossman GM Krueger AB 1995 Economic growth and the environment Quarterly Journal of Economics 110 (2) 353-377
Lopez R Mitra S 2000 Corruption pollution and the Kuznets environment curve Journal of Environ-mental Economics and Management 40 (2) 137-150
Panayotou T 1997 Demystifying the environmental Kuznets curve turning a black box into a policy tool Environment and Development Economics 2 465-484
Persson T Tabellini G 2000 Political Economics Explaining Economic Policy The MIT Press Cam-bridge Massachusetts
Rivera-Batiz FL 2002 Democracy governance and economic growth theory and evidence Review of Development Economics 6 (2) 225-247
Y Hossein Farzin is a professor and CA Bond received his PhD in the Department of Agricultural and Resource Economics at the University of California Davis Professor Farzin can be contacted by telephone at (530)752-7610 or by e-mail at farzinprimalucdavis edu
8
Giannini Foundation of Agricultural Economics
Are International Beef Prices Converging and if so Whyby
Lovell S Jarvis Joseacute E Bervejillo and Joseacute P Cancino
Beef export prices have converged implying liberalization of commercial and sanitary policies in many trading nations and a more competitive international beef market
During the 1980s and 1990s the United States received higher average prices for its beef exports than did most of its competitors Howe-
ver during this period the average US beef export price was declining relative to the beef export prices of other countries This trend appears to be part of a process of convergence among beef export prices from different countries as is shown in figure 1 This paper reports the results of efforts to test whether beef prices did con-verge from 1980-2002 and if they did to determine why What forces are determining international market prices and are such forces affecting US export prices
The United States was one of the worldrsquos largest beef exporters until a case of BSE was found in the state of Washington nearly two years ago US beef exports then declined precipitously The United States is attempting to demonstrate the safety of its beef and hopes to regain an important share of international beef markets US producers must examine the market within which they will compete in the future We hypothesize that US beef export prices have been declining relative to the prices of other countries because major export markets for US beef have become increasingly competitive Sev-eral important beef importers that previously gave pref-erence to US beef liberalized their imports allowing other countries to compete directly with the US
In addition exports from Brazil and Uruguay expanded These countries traditionally excluded from important markets because of endemic Foot and Mouth Disease (FMD) gained access to additional markets After World War II countries with FMD were largely unable to export fresh beef to countries that were free of FMD The international beef market was thus seg-mented In one part trade occurred between export-ers and importers that were FMD-free In another part trade occurred between importers and exporters that were FMD-compromised ie FMD was endemic occurred fairly regularly or was controlled through vaccination Prices in the FMD-free market primarily the Pacific Rim countries including the United States Canada Japan Australia and New Zealand were gen-erally significantly higher than prices in the FMD-com-promised market which included the rest of the world
the European Union (EU) and the Southern Cone of South America as well as the Middle East Eastern Europe and parts of Asia However in recent years Brazil and Uruguay have increasingly controlled FMD while several importers that traditionally excluded beef from exporters with FMD have begun to accept such beef with specific restrictions
Methodology and Data Studies utilizing beef prices often assume that beef is a homogeneous commodity This was a more reason-able assumption in the 1960s when trade was predomi-nantly in carcasses Today almost all beef is exported as differentiated cuts with roughly 85 percent as boneless cuts To compare price trends it is important to cat-egorize beef cuts into more homogeneous products We utilize bone-in beef and boneless beef as the two qual-ity categories Beef sold as carcasses half carcasses and quarters are classified as bone-in beef as are a number of rather simple bone-in cuts most of which involve little value-added in processing Boneless cuts generally imply a higher degree of processing Using these two categories we apply two common tests of price conver-gence to the prices of 17 exporting countries that each accounted for at least one percent of the international beef market in 2002 Collectively they accounted for 90 percent of world beef trade Using annual data we cal-culate the implicit beef export price for each countryrsquos beef products by dividing the value of exports by the quantity of exports We deflate each price series using the US Producer Price Index (PPI) for all commodities We tested for price convergence from 1961 to 2002 and because important changes occurred in markets around 1980 for the period 1980 to 2002 We also tested for price convergence using monthly data for a subset of seven important exporters for 1990-2002
We defined price convergence as a shrinking diver-gence over time in the prices obtained by the principal beef-exporting countries We tested the hypothesis of convergence using two variations of an approach previ-ously published to analyze changes in price dispersion One test utilized the mean of the absolute price differ-entials and the other utilized the standard deviation of
9
Giannini Foundation of Agricultural Economics
Table 1 Tests for Convergence of Beef Export Prices
A Annual data
Group 1 (All 17 Exporters) 1961- 1980-2002 2002
Bone-in C C
Boneless C C
Group 2 (10 European Exporters)
Bone-in C C
Boneless C C
Group 3 (8 Largest exporters including EU as one exporter)
Bone-in NSC NSC
Boneless DNS DNS
Group 4 (2 FMD free and 2 FMD endemic exporters)
Bone-in C C
Boneless C C
B Monthly data
7-Major Exporters Jan 1990-Dec 2002
Bone-in C
Boneless C Notes The tests use 1) absolute price differentials (APD) and 2) standard deviations of price differentials (SD) C corresponds to price convergence with Plt10 for both tests NSC corresponds to no significance for APD test and convergence for SD test while DNS correspond to price divergence for APD test and no significance for SD test
absolute price differentials We fit a linear trend to each of the series of annual observations The null hypoth-esis was that the estimated trends would be negative reflecting a tendency for the mean or the standard deviation of the differentials to decline over time We applied each test to the prices of a) bone-in beef and b) boneless beef for each period analyzed We analyzed convergence for the entire set of countries and for sev-eral subsets to determine whether any of the results appeared sensitive to the particular set of countries chosen The country sets were Group 1 The 17 principal exporters Argentina Aus-tralia Austria Belgium-Luxembourg Brazil Canada Denmark France Germany Ireland Italy Netherlands New Zealand Poland Spain United States and Uru-guay Group 2 The European exporters from Group 1 Aus-tria Belgium-Luxembourg Denmark France Germa-ny Ireland Italy Netherlands Poland Spain Group 3 The eight largest exporters from Group 1 excluding Poland and taking the EU as a single country with intra-bloc trade excluded
Group 4 The four major grass-fed exporters Aus-tralia New Zealand Uruguay and Brazil The first two countries have always been FMD-free whereas Uruguay and Brazil have almost always been FMD-endemic This set probably provides the best test of convergence between the FMD segments
Results Table 1 part A contains results for the tests applied to the prices of boneless and bone-in beef using annual data for 1961-2002 and 1980-2002 for the four sets of countries In almost every case the results are consistent with price convergence
The results suggest that price convergence occurred for all exporters taken together (Group 1) for the European exporters (Group 2) and for the matched set of FMD-free and FMD-endemic exporters (Group 4) in each case for bone-in and boneless beef and in both periods except for Group 4 which was not significant The prices of the largest exporters (Group 3) also show convergence for the prices of bone-in beef in both periods when the test uses the standard deviations of price differentials but not when the test uses the mean of the absolute price differentials When the same tests are applied to the prices of boneless beef the results from both tests support divergence in 1961-2002 and indicate a constant trend in 1980-2002 Note particularly that the prices in a matched set of FMD-free and FMD-endemic country
prices (Group 4) show convergence for both types of beef and in both periods except in one case which is insignificant Thus there is evidence that the price differential attributed to FMD has shrunk
Table 1 part B contains the results for the tests car-ried out using monthly data for 1990-2002 for Group 3 (excluding Argentina for which monthly data were not available) again for both bone-in and boneless beef The results provide strong evidence of price convergence for bone-in and boneless beef in 1990-2002 The use of annual data for 1990-2002 produced highly similar results with and without the inclusion of Argentina It seems clear that the tendency toward price conver-gence was strong throughout the 1990s
Why Have Prices Converged We believe that price convergence has been caused prin-cipally by 1) changes in commercial policy following the Uruguay Round 2) the erosion of the price penalty traditionally faced by beef-producing countries with endemic FMD and 3) the industryrsquos shift toward the
10
$M
etri
c T
ons
Giannini Foundation of Agricultural Economics
export of cuts instead of carcasses Historically Figure 1 Export Price of Fresh Beef Major Exporters beef trade has been strongly influenced by tar- 1961-2002 iffs quotas and other forms of commercial
9000 policy The last two decades have witnessed
8000 considerable liberalization in import quotas
7000 and a reduction of export subsidies by the 6000 EU The liberalization of commercial policy is
1961
2001
1999
1997
1995
1993
1991
1989
1987
1985
1983
1981
1979
1977
1975
1973
1971
1969
1967
1965
1963
probably a factor in the observed convergenceEcircof beef export prices and as such probablyEcircimplies significant global welfare gains in thisEcircimportant commodity marketEcirc
5000
4000
3000
2000 Qualitative analysis indicates that the great-
1000 est divergence among market prices at theEcirc0beginning of the period was the result of sev-
eral exporting countries having preferentialEcircaccess to several strongly protected marketsEcirc Germany US Australia Uruguay Argentina
For example the United States emerged as an important beef exporter largely in response to the preferential access it received in the Japanese and then the South Korean markets The United States received prices in these protected markets that were higher than it could have received in other markets However as Japan and South Korea liberalized their markets imports from Australia and New Zealand competed more strongly with US imports gradually driving down prices to more closely approximate prices in less-protected markets (Figure 1) Similarly the EUrsquos deci-sion to reduce the magnitude of its subsidies on beef exports to the ldquoAtlanticrdquo market gradually raised the average EU export price
Although FMD continues to segment the world beef market its effect appears to be decreasing Some pro-ducing countries have increasingly brought FMD under control Simultaneously greater scientific knowledge has shown that properly processed boneless beef from FMD-endemic countries poses little risk of contamina-tion On the basis of such evidence the EU altered its sanitary policy from that of ldquozero tolerancerdquo in which beef from FMD-endemic countries was strictly prohib-ited to one of ldquominimum riskrdquo in which properly pro-cessed deboned beef was accepted During the Uru-guay Round numerous other countries including the United States and Canada agreed to base their sani-tary policies on science-based information As a result these countries also began to import beef from export-ers with FMD provided that the beef had been prop-erly processed and deboned
The shift toward the disassembly of the carcass in the exporting country and the associated export of cuts instead of carcasses also allowed exporters to arbitrage
beef more effectively across markets domestically and internationally particularly within the context of declining trade restrictions Exporters who were previously restricted to selling carcasses to lower-priced markets can sell lower-quality cuts to these markets while selling higher-priced cuts to higher-priced markets Although this process is little studied we believe it also contributed to price convergence
Although world beef trade remains impeded by FMD and commercial policies such barriers have dimin-ished in the last two decades bringing economic ben-efit to producers and consumers of beef In the process US producers have lost some of the preferential ben-efits they once enjoyed and face greater competition in the United States and in international markets in the future Nonetheless US beef exports continued to rise over the period of price convergence that we have ana-lyzed at least until many foreign markets were closed following discovery of a case of BSE We may therefore expect that as foreign markets become persuaded that US beef is safe US beef will continue to be competi-tive in international markets
Adapted from Jarvis LS JP Cancino and JE Berve-jillo (2005) ldquoInternational Beef Prices Is There Evidence of Convergencerdquo Review of Agricultural Economics 27(3)1-7
Lovell Jarvis is a professor in the ARE department and an associate dean in the College of Agricultural and Environmental Sciences at UC Davis He can be reached by e-mail at lsjarvisucdavisedu Joseacute Bervejillo was an assistant project scientist in the Agricultural Issues Center and is now a rancher in Uruguay He can be reached at jeberveyahoocom Joseacute Cancino is a PhD candidate in the ARE department at UCD and can be reached at jpcancinoucdavisedu
11
Giannini Foundation of Agricultural Economics Update Co-Editors Steve Blank Richard Sexton David Sunding and David Zilberman Managing Editor and Desktop Publisher Julie McNamara
ARE Update is published six times per year by the University of California Giannini Foundation of Agricultural Economics Domestic subscriptions are available free of charge to interested parties
To subscribe to ARE Update by mail contact Julie McNamara Outreach Coordinator Visit our Web site at Department of Agricultural and Resource EconomicsUniversity of California httpgianniniucopedu One Shields Avenue Davis CA 95616 E-mail julieprimalucdaviseduPhone 530-752-5346 To receive notification when new issues of the ARE Update are available online submit an e-mail request to join our listserv to julieprimalucdavisedu Articles published herein may be reprinted in their entirety with the authorrsquos or editorsrsquo permissionPlease credit the University of California Giannini Foundation of Agricultural Economics ARE Update is available online at wwwageconucdaviseduoutreachareupdatephp
The University of California is an Equal OpportunityAffirmative Action employer
Department of Agricultural and Resource EconomicsUC Davis One Shields Avenue Davis CA 95616 3432

Giannini Foundation of Agricultural Economics
Democracy and Environmental Quality by
Y Hossein Farzin and Craig A Bond
The relationship between several local and global air pollutants and economic development is evaluated We find empirical support for our hypothesis that democracy provides the best conduit to environmental quality
relative to other governmental structures thus leading to decreased concentrations or emissions of pollution The results have policy implications for the developing world as well as the United StatesEcirc
The relationship between national income and environmental quality is of great interest to economists policy-makers and the public at
large This interest is reflected by growing conflicts between global environmental concerns and global economic development policy as seen by frequent uprisings at WTO meetings Previous literature on this relationship has focused on the so-called Envi-ronmental Kuznets Curve (EKC) which hypothesi-zes an inverted-U shape when pollution indicators are plotted against income per capita as shown in Figure 1 Explanations for this hypothesis generally focus on several primary factors that interact to pro-duce the shape Among these are (1) changes in the composition of aggregate output as economies evolve from agricultural to industrial to service-based goods and services (2) technological progress and (3) increases in demand for environmental quality as income grows
However the relationship between environmen-tal quality and economic development is not formed in isolation from political institutions that govern the process of policymaking in a particular coun-try Thus for example Dasgupta and Maumller aptly emphasized in 1995 ldquoThe connection between envi-ronmental protection and civil and political rights is a close one As a general rule political and civil lib-erties are instrumentally powerful in protecting the environmental resource-base at least when compared with the absence of such liberties in countries run by authoritarian regimesrdquo This observation raises sev-eral important questions How does public environ-mental policy influence the relationship between per capita income and pollution and how does that public policy represent the citizensrsquo preferences for environ-mental quality
We develop a model that directly incorporates the relationship between societal preferences and provision of public-pollution abatement utilizing
a measure of quality of governance as a proxy for weights on those preferences We call this quality of governance variable ldquopolityrdquo and define it to have a low value for authoritarian governments and higher values for governments that are more democratic We hypothesize that democracy and its associated freedoms provide the conduit through which agents can exercise their preferences for environmental quality more effectively than under an autocratic regime thus leading to reduced concentrations andor emissions of pollution We estimate an econometric model of the relationship between several local and global air pollutants and economic development measured by national income per capita The model explicitly accounts for critical aspects of the socio-political-economic regime of a country Additional variables such as income inequality age distribution and urbanization are also included
Relationship between Environmental Policy Governance and Preferences
One of the major determinants of environmental policy is the political regime of a particular country or ldquogovernancerdquo One study has argued that corrup-tion and rent-seeking behavior can influence the rela-tionship between income and the environment They show that corruption causes the turning points of an EKC to rise above the socially optimum level Another study has suggested that well-defined property rights democratic voting systems and respect of human rights can create synergies that lead to increased levels and efficacy of environmental policy
We propose a simple explanation of the role of political structure on the relationship between income and environmental quality based on the relationship between the demand and supply of environmental quality Because environmental quality is mostly a public good and in many cases the capital costs of the required infrastructures to abate pollution are huge
5
Giannini Foundation of Agricultural Economics
Income Per Capita
Pol
luti
on
Figure 1 Environmental Kuznets Curve
Explanation of the Curve It is claimed that many environmental health
indicators such as water and air pollution show the inverted U-shape in the beginning of economic development little weight is given to environmental concerns raising pollution along with industrialization After a threshold when basic physical needs are met interest in a clean environment rises reversing the trend Now society has the funds as well as willingness to spend to reduce pollution
The extension of the Kuznets Curve to environmental health in general has been doubted For example energy land and resource use (sometimes called the ldquoecological footprintrdquo) do not fall with rising income While the ratio of energy per real GDP has fallen total energy use is still rising in most developed countries In general Kuznets curves have been found for some environmental health concerns (such as air pollution) but not for others (such as landfills)
individuals or groups within a society are unable to effectively provide them As such it is usually the State that provides these goods However the Statersquos environmental policy is at least partly influenced by the societyrsquos preferences for environmental quality In particular the relationship between the publicrsquos preferred level of environmental quality and the level actually supplied by the State depends on the weights the policymakers place on the various societal prefer-ences
To illustrate consider the following simple model Suppose that the people in a society can be aggregated into two distinct groups based on some distinguishing characteristic The categorical distinction can be made along any number of characteristics that are likely to
affect environmental preferences for example ldquorich vs poorrdquo ldquoeducated vs non-educatedrdquo ldquourban vs ruralrdquo or ldquoyoung vs oldrdquo The groupsrsquo environmental preferences are assumed to be reflected by their pre-ferred levels of pollution-abatement expenditure to be undertaken by the state
Our model of public environmental-quality provi-sion highlights the importance of the type of political regime for the relationship between economic devel-opment and environmental quality It suggests that environmental-quality expenditures are partly a func-tion of the citizen groupsrsquo preferences but these pref-erences are subject to political distortions misrepre-sentation or neglect by the State The more open and democratic are the political institutions however the more likely it is that the citizensrsquo preferences will be reflected in actual policy decisions and environmen-tal quality as a normal public good will increase
General Results We tested the hypothesis of an inverted-U shaped relationship between the direct effects of national income per capita and pollution indicators conditional on the type of government population density and technology as well as the marginal effect of increasing the quality of the public institutions on environmental quality Results suggest that economic growth alone as measured by a change in GDP is insufficient to improve environmental quality Rather conscious environmental policy emanating from the existing political institutions as represented by the polity variable is necessary In other words the type of government in place clearly influences the chances of environmental policies being implemented
Of the five models estimated only one (emissions of non-methane volatile organic compounds [VOC]) supports the EKC hypothesis of an inverted-U shaped relationship The turning point for the VOC curve is inversely related to the quality of political institutions but tends to occur at GDP levels at the upper end of the distribution Our results support the findings of the previous literature namely growth in income per capita is not sufficient to explain increases in pollu-tion abatement as nations develop As emphasized in the statement by Dasgupta and Maumller quoted earlier conscious choices of environmental policy coming from people exercising their civil rights to express preferences are the key to understanding the relation-ship between economic development and environ-mental quality
6
Giannini Foundation of Agricultural Economics
Our testing of the effects of the government on the estimated relationship corroborates this hypothesis In all cases the marginal effect of the polity vari-able with respect to the pollutant is negative for the majority of the income range under consideration suggesting that countries with more democratic insti-tutions have a greater tendency to reduce pollution For those pollution measures for which the effect is dependent on income levels (CO
2 VOC and SO
2) the
marginal effect of democratization is intensified with income At very low levels of income for four of the five models however the estimated marginal effect of democratization of political institutions could be pos-itive This implies that in very lowndashincome countries for most government types the State and the people assign such a high priority to industrial development that pollution emissions increase However this effect is lessened as income per capita rises
Specific Results Thus environmental policy-making considerations are of paramount importance in describing the rela-tionship between economic development and the environment We turn now to the results of the model that decomposes the environmental-policy indicator variable We try to account for both the preferences of the society and the mechanism through which these preferences are translated into realized pollu-tion abatement
As expected the relationship between GDP per capita and the various pollution measures is similar to that estimated in the basic model However the NOx model now has an EKC relationship with a turning point well outside the sample range of income Never-theless the similarity in conditional results suggests that the decomposition is valid and that demand considerations based on societal preferences are an important determinant of overall environmental quality Income growth conditioned on greater polity scores is predicted to have a relatively smaller impact on increased emissions in four out of five cases Fur-thermore the marginal effects of increasing polity on pollution remain negative at the mean sample values This creates an inverted-U when plotting pollution versus polity just as in the EKC
Urbanization We now turn to the effects of the individual prefer-ence shifters on the pollution indicators conditional on the type of government in place in a given society Urbanization has an unambiguous net positive effect
on all pollution indicators with the exception of CO2
emissions at high levels of democracy and national income This suggests that the effects of increased fossil-fuel use in urban societies mostly dominate any economies of scale or preference effects
Income Inequality Another abatement demand shifter widely discussed (and disputed) in the literature is income inequality as it is hypothesized that the distribution of income may play a role in the incomeenvironment relation-ship In this application the proxy for income inequal-ity is found to have a negative relationship with envi-ronmental quality in three of the five regressions at the sample mean
Interestingly a distinction can be made here between greenhouse gasses (such as CO
2) and the
ozone and acid-rain generating chemicals The latter pollutants most often exhibit an EKC relationship because their consequent damages are primarily local in nature whereas carbon compounds are global in their environmental impacts One explanation for this intriguing result may be the relationship between income inequality and differences in environmental preferences of the poor and rich That is the poor are the primary victims of local air pollutants because they can neither afford the high local costs associated with environmental amenities nor can they choose environmental quality over having a job that is overly exposed to pollution They often have to live and work immediately downstream and downwind thus bear-ing a disproportionate burden of local pollution As such the environmental preferences of the poor are biased toward reduced local pollution
In contrast the rich who can afford and gain from environmental amenities have a lot of interest in amenity values associated with protection of rain-forest biodiversity endangered species and the like and have little interest in some kinds of local pollu-tion Thus assuming that the political behavior of each group (whether rich or poor) is self-interested environmental quality outcomes depend largely on which grouprsquos environmental interests get served by the State Government action in turn depends on politiciansrsquo sensitivity to the issue of environmental justice (both within and between generations) and on the effectiveness of each group to influence them
Age Distribution
A similar pattern appears in terms of the age distribution of the society as measured by the percentage of the
7
Giannini Foundation of Agricultural Economics
population less than fifteen years of age NOx and VOC emissions are negatively correlated with the proxy for youth independent of the level of national income A similar result holds for SO
2 emissions but the
relationship reverses with high GDP per capita levels (achieved by only 18 percent of the observations in the sample) This may partly reflect the empirical fact that infants and young children are the main victims of local ground-level ozone-producing pollutants and the greater sensitivity of politicians to health hazards of these pollutants among the very young Again however the greenhouse gas CO
2 emissions are
predicted to increase with the share of youngsters in the population and this marginal effect is intensified with increases in GDP per capita
Local versus Global Pollutants It appears that the nature of the pollutant may affect the policy weights given to preferences and thus the rate at which the preferred environmental policy is translated into actual policy At low-income levels more weights are seemingly given to abatement poli-cies aiming at local pollutants (such as NOx VOC and SO
2) The main victims of these pollutants are
the inner-city low-income groups and their dam-ages become visible in a relatively short period Con-versely less weight may be given to policies aiming to abate global or regional air pollutants (such as CO
2)
This means policies aiming to improve environmental amenities that benefit and support the lifestyle of the rich receive less weight And this is more likely to be the case the more democratic is the political regime of a society
Education The last preference shifter under consideration is the education of the populace as proxied by the illiteracy rate for people greater than fourteen years of age At least one education term is significant in all of the emissions models though no significant correlation could be determined for ambient SO
2 The relation-
ships all follow the same pattern with illiteracy posi-tively correlated with emissions at relatively low levels of income but the marginal effect reversing sign at higher levels
Conclusions This article discusses the link between income per capita and environmental quality Recognizing that the often-cited ldquoinverted U-shapedrdquo relationship or EKC is not an inevitable result of income growth a
model was developed that specifically accounted for different environmental-policy regimes reflecting the demand for environmental quality as a public good
Results of the exercise support the hypothesis that the qualities of political institutions and several indi-cators of societal preference interact with each other to create the inverted-U shape which is frequently cited in the environment-development literature Estimates of individual effects for each of the included prefer-ence shifters support the hypothesis that more demo-cratic governments respond favorably to environmen-tal demands by the populace
For additional information on this subject the authors recommend the following sources
Dasgupta P Maumller K-G 1995 Poverty institutions and the environmental resource-base in Behrman J Srinivaan TN (Eds) Handbook of Development Economics Vol 3A Elsevier Science Amsterdam Chapter 39
Ecological Economics (1998) Special Issue on the Envi-ronmental Kuznets Curve 25 (2) 143-229
Grossman GM Krueger AB 1995 Economic growth and the environment Quarterly Journal of Economics 110 (2) 353-377
Lopez R Mitra S 2000 Corruption pollution and the Kuznets environment curve Journal of Environ-mental Economics and Management 40 (2) 137-150
Panayotou T 1997 Demystifying the environmental Kuznets curve turning a black box into a policy tool Environment and Development Economics 2 465-484
Persson T Tabellini G 2000 Political Economics Explaining Economic Policy The MIT Press Cam-bridge Massachusetts
Rivera-Batiz FL 2002 Democracy governance and economic growth theory and evidence Review of Development Economics 6 (2) 225-247
Y Hossein Farzin is a professor and CA Bond received his PhD in the Department of Agricultural and Resource Economics at the University of California Davis Professor Farzin can be contacted by telephone at (530)752-7610 or by e-mail at farzinprimalucdavis edu
8
Giannini Foundation of Agricultural Economics
Are International Beef Prices Converging and if so Whyby
Lovell S Jarvis Joseacute E Bervejillo and Joseacute P Cancino
Beef export prices have converged implying liberalization of commercial and sanitary policies in many trading nations and a more competitive international beef market
During the 1980s and 1990s the United States received higher average prices for its beef exports than did most of its competitors Howe-
ver during this period the average US beef export price was declining relative to the beef export prices of other countries This trend appears to be part of a process of convergence among beef export prices from different countries as is shown in figure 1 This paper reports the results of efforts to test whether beef prices did con-verge from 1980-2002 and if they did to determine why What forces are determining international market prices and are such forces affecting US export prices
The United States was one of the worldrsquos largest beef exporters until a case of BSE was found in the state of Washington nearly two years ago US beef exports then declined precipitously The United States is attempting to demonstrate the safety of its beef and hopes to regain an important share of international beef markets US producers must examine the market within which they will compete in the future We hypothesize that US beef export prices have been declining relative to the prices of other countries because major export markets for US beef have become increasingly competitive Sev-eral important beef importers that previously gave pref-erence to US beef liberalized their imports allowing other countries to compete directly with the US
In addition exports from Brazil and Uruguay expanded These countries traditionally excluded from important markets because of endemic Foot and Mouth Disease (FMD) gained access to additional markets After World War II countries with FMD were largely unable to export fresh beef to countries that were free of FMD The international beef market was thus seg-mented In one part trade occurred between export-ers and importers that were FMD-free In another part trade occurred between importers and exporters that were FMD-compromised ie FMD was endemic occurred fairly regularly or was controlled through vaccination Prices in the FMD-free market primarily the Pacific Rim countries including the United States Canada Japan Australia and New Zealand were gen-erally significantly higher than prices in the FMD-com-promised market which included the rest of the world
the European Union (EU) and the Southern Cone of South America as well as the Middle East Eastern Europe and parts of Asia However in recent years Brazil and Uruguay have increasingly controlled FMD while several importers that traditionally excluded beef from exporters with FMD have begun to accept such beef with specific restrictions
Methodology and Data Studies utilizing beef prices often assume that beef is a homogeneous commodity This was a more reason-able assumption in the 1960s when trade was predomi-nantly in carcasses Today almost all beef is exported as differentiated cuts with roughly 85 percent as boneless cuts To compare price trends it is important to cat-egorize beef cuts into more homogeneous products We utilize bone-in beef and boneless beef as the two qual-ity categories Beef sold as carcasses half carcasses and quarters are classified as bone-in beef as are a number of rather simple bone-in cuts most of which involve little value-added in processing Boneless cuts generally imply a higher degree of processing Using these two categories we apply two common tests of price conver-gence to the prices of 17 exporting countries that each accounted for at least one percent of the international beef market in 2002 Collectively they accounted for 90 percent of world beef trade Using annual data we cal-culate the implicit beef export price for each countryrsquos beef products by dividing the value of exports by the quantity of exports We deflate each price series using the US Producer Price Index (PPI) for all commodities We tested for price convergence from 1961 to 2002 and because important changes occurred in markets around 1980 for the period 1980 to 2002 We also tested for price convergence using monthly data for a subset of seven important exporters for 1990-2002
We defined price convergence as a shrinking diver-gence over time in the prices obtained by the principal beef-exporting countries We tested the hypothesis of convergence using two variations of an approach previ-ously published to analyze changes in price dispersion One test utilized the mean of the absolute price differ-entials and the other utilized the standard deviation of
9
Giannini Foundation of Agricultural Economics
Table 1 Tests for Convergence of Beef Export Prices
A Annual data
Group 1 (All 17 Exporters) 1961- 1980-2002 2002
Bone-in C C
Boneless C C
Group 2 (10 European Exporters)
Bone-in C C
Boneless C C
Group 3 (8 Largest exporters including EU as one exporter)
Bone-in NSC NSC
Boneless DNS DNS
Group 4 (2 FMD free and 2 FMD endemic exporters)
Bone-in C C
Boneless C C
B Monthly data
7-Major Exporters Jan 1990-Dec 2002
Bone-in C
Boneless C Notes The tests use 1) absolute price differentials (APD) and 2) standard deviations of price differentials (SD) C corresponds to price convergence with Plt10 for both tests NSC corresponds to no significance for APD test and convergence for SD test while DNS correspond to price divergence for APD test and no significance for SD test
absolute price differentials We fit a linear trend to each of the series of annual observations The null hypoth-esis was that the estimated trends would be negative reflecting a tendency for the mean or the standard deviation of the differentials to decline over time We applied each test to the prices of a) bone-in beef and b) boneless beef for each period analyzed We analyzed convergence for the entire set of countries and for sev-eral subsets to determine whether any of the results appeared sensitive to the particular set of countries chosen The country sets were Group 1 The 17 principal exporters Argentina Aus-tralia Austria Belgium-Luxembourg Brazil Canada Denmark France Germany Ireland Italy Netherlands New Zealand Poland Spain United States and Uru-guay Group 2 The European exporters from Group 1 Aus-tria Belgium-Luxembourg Denmark France Germa-ny Ireland Italy Netherlands Poland Spain Group 3 The eight largest exporters from Group 1 excluding Poland and taking the EU as a single country with intra-bloc trade excluded
Group 4 The four major grass-fed exporters Aus-tralia New Zealand Uruguay and Brazil The first two countries have always been FMD-free whereas Uruguay and Brazil have almost always been FMD-endemic This set probably provides the best test of convergence between the FMD segments
Results Table 1 part A contains results for the tests applied to the prices of boneless and bone-in beef using annual data for 1961-2002 and 1980-2002 for the four sets of countries In almost every case the results are consistent with price convergence
The results suggest that price convergence occurred for all exporters taken together (Group 1) for the European exporters (Group 2) and for the matched set of FMD-free and FMD-endemic exporters (Group 4) in each case for bone-in and boneless beef and in both periods except for Group 4 which was not significant The prices of the largest exporters (Group 3) also show convergence for the prices of bone-in beef in both periods when the test uses the standard deviations of price differentials but not when the test uses the mean of the absolute price differentials When the same tests are applied to the prices of boneless beef the results from both tests support divergence in 1961-2002 and indicate a constant trend in 1980-2002 Note particularly that the prices in a matched set of FMD-free and FMD-endemic country
prices (Group 4) show convergence for both types of beef and in both periods except in one case which is insignificant Thus there is evidence that the price differential attributed to FMD has shrunk
Table 1 part B contains the results for the tests car-ried out using monthly data for 1990-2002 for Group 3 (excluding Argentina for which monthly data were not available) again for both bone-in and boneless beef The results provide strong evidence of price convergence for bone-in and boneless beef in 1990-2002 The use of annual data for 1990-2002 produced highly similar results with and without the inclusion of Argentina It seems clear that the tendency toward price conver-gence was strong throughout the 1990s
Why Have Prices Converged We believe that price convergence has been caused prin-cipally by 1) changes in commercial policy following the Uruguay Round 2) the erosion of the price penalty traditionally faced by beef-producing countries with endemic FMD and 3) the industryrsquos shift toward the
10
$M
etri
c T
ons
Giannini Foundation of Agricultural Economics
export of cuts instead of carcasses Historically Figure 1 Export Price of Fresh Beef Major Exporters beef trade has been strongly influenced by tar- 1961-2002 iffs quotas and other forms of commercial
9000 policy The last two decades have witnessed
8000 considerable liberalization in import quotas
7000 and a reduction of export subsidies by the 6000 EU The liberalization of commercial policy is
1961
2001
1999
1997
1995
1993
1991
1989
1987
1985
1983
1981
1979
1977
1975
1973
1971
1969
1967
1965
1963
probably a factor in the observed convergenceEcircof beef export prices and as such probablyEcircimplies significant global welfare gains in thisEcircimportant commodity marketEcirc
5000
4000
3000
2000 Qualitative analysis indicates that the great-
1000 est divergence among market prices at theEcirc0beginning of the period was the result of sev-
eral exporting countries having preferentialEcircaccess to several strongly protected marketsEcirc Germany US Australia Uruguay Argentina
For example the United States emerged as an important beef exporter largely in response to the preferential access it received in the Japanese and then the South Korean markets The United States received prices in these protected markets that were higher than it could have received in other markets However as Japan and South Korea liberalized their markets imports from Australia and New Zealand competed more strongly with US imports gradually driving down prices to more closely approximate prices in less-protected markets (Figure 1) Similarly the EUrsquos deci-sion to reduce the magnitude of its subsidies on beef exports to the ldquoAtlanticrdquo market gradually raised the average EU export price
Although FMD continues to segment the world beef market its effect appears to be decreasing Some pro-ducing countries have increasingly brought FMD under control Simultaneously greater scientific knowledge has shown that properly processed boneless beef from FMD-endemic countries poses little risk of contamina-tion On the basis of such evidence the EU altered its sanitary policy from that of ldquozero tolerancerdquo in which beef from FMD-endemic countries was strictly prohib-ited to one of ldquominimum riskrdquo in which properly pro-cessed deboned beef was accepted During the Uru-guay Round numerous other countries including the United States and Canada agreed to base their sani-tary policies on science-based information As a result these countries also began to import beef from export-ers with FMD provided that the beef had been prop-erly processed and deboned
The shift toward the disassembly of the carcass in the exporting country and the associated export of cuts instead of carcasses also allowed exporters to arbitrage
beef more effectively across markets domestically and internationally particularly within the context of declining trade restrictions Exporters who were previously restricted to selling carcasses to lower-priced markets can sell lower-quality cuts to these markets while selling higher-priced cuts to higher-priced markets Although this process is little studied we believe it also contributed to price convergence
Although world beef trade remains impeded by FMD and commercial policies such barriers have dimin-ished in the last two decades bringing economic ben-efit to producers and consumers of beef In the process US producers have lost some of the preferential ben-efits they once enjoyed and face greater competition in the United States and in international markets in the future Nonetheless US beef exports continued to rise over the period of price convergence that we have ana-lyzed at least until many foreign markets were closed following discovery of a case of BSE We may therefore expect that as foreign markets become persuaded that US beef is safe US beef will continue to be competi-tive in international markets
Adapted from Jarvis LS JP Cancino and JE Berve-jillo (2005) ldquoInternational Beef Prices Is There Evidence of Convergencerdquo Review of Agricultural Economics 27(3)1-7
Lovell Jarvis is a professor in the ARE department and an associate dean in the College of Agricultural and Environmental Sciences at UC Davis He can be reached by e-mail at lsjarvisucdavisedu Joseacute Bervejillo was an assistant project scientist in the Agricultural Issues Center and is now a rancher in Uruguay He can be reached at jeberveyahoocom Joseacute Cancino is a PhD candidate in the ARE department at UCD and can be reached at jpcancinoucdavisedu
11
Giannini Foundation of Agricultural Economics Update Co-Editors Steve Blank Richard Sexton David Sunding and David Zilberman Managing Editor and Desktop Publisher Julie McNamara
ARE Update is published six times per year by the University of California Giannini Foundation of Agricultural Economics Domestic subscriptions are available free of charge to interested parties
To subscribe to ARE Update by mail contact Julie McNamara Outreach Coordinator Visit our Web site at Department of Agricultural and Resource EconomicsUniversity of California httpgianniniucopedu One Shields Avenue Davis CA 95616 E-mail julieprimalucdaviseduPhone 530-752-5346 To receive notification when new issues of the ARE Update are available online submit an e-mail request to join our listserv to julieprimalucdavisedu Articles published herein may be reprinted in their entirety with the authorrsquos or editorsrsquo permissionPlease credit the University of California Giannini Foundation of Agricultural Economics ARE Update is available online at wwwageconucdaviseduoutreachareupdatephp
The University of California is an Equal OpportunityAffirmative Action employer
Department of Agricultural and Resource EconomicsUC Davis One Shields Avenue Davis CA 95616 3432
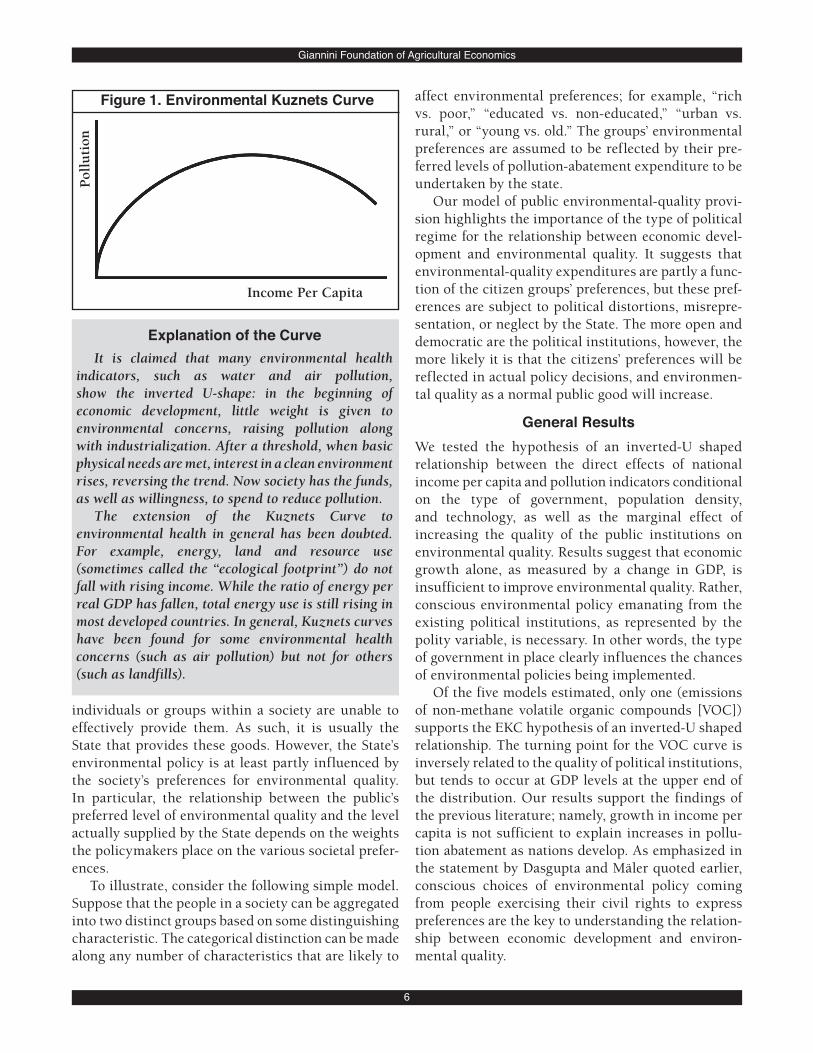
Giannini Foundation of Agricultural Economics
population less than fifteen years of age NOx and VOC emissions are negatively correlated with the proxy for youth independent of the level of national income A similar result holds for SO
2 emissions but the
relationship reverses with high GDP per capita levels (achieved by only 18 percent of the observations in the sample) This may partly reflect the empirical fact that infants and young children are the main victims of local ground-level ozone-producing pollutants and the greater sensitivity of politicians to health hazards of these pollutants among the very young Again however the greenhouse gas CO
2 emissions are
predicted to increase with the share of youngsters in the population and this marginal effect is intensified with increases in GDP per capita
Local versus Global Pollutants It appears that the nature of the pollutant may affect the policy weights given to preferences and thus the rate at which the preferred environmental policy is translated into actual policy At low-income levels more weights are seemingly given to abatement poli-cies aiming at local pollutants (such as NOx VOC and SO
2) The main victims of these pollutants are
the inner-city low-income groups and their dam-ages become visible in a relatively short period Con-versely less weight may be given to policies aiming to abate global or regional air pollutants (such as CO
2)
This means policies aiming to improve environmental amenities that benefit and support the lifestyle of the rich receive less weight And this is more likely to be the case the more democratic is the political regime of a society
Education The last preference shifter under consideration is the education of the populace as proxied by the illiteracy rate for people greater than fourteen years of age At least one education term is significant in all of the emissions models though no significant correlation could be determined for ambient SO
2 The relation-
ships all follow the same pattern with illiteracy posi-tively correlated with emissions at relatively low levels of income but the marginal effect reversing sign at higher levels
Conclusions This article discusses the link between income per capita and environmental quality Recognizing that the often-cited ldquoinverted U-shapedrdquo relationship or EKC is not an inevitable result of income growth a
model was developed that specifically accounted for different environmental-policy regimes reflecting the demand for environmental quality as a public good
Results of the exercise support the hypothesis that the qualities of political institutions and several indi-cators of societal preference interact with each other to create the inverted-U shape which is frequently cited in the environment-development literature Estimates of individual effects for each of the included prefer-ence shifters support the hypothesis that more demo-cratic governments respond favorably to environmen-tal demands by the populace
For additional information on this subject the authors recommend the following sources
Dasgupta P Maumller K-G 1995 Poverty institutions and the environmental resource-base in Behrman J Srinivaan TN (Eds) Handbook of Development Economics Vol 3A Elsevier Science Amsterdam Chapter 39
Ecological Economics (1998) Special Issue on the Envi-ronmental Kuznets Curve 25 (2) 143-229
Grossman GM Krueger AB 1995 Economic growth and the environment Quarterly Journal of Economics 110 (2) 353-377
Lopez R Mitra S 2000 Corruption pollution and the Kuznets environment curve Journal of Environ-mental Economics and Management 40 (2) 137-150
Panayotou T 1997 Demystifying the environmental Kuznets curve turning a black box into a policy tool Environment and Development Economics 2 465-484
Persson T Tabellini G 2000 Political Economics Explaining Economic Policy The MIT Press Cam-bridge Massachusetts
Rivera-Batiz FL 2002 Democracy governance and economic growth theory and evidence Review of Development Economics 6 (2) 225-247
Y Hossein Farzin is a professor and CA Bond received his PhD in the Department of Agricultural and Resource Economics at the University of California Davis Professor Farzin can be contacted by telephone at (530)752-7610 or by e-mail at farzinprimalucdavis edu
8
Giannini Foundation of Agricultural Economics
Are International Beef Prices Converging and if so Whyby
Lovell S Jarvis Joseacute E Bervejillo and Joseacute P Cancino
Beef export prices have converged implying liberalization of commercial and sanitary policies in many trading nations and a more competitive international beef market
During the 1980s and 1990s the United States received higher average prices for its beef exports than did most of its competitors Howe-
ver during this period the average US beef export price was declining relative to the beef export prices of other countries This trend appears to be part of a process of convergence among beef export prices from different countries as is shown in figure 1 This paper reports the results of efforts to test whether beef prices did con-verge from 1980-2002 and if they did to determine why What forces are determining international market prices and are such forces affecting US export prices
The United States was one of the worldrsquos largest beef exporters until a case of BSE was found in the state of Washington nearly two years ago US beef exports then declined precipitously The United States is attempting to demonstrate the safety of its beef and hopes to regain an important share of international beef markets US producers must examine the market within which they will compete in the future We hypothesize that US beef export prices have been declining relative to the prices of other countries because major export markets for US beef have become increasingly competitive Sev-eral important beef importers that previously gave pref-erence to US beef liberalized their imports allowing other countries to compete directly with the US
In addition exports from Brazil and Uruguay expanded These countries traditionally excluded from important markets because of endemic Foot and Mouth Disease (FMD) gained access to additional markets After World War II countries with FMD were largely unable to export fresh beef to countries that were free of FMD The international beef market was thus seg-mented In one part trade occurred between export-ers and importers that were FMD-free In another part trade occurred between importers and exporters that were FMD-compromised ie FMD was endemic occurred fairly regularly or was controlled through vaccination Prices in the FMD-free market primarily the Pacific Rim countries including the United States Canada Japan Australia and New Zealand were gen-erally significantly higher than prices in the FMD-com-promised market which included the rest of the world
the European Union (EU) and the Southern Cone of South America as well as the Middle East Eastern Europe and parts of Asia However in recent years Brazil and Uruguay have increasingly controlled FMD while several importers that traditionally excluded beef from exporters with FMD have begun to accept such beef with specific restrictions
Methodology and Data Studies utilizing beef prices often assume that beef is a homogeneous commodity This was a more reason-able assumption in the 1960s when trade was predomi-nantly in carcasses Today almost all beef is exported as differentiated cuts with roughly 85 percent as boneless cuts To compare price trends it is important to cat-egorize beef cuts into more homogeneous products We utilize bone-in beef and boneless beef as the two qual-ity categories Beef sold as carcasses half carcasses and quarters are classified as bone-in beef as are a number of rather simple bone-in cuts most of which involve little value-added in processing Boneless cuts generally imply a higher degree of processing Using these two categories we apply two common tests of price conver-gence to the prices of 17 exporting countries that each accounted for at least one percent of the international beef market in 2002 Collectively they accounted for 90 percent of world beef trade Using annual data we cal-culate the implicit beef export price for each countryrsquos beef products by dividing the value of exports by the quantity of exports We deflate each price series using the US Producer Price Index (PPI) for all commodities We tested for price convergence from 1961 to 2002 and because important changes occurred in markets around 1980 for the period 1980 to 2002 We also tested for price convergence using monthly data for a subset of seven important exporters for 1990-2002
We defined price convergence as a shrinking diver-gence over time in the prices obtained by the principal beef-exporting countries We tested the hypothesis of convergence using two variations of an approach previ-ously published to analyze changes in price dispersion One test utilized the mean of the absolute price differ-entials and the other utilized the standard deviation of
9
Giannini Foundation of Agricultural Economics
Table 1 Tests for Convergence of Beef Export Prices
A Annual data
Group 1 (All 17 Exporters) 1961- 1980-2002 2002
Bone-in C C
Boneless C C
Group 2 (10 European Exporters)
Bone-in C C
Boneless C C
Group 3 (8 Largest exporters including EU as one exporter)
Bone-in NSC NSC
Boneless DNS DNS
Group 4 (2 FMD free and 2 FMD endemic exporters)
Bone-in C C
Boneless C C
B Monthly data
7-Major Exporters Jan 1990-Dec 2002
Bone-in C
Boneless C Notes The tests use 1) absolute price differentials (APD) and 2) standard deviations of price differentials (SD) C corresponds to price convergence with Plt10 for both tests NSC corresponds to no significance for APD test and convergence for SD test while DNS correspond to price divergence for APD test and no significance for SD test
absolute price differentials We fit a linear trend to each of the series of annual observations The null hypoth-esis was that the estimated trends would be negative reflecting a tendency for the mean or the standard deviation of the differentials to decline over time We applied each test to the prices of a) bone-in beef and b) boneless beef for each period analyzed We analyzed convergence for the entire set of countries and for sev-eral subsets to determine whether any of the results appeared sensitive to the particular set of countries chosen The country sets were Group 1 The 17 principal exporters Argentina Aus-tralia Austria Belgium-Luxembourg Brazil Canada Denmark France Germany Ireland Italy Netherlands New Zealand Poland Spain United States and Uru-guay Group 2 The European exporters from Group 1 Aus-tria Belgium-Luxembourg Denmark France Germa-ny Ireland Italy Netherlands Poland Spain Group 3 The eight largest exporters from Group 1 excluding Poland and taking the EU as a single country with intra-bloc trade excluded
Group 4 The four major grass-fed exporters Aus-tralia New Zealand Uruguay and Brazil The first two countries have always been FMD-free whereas Uruguay and Brazil have almost always been FMD-endemic This set probably provides the best test of convergence between the FMD segments
Results Table 1 part A contains results for the tests applied to the prices of boneless and bone-in beef using annual data for 1961-2002 and 1980-2002 for the four sets of countries In almost every case the results are consistent with price convergence
The results suggest that price convergence occurred for all exporters taken together (Group 1) for the European exporters (Group 2) and for the matched set of FMD-free and FMD-endemic exporters (Group 4) in each case for bone-in and boneless beef and in both periods except for Group 4 which was not significant The prices of the largest exporters (Group 3) also show convergence for the prices of bone-in beef in both periods when the test uses the standard deviations of price differentials but not when the test uses the mean of the absolute price differentials When the same tests are applied to the prices of boneless beef the results from both tests support divergence in 1961-2002 and indicate a constant trend in 1980-2002 Note particularly that the prices in a matched set of FMD-free and FMD-endemic country
prices (Group 4) show convergence for both types of beef and in both periods except in one case which is insignificant Thus there is evidence that the price differential attributed to FMD has shrunk
Table 1 part B contains the results for the tests car-ried out using monthly data for 1990-2002 for Group 3 (excluding Argentina for which monthly data were not available) again for both bone-in and boneless beef The results provide strong evidence of price convergence for bone-in and boneless beef in 1990-2002 The use of annual data for 1990-2002 produced highly similar results with and without the inclusion of Argentina It seems clear that the tendency toward price conver-gence was strong throughout the 1990s
Why Have Prices Converged We believe that price convergence has been caused prin-cipally by 1) changes in commercial policy following the Uruguay Round 2) the erosion of the price penalty traditionally faced by beef-producing countries with endemic FMD and 3) the industryrsquos shift toward the
10
$M
etri
c T
ons
Giannini Foundation of Agricultural Economics
export of cuts instead of carcasses Historically Figure 1 Export Price of Fresh Beef Major Exporters beef trade has been strongly influenced by tar- 1961-2002 iffs quotas and other forms of commercial
9000 policy The last two decades have witnessed
8000 considerable liberalization in import quotas
7000 and a reduction of export subsidies by the 6000 EU The liberalization of commercial policy is
1961
2001
1999
1997
1995
1993
1991
1989
1987
1985
1983
1981
1979
1977
1975
1973
1971
1969
1967
1965
1963
probably a factor in the observed convergenceEcircof beef export prices and as such probablyEcircimplies significant global welfare gains in thisEcircimportant commodity marketEcirc
5000
4000
3000
2000 Qualitative analysis indicates that the great-
1000 est divergence among market prices at theEcirc0beginning of the period was the result of sev-
eral exporting countries having preferentialEcircaccess to several strongly protected marketsEcirc Germany US Australia Uruguay Argentina
For example the United States emerged as an important beef exporter largely in response to the preferential access it received in the Japanese and then the South Korean markets The United States received prices in these protected markets that were higher than it could have received in other markets However as Japan and South Korea liberalized their markets imports from Australia and New Zealand competed more strongly with US imports gradually driving down prices to more closely approximate prices in less-protected markets (Figure 1) Similarly the EUrsquos deci-sion to reduce the magnitude of its subsidies on beef exports to the ldquoAtlanticrdquo market gradually raised the average EU export price
Although FMD continues to segment the world beef market its effect appears to be decreasing Some pro-ducing countries have increasingly brought FMD under control Simultaneously greater scientific knowledge has shown that properly processed boneless beef from FMD-endemic countries poses little risk of contamina-tion On the basis of such evidence the EU altered its sanitary policy from that of ldquozero tolerancerdquo in which beef from FMD-endemic countries was strictly prohib-ited to one of ldquominimum riskrdquo in which properly pro-cessed deboned beef was accepted During the Uru-guay Round numerous other countries including the United States and Canada agreed to base their sani-tary policies on science-based information As a result these countries also began to import beef from export-ers with FMD provided that the beef had been prop-erly processed and deboned
The shift toward the disassembly of the carcass in the exporting country and the associated export of cuts instead of carcasses also allowed exporters to arbitrage
beef more effectively across markets domestically and internationally particularly within the context of declining trade restrictions Exporters who were previously restricted to selling carcasses to lower-priced markets can sell lower-quality cuts to these markets while selling higher-priced cuts to higher-priced markets Although this process is little studied we believe it also contributed to price convergence
Although world beef trade remains impeded by FMD and commercial policies such barriers have dimin-ished in the last two decades bringing economic ben-efit to producers and consumers of beef In the process US producers have lost some of the preferential ben-efits they once enjoyed and face greater competition in the United States and in international markets in the future Nonetheless US beef exports continued to rise over the period of price convergence that we have ana-lyzed at least until many foreign markets were closed following discovery of a case of BSE We may therefore expect that as foreign markets become persuaded that US beef is safe US beef will continue to be competi-tive in international markets
Adapted from Jarvis LS JP Cancino and JE Berve-jillo (2005) ldquoInternational Beef Prices Is There Evidence of Convergencerdquo Review of Agricultural Economics 27(3)1-7
Lovell Jarvis is a professor in the ARE department and an associate dean in the College of Agricultural and Environmental Sciences at UC Davis He can be reached by e-mail at lsjarvisucdavisedu Joseacute Bervejillo was an assistant project scientist in the Agricultural Issues Center and is now a rancher in Uruguay He can be reached at jeberveyahoocom Joseacute Cancino is a PhD candidate in the ARE department at UCD and can be reached at jpcancinoucdavisedu
11
Giannini Foundation of Agricultural Economics Update Co-Editors Steve Blank Richard Sexton David Sunding and David Zilberman Managing Editor and Desktop Publisher Julie McNamara
ARE Update is published six times per year by the University of California Giannini Foundation of Agricultural Economics Domestic subscriptions are available free of charge to interested parties
To subscribe to ARE Update by mail contact Julie McNamara Outreach Coordinator Visit our Web site at Department of Agricultural and Resource EconomicsUniversity of California httpgianniniucopedu One Shields Avenue Davis CA 95616 E-mail julieprimalucdaviseduPhone 530-752-5346 To receive notification when new issues of the ARE Update are available online submit an e-mail request to join our listserv to julieprimalucdavisedu Articles published herein may be reprinted in their entirety with the authorrsquos or editorsrsquo permissionPlease credit the University of California Giannini Foundation of Agricultural Economics ARE Update is available online at wwwageconucdaviseduoutreachareupdatephp
The University of California is an Equal OpportunityAffirmative Action employer
Department of Agricultural and Resource EconomicsUC Davis One Shields Avenue Davis CA 95616 3432
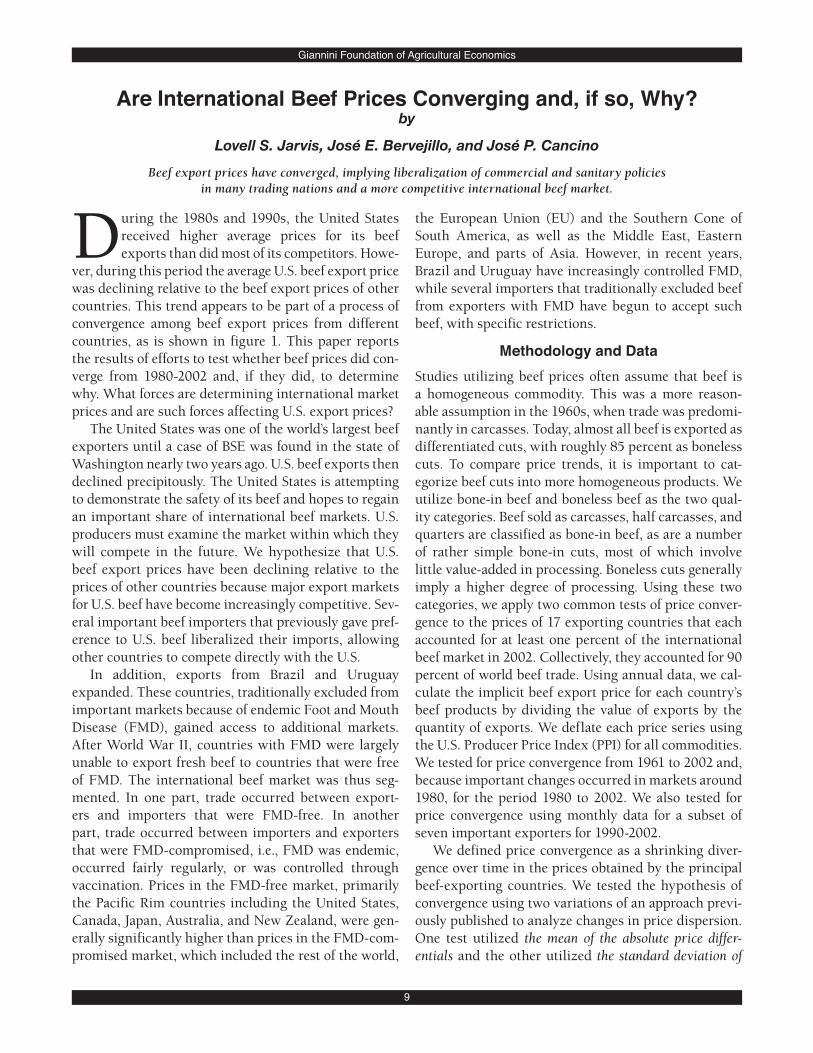
Giannini Foundation of Agricultural Economics
Table 1 Tests for Convergence of Beef Export Prices
A Annual data
Group 1 (All 17 Exporters) 1961- 1980-2002 2002
Bone-in C C
Boneless C C
Group 2 (10 European Exporters)
Bone-in C C
Boneless C C
Group 3 (8 Largest exporters including EU as one exporter)
Bone-in NSC NSC
Boneless DNS DNS
Group 4 (2 FMD free and 2 FMD endemic exporters)
Bone-in C C
Boneless C C
B Monthly data
7-Major Exporters Jan 1990-Dec 2002
Bone-in C
Boneless C Notes The tests use 1) absolute price differentials (APD) and 2) standard deviations of price differentials (SD) C corresponds to price convergence with Plt10 for both tests NSC corresponds to no significance for APD test and convergence for SD test while DNS correspond to price divergence for APD test and no significance for SD test
absolute price differentials We fit a linear trend to each of the series of annual observations The null hypoth-esis was that the estimated trends would be negative reflecting a tendency for the mean or the standard deviation of the differentials to decline over time We applied each test to the prices of a) bone-in beef and b) boneless beef for each period analyzed We analyzed convergence for the entire set of countries and for sev-eral subsets to determine whether any of the results appeared sensitive to the particular set of countries chosen The country sets were Group 1 The 17 principal exporters Argentina Aus-tralia Austria Belgium-Luxembourg Brazil Canada Denmark France Germany Ireland Italy Netherlands New Zealand Poland Spain United States and Uru-guay Group 2 The European exporters from Group 1 Aus-tria Belgium-Luxembourg Denmark France Germa-ny Ireland Italy Netherlands Poland Spain Group 3 The eight largest exporters from Group 1 excluding Poland and taking the EU as a single country with intra-bloc trade excluded
Group 4 The four major grass-fed exporters Aus-tralia New Zealand Uruguay and Brazil The first two countries have always been FMD-free whereas Uruguay and Brazil have almost always been FMD-endemic This set probably provides the best test of convergence between the FMD segments
Results Table 1 part A contains results for the tests applied to the prices of boneless and bone-in beef using annual data for 1961-2002 and 1980-2002 for the four sets of countries In almost every case the results are consistent with price convergence
The results suggest that price convergence occurred for all exporters taken together (Group 1) for the European exporters (Group 2) and for the matched set of FMD-free and FMD-endemic exporters (Group 4) in each case for bone-in and boneless beef and in both periods except for Group 4 which was not significant The prices of the largest exporters (Group 3) also show convergence for the prices of bone-in beef in both periods when the test uses the standard deviations of price differentials but not when the test uses the mean of the absolute price differentials When the same tests are applied to the prices of boneless beef the results from both tests support divergence in 1961-2002 and indicate a constant trend in 1980-2002 Note particularly that the prices in a matched set of FMD-free and FMD-endemic country
prices (Group 4) show convergence for both types of beef and in both periods except in one case which is insignificant Thus there is evidence that the price differential attributed to FMD has shrunk
Table 1 part B contains the results for the tests car-ried out using monthly data for 1990-2002 for Group 3 (excluding Argentina for which monthly data were not available) again for both bone-in and boneless beef The results provide strong evidence of price convergence for bone-in and boneless beef in 1990-2002 The use of annual data for 1990-2002 produced highly similar results with and without the inclusion of Argentina It seems clear that the tendency toward price conver-gence was strong throughout the 1990s
Why Have Prices Converged We believe that price convergence has been caused prin-cipally by 1) changes in commercial policy following the Uruguay Round 2) the erosion of the price penalty traditionally faced by beef-producing countries with endemic FMD and 3) the industryrsquos shift toward the
10
$M
etri
c T
ons
Giannini Foundation of Agricultural Economics
export of cuts instead of carcasses Historically Figure 1 Export Price of Fresh Beef Major Exporters beef trade has been strongly influenced by tar- 1961-2002 iffs quotas and other forms of commercial
9000 policy The last two decades have witnessed
8000 considerable liberalization in import quotas
7000 and a reduction of export subsidies by the 6000 EU The liberalization of commercial policy is
1961
2001
1999
1997
1995
1993
1991
1989
1987
1985
1983
1981
1979
1977
1975
1973
1971
1969
1967
1965
1963
probably a factor in the observed convergenceEcircof beef export prices and as such probablyEcircimplies significant global welfare gains in thisEcircimportant commodity marketEcirc
5000
4000
3000
2000 Qualitative analysis indicates that the great-
1000 est divergence among market prices at theEcirc0beginning of the period was the result of sev-
eral exporting countries having preferentialEcircaccess to several strongly protected marketsEcirc Germany US Australia Uruguay Argentina
For example the United States emerged as an important beef exporter largely in response to the preferential access it received in the Japanese and then the South Korean markets The United States received prices in these protected markets that were higher than it could have received in other markets However as Japan and South Korea liberalized their markets imports from Australia and New Zealand competed more strongly with US imports gradually driving down prices to more closely approximate prices in less-protected markets (Figure 1) Similarly the EUrsquos deci-sion to reduce the magnitude of its subsidies on beef exports to the ldquoAtlanticrdquo market gradually raised the average EU export price
Although FMD continues to segment the world beef market its effect appears to be decreasing Some pro-ducing countries have increasingly brought FMD under control Simultaneously greater scientific knowledge has shown that properly processed boneless beef from FMD-endemic countries poses little risk of contamina-tion On the basis of such evidence the EU altered its sanitary policy from that of ldquozero tolerancerdquo in which beef from FMD-endemic countries was strictly prohib-ited to one of ldquominimum riskrdquo in which properly pro-cessed deboned beef was accepted During the Uru-guay Round numerous other countries including the United States and Canada agreed to base their sani-tary policies on science-based information As a result these countries also began to import beef from export-ers with FMD provided that the beef had been prop-erly processed and deboned
The shift toward the disassembly of the carcass in the exporting country and the associated export of cuts instead of carcasses also allowed exporters to arbitrage
beef more effectively across markets domestically and internationally particularly within the context of declining trade restrictions Exporters who were previously restricted to selling carcasses to lower-priced markets can sell lower-quality cuts to these markets while selling higher-priced cuts to higher-priced markets Although this process is little studied we believe it also contributed to price convergence
Although world beef trade remains impeded by FMD and commercial policies such barriers have dimin-ished in the last two decades bringing economic ben-efit to producers and consumers of beef In the process US producers have lost some of the preferential ben-efits they once enjoyed and face greater competition in the United States and in international markets in the future Nonetheless US beef exports continued to rise over the period of price convergence that we have ana-lyzed at least until many foreign markets were closed following discovery of a case of BSE We may therefore expect that as foreign markets become persuaded that US beef is safe US beef will continue to be competi-tive in international markets
Adapted from Jarvis LS JP Cancino and JE Berve-jillo (2005) ldquoInternational Beef Prices Is There Evidence of Convergencerdquo Review of Agricultural Economics 27(3)1-7
Lovell Jarvis is a professor in the ARE department and an associate dean in the College of Agricultural and Environmental Sciences at UC Davis He can be reached by e-mail at lsjarvisucdavisedu Joseacute Bervejillo was an assistant project scientist in the Agricultural Issues Center and is now a rancher in Uruguay He can be reached at jeberveyahoocom Joseacute Cancino is a PhD candidate in the ARE department at UCD and can be reached at jpcancinoucdavisedu
11
Giannini Foundation of Agricultural Economics Update Co-Editors Steve Blank Richard Sexton David Sunding and David Zilberman Managing Editor and Desktop Publisher Julie McNamara
ARE Update is published six times per year by the University of California Giannini Foundation of Agricultural Economics Domestic subscriptions are available free of charge to interested parties
To subscribe to ARE Update by mail contact Julie McNamara Outreach Coordinator Visit our Web site at Department of Agricultural and Resource EconomicsUniversity of California httpgianniniucopedu One Shields Avenue Davis CA 95616 E-mail julieprimalucdaviseduPhone 530-752-5346 To receive notification when new issues of the ARE Update are available online submit an e-mail request to join our listserv to julieprimalucdavisedu Articles published herein may be reprinted in their entirety with the authorrsquos or editorsrsquo permissionPlease credit the University of California Giannini Foundation of Agricultural Economics ARE Update is available online at wwwageconucdaviseduoutreachareupdatephp
The University of California is an Equal OpportunityAffirmative Action employer
Department of Agricultural and Resource EconomicsUC Davis One Shields Avenue Davis CA 95616 3432
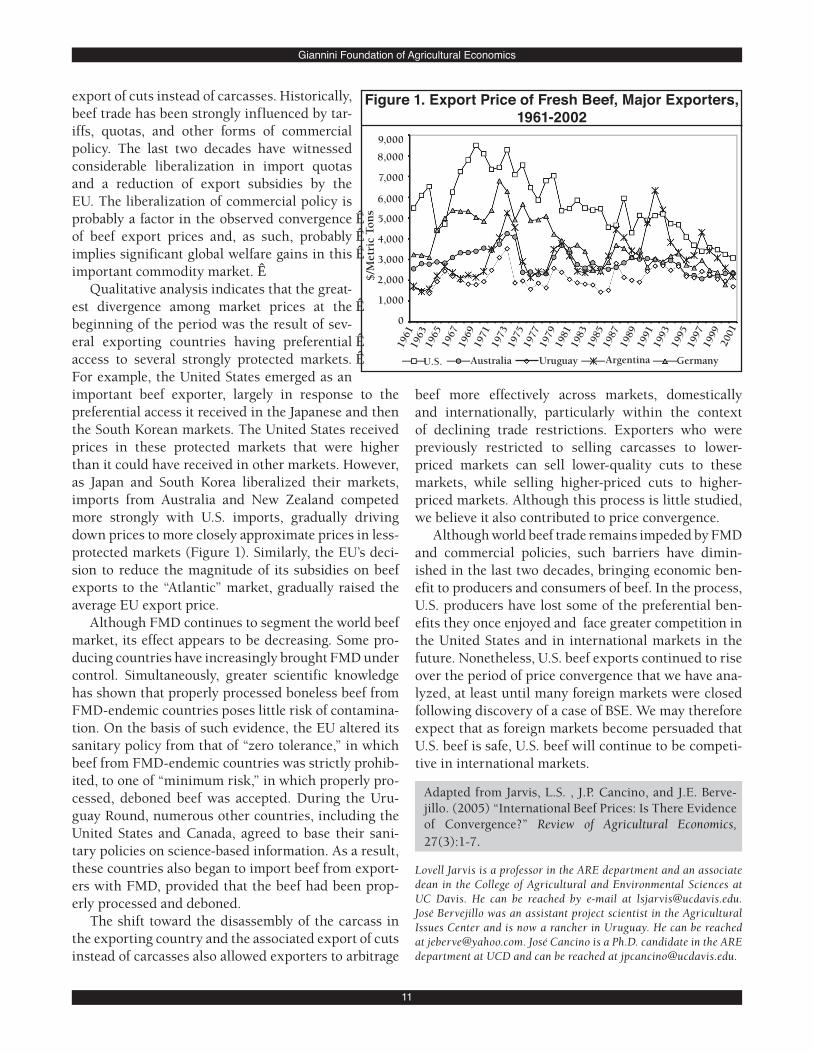