uws academic portal development of bi-polar plate design
TRANSCRIPT

UWS Academic Portal
Development of Bi-polar plate design of PEM fuel cell using CFD techniques
Awotwe, Tabbi Wilberforce; El-Hassan, Zaki; Khatib, F. N.; Al Makky, Ahmed; Mooney,James; Barouaji, Ahmad; Carton, James; Olabi, Abdul-GhaniPublished in:International Journal of Hydrogen Energy
DOI:10.1016/j.ijhydene.2017.08.093
Published: 05/10/2017
Document VersionPeer reviewed version
Link to publication on the UWS Academic Portal
Citation for published version (APA):Awotwe, T. W., El-Hassan, Z., Khatib, F. N., Al Makky, A., Mooney, J., Barouaji, A., ... Olabi, A-G. (2017).Development of Bi-polar plate design of PEM fuel cell using CFD techniques. International Journal of HydrogenEnergy, 42(40), 25663-25685. https://doi.org/10.1016/j.ijhydene.2017.08.093
General rightsCopyright and moral rights for the publications made accessible in the UWS Academic Portal are retained by the authors and/or othercopyright owners and it is a condition of accessing publications that users recognise and abide by the legal requirements associated withthese rights.
Take down policyIf you believe that this document breaches copyright please contact [email protected] providing details, and we will remove access to thework immediately and investigate your claim.
Download date: 17 Sep 2019

1 | P a g e
Development of Bi-Polar Plate Design of PEM Fuel Cell Using CFD Techniques
Tabbi Wilberforce1, Zaki El-Hassan1, F.N. Khatib1, Ahmed Al Makky1, Jim Mooney1, Ahmad Barouaji2,
James G. Carton3,
Abdul-Ghani Olabi1
1. Institute of Engineering and Energy Technologies, University of the West of Scotland,
UK.
2. School of Engineering, Faculty of Science and Engineering, University of Wolverhampton, UK.
3. School of Mechanical & Manufacturing Engineering, Dublin City University, Dublin,
Ireland.
Abstract
This paper reviews the common existing designs of flow plates of fuel cells and suggests
modifications to some of them to help reduce the pressure drop in the flow channels. Pressure
drop is one of the factors that influence the overall performance of the cell both directly and
indirectly through interaction with other factors including water management in the cell.
The work uses computational fluid dynamics (CFD) to examine different design and study the
effect of varying the flow rate (i.e. velocity) on the pressure drop for each of the designs
modelled. Again, the designs are optimized by changing different parameters using ANSYS
CFX. Results showing the effects of the modifications on pressure drop in the various plates are
presented in this paper.
From the study of the various designs, a conclusion was drawn that a modification of fuel cell
designs in existence using a system similar to the diesel injection system design approach
reduced the pressure drop in the fuel cell as shown by the simulation results.
This reduction in pressure drop will contribute to the improvement of performance but it must be
stressed that other factors also contribute to the overall performance of the cell and reduction in
pressure drop alone is not a guarantee of better performance of a certain fuel cell design.
Key words: Fuel Cell, Pressure Drop, CFD, Flow Plate, Mesh, Design Optimization.
Introduction
A fuel cell is any device that transforms chemical energy directly into an electrical energy and
heat with high efficiency. They can also be described as batteries with flows of reactants in and

2 | P a g e
products out [1]. Fuel cells have quite a number of similarities with batteries but they differ in
some aspects as well. They are all electrochemical devices that generate energy directly from
electrochemical reaction between the fuel and the oxidant. Batteries are energy storing devices
with their maximum energy available determined by the amount of chemical reactants stored in
the battery. The reactants are usually built into the battery as well as being an energy conversion
device. Recharging a secondary battery regenerates the reactants. This occurs when energy is
being supplied to the battery. The fuel cell on the other hand is an energy conversion device that
produces electrical energy for as long as the fuel and oxidant are continuously supplied to the
electrodes [1].
Fig. 1: Basic comparison between a Fuel cell and a Battery [2]
Primary batteries often have their lifetime being limited because once the chemical reactants
stored in the battery runs out, the battery stops producing electricity. Again the lifetime of the
battery is also limited as slow chemical reactions occur in the battery when it is even not in
operation. A component in the battery that determines its life span is the electrode. This is
because the electrodes are also consumed during the electrochemical reaction process. The
reactants in fuel cells are often supplied in a continuous flow process and stored outside the fuel
cell. When there is constant supply of the reactants, fuel cells will continue to produce electricity.
Due to their sturdy and leak-proof construction, leakages do not usually occur in fuel cells to the
same extent as in batteries. When the fuel cell is not in operation, there is very little possibility of
corrosion occurring.
Comparing Fuel Cells to Heat Engines
The primary function of a heat engine is to convert chemical energy into electrical energy
through intermediate steps. The process of combustion helps to first convert the chemical energy

3 | P a g e
into thermal energy. The next step is for the heat engine to convert the thermal energy into
mechanical energy. The mechanical energy generated is then finally converted to electrical
energy with the help of an electric generator. Normally several devices are needed to execute
each step in order to finally generate the electricity. The maximum efficiency is limited by
Carnot theorem because the conversion process is based on a heat engine that operates between
low and high temperature. Moving parts are often involved in the process indicating possible
irreversibilites leading to decreased efficiencies and equipment wear with time. Maintenance
culture is highly important especially for the moving parts in order for the proper operation of the
mechanical components [1].
Fig. 2 Comparison between a fuel and Heat Engine/Generator [2]
Fuel cells do not have any moving parts hence their operations usually do not involve large
irreversibilites, equipment’s mechanical wear or unbearable noise. No moving parts mean they
are highly reliable when in operation. Maintenance cost is equally reduced making them the best
option for space and under water missions when long life is a priority. The electrochemical
processes in fuel cells are not governed by the Carnot principles hence high operating
temperatures are not necessary for achieving high efficiency. In addition, the efficiency of a fuel
cell is not strongly dependent on the operating power. It is their inherent high efficiency that
makes fuel cells an attractive option for a wide range of applications including road vehicle
power sources, distributed electricity and heat production and portable systems [3].
Advantages and disadvantages of fuel cells
Fuel cells have the potential for a high operating efficiency that is not a strong function of system
size. They also have a high scalable design with several types of fuel sources readily available.

4 | P a g e
Their environmentally friendly nature makes them the best of options in the energy generation
industry as they produce zero or near zero greenhouse emissions [4]. Fuel cells have no moving
parts hence very advantageous as there will be no wear, no vibrations and highly reliable
operations in general. Fuel cells provide nearly instantaneous recharge capabilities when
compared to batteries.
Unfortunately the advantages of fuel cells cannot be mentioned without considering their
disadvantages as well. Some major limitations of fuel cell systems are costs, the need for mass
produced pure hydrogen and its storage and delivery technology. In the event where pure fuel is
not used, fuel reforming technology needs to be taken into account. If the fuels other than pure
hydrogen are used, then fuel cell performance gradually decreases over time due to catalyst
degradation and electrolyte poisoning [5]. Some types of fuel cells in existence are; Alkaline fuel
cells (AFC), Direct Methanol fuel cells (DMFC), Phosphoric Acid Fuel cells and Proton
Exchange Membrane (PEM) fuel cells. PEM fuel cells generally have very high efficiency and
their impact on the environment is low as stated above. Possible use in transport as well as
stationary and portable applications of fuel cell technology is a clear indication of the future of
this useful energy generation medium.
Basic Operation of a fuel cell
The basic physical structure of a fuel cell consists of an electrolyte layer in contact with two
porous electrodes with both electrodes containing catalysts to speed up the electrochemical
processes. One electrode is negatively charged (anode) and the other electrode is positively
charged (cathode) as is shown in Fig. 1. Electrochemical reactions take place at the electrodes to
produce an electric current. The basic operation of the hydrogen fuel cell is the reverse situation
of the process of the electrolysis; the hydrogen and oxygen are recombining, and an electric
current is produced along with the water obtained. The overall reaction is described in the
following equation:
𝐻2(𝑔) + 12⁄ 𝑂2(𝑔) → 𝐻2𝑂(𝑙) + 𝐸𝑛𝑒𝑟𝑔𝑦 (1)

5 | P a g e
Fig. 3: Acid electrolyte fuel cell scheme [5]
It is possible to distinguish two main categories of fuel cells depending on the kind of electrolyte
used: acid electrolyte fuel cells and alkaline electrolyte fuel cells. In both types the overall
reaction is the same as shown in Eqn. 1, but the half reactions at each electrode are different. The
main difference between them is the charge carrier: a positive one for the first type, and a
negative one for the second type. At the anode of the acid electrolyte fuel cell the hydrogen gas
ionises releasing electrons and H+ ions (protons), while at the cathode oxygen reacts with
electrons arriving through the external circuit and H+ ions that are passing through the electrolyte
to form water. On the other hand in the alkaline electrolyte fuel cell, hydroxyl ions (OH−) are
made at the cathode and then they react at the anode with hydrogen releasing electricity and
producing water. At the cathode, oxygen reacts with electrons to produce new hydroxyl (OH−)
ions. Similarly in the alkaline electrolyte fuel cells to allow these reactions to proceed
continuously, the ions must be able to pass through the electrolyte whiles the electrons pass from
the anode to the cathode through the electric circuit [6].
Table 1 shows the different half-reactions for both alkaline and acid fuel cells.
TABLE 1. HALF REACTIONS OF ACID AND BASIC ELECTROLYTE FUEL CELLS (4)
Acid electrolyte Basic electrolyte
Anode reaction 𝐻2 → 2𝐻+ + 2𝑒− 𝐻2 + 2𝑂𝐻− → 2𝐻2𝑂 + 2𝑒−
Cathode reaction 1
2𝑂2 + 2𝐻+ + 2𝑒− → 𝐻2𝑂
1
2𝑂2 + 𝐻2𝑂 + 2𝑒− → 2𝑂𝐻−
Overall reaction 𝐻2 +
1
2𝑂2 → 𝐻2𝑂 𝐻2 +
1
2𝑂2 → 𝐻2𝑂

6 | P a g e
Fuel cells can also be categorized into different types based on the type of the reactant used (e.g.
hydrogen, methanol, methane, carbon monoxide and other organic substances, etc.); the
electrolyte type (acid or alkali, liquid or solid), and the operating temperature (low-temperature
fuel cells (120°C-150°C), intermediate temperature fuel cells (150°C-250°C), interim-
temperature fuel cells (250°C-650°C) and high-temperature fuel cells (over 650°C) [7]).
An overview of the main 14 different types of fuel cells has been made, and the main features are
shown in Table 2 and Table 3.

7 | P a g e
TABLE 2. MAIN FEATURES OF DIFFERENT TYPES OF FUEL CELLS: FUEL, CATALYST AND
ELECTROLYTE (4)
Fuel Catalyst Electrolyte
Low-Temperature
Proton Exchange
Membrane Fuel
Cells (LT-PEMFCs)
Hydrogen (H2)
Platinum supported on carbon Solid polymer membrane
(Nafion)
High-Temperature
Proton Exchange
Membrane Fuel
Cells (HT-PEMFCs)
Platinum-Ruthenium supported on
carbon
Nafion/PBI doped in phosphoric
acid
Phosphoric Acid
Fuel Cells (PAFCs) Hydrogen (H2) Platinum supported on carbon
Liquid phosphoric acid (H3PO4)
in silicon carbide (SiC)
Direct Methanol
Fuel Cells (DMFCs)
Liquid
methanol-water
solution
Platinum/Platinum-Ruthenium
supported on carbon
Solid polymer membrane
(Nafion)
Direct Ethanol Fuel
Cells (DEFCs)
Liquid ethanol-
water solution
Platinum/Platinum-Ruthenium
supported on carbon
Solid Nafion/Alkaline
media/Alkaline-acid media
Alkaline Fuel Cells
(AFCs) Hydrogen (H2) Nickel/Silver supported on carbon
Potassium hydroxide (KOH) in
water solution/Anion exchange
membrane (AEM)
Molten Carbonate
Fuel Cells (MCFCs) Methane
Nickel Chromium (NiCr)/Lithiated
nickel (NiO)
Liquid alkali carbonate
(Li2Co3/Na2CO3/K2CO3) in
Lithium aluminate (LiAlO2)
Solid Oxide Fuel
Cells (SOFCs) Methane
Nickel-YSZ composite/Strontium-
doped lanthanum manganite
(LSM)
Solid yttria-stabilized zirconia
(YSZ)
Proton Ceramic
Fuel Cells (PCFCs) Methane Nickel Protonic/Zirconia
Zinc-Air Fuel Cells
(ZAFCs) Zinc
Non-noble metal oxides (such as
manganese oxide - MnO2) Liquid alkalines

8 | P a g e
Direct Borohydride
Fuel Cells (DBFCs)
Sodium
borohydride
(NaBH4)
Gold/Silver/Nickel/Platinum
supported on carbon
Solid Nafion/Anion exchange
membrane (AEM)
Direct Formic Acid
Fuel Cells (DFAFCs)
Liquid formic
acid (HCOOH)
Palladium/Platinum supported on
carbon Solid Nafion
Direct Carbon Fuel
Cells (DCFCs)
Solid carbon
(coal, coke,
biomass)
Graphite or carbon-based
material/Strontium-doped
lanthanum manganite (LSM)
Solid yttria-stabilzed zirconia
(YSZ)/Molten carbonate/Molten
hydroxide
Enzymatic Fuel
Cells (BFCs)
Organic matters
(glucose) Biocatalyst supported on carbon
Ion exchange
Membrane/Membrane-less
Microbial Fuel Cells
(BFCs)
Any organic
matter (glucose,
acetate, waste-
water)
Biocatalyst supported on
carbon/Platinum supported on
carbon
Ion exchange Membrane
TABLE 3. MAIN FEATURES OF DIFFERENT TYPES OF FUEL CELLS: ELECTRICAL EFFICIENCY,
OPERATING TEMPERATURE AND CHARGE CARRIER (4)
Electrical
efficiency
Operating
Temperature
Charge
carrier
Low-Temperature Proton
Exchange Membrane Fuel Cells
(LT-PEMFCs)
40% - 60% 60°C - 80°C
Hydrogen Ion
(H+) (proton) High-Temperature Proton
Exchange Membrane Fuel Cells
(HT-PEMFCs)
50% - 60% 110°C-180°C
Phosphoric Acid Fuel Cells
(PAFCs)
36% - 45 % (85%
with cogeneration) 160°C - 220°C
Hydrogen ion
(H+) (proton)
Direct Methanol Fuel Cells
(DMFCs) 35% - 60% Ambient - 110°C
Hydrogen Ion
(H+) (proton)
Direct Ethanol Fuel Cells (DEFCs) 20% - 40% Ambient - 120°C Hydrogen ion
(H+) (proton)

9 | P a g e
Alkaline Fuel Cells (AFCs) 60-70 % Below zero - 230°C Hydroxyl ion
(OH)-
Molten Carbonate Fuel Cells
(MCFCs)
55% - 65% (85% with
cogeneration) 600°C-700°C
Carbonate ion
(CO3)2-
Solid Oxide Fuel Cells (SOFCs) 55% - 65% (85 % with
cogeneration) 800°C – 1000°C
Oxygen Ion (O2-
)
Proton Ceramic Fuel Cells
(PCFCs) 55% - 65% 700°C – 750°C
Hydrogen ion
(H+) (proton)
Zinc-Air Fuel Cells (ZAFCs) 30% - 50 % Below zero – 60°C Hydroxyl ion
(OH)-
Direct Borohydride Fuel Cells
(DBFCs) 40% - 50% 20°C – 85°C
Sodium ion
(Na+)
Direct Formic Acid Fuel Cells
(DFAFCs) 30% - 50% 30°C – 60°C
Hydrogen ion
(H+) (proton)
Direct Carbon Fuel Cells (DCFCs) 70% - 90% 600°C – 1000°C
Oxygen Ion
(O2-)
Enzymatic Fuel Cells (BFCs) 30% 20°C – 40°C Hydrogen ion
(H+) (proton) Microbial Fuel Cells (BFCs) 15% - 65% 20°C – 60°C
Principle of Operation of the Proton Exchange Membrane fuel cell
PEM fuel cell operates based on the principles of electrochemical reactions between hydrogen
(fuel) and Oxygen from air (oxidant) in the presence of a platinum catalyst [8]. Hydrogen fuel is
transported through field flow plates to the anode on one side of the cell while air provides
oxygen to the cathode on the other side of the cell. Once the hydrogen reaches the catalyst active
sites on the anode side, it breaks into positive hydrogen ions (protons) and negatively charged
electrons. The electrons and positively charged protons react with the oxygen at the cathode
forming water. The outlet serves as the exit for some of the water. Flooding of the fuel cell

10 | P a g e
occurs when some of the water generated remains in the fuel cell due to their inability to exit the
cell [9]. A schematic representation of a fuel cell with reactant/product gases and ion conduction
flow directions through the fuel cell is shown in Fig (4) and Fig (5).
Fig. 4: Exploded View of a Proton Exchange Membrane fuel cell.

11 | P a g e
Fig. 5 Schematic Diagram of PEM fuel cell [8]

12 | P a g e
The polymer membrane electrolyte allows only positive ions to pass through it to the cathode.
The negatively charged electrons then travels through an external circuit to the cathode, creating
an electric current [10, 11]. Membrane Electrode Assembly (MEA) and bipolar plates remain the
main component of PEM fuel cell. While the MEA serves as the platform for chemical reaction
to occur in the fuel cell, the bipolar plates take care of the transport of reactants (fuel and
oxidant) to the reactive sites of the MEA. This process immensely affects the general
performance of the fuel cell. Efficient distribution of fuel and the oxidant to the catalyst layer,
can increase the utilization of the catalyst, improve the water management through the cell and
provide effective collection of the produced current [12]. The MEA is made up of Proton
Exchange Membrane, an electrically conductive porous Gas diffusion layer (GDL) and an
electro-catalyst layer sandwiched between two flow plates. Graphite in recent times has been the
common used bipolar plates in fuel cells but they have weak mechanical strength and also
generally brittle. They are also expensive to machine [13]. Bipolar plates account for nearly 70%
of the volume and weight of the fuel cell stack. It also contributes to about 40% of the cost of the
fuel cell stack [13,14]. Metallic plates have recently arisen as the plate of choice for bipolar
plates. Low cost, easy to process, good mechanical strength, good electrical and thermal
conductivities are some of the advantages of using metallic plates. For effective distribution of
reactants evenly and better utilize the whole of MEA, flow channels are often machined on the
surfaces of the bipolar plates. These channels could be parallel, serpentine, pins, straight or
interdigitated [15-18]. Recent studies conducted by a number of researchers show that the flow
field design significantly affects the cell performance [19 - 25]. Poorly designed flow field can
cause inefficient water removal and hinder reactant transport. Manso et al [26] did a detailed
review on all the common types of flow plates and some of the drawback they identified was
large pressure losses, high cost of manufacturing and low mechanical strength resulting in
thicker plates which increase the weight and volume of the fuel cell. The flow channel(s) can
also lead to uneven distribution of the electrochemical reactants, which lead to irregular
utilization of the catalyst [27]. Open pore cellular foam (OPCF) material has recently been used
by a number of researchers around the world as alternative to the traditional flow field design
[28]. These open pore cellular foams provide better gas distribution throughout the fuel cell and
also there is pressure drop between the inlet and outlet [28, 29]. Using carbon foams as the gas
flow field has also been investigated [30]. Other researchers also reported in their findings that

13 | P a g e
flow field(s) with metal foam has impact on the performance of the PEM fuel cell [31]. They
thoroughly investigated the effect of the flow field designs on the performance of a PEM fuel
cell. They concluded that the flow field can play an active role in the design and development of
PEM fuel cells with either conventional or foam flow plates. Kumar and Reddy [32, 33] used
foam material in place of the channels of conventional flow plates. This retrofitting of a flow
plate is crude and will not allow the full benefits of OPCF materials to be exploited. With all
these advantages of using the OPCF, researchers still face challenges in relation to the housing
unit where the foam will be placed. This paper seeks to investigate a new housing unit for the
OPCF material and the data gathered about pressures, flow regimes and velocity profiles will be
analysed.
In conventional flow plates, the flow behaviour of oxygen and hydrogen inside the fuel cell and
through the flow plates can be effectively predicted and analysed by employing Computational
Fluid Dynamic (CFD) modelling tools and many researchers [34-36] employed CFD tools in
their studies to develop and optimize the bipolar flow plates.
Modelling and Simulations
ANSYS, Inc. is an engineering simulation software (computer aided engineering or CAE)
developer that makes use of CFD, FEM and some various types of programming algorithms for
simulation and optimization. Any project simulation conducted in ANSYS involves five steps for
the completion of the project (geometry creation, meshing, simulation setup, running the
calculations and post processing).
CFD programs are often used to predict the flow patterns and regimes, velocity profiles, and
pressure gradients in parts of the fuel cell components or through the full flow plates and flow
fields. The flow plates used in this study are designed to cover an active area of 25cm2. This is
basically the active area being used by the fuel cell. Some of the key parameters which are very
necessary to consider when designing a flow plate channel layout are the distribution of pressure
on the GDL and membrane, pressure drop in and through the flow plate, distribution of
temperature on the GDL and membrane, consistent reactant concentration over the whole active
area of the GDL and membrane, membrane hydration and mitigation of flooding.

14 | P a g e
Meshing Dependence
One of the key steps in the CFD simulation process is the creation of the mesh. The collection of
differential and algebraic equations that describe the process are solved (approximated) using
different techniques at these mesh elements. The meshing process breaks the domain in small
entities that constitute the mesh.
For a valid CFD simulation, the results obtained need to be independent of the mesh size or the
type of elements used and convergence studies are necessary to ensure this.
The size of the mesh and grid elements types can be modified by using the controls of the
meshing engine of ANSYS.
In this study and since the channels are mostly straight, a representative element is used to carry
out the convergence studies.
Simulations were run to examine the dependency of the pressure drop results on the mesh for
several values of the gas flow velocity in the straight representative channel.
Mesh 1
The first mesh tried was done for a channel like design which was 100mm in length and 20 mm
in width with appropriate thickness. The mesh as shown in Fig. 6 was created using automatic
meshing method. The size function was set to proximity and curvature and the relevance centre
was left at the coarse setting. The transition was set to slow. These setting resulted in 1,760
nodes and 1,161 elements.
Figs. 7a and 7b show the velocity profile and pressure drop for the mesh through the horizontal
channel depicting the porous fluid domain in the fuel cell
Fig. 6: 3 -D Straight channel model.

15 | P a g e
Fig. 7a: Numerical simulation results - Pressure distribution (Pa)
Fig. 7b: Numerical simulation results – Velocity (m/s)
From the simulation result, the pressure drop from the inlet to the outlet is fairly even with an
increase in velocity of the gas from the inlet to the out.
Fig. 8 Shows a plot of the average pressure drop through this flow channel with some selected
velocities (1, 3, 6, 9 and 12 m/s) already used in literature.

16 | P a g e
Fig. 8: Plot of Velocity against pressure drop through the representative channel
Mesh 2
The second mesh in the same manner but using tetrahedron elements and the patch conforming
method. The size function was maintained at proximity and curvature and the relevance centre
was maintained on the coarse setting. The transition setting was “slow”. These settings resulted
in 2,156 nodes and 9391 elements.
Fig. 9: 3-D Straight representative channel model for mesh 2
0
2
4
6
8
10
12
0 2 4 6 8 10 12 14
Pre
ssu
re d
rop
(P
a)
Velocity (m/s)

17 | P a g e
The velocity profile and pressure drop for mesh design 2 for the horizontal channel is shown in
Figs. 10a and 10b. It can be seen that increasing the number of mesh elements resulted in a better
resolution of the pressure drop contour as well as the velocity pressure contour. The pressure
drop again is evenly distributed with the velocity profile showing signs of high velocity at the
inlet and low velocity at the outlet. Fig. 11 also shows a plot of the average of the various
selected velocities against the pressure drop.
Fig.10a: Numerical simulation results - Pressure distribution (Pa)
Fig. 10b: Numerical simulation results – Velocity (m/s)

18 | P a g e
Fig. 11: Plot of Velocity against pressure drop through the representative channel
Mesh 3.
The same approach was followed for the geometry but the settings of the meshing engines were
modified. Again tetrahedron elements were created using the patch conforming method as shown
in Fig. 12.
Fig. 12: 3 -D Straight representative channel model for mesh 3
0
1
2
3
4
5
6
7
8
9
0 2 4 6 8 10 12 14
Pre
ssu
re d
rop
(P
a)
Velocity (m/s)

19 | P a g e
Proximity and curvature were used for the size function, the relevance centre was kept on the
coarse setting and the transition was kept on low. Figs. 13a and 13b show the velocity profile and
pressure drop through the representative geometry. Fig. 14 shows the plot of the velocity of the
fluid against the pressure drop. This mesh gives very low values for the pressure. +
Fig. 13a: Numerical simulation results - Pressure distribution (Pa)
Fig. 13b: Numerical simulation results - Velocity(m/s)

20 | P a g e
Fig. 14: Plot of Velocity against pressure drop through the representative channel.
Mesh 4
The fourth mesh was created used most of the previous setting with the relevance centre set to
“fine”. The transition was set to “slow”. This resulted in 20,816 nodes and 106,883 elements as
depicted in Fig. 15.
Fig. 15: 3 -D Straight channel model for mesh 4
A mush better resolution was obtained for both the pressure and the velocity fields than in the
previous three attempts. Results are shown in Figs. 16a, 16b and 17.
0
2
4
6
8
10
12
14
0 2 4 6 8 10 12 14
Pre
ssu
re d
rop
(P
a)
Velocity (m/s)

21 | P a g e
Fig. 16a: Numerical simulation results - Pressure distribution (Pa)
Fig. 16b: Numerical simulation results - Velocity (m/s)

22 | P a g e
Fig. 17: Plot of Velocity against pressure drop through the channel.
0
2
4
6
8
10
12
0 2 4 6 8 10 12 14
Pre
ssu
re d
rop
(P
a)
Velocity (m/s)

23 | P a g e
Fig. 18 is a comparison between the various mesh designs considered through the simulation
process and hence a conclusion was draw that maintain the element as high as possible was
going to give an idea of the pressure drop that would occur for each of these elements as the fluid
flows through the domain.
Fig. 18: A plot comparing the various mesh designs considered during the simulation process.
Once the mesh was carefully studied and validated, the rest of the modifications to be made on
the existing flow plates were simulated in CFD with finely divided grid. This helps improves the
resolution and gives better prediction of the pressure drop that occurs through the selected fluid
domain.
The next stage of the simulation process was to run some simulations for the flow plate designs
used in the making of fuel cell on the market and those covered the literature. This was to give an
idea of the likely pressure drop through these flow plates. Once these values were determined,
another simulation process was conducted but this time with the modified designs. Finally both
designs were compared with each other and the best option was selected.
0
2
4
6
8
10
12
14
16
0 2 4 6 8 10 12 14
Pre
ssu
re d
rop
(P
a)
Velocity (m/s)
Comparing the various Mesh designs
mesh1 Mesh 2 Mesh 3 mesh4

24 | P a g e
Serpentine flow plate
The serpentine flow plate design in fuel cells has been investigated by several researchers around
the world [20] and it is considered as the standard for flow design in most fuel cells. Several
companies use this design as their main flow plate design in manufacturing of PEM fuel cells
because it supports the full usage of the active area and coverage of gas at reasonable pressure
losses. Fig. 19 shows a typical design of a serpentine flow plate used in fuel cells.
Fig 19: Typical Serpentine Flow Plate Design in a Fuel Cell.
The double serpentine channelled flow plate with ribs and channels 1mm wide and 1mm deep as
shown in Fig.19 is the most commonly used configuration. This flow plate design was first
modelled in solid works then analysed using ANSYS CFD (CFX) to develop proper
understanding of its operation and gain the necessary knowledge for subsequent design
modifications.
The simulations were done to develop an understanding of fluid flow in the plates and the results
obtained corresponded with what existed in literature such as the works of Carton et al [1]. The
main design issues were identified and this knowledge contributed to the modified design of the
new serpentine fluid flow plates. Table 4 shows the simulation parameters and the properties
used.

25 | P a g e
Table 4. Simulation parameters used throughout the entire simulation
Modeller ANSYS DM
Mesher
Mesh
Sizing
Smoothing
Transition
Elements
Solver
Model flow
Fluid
Solid walls
Porosity
Inlet Velocity
Temperature
Porous GDL
Monitors
Interfacial area density
Heat transfer coefficient
Iteration
Solver type
ANSYS Meshing
Mixed Tet and Quad
Proximity and Curvature
Coarse
Slow
316,853
CFX
Laminar
Hydrogen
Aluminium
0.90
10m/s
288
0.90
Mass flow Continuity
0.50
0.01
100
Pressure based – Double precision
Serpentine Design Simulation
As explained earlier, this design supports the flow of the gas through almost all the entire surface
of the MEA. From the simulation results in Fig. 20a, it is observed that there is high inlet
pressure on the first inlet channels. This pressure gradually drops from the inlet to the outlet, a
clear indication that the pressure within the MEA decreases from inlet to the outlet as expected.
The mass transport and the general performance of the fuel cell are governed by these

26 | P a g e
characteristics of the PEM fuel cell. Fig. 20a shows that there is an even distribution of the
velocity field of the fluid (hydrogen and air) throughout the entire flow plate and the flow covers
the full area of the MEA being supplied with the gas (hydrogen or air). The serpentine flow plate
design ensures a constant flow of the fluid through the channels and this in effect helps remove
any excess liquid that may condense in the fuel cell such as water that may block the channels by
transporting it to the outlet easily. A boundary layer is observed at the channel walls with water
often accumulating near the wall creating annular gas flow. The blue region on the pressure
simulation shown in Fig. 20b indicates a region of possible dead zones. This indicates areas
within the channel where the gas might not be in contact with the membrane and this indicates
the need for modification of this design.
Fig. 20a: Numerical simulation results of Serpentine flow plate - Pressure distribution (Pa)

27 | P a g e
Fig.20b: Numerical simulation results of Serpentine flow plate - Velocity vectors (m/s)

28 | P a g e
Parallel flow plate design
Another design that is considered as a standard and used in the industry is the parallel flow plate.
Simulation was performed on this design with some key parameters carefully analysed during
the simulation process. The removal of water and an even distribution of the gas throughout the
plate flow area to fully utilise the gas diffusion layer (GDL) were carefully considered. The
design should be able to improve pressure distribution throughout the flow plate because all the
channels would have equal access to the input gas channel as shown in Fig. 21.
Fig. 21: Parallel flow plate design
The design aims to improve the pressure distribution throughout the plate flow area because all
the channels (1mm wide and deep) would have the same access to the input gas.
The pressure distribution as shown Fig. 22a indicates high pressures in the inlet region, low
pressures at the outlet region as expected. Channels nearer to the dead end of the inlet zone
develop high pressure drops compared with those further away. This was a major driver for the
modification which will be shown later.

29 | P a g e
On the other hand, Fig. 22b shows an even velocity distribution throughout the plate flow region
indicating that the differences observed in the pressure contour are not strong enough to affect
the flow in the channels appreciably.
Fig.22a: Numerical Simulation Results of Parallel Flow Plates - Pressure distribution (Pa)

30 | P a g e
Fig.22b: Numerical Simulation Results of Parallel Flow Plates - Velocity (m/s)

31 | P a g e
Pin Flow Plate Design
The Pin flow plate design in literature was modified using the same injector design. The common
design of the Pin flow in literature has 2 mm pin embedded in the plate. The purpose of these
pins is to help in the distribution of the fluid uniformly through the flow plate and also ensure
large contact area with the MEA.
Figure 23: Pin flow plate design
The pressure distribution through the pin flow plate shown in Fig. 24a indicates a lower pressure
drop with a plate gauge pressure of 16 Pa on the inlet side and a gauge pressure of 3 Pa on the
outlet side. However, the velocity profile, Fig. 24b shows a velocity of 1.7m/s at the plate inlet
side which is low compared to other designs.

32 | P a g e
Fig.24a: Numerical simulation results of Pin flow plates - Pressure distribution (Pa)

33 | P a g e
Fig.24b: Numerical simulation results of Pin flow plates - Velocity (m/s)

34 | P a g e
Interdigitated flow plate design
The interdigitated flow plate is one of the designs in the literature [3] which has not yet been
explored by researchers to a larger extent. The design is often a dead end with several ribs and
channels. It implies that the gases are forced through the GDL when it enters the inlet flow field.
It then leaves the GDL exits the flow plate.
Fig 25 shows a diagram of interdigitated flow field design. The plate is expected to develop high
pressure drop due to the large separation losses at the end of the individual channels.
Fig. 25: Interdigitated flow field design.

35 | P a g e
Modified design for serpentine flow plate with 2 bypass channels
This design was modelled out of the serpentine design described in the literature. The inlet of
the design is some few millimetres away from a gap that leads to the mid region of the flow plate
where the MEA is found. The left and right side of the design have bypass channels where the
gas can travel through to the outlet. The mesh was generated using tetrahedron elements with the
patch conforming algorithm.. A fine mesh was produced with 200,764 nodes and 938590
elements as shown in Fig. 26.
Fig. 26: Meshing of modified serpentine flow plate design
Fig. 27a shows the pressure contours for the modified design. Increasing the gap at the inlet will
increase the amount of gas flowing at the mid region.

36 | P a g e
`
Fig. 27a: Numerical simulation results of the modified Serpentine flow design with 2 by pass
channels - Pressure distribution (Pa)

37 | P a g e
Fig. 27b: Numerical simulation results of the modified Serpentine flow design with 2 by pass
channels- Velocity (m/s)
Fig. 27b shows the velocity contours in the modified cell. From the simulation results it is clear
that appreciable gauge pressure develops to enable the gases to move through the channels to the
discharge point which is at atmospheric pressure as shown in Fig 27a. The velocity of the gas
flowing through the channels is slightly lower than the velocity in the original design due to

38 | P a g e
enlarged channel width (Fig. 27b). This will be of benefit as it increases the reactants residence
time in the cell leading to higher conversion rates.
Modified Serpentine flow plate design with 4 bypass channels
It has been stated earlier that serpentine flow plates have large pressure drops but better
performance characteristics than that of the parallel flow plate designs which operate with lower
pressure drops. This design is therefore a combination of both the serpentine and the parallel
flow channels to achieve a better performance resulting from the presence of the serpentine
channel portion and at the same time ensure overall lower pressure drop due to the parallel
bypass channels.
From Fig. 28a, the inlet gauge pressure of the modified serpentine with 4 bypass channel is 34 Pa
with a total pressure drop of 32 Pa. There is consistent and even pressure drop from the inlet to
the outlet and this design will equally help in water management. Existence of bypass channels
ensures that for a series connection, blockage in the serpentine channel length will not hinder the
flow through the other series connected flow plate in the fuel cell. Also, the possibility of dead
zones or water accumulation is reduced due to the nature of the design. Water can easily flow
through the channel from the inlet to the outlet reducing the possibility of flooding hence
improving the water management of the cell.

39 | P a g e
Fig. 28a: Numerical simulation results of the modified Serpentine flow design with 4 by pass
channels - Pressure distribution (Pa)

40 | P a g e
Fig. 28b: Numerical simulation results of the modified Serpentine flow design with 4 by pass
channels - Velocity (m/s)

41 | P a g e
Modification of the Parallel flow plate design
Modification Approach
The main concept is to symmetrically align the inlet and outlet and to create a temporal storage
section right on top of the flow channels before the gases are distributed through the channels in
a process similar to the concept used in diesel injection systems. This temporal area aid in the
uniform distribution of the gases though the flow rates likely to be experienced within the mid
region directly opposite to the feed point will be greater. Fig. 29 shows the funnel-like conical
shape design that will be integrated into the design.
Fig. 29: Temporal conical shape storage design right on top of the channel designs
With the exception of this modification of the inlet area, the design is almost the same as the
usual parallel design. The major modification is at the inlet and outlet where the gas is allowed to
develop a more even inlet pressure field over the channels inlet points to provide uniform
pressure drops and velocity profiles in all the parallel channels.. The design aids in the easy
removal of water that may be formed in the channels and also support the even distribution of the
gases through these channels.
The mesh used in this simulation is a fine grid of 7,602,020 elements as shown in Fig. 30.

42 | P a g e
Figure 30: 3-D Straight channel model for meshing of the modified Parallel flow plate.
The pressure distribution profile shown in Fig. 31 indicate that the modified parallel flow plate
has a high inlet pressure of 36 Pa and an outlet pressure of 2 Pa with a more uniform pressure
distribution throughout the plate. The velocity contour shows uniform velocities in the channel
because of the modifications implemented in the flow plate design when compared with the
traditional parallel flow plate design.

43 | P a g e
Fig.31a: Numerical simulation results of Parallel flow plates - Pressure distribution (Pa)

44 | P a g e
Fig.31b: Numerical simulation results of Parallel flow plates - Velocity (m/s)
45 | P a g e
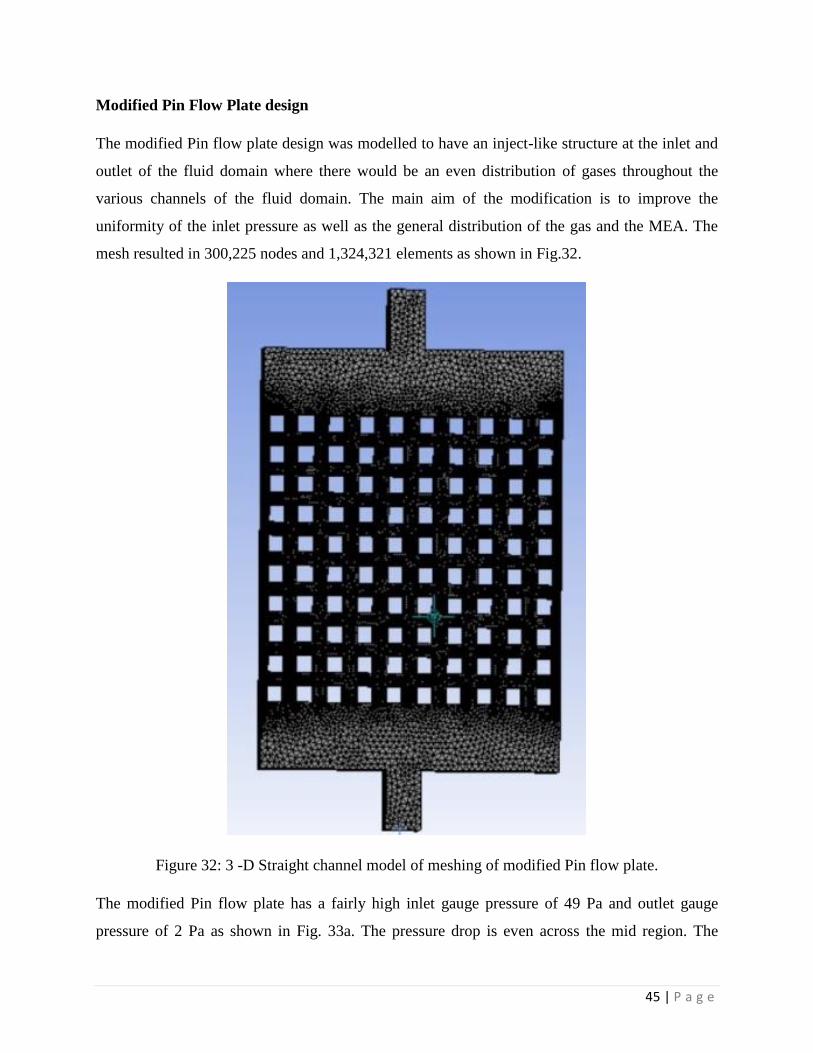
Modified Pin Flow Plate design
The modified Pin flow plate design was modelled to have an inject-like structure at the inlet and
outlet of the fluid domain where there would be an even distribution of gases throughout the
various channels of the fluid domain. The main aim of the modification is to improve the
uniformity of the inlet pressure as well as the general distribution of the gas and the MEA. The
mesh resulted in 300,225 nodes and 1,324,321 elements as shown in Fig.32.
Figure 32: 3 -D Straight channel model of meshing of modified Pin flow plate.
The modified Pin flow plate has a fairly high inlet gauge pressure of 49 Pa and outlet gauge
pressure of 2 Pa as shown in Fig. 33a. The pressure drop is even across the mid region. The

46 | P a g e
velocity profile in Figure 33b shows an outlet velocity that is higher than the inlet velocity due to
the volumetric expansion of the gas as the pressure drops. It can also be seen that the low
velocity regions formed during the simulation for the modified pin flow plate are smaller
compared with the traditional pin flow plate. These low velocity regions are often the dead zones
that lead to the accumulation of water which in turn affects the general performance of the fuel
cell. The modified plate will therefore increase the efficiency of the fuel cell when compared to
the traditional fuel cell.
Fig.33a: Numerical simulation results of Pin flow plates - Pressure distribution (Pa)

47 | P a g e
Fig.33b: Numerical simulation results of Pin flow plates - Velocity (m/s)

48 | P a g e
Further modification of the Pin flow plate: Maze flow plate design
The main goal of this design is to reduce the dead zones inside the plate as gases flow through it.
It was also designed with the intension of maximising contact with the gas diffusion layer to
reduce the possibility of ohmic resistance and provide improved water removal from the plate
while maintaining even gases distribution and pressure against the GDL. A central divergence
obstacle was introduced within the central portion of the cell as shown in Fig. 34 during the
design phase to improve the distribution of the fluid and to address the need for large contact
area. There is the possibility of heat build-up in the central region and consequently this design
will work efficiently in single cells with the central contact area increased but it will be very
difficult to create a bipolar version of the plate due to the difficulties involved in removing the
heat generated.
The mesh created for this simulation included 259503 nodes and 1241691 elements as shown in
Fig. 35.
Figure 34: Maze flow design

49 | P a g e
Figure 35: 3-D Straight channel model for meshing of maze flow plate design.
As expected, the outer flow channel can be seen to have a higher pressure compared to that of
the inner channel, Fig. 36a. The pressure difference between these channels is what would
eventually drive the water droplet that will be formed in the fuel cell out. There is a large
pressure drop from the inlet to the outlet but this pressure is not evenly distributed within the
flow field. This will have a negative impact on the general performance of the fuel cell with non-
uniform performance over the catalyst area. Some of these impacts are dehydration of the
membrane and GDL which will finally lead to the damage of the MEA.

50 | P a g e
Fig.36a: Numerical simulation results of Maze flow plates - Pressure distribution (Pa)

51 | P a g e
Fig.36b: Numerical simulation results of Maze flow plates - Velocity (m/s)
The velocity distribution within the flow field is shown in Fig. 36b which indicates that the fluid
is flowing uniformly within the mid region of the plate. The inlet region has a gap included in the
design to promote even distribution of the gases throughout the central part of the design.

52 | P a g e
Optimisation of modified flow plates designs
As already indicated earlier, the main purpose of this work is the consideration of one aspect of
the performance characteristics of fuel cells which is the pressure drop in the flow channels.
Previous figures showed the pressure contours for different flow plate designs of commonly used
cells and also the corresponding pressure contours for the modified designs. Figs. 37 to 40 show
the effect of flow rate or velocity on the pressure drop in the flow channels of the suggested
modified designs. Comparing this with simulation and published data it can be demonstrated that
all modified designs resulted in lower pressure drops than the respective original designs for the
selected velocity ranges.

53 | P a g e
Pressure drop profile for Serpentine flow plate channel designs
Fig. 36 shows the pressure drops for serpentine channel, modified serpentine plate with 2 bypass
channels and the modified serpentine plate with 4 bypass channels over a range of velocities. It
can be seen that the modified serpentine designs has significantly lower pressure drop,
approximately 50 times lower than that of the traditional serpentine design. It can also be
observed that introducing 4 bypass channels instead of 2 bypass channels in the modified
serpentine design, reduces the pressure drop by over 50%. At 12m/s the pressure drop is
approximately 30Pa for 4 bypass channels serpentine design and that of 2 bypass channels
serpentine design is 100Pa showing massive difference between the two designs.
Fig. 37: A plot of velocity against pressure drop for traditional and modified serpentine flow
plate designs

54 | P a g e
Pressure drop profile for parallel flow plate designs
The pressure drop profile from Fig. 38 shows the effect of the modified parallel channel design
compared with the traditional parallel design. The pressure drop for the traditional parallel design
is 90 Pa at a velocity of 12 m/s whiles that of the modified design is 15 Pa. This huge difference
is due to the diesel injection-like design introduced at the inlet and outlet of the traditional
parallel design as shown in Fig. 29. This modification allows the gas to flow more uniformly
through the channels avoiding the development of high pressure region near the dead end of the
gas feed region.
Fig. 38: A plot of velocity against pressure drop for parallel and modified parallel flow plates

55 | P a g e
Pressure drop profile for modified Pin and Maze flow plate designs
From Fig. 39, the pressure drop for the modified pin flow plate design was less compared to the
new maze flow plate design. The pin flow plate design will be a better option to improve the
performance of the fuel cell with respect to pressure drop compared to the maze design for the
whole velocity range as shown in the Fig. 39.
Fig. 39: A plot of velocity against pressure drop for modified Pin flow plates

56 | P a g e
Pressure drop profile for all modified flow plate designs
Fig. 40 shows the comparison of pressure drop profiles for the different modified flow plate
designs. As expected the modified serpentine design with the 2 bypass channels developed
higher pressure drop compared with the rest of the modified designs. It is also observed that the
modified parallel and pin flow channel designs displayed the lowest pressure drops for the
5cm x 5cm plates. The implication of this is that the two designs may result in reduced
construction and compression costs, but the overall performance improvement will be a
combination of the effect of the pressure drop as well as other factors such as temperature,
humidity, stoichiometry, etc.
Fig. 40: A plot of velocity against pressure drop for all modified flow plate designs

57 | P a g e
Conclusion
An in-depth literature review of the various types of fuel cell flow plates was conducted with
advantages and disadvantages of the commonly used types investigated. Using a set plate size of
a square of 5cm X 5cm, the flow in several of these common types were simulated using ANSYS
CFX and the resultant pressure drops in the plates were calculated.
New flow plate designs were developed by modifying of the existing flow plate designs and
optimised using ANSYS CFX to study the effect of the modifications on the plates pressure
drops. This was extended further to compare the designs at different flow rates (inlet velocities)
and the impact on pressure drop profiles. The results obtained for most of the modified designs
showed reduction in pressure drop which impacts positively on the overall performance of the
fuel cell. Mesh convergence studies were carried out at the onset to ensure there were no results
dependencies on the mesh used for the simulation.
A combination of both the serpentine and the parallel flow channels was designed to achieve a
better performance resulting from the presence of the serpentine channel portion and at the same
time ensure overall lower pressure drop due to the presence of the parallel bypass channels. From
the simulation results it has been identified that the modified serpentine designs with bypass
channels provided a pressure drop of 50 times lower than the traditional serpentine design.
Moreover, the modified parallel flow channel achieved a very low pressure drop at 12m/s with
an overall reduction of 90% to that of the traditional parallel channel.
The new maze flow plate design compared with that of the modified pin channel however had
approximately 40% high pressure drop at 12m/s.
Compared with all of the modified designs, the modified parallel flow channel has the lowest
pressure drop.
This study was restricted to pressure drop in fuel cell flow plate design that are commonly
referenced in the literature and modified them to achieve lower pressure drops. The overall
performance of any particular fuel cell is dependent on many other factors in addition to the
pressure drop and further studies need to be carried out to explore the interaction between these
different parameters and their combined effect on a fuel cell performance.

58 | P a g e
Finally, this simulation investigation seeks to initiate future developments in novel fuel cell plate
designs that can help overcome some of the current problems and provide better solutions to
improve the fuel cell efficiencies and accelerate their uptake in different applications including
the automotive industry.

59 | P a g e
References
1. J.G. Carton and A.G. Olabi, Design of experiment study of the parameters that affect
performance of three flow plate configurations of a proton exchange membrane fuel cell,
Energy, 35 (7), pp 2796-2806, 2010.
2. Tabbi Wilberforce, A. Alaswad, A. Palumbo, A. G. Olabi, Advances in stationary and
portable fuel cell applications, International Journal of Hydrogen Energy 41(37) March
2016.
3. J. G. Carton and A. G. Olabi, Representative model and flow characteristics of open pore
cellular foam and potential use in proton exchange membrane fuel cells, International
Journal of Hydrogen Energy 40 (2015) 5726 – 5738.
4. A. G. Olabi, The 3rd international conference on sustainable energy and environmental
protection SEEP 2009 the guest editor's introduction, Energy 2010; 35:4508-9.
5. Li Xianguo, Principles of Fuel Cells, 2006, New York: Taylor and Francis group.
6. C. Spiegel, 2007, Designing and Building Fuel Cells. 1st ed. McGraw-Hill Professional.
7. Fuel cells. Energy Research Center of the Netherlands (ECN).
http://www.ecn.nl/en/h2sf/additional/fuel-cells-explained/. (Accessed: 04/11/2016).
8. T. Wilberforce, A. Al Makky, A. Baroutaji, R. Sambi, A.G. Olabi, Computational Fluid
Dynamic Simulation and modelling (CFX) of Flow Plate in PEM fuel cell using
Aluminum Open Pore Cellular Foam Material, Power and Energy Conference (TPEC),
IEEE, Texas. 2017. DOI: 10.1109/TPEC.2017.7868285.
9. S. K. Dong, B. T. Yun and D. K. Lee, Design and numerical study for l kW tubular
SOFC APU system. Anonymous Fuel Cell Seminar, San Antonio; TX; United states:
Electrochemical Society Inc, October 2007, pp- 701-706.
10. NASA, 2015. Summary: Space Applications of Hydrogen And Fuel Cells.
http://www.nasa.gov/topics/technology/hydrogen/hydrogen_2009.html (Accessed:
10/07/2017)
11. J. Larminie and A. Dicks, Fuel Cell System Explained. 2nd edition, 2003, Wiley-
Blackwell.
12. V. S. Bagotsky, Fuel Cells: Problems and Solutions, 2009, Wiley.
13. M. A. Peavey, In: Fuel from water: energy independence with hydrogen. 11th ed.
Louisville, KY: Merit Inc: 2003.

60 | P a g e
14. T. Wilberforce, Z. El-Hassan, F.N. Khatib, A. Al Makyy, A. Baroutaji, J. G. Carton and
A. G. Olabi, Modelling and Simulation of Proton Exchange Membrane Fuel cell with
Serpentine bipolar plate using MATLAB, International journal of hydrogen, 2017. DOI:
10.1016/j.ijhydene.2017.06.091.
15. B. Cook, Introduction to fuel cells and hydrogen technology, Eng. Sci. Educ. J., 2002;
11(6): 205 – 16.
16. S. Superamaniam, Fuel Cells: from fundamentals to applications, New York: Springer
Science & Business Media: 2006.
17. H. Tsuchiya H and O. Kobayashi. Mass production of PEM fuel cell by learning curve,.
International Journal on Hydrogen Energy 2004; 29:985 – 90.
18. H. P. Chang, C. L. Chou, Y. Chen, T. Hou and B. J. Weng, The design and cost analysis
of a portable PEMFC UPS system, International Journal on Hydrogen Energy 2007;
32:316 – 22.
19. T. Wilberforce, A. Al Makky, A. Baroutaji, R. Sambi and A.G Olabi, Optimization of
bipolar plate through computational fluid dynamics simulation and modelling using
nickle open pore cellular foam material, International conference on renewable energies
and power quality (ICREPQ’17), ISSN 2171-038X, No 15 April 2017.
20. E. Afsari and S. A. Jazayeri, Effects of the cell thermal behavior and water phase change
on a proton exchange membrane fuel cell performance, Energy Convers Manage 2010;
51: 655 – 62.
21. A. D. Le and B. Zhou, A generalized numerical model for liquid water in a proton
exchange membrane fuel cell with interdigitated design, J. Power Sources ,193 (2), pp
665683,2009.
22. A. Kazim, H. T. Liu and P. Forges, Modelling of performance of PEM fuel cells with
conventional and interdigitated flow fields, J. Appl. Electrochem., 29 (12), pp 1409-
1416,1999.
23. J. P. Kloess, X. Wang, J. Liu, Z. Shi and L. Guessous, Investigation of bio-inspired flow
channel designs for bipolar plates in proton exchange membrane fuel cells, J. Power
Sources, 188(1), pp 132-140, 2009.

61 | P a g e
24. T. Wilberforce, A. Alaswad, J. Mooney and A. G. Olabi, Hydrogen Production for Solar
Energy Storage. A Proposed Design Investigation, Proceedings of the 8th International
Conference on sustainable Energy and Environmental Protection. ISBN: 978-1-903978-
52-8. 2015.
25. Y. G. Yoon, W. Y. Lee, G. G. Park, T. H. Yang and C. S. Kim, Effects of channel and rib
widths of flow field plates on the performance of a PEMFC, International Journal
Hydrogen Energy 2005; 30:1363 – 6.
26. X. D. Wang, W. M. Yan, Y. Y. Duan, F. B. Weng, G. B. Jung and C. Y. Lee, Numerical
study on channel size effect for proton exchange membrane fuel cell with serpentine flow
field, Energy convers Manage 2010; 51:959 – 68.
27. A. Su, F. B. Weng, C. Y. Hsu and Y. M. Cheng, Studies on flooding in PEM fuel cell
cathode channels, International Journal Hydrogen Energy 2006; 31:1031 – 9.
28. M. Venkatraman, S. Shimpalee, J. W. Van Zee, S. I. Moon and C. W. Extrand, Estimates
of pressure gradients in PEMFC gas channels due to blockage by static liquid drops,
International Journal Hydrogen Energy 2009;34:5522 – 8.
29. A. P. Manso, F. F. Marzo, J. Barranco, X. Garikano, and M. Garmendia Mujika,
Influence of geometric parameters of the flow fields on the performance of a PEM fuel
cell. A review, International Journal of Hydrogen Energy, 37 (20), pp 15256-15287,
2012.
30. H. F. Zhang, P. C. Pei and X. Yuan, The conception of in – plate adverse – flow field for
a proton exchange membrane fuel cell, International Journal Hydrogen Energy 2010;
35:9124 – 33.
31. M. Z. Yazdi and M. Kalbasi, A novel analytical analysis of PEM fuel cell, Energy
convers Manage 2010; 51:241 – 6.
32. W. M. Yan, H. C. Liu, C. Y. Soong, F. Chen and C. H. Cheng, Numerical study on cell
performance and local transport phenomena of PEM fuel cells with novel flow field
designs, Journal Power Sources 2006; 161:907 – 19.
33. X. D. Wang, Y. Y. Duan, W. M. Yan, D. J. Lee, A. Su and P. H. Chi, Channel aspect
ratio effect for proton exchange membrane fuel cell with serpentine flow field: role of sub
– rib convection, Journal Power Sources 2009; 193: 684 – 90.

62 | P a g e
34. C. J. Tseng, B. T. Tsai, Z. S. Liu, T. C. Cheng, W. C. Chang and S. K. Lo, A PEM fuel
cell with metal foam as flow distributor, Energy Conversion and Management 62 (2012):
14-21.
35. C.J. Tsang, B.T. Tsai, Z.S. Liu, T.C. Cheng, W.C. Chang and S.K. Lo, Effects of flow
field design on the performance of a PEM fuel cell with metal foam as the flow
distributor, International Journal of Hydrogen Energy, 37 (17), pp 13060-13066, 2012.
36. A. Kumar and R.G. Reddy, Materials and design development for bipolar/end plates in
fuel cells, J Power Sources, 129 (1), pp 62-67, 2004.
37. H. Liu and P. Li, Even distribution/dividing of single-phase fluids by symmetric
bifurcation of flow channels, International Journal of Heat and Fluid Flow, 40, pp 165-
179, 2013.
38. H. Liu, P. Li and J.V. Lew, CFD study on flow distribution uniformity in fuel distributors
having multiple structural bifurcations of flow channels, International Journal of
Hydrogen Energy, 35 (17), pp 9186-9198, 2010.
39. G. M. Imbrioscia and H. J. Fasoli, Simulation and study of proposed modifications over
straight-parallel flow field design, International Journal of Hydrogen Energy, 39 (16), pp
8861-8867 (2014).
40. E. Hontanon, M. J. Escudero, C. Bautista, P. L. GarcıaYbarra and L. Daza, Optimisation
of flow-field in polymer electrolyte membrane fuel cells using computational fluid
dynamics techniques, Journal of Power Sources, 86(1), pp 363368, 2000.
41. M. Mohammadi, G. N. Jovanovic and K.V. Sharp, Numerical study of flow uniformity
and pressure characteristics within a microchannel array with triangular manifolds,
Computers & Chemical Engineering, 52, pp 134144, 2013.
42. A. Lozano, L. Valiño, F. Barreras and R. Mustata, Fluid dynamics performance of
different bipolar plates: Part II. Flow through the diffusion layer, Journal of Power
Sources, 179 (2), pp 711–722, 2008.
43. F. Barreras, A. Lozano, L. Valiño, C. Marín and A. Pascau, Flow distribution in a bipolar
plate of a proton exchange membrane fuel cell: experiments and numerical simulation
studies, Journal of Power Sources, 144 (1), pp 54–66, 2005.