uvoir spectroscopy - rwoconne.github.io
TRANSCRIPT

ASTR 511/O’Connell Lec 8 1
UVOIR SPECTROSCOPY
High resolution, optical band solar spectrum

ASTR 511/O’Connell Lec 8 2
SPECTROSCOPY: INTRODUCTION
Spectral analysis is the source of most of our astrophysicalknowledge. See Lectures 2 and 3 for discussion of theinterpretation of spectral energy distributions.
Spectral resolution is usually quoted as < ≡ λδλ
, where λ is theobserving wavelength and δλ is the smallest wavelengthinterval that can be isolated from its neighbors.
UVOIR Detectors: intrinsically very poor spectral resolution;broad-band.
Exception: ∼sharp threshold determined by internal energy levels which
impose a cutoff hνmin = Eq, where Eq is an activation energy.
Spectral resolution must therefore be provided by additionaloptical elements.
We discuss three types of elements providing UVOIR spectralresolution: filters, prisms, and diffraction gratings.
Filters have many uses and can provide high < but, with a fewexceptions, offer isolation of only one waveband at a time.
Prisms and gratings disperse light such that a wide range ofwavelengths can be simultaneously observed. They are the basicelements used in spectrographs.
References:
Kitchin: Chapter 4 (Spectroscopy)
LLM: Chapter 5 (Spectral Analysis)

ASTR 511/O’Connell Lec 8 3
I. FILTERS
A. Glass Filters
Transmissive/absorptive properties of glasses depend on theirsolid state band structure. Tunable by selecting materials ordyes.
Apart from their short-wavelength cutoff (caused by absorptionfor ν > Eq/h), colored glasses have broad (& 500 A), slowlychanging transmission curves. Rarely exceed < ∼ 10.
Dozens of types of glass filters are used in astronomy, the bestknown being the broad-band UBVRIJHK system.

ASTR 511/O’Connell Lec 8 4
B. Interference Filters
Thin film layers (thickness ∼ 100 A) of metals and dieletricsdeposited on glass substrates in vacuo produce constructiveinterference effects through multiple internal reflections. Thiscan yield narrow, sharply defined transmission bands.
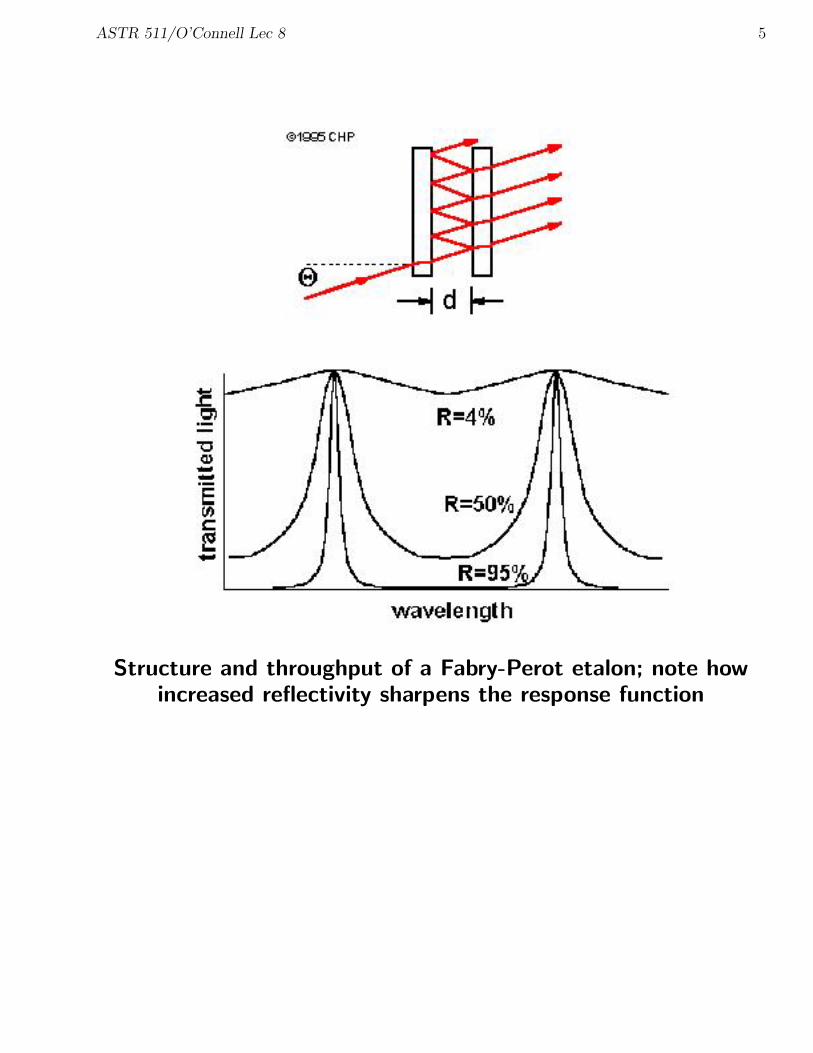
Fabry-Perot etalon: classic two-layer interference filter
The throughput of the etalon is given by:
I /I0 =1
1 + 4 R sin2(δ/2)(1−R)2
where δ = 2πλ
2d cos θ, R is the reflection coefficient of the coating, dis the spacing between the layers, and θ is the angle of incidence withrespect to the normal to the layers. (Assumes no absorption by etalon.)
Yields multiple maxima (“orders”) in the throughput sinceδ = m 2π → I = I0, where m is any integer.
Note that such maxima exist even if R ∼ 1!
The spectral resolution of the etalon (defined by half-power points onthe response curve) is
< =2π d
√R
λ (1 − R)
and is tunable by changing either d or R.
ASTR 511/O’Connell Lec 8 5
Structure and throughput of a Fabry-Perot etalon; note howincreased reflectivity sharpens the response function
ASTR 511/O’Connell Lec 8 6
Modern IF filter technology:
o Multiple layering techniques; highly versatile.
o For fixed-band interference filter, colored glass (or additional layering)used to suppress unwanted orders in the throughput.
o Typical bandwidths for astronomy are in the 10–500 A range, with< ∼ 10–500.
o Narrower bandwidths typically produce poorer peak throughput becauseof requirement for out-of-band order suppression.
o Widely-used IF filters include designs for:
Emission line isolation: e.g. Hα, [S II], or [O III]
Prominent stellar absorption features: e.g. Mg I “b”, Ca II “k”, CN
Intermediate-band diagnostics of stellar abundance, gravity: e.g. theStromgren filters;
Trimming response of wide-band filters: e.g. the Sloan Digital SkySurvey filters
o Large complements of IF filters are being used in the COMBO-17project and in WFC-3 on HST.
o Variable-spacing IF filters have wedge-shaped layers so that theircentral wavelength varies continuously with position. They come inboth circular and linear types. VS IF filters are carried by both WFPC-2and ACS on HST.
o Classic two-layer etalon is also used in astronomy as a “Fabry-PerotInterferometer,” where gas pressure or pizeo-electric positioners areused to adjust d in order to create a tunable, high resolution 2Dimaging filter. Most applications are to emission-line sources. (E.g.“HIFI” system, Bland & Tully 1989, AJ, 98, 723.)

ASTR 511/O’Connell Lec 8 7
INTERFERENCE FILTERS
Example of use of interference filter to map emission line gas in the edge-onstarburst galaxy M82. The “Hα” image (IF filter, 89 A FWHM) containsboth emission lines and stellar continuum but is dominated by the former.The “R” image (standard broad-band filter, 1500 A FWHM) contains bothline emission and continuum but is dominated by the latter. The “Pure”image results from subtracting the R image from the Hα image after scalingto yield zero net flux in regions without line emission.

ASTR 511/O’Connell Lec 8 8
II. PRISMS
Wavefronts entering a flat glass surface at other than normalincidence are tilted by virtue of the change in theindex of refraction, n, between air and glass. Since n is afunction of wavelength (higher at smaller λ), the wavefrontsare dispersed in direction according to λ (bluer light deflectingmore).
A standard triangular prism has the cross section of an isosceles triangle.Light entering on one long side as shown below emerges through theopposite side and is dispersed further.
The spectral resolution of this type of prism is < = B dndλ
,where B is the length of the prism base.
Advantages of prism spectrographs:
o High throughput; useful for faint-object spectroscopy (e.g. Hubble Mt.Wilson nebular spectrograph)
o Wide field possible for multiobject samples
o Cheap, simple; predominant in early astronomical spectroscopy

ASTR 511/O’Connell Lec 8 9
Disadvantages of prism spectrographs:
o < can be a strong function of wavelength, yielded crowding at longwavelength end of response
o Wide band coverage difficult
o Internal absorption limits use in UV
o More complex data reduction because of variable dispersion
“Objective” prism imagers: place prism over telescope primary→ simultaneous low dispersion spectra over wide field. E.g.:
Henry Draper and Vyssotsky (UVa) surveys of stellar spectra. Schmidt
telescope surveys for QSO’s/emission line galaxies (e.g. Markarian, KISS).
Direct and spectroscopic images of a field from the KISS objective prismsurvey. An emission line source is detected in the center of the dispersed
image. (J. Salzer)

ASTR 511/O’Connell Lec 8 10
III. DIFFRACTION GRATINGS
A diffraction grating is a set of multiple, identical slits(transmitting or reflecting) separated by a distance comparableto the wavelength of light. Plane or concave surface.
Fraunhofer (ca. 1820) pioneered the study of such gratings. HenryRowland (JHU, ca. 1880) produced the first of the modern gratingruling “engines” capable of making large, precision gratings useful inastronomical spectrographs. These use diamond tools to cut uniformlyspaced grooves (up to 10,000/mm) on metal or glass subtrates. Lessexpensive “replica” gratings, transferred from a cut master to a resinlayer, are in widespread use.
The theory of Fraunhofer diffraction from a plane gratingpredicts that the diffracted light is distributed as:
I(θ) = I0 f1 f2,
where I is the output intensity leaving the grating in direction θ with
respect to the normal, I0 is the input intensity at the grating, f1 is the
diffraction pattern for a single grating slit, and f2 is the pattern for a set of
N identical apertures. The two patterns are given by:
f1 =sin2(πα)
(πα)2, α =
a sin θ
λ
f2 =sin2(Nπδ)
sin2(πδ), δ =
d sin θ
λ.
where a is the linear width of the (assumed rectangular) apertures and d isthe linear separation between them. We assume normal incidence of theincoming light here. For non-normal incidence (θ1 6= 0), replace the sin θterm with sin θ1 + sin θ2.

ASTR 511/O’Connell Lec 8 11
DIFFRACTION GRATINGS (cont)
Interpretation: Consider monochromatic light. Maxima (“orders”) in themultislit pattern occur for δ = n, where n is any integer. This implies thepath difference between adjacent slits (∆ in the first diagram below) will ben wavelengths, which produces constructive interference as shown in thesecond diagram. Maxima in the output intensity occur at a sequence ofangles sin θn = n λ/d.

ASTR 511/O’Connell Lec 8 12
DIFFRACTION GRATINGS (cont)
The monochromatic multi-slit pattern for 3 slits and a large number of slitsis shown below. Each peak corresponds to a particular order. The additionof slits increases the sharpness and brightness of the peaks but leaves thelocations of the orders unchanged.
For a real grating, the single-aperture diffraction pattern would besuperposed on the multi-slit pattern (here centered on θ = 0).
“Echelle” gratings: Achieve very high resolutions by operating at largen ∼ 50 − 100 and angle of incidence θ1 ∼ 90◦. Yield < & 105.

ASTR 511/O’Connell Lec 8 13
DIFFRACTION GRATINGS (cont)
Resolution
Consider output of grating in polychromatic light. In a given order, redderlight is diffracted to larger angles than blue light. The maxima for adjacentwavelengths in a given order are offset slightly.
Spectral resolution for order n is determined by the wavelength shift needed
to place the diffraction pattern maximum for λ + δλ on the first minimum
in the pattern for λ. The resolution is
< =λ
δλ= nN
so it depends both on the order and on the total number of slits illuminated
on the grating.
“Angular dispersion” in order n is given by
dθ
dλ=
n
d cos θ
“Higher” dispersion corresponds to larger values of this quantity. Echellestake advantage of both n and θ dependence to maximize dispersion.
NB: Astronomers often use the word “dispersion” to refer to dλdx
in the
spectrograph focal plane, usually quoted in A per mm. This is more properlycalled the “linear reciprocal dispersion” (K). It is inversely related to theangular dispersion, so lower values correspond to higher wavelengthdispersion.
In K units, “low” dispersion corresponds to & 200 A/mm and “high”to . 10 A/mm
ASTR 511/O’Connell Lec 8 14
DIFFRACTION GRATINGS (cont)
Grating Advantages
o Dispersion same for all wavelengths in given order
o Large dispersions/resolutions possible (large n)
o Transmission or reflection gratings available; plane or curved
o High UV throughputs possible (depending on reflection coating)
o Grating technology highly developed, extensive customization possible
Grating Disadvantages
o Size limited by capacity of ruling engine. Use of mosaic gratings withlarge beam telescopes possible but performance compromised.
o Order superposition: red light of a given order is spatially coincidentwith blue light from a higher order. Wavelength λm in order m issuperposed on light from wavelength λn in order n if
λm =nλn
m
For instance, λ1 = 10000A, λ2 = 5000A, and λ3 = 3330A arecoincident.
Solution: Use “order separating” filters to block out the unwantedorders (through this becomes difficult for large n). In case of high orderechelle spectrographs, use a second grating as a “cross-disperser”.

ASTR 511/O’Connell Lec 8 15
DIFFRACTION GRATINGS (cont)
o Low efficiency: Gratings distribute light across a large number of orders(including the zeroth order, which has no dispersion). Flux decreasesrapidly with order, ∼ n−2 for n ≥ 1.
Solution: “Blazed” reflection gratings, in which the facets of the slitsare cut at an angle that places the maximum of the single-aperturepattern at a chosen wavelength and order. For the grating in thediagram below, the “wavelength of the blaze” is λBL = d
nsin 2φ.
Achievable efficiencies for blazed gratings are in the 60-90% range, butthroughput in a given order now depends on λ, which is not true of anunblazed grating. The effect of a blaze on the diffraction pattern inmonochromatic light is shown in the second figure

ASTR 511/O’Connell Lec 8 16
SPECTROGRAPH DESIGN
Diagram below shows a typical medium-dispersion spectrograph
McCormick Observatory Opto-Mechanics Model 10C Spectrograph
Main elements:
o Entrance apertures at focal plane of telescope
None (“slitless”): resolution determined by size of sources asprojected on spectrograph focal plane; large sky backgroundsuperposed on spectra of all sources

ASTR 511/O’Connell Lec 8 17
Adjustable slit: most common; intended for single point source or1-D slice through extended source. Slit usually smaller than size ofpoint source → improves resolution ∼ 2 − 10×. Greatly reducesbackground contamination compared to slitless design. Slit plate isusually aluminized on side facing telescope so can view target andfield in reflected light.
Aperture plate: multi-object; cut small apertures to match eachfield of interest; computer-controlled measuring and cutting process;requires large format detector. Up to several 100 targets/field.Must avoid overlapping spectra in cutting plate. Special designs uselenslets or configurable microarrays.
Fiber-fed: use fiber bundles to transfer light of selected targets infocal-plane field to spectrograph input. Fiber positioning usuallydone by computer control. Alternative: plug fibers into pre-drilledaperture plate. Output end of fibers usually a linear array. Requireslarge format detector. Up to several 100 targets/field. Details: JeffCrane guest lecture.
o Collimator: mirror or lens to convert diverging beam from telescopeinto parallel beam for input to disperser
o Disperser: grating or prism, usually on rotating stage so can adjustcentral wavelength.
o Camera: to re-focus parallel output beam from disperser onto focalplane of detector.
o Order separating devices: filters, cross-dispersing gratings
o Comparison sources: lab lamps/arcs to calibrate wavelength scale usingknown spectrum of selected gases (e.g. He, Ne, Ar, Hg, Fe). Arrangeto inject such that light path parallels that of astronomical targets.
o Slit-viewer optics: microscopes/cameras to view entrance aperture(from front or rear) to verify target acquisition/tracking.

ASTR 511/O’Connell Lec 8 18
SPECTROGRAPH DESIGN
In order to provide an optimal match in the standard design shown above(no loss of light, best resolution), the component optics of the spectrographmust satisfy the following conditions:(
F
D
)coll
=
(F
D
)tel
where F is the focal length and D is the diameter, and
Dcoll = Dgrat = Dcam
The linear reciprocal dispersion in the camera focal plane is then given by
K =d cos θ
nFcam
where Fcam is the focal length of the camera, d is the grating slitspacing, and n is the order.
The “speed” of the spectrograph is proportional to the photon flux at thedetector. For a slit spectrograph the speed will be proportional to:
s
β2
(D
F
)2
tel
where s is the linear width of the slit and β is the diameter of the seeingdisk of the star (radians). This assumes that the slit is smaller than the starimage (i.e. s < βFtel).

ASTR 511/O’Connell Lec 8 19
SPECTROGRAPH DESIGN
The minimum resolution element in the spectrum is determined by thewidth of the image of the slit as projected on the detector and is
δλmin =s K
R
where R is the “slit-to-plate reduction factor” R = Fcoll/Fcam.
According to the Nyquist criterion, optimum sampling of such an elementrequires two detector elements across it, so the physical size of a detectorpixel should be
∆xpix =δλmin
2 K=
s
2 R

ASTR 511/O’Connell Lec 8 20
EXAMPLE SPECTROGRAPH DESIGNS
KPNO “Gold” Spectrograph: medium dispersion gratingspectrograph with fast camera

ASTR 511/O’Connell Lec 8 21
EXAMPLE SPECTROGRAPH DESIGNS
Ultra High Resolution Facility (AAO): echelle spectrograph,with selectable grating cross-dispersers;
< : 300, 000 − 940, 000.

ASTR 511/O’Connell Lec 8 22
EXAMPLE SPECTROGRAPH DESIGNS
Hopkins Ultraviolet Telescope Far-UV spectrograph. Rowlandcircle design, 600 line/mm concave grating with SiC coating.
Operated from Space Shuttle.
ASTR 511/O’Connell Lec 8 23
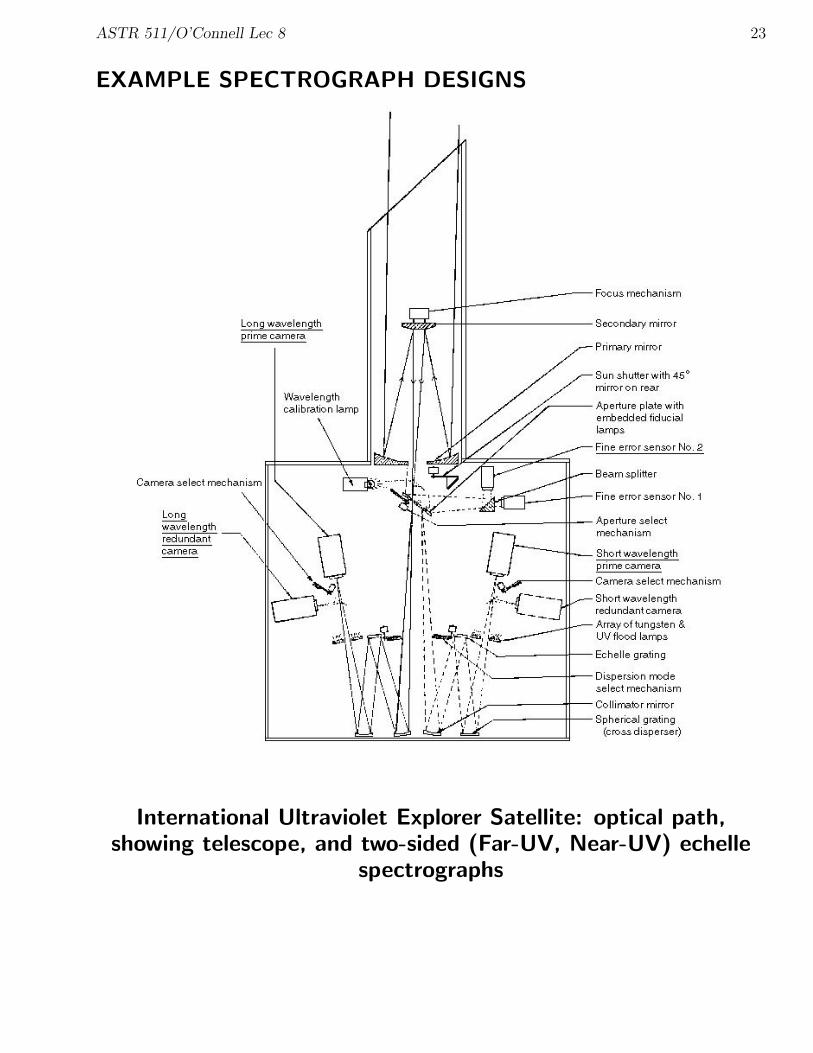
EXAMPLE SPECTROGRAPH DESIGNS
International Ultraviolet Explorer Satellite: optical path,showing telescope, and two-sided (Far-UV, Near-UV) echelle
spectrographs