utoma tic w a ve bound aries in mul tilead...
TRANSCRIPT

AUTOMATIC DETECTION OF WAVE BOUNDARIES IN MULTILEAD ECG
SIGNALS� VALIDATION WITH THE CSE DATABASE
by
� Pablo Laguna� Ph�D�� Raimon Jan�e� Ph�D�� Pere Caminal� Ph�D�
��� Departamento de Ingenier��a El�ectrica Electr�onica y ComunicacionesCentro Polit�ecnico SuperiorUniversidad de Zaragoza� Spain
��� Institut de Cibernetica�Universitat Politecnica de CatalunyaBarcelona� Spain
Address for future correspondence
��� Departamento de Ingenier��a El�ectrica Electr�onica y ComunicacionesCentro Polit�ecnico SuperiorMaria de Luna� �� �� Zaragoza� SPAIN�
e�mail laguna�cc�unizar�esTelephone ������������
��������� FAX ������������
ACKNOWLEDGEMENTS
This work was supported by grant TIC���� �� from CICYT �Spain��
�

Abstract
This paper presents an algorithm for automatically locating the waveform boundaries �the
onsets and ends of P� QRS and T waves� in multilead ECG signals �the �� standard leads and
the orthogonal XYZ leads�� Given these locations� features of clinical importance �such as the
RR interval� the PQ interval� the QRS duration� the ST segment� and the QT interval� may
be measured readily� First� a multilead QRS detector locates each beat� using a di�erentiated
and low�pass ltered ECG signal as input� Next� the waveform boundaries are located in each
lead� The leads in which the detected electrical activity is of longest duration are used for the
nal determination of the waveform boundaries� The performance of our algorithm has been
evaluated using the CSE multilead measurement database� In comparison with other algorithms
tested by the CSE� our algorithm achieves better agreement with manual measurements of the
T wave end and of interval values� while its measurements of other waveform boundaries are
within the range of the algorithm and manual measurements obtained by the CSE�
� Introduction
The electrocardiogram �ECG� is characterized by a recurrent wave sequence �P� Q� R� S� T�
associated with each beat� Various time intervals de�ned by the onsets and ends of these waves
are important in electrocardiographic diagnosis� The most important of these intervals are the
RR interval� the PQ interval� the QRS duration� the ST segment� and the QT interval� Direct
measurement of these intervals requires knowledge of the locations of the boundaries �the onsets
and ends� of the P� QRS and T waves�
Since beat�by�beat manual measurement of these intervals from standard ���lead ECGs is
impractical in routine clinical practice� algorithms for automated measurement have been proposed
to locate QRS onsets and ends ���� QT interval limits ���� and onset of P and QRS waves and ends
of P� QRS and T waves ��� ��� Although these algorithms may work acceptably given noise�free
signals� their performance degrades in the presence of noise ����
The Common Standards for Quantitative Electrocardiography �CSE� project� sponsored by the
European Community ���� has studied the performance of many algorithms designed to locate�

waveform boundaries in the ECG� An important �nding of the CSE study of these algorithms is
that the algorithms tend to locate the end of the T wave signi�cantly earlier than human experts do
���� Unfortunately� no technical details are given for the algorithms used in ��� ��� limiting its use
out of their domaine� All these reasons lead us to developed a new method for locating waveform
boundaries� that is presented at this paper� We evaluate it using the same methods and test signals
used by the CSE� and show that its agreement with manual measurements of waveform boundaries
is excellent� even for measurements of the end of the T wave�
Our method is based on the multilead generalization of a previously described procedure for
single�lead measurement of the QT interval ���� and subsequently used for single� and multi�lead
waveform boundary determination ��� ��� The method has been applied to ECG records of the
MIT�BIH database� and validated with the CSE multilead measurement database ��� where other
programs have already been validated�
� Methods
First� a multilead QRS detector �designed for �� leads� is applied to the ECG record� Next�
the algorithm estimates the waveform boundaries independently in each lead of the multilead
ECG record� This procedure makes use of the di�erentiated ECG signal and information about
wave shape� The algorithm implements criteria to establish wave presence or absence in each
lead according to the relative di�erentiated signal magnitude in the di�erent waves� Given the
information about wave presence and the di�erentiated signal� the algorithm characterizes the
patterns of the P wave �regular or inverted�� the QRS complex �in terms of various Q� R� S� R�
sequences�� and the T wave �regular� inverted� or biphasic�� in accordance with the classi�cation
used by the CSE working party� ���� Using the wave boundaries obtained in each lead� the �nal
wave boundaries are selected from those leads where the detected electrical activity is longest�
reducing the in�uence of possible noisy measurements�
Figure � shows the main steps of the procedure for waveform boundary detection� The multilead
QRS detector includes �� single�lead QRS detectors and generates the QRSj�i� positions of the ith�

QRS in the jth lead from each lead� ECGj�k�� Next� a multilead QRS decision rule gives the
�nal QRSj�i� detections of the ith beat in each lead� We analyse each lead� ECGj�k�� using the
following single�lead steps �brillation process rejection� waveform location �Wj�i��� and waveform
boundary determination� yielding single�lead waveform boundary estimates �WBj�i�� for lead j
and beat i� From the WBj�i� estimates� a multilead waveform boundary location rule gives the
�nal lead�independent waveform boundaries for each beat �WB�i��� Finally� given these WB�i�
positions� we compute the clinicaly relevant intervals �PR� QT� ����� Below� we describe these steps
in greater detail�
Figure � Diagram of the wave boundary detection procedure
��� Preprocessing�
The �rst step consists of a single�lead �ltering process for noise reduction and a non�linear
transformation to improve QRS detection �� �� The linear �ltering uses a second order band�pass
�

Lynn �lter � ����� Hz� ��dB� ���� to attenuate baseline drift and high frequency contamination�
Once the band�pass �ltered signal �ECGPB� is reached� a low�pass di�erentiator �� � is applied to
get the information about changes in the signal slope� This di�erentiated signal is called ECGDER�
The non�linear transformation we use is the moving�window integration of the squared signal
described in �� � with an integration width of �� ms�
��� QRS detection�
����� single�lead QRS detection
The single�lead QRS detector used in this work is an adaptation of that described by Pan and
Tompkins �� �� using the signal slope in the decision rule any possible detection should have a
maximum slope within � � � of that of the previous QRS complexes�
����� Multilead QRS detection
From the estimates� QRSj�i�� of the position of beat i in lead j obtained by the single�lead detectors
�Fig� ��� we apply a multilead QRS detection rule to consider as QRS complexes in each lead only
those whose positions do not di�er more than � ms from one lead to the other ����� The decision
rule includes the following steps
a� The input values to this processing stage are the detected positions QRSj�i� �j���������� of
the ith beat� that come from the single�lead QRS detectors� Figure �a shows an example of
these detections�
b� The �rst �min� and the last �max� QRSj�i� �j���������� temporal positions are searched
�Fig� �b�� From these time positions we de�ne two series of QRSj�i� positions series ��
those QRSj�i� that are within � ms of min� series �� those QRSj�i� that are within � ms of
max� In �gure �b� series � has �� positions and series � has � positions�
�

(90 ms)(90 ms)
V3
V3 aVl
aVl
Y
V3
V3
V3
YaVlaVraVfV1V2V4
V5V6ZX III
II
I
III
e)
d)
c)
b)
a)
maxmin
min max
serie 2
ms
serie 2serie 1
ms
serie 1serie 2
maxmin
ms
ms
serie 1
serie 2
maxmin
min maxserie 1
minmax
serie 2serie 1
ms
serie 2maxmin
Figure � Multilead QRS decision rule
�

c� The two series are compared� If both contain all �� QRSj�i� �j���������� positions� it is
assumed that the ith beat has been detected correctly in all the leads� If the series contain
di�erent numbers of positions� the extreme value �min or max� of the series that contains the
smaller number of positions is rejected�
If the rejected position is max� it may result from a missed detection� and max could belong to
the next beat� Thus� if max belongs to lead k� we assign QRSk�l� � QRSk�l��� �l � i���� In
�Fig� �b�c� the max position� belonging to lead II� is rejected as a probable false detection� and
the algorithm assumes that the true QRS in lead II was missed by the single�lead detector�
If the rejected position is min� it may result from a false positive detection at this lead� In
this case� if min belongs to lead k� QRSk�i��� may be the true detection for which we are
looking� Thus� we may assign QRSk�l� � QRSk�l��� �l � i�� In �Fig� �d�e� the min position�
belonging to lead V�� is rejected as a probable false detection� and the algorithm reassigns
QRSV��i��� �dashed line� as the position of the ith beat at V��
d� The process continues recursively until both series are identical� The remaining positions are
considered the true detection for the ith beat in each lead� Leads where the ith beat was not
detected� or where a detection was rejected in the previous step� are not used for waveform
boundary determination for beat i�
In �gure � we have the single�lead detection marks in � leads of record MO� � � from the CSE
database� The multilead decision rule rejects the ��th detected beat in lead II �it was the P wave
position� rather than the QRS complex position� since it is not in accordance with the other leads�
and recognizes two missing beats in lead V� ��th and ��th�� Table � summarizes the detections in
this record�
��� Fibrillation rejection�
During �brillation� it is meaningless to measure P� QRS and T boundaries� Fibrillation is detected
using the single�lead procedure presented in ����� applied before the wave location procedure�
�

s e g
0 . 0 1 . 1 2 . 2 3 . 4 4 . 5 5 . 6 6 . 7 7 . 8 9 . 0
I
I I
V 2
V 3
V 4
V 5
V 6
1 2 3 4 5 6 7 8 9 1 0 1 1 1 2 1 3
Figure � Example of multilead QRS detection in record MO� ��� of the CSE database�
�

Leads
Beat I II III aVR aVL aVF V� V� V� V� V� V� X Y Z
� � � � � � � � � � � � � � � �
� � � � � � � � � � � � � � � �
� � � � � � � � � � � � � � � �
� � � � � � � � � � � � � � � �
� � � � � � � � � � � � � � � �
� � � � � � � � � � � � � � � �
� � � � � � � � � � � � � �
� � � � � � � � � � � � � � � �
� � � � � � � � � � � � � � � �
� � � � � � � � � � � � � � � �
�� � � � � � � � � � � � � � �
�� � � � � � � � � � � � � � �
�� � � � � � � � � � � � � � � �
Table � QRS detections accepted in each lead of record MO� ��� of the CSE database� The symbol
��� represents accepted detections the symbol �� represents beats either rejected or not detected
in the corresponding lead�
��� Wave location�
The QRS positions �QRSj�i�� given by the detector may be Q� R or S wave peaks� The algorithm
searches for the nearest peak positions before �pb� and after �pa� the QRSj�i� position in the
ECGDER �zero�crossing in this signal�� According to the polarity and relative value of these
peaks� we decide if QRSj�i� belongs to the Q� the R or the S wave ���� The adjacent wave positions
are detected as the nearest zero�crossing points to QRSj�i� in ECGDER� To admit these adjacent
detected points as wave positions �W�i��� the time distance between waves must be in the range
of physiologically plausible intervals� and the maximum slope associated with these waves must be
bigger than a threshold of the maximum slope associated with the QRS complex �dermax�� The
threshold value is experimentally adjusted and is di�erent for Q� R� S or R� waves� ranging from
� to � � of the maximum QRS slope value �dermax�� This procedure thus attempts to locate as
many of the Q� R� S and R� peaks as are present�
�

Next� we search for the P and T wave peaks� These waves have lower frequency components than
the QRS complex� We again apply a low�pass �lter ���db cuto� frequency of �� Hz� to ECGDER
to reduce remaining noise� In this �ltered signal �DERFI� we de�ne a window of ��� ms starting
��� ms before the R position� This window is shortened when the previous T or the next Q wave
is in it� In this window we search for the maximum and minimum value� If these values are bigger
than �� of the maximum slope of the QRS complex� the algorithm assumes that it has located a P
wave� otherwise� the algorithm assumes that the P wave cannot be located in the given lead� The
P wave peak is assumed to occur at the zero�crossing between the maximum and the minimum
values in the window�
To detect the T wave� we de�ne a search window in DERFI that is a function of the heart rate
���� The algorithm determines the type of T�wave �regular� inverted� biphasic ��� or biphasic ���
according to the relative positions and values of the maximum and minimum values within the
search window� using the CSE working party classi�cation ���� The T wave peak is assumed to
occur at the zero�crossing adjacent to the maximum or minimum value�
��� Waveform boundary location
����� Single lead waveform boundary location�
ms
0 . 3 4 . 6 9 . 1 0 4 . 1 3 8 . 1 7 3 . 2 0 8 . 2 4 3 . 2 7 7 .
ECGPB
ECGDER
dermax
zero
pk
TH
Figure � Determination of the end of the QRS by the threshold method�
�

Wave boundary �WB�
K P wave Q wave R wave S wave T wave
Pb Pe Qb Rb Re Se Tb Te
� ���� ���
���� ��� ��� ��� ���
��� ���� ���
ECGDER�pk� x �� ���� ��� ���� �� �� ��� ��
dermax ��� ���� ��
���� ���� ��
���� ��� ��� ���
� ��� ���
Table � Values of the k threshold for each wave boundary� P begin �onset� Pb� P end Pe� etc� as a
function of the maximum wave slope �ECGDER�k�� relative to the maximum QRS slope dermax�
Once we have the wave locations �zero�crossing point �zero� in the di�erentiated signal ECGDER or
DERFI�� we proceed to locate the onset and end �boundaries� of each waveform� The di�erentiated
threshold method used in this work was presented in ��� for QT interval determination� and in this
work we have generalized it to determine any wave limit in multilead ECG records� Figure � shows
this procedure for QRS end determination� From the zero point �S wave position� we search for the
adjacent peak �pk� on the right �for the end� or on the left �for the onset�� This point is the point
of maximum slope in the wave� With the value of ECGDER at time instant pk �ECGDER�pk�� we
de�ne a threshold �TH� as TH�ECGDER�pk��k� Thus� we determine the end �onset� point of the
wave as the forward �backward� threshold crossing point from zero in the ECGDER signal �end of
S wave in �gure ��� The value of k is a constant that is experimentally adjusted and reaches its
best performance with the values expresed in table ��
When two waveforms overlap� the threshold criteria can fail and may give boundary locations
far from the physiologicaly expected points� Thus� the algorithm uses a minimum di erentiated
criterion as described in �gure �� From the pk position we �nd the smallest absolute peak in the
same direction �pk�� as for the previous criterion� This peak position� associated with an ECG
��
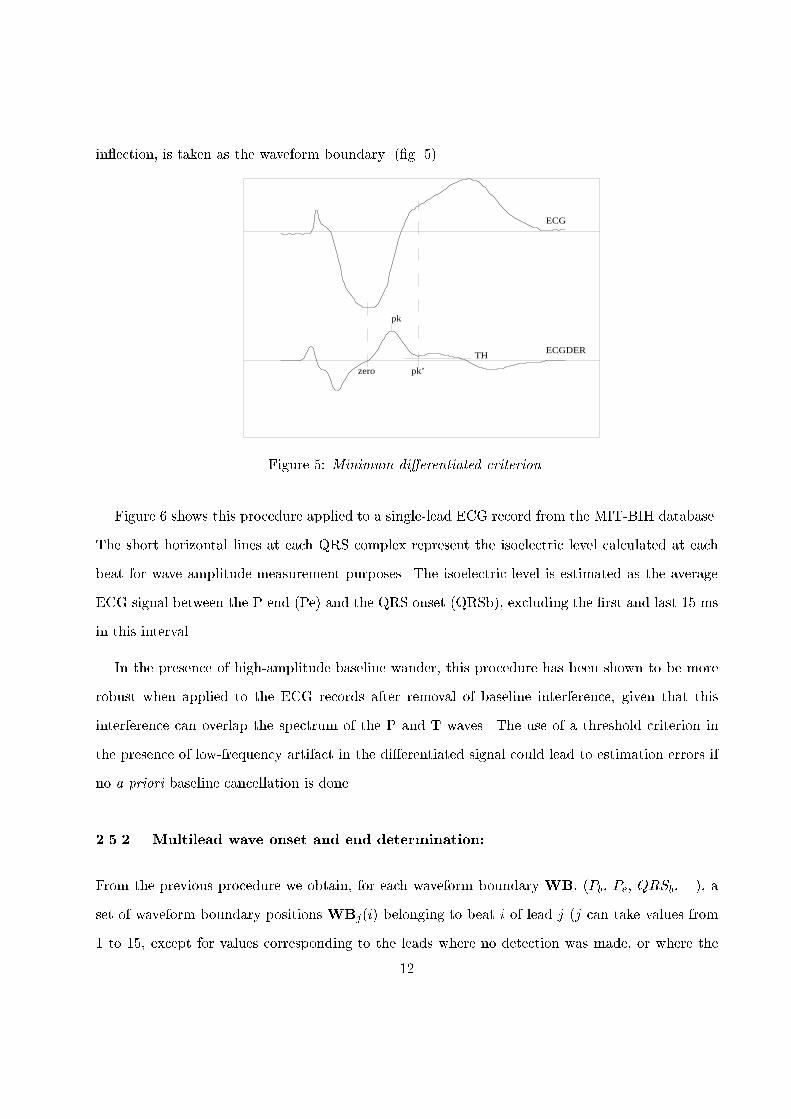
in�ection� is taken as the waveform boundary� ��g� ���
ECG
ECGDER
pk’
TH
zero
pk
Figure � Minimum di erentiated criterion�
Figure � shows this procedure applied to a single�lead ECG record from the MIT�BIH database�
The short horizontal lines at each QRS complex represent the isoelectric level calculated at each
beat for wave amplitude measurement purposes� The isoelectric level is estimated as the average
ECG signal between the P end �Pe� and the QRS onset �QRSb�� excluding the �rst and last �� ms
in this interval�
In the presence of high�amplitude baseline wander� this procedure has been shown to be more
robust when applied to the ECG records after removal of baseline interference� given that this
interference can overlap the spectrum of the P and T waves� The use of a threshold criterion in
the presence of low�frequency artifact in the di�erentiated signal could lead to estimation errors if
no a priori baseline cancellation is done�
����� Multilead wave onset and end determination�
From the previous procedure we obtain� for each waveform boundaryWB� �Pb� Pe� QRSb� ����� a
set of waveform boundary positionsWBj�i� belonging to beat i of lead j �j can take values from
� to ��� except for values corresponding to the leads where no detection was made� or where the
��

s 4 . 0 4 . 2 4 . 4 4 . 7 4 . 9 5 . 1 5 . 3 5 . 6 5 . 8
ECGDER
(c)
(b)
ECGPB
(a)
ECG
1 m v
R
Pb
P
Pe
QRSb
Q S
QRSe
Tb
T
Te
Figure � Detection of wave boundaries in two beats belonging to record ��� �lead MLII� of the
MIT�BIH ECG database� Short lines denote the wave positions �P� Q� R� S and T� and long lines
the wave limits� P onset �Pb�� P end �Pe�� etc� a� is the original ECG� b� the ECGPB signal and
c� the ECGDER signal�
��

multilead QRS detection rule rejected the detection�� The next step is the selection� from these
WBj�i� positions� of the oneWB�i� that will be considered as the real onset or end of the waveform
at the ith beat� Electrophysiologically� if allWBj�i� were correctly detected� we should select the
earliestWBj�i� �j��� ���� ��� for the waveform onset and the latest for the waveform end� in order
to recover the boundary from that lead where the electrical activity of the heart has the longest
temporal projection� However� due to noise or errors� misestimations could have occurred in the
determination of someWBj�i�� that may lead to an erroneous �nalWB�i� position� To reduce the
risk of this occurrence� we apply the following multilead wave boundary detection rule ��gure �� for
each ith beat We search the minimum �min� time position �for onsets� or maximum �max� time
position �for ends� of WBj�i� �j��� �������� If no more than two other leads have their WBj�i�
mark in the interval �min� min � �� or �max � �� max�� the min or max WBj�i� point is rejected as
a possible noisy detection� The value of � is selected according to the usual variability in manual
estimations ��� and the empirical practice� Values for � are �� �� �� � and �� ms for Pb� Pe� QRSb�
QRSe� and Te� respectively� After that we take the wave onsets �ends� as the minimum �maximum�
of the remainingWBj�i� positions� obtaining the �nalWB�i��
� Results
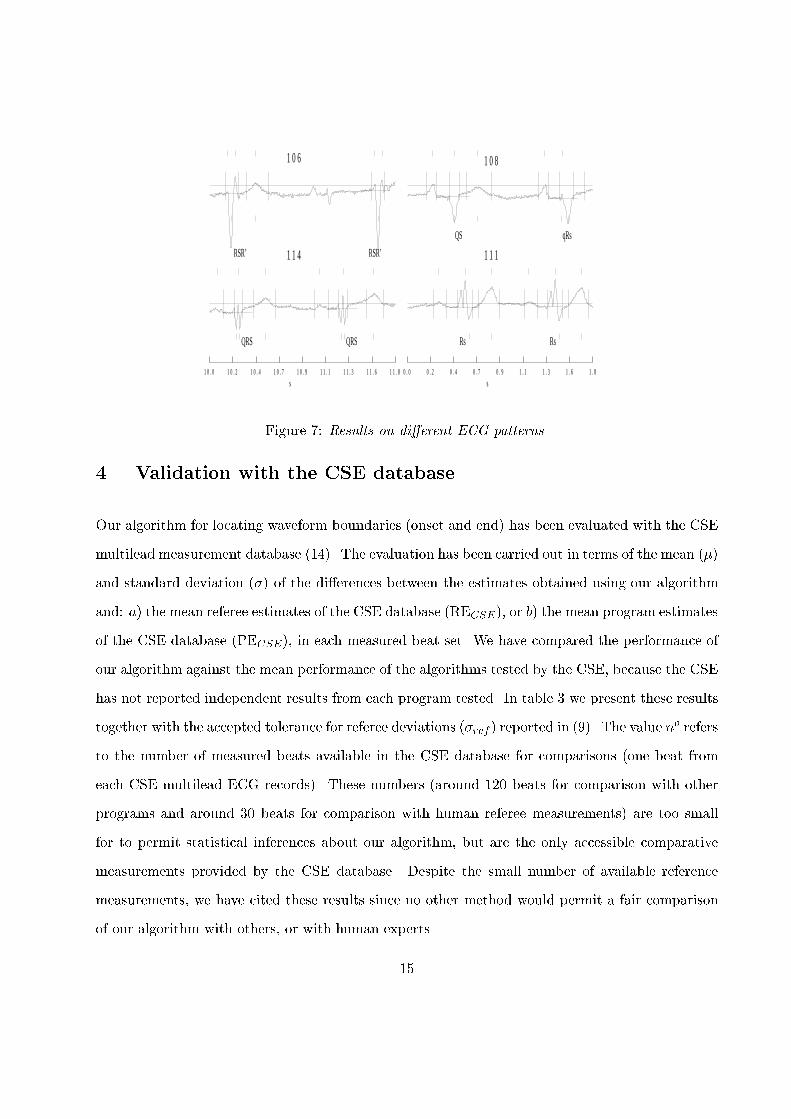
The single�lead procedure has been applied to several records of the MIT�BIH database� Figure �
shows some of the results obtained on four di�erent records with no standar morphologies record
� � presents a RSR� pattern� record � � presents a QS pattern� record ��� presents a W pattern
and record ��� presents a R wave with two peaks� In all cases the wave limits are well determined�
including wave shape determination�
The multilead procedure has been applied to records of the CSE multilead measurements
database� Figure � shows the multi�lead advantage of the results obtained on record MO� ��
of this database� Note how the multilead boundary location procedure improves the location of the
T end point� which di�ers signi�cantly between leads V� and V�� and others such as I or III�
��
1 1 4
s 1 0 . 0 1 0 . 2 1 0 . 4 1 0 . 7 1 0 . 9 1 1 . 1 1 1 . 3 1 1 . 6 1 1 . 8
QRS QRS
1 1 1
s 0 . 0 0 . 2 0 . 4 0 . 7 0 . 9 1 . 1 1 . 3 1 . 6 1 . 8
Rs Rs
1 0 6
RSR’ RSR’
1 0 8
QS qRs
Figure � Results on di erent ECG patterns�
� Validation with the CSE database
Our algorithm for locating waveform boundaries �onset and end� has been evaluated with the CSE
multilead measurement database ����� The evaluation has been carried out in terms of the mean ���
and standard deviation ��� of the di�erences between the estimates obtained using our algorithm
and a� the mean referee estimates of the CSE database �RECSE�� or b� the mean program estimates
of the CSE database �PECSE�� in each measured beat set� We have compared the performance of
our algorithm against the mean performance of the algorithms tested by the CSE� because the CSE
has not reported independent results from each program tested� In table � we present these results
together with the accepted tolerance for referee deviations ��ref � reported in ���� The value no refers
to the number of measured beats available in the CSE database for comparisons �one beat from
each CSE multilead ECG records�� These numbers �around �� beats for comparison with other
programs and around � beats for comparison with human referee measurements� are too small
for to permit statistical inferences about our algorithm� but are the only accessible comparative
measurements provided by the CSE database� Despite the small number of available reference
measurements� we have cited these results since no other method would permit a fair comparison
of our algorithm with others� or with human experts�
��

s e g
1 . 0 1 . 3 1 . 6 2 . 0 2 . 3 2 . 6 2 . 9 3 . 2 3 . 6
Z
Y
X
V 6
V 5
V 4
V 3
V 2
V 1
a V r
a V f
a V l
I I I
I I
I
Figure � Multilead waveform boundary determination in record MO� ��� of the CSE database�
��
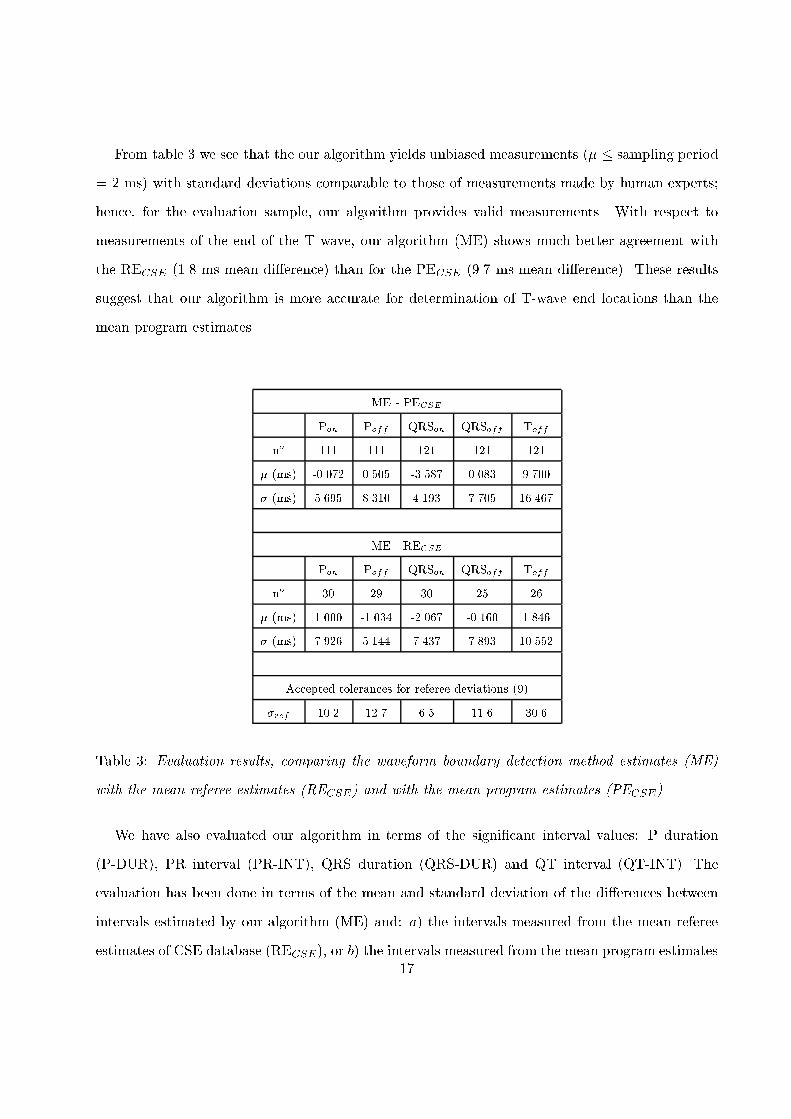
From table � we see that the our algorithm yields unbiased measurements �� � sampling period
� � ms� with standard deviations comparable to those of measurements made by human experts�
hence� for the evaluation sample� our algorithm provides valid measurements� With respect to
measurements of the end of the T wave� our algorithm �ME� shows much better agreement with
the RECSE ���� ms mean di�erence� than for the PECSE ���� ms mean di�erence�� These results
suggest that our algorithm is more accurate for determination of T�wave end locations than the
mean program estimates�
ME PECSE
Pon Poff QRSon QRSoff Toff
no ��� ��� �� �� ��
� �ms� ���� ����� ��� � ��� � �����
� �ms� ����� ���� ����� ����� ������
ME RECSE
Pon Poff QRSon QRSoff Toff
no �� � �� � �
� �ms� ����� ����� ���� ����� �� ��
� �ms� ���� ����� ����� �� �� �����
Accepted tolerances for referee deviations ���
�ref ��� ��� ��� ���� ����
Table � Evaluation results� comparing the waveform boundary detection method estimates �ME�
with the mean referee estimates �RECSE� and with the mean program estimates �PECSE��
We have also evaluated our algorithm in terms of the signi�cant interval values P duration
�P�DUR�� PR interval �PR�INT�� QRS duration �QRS�DUR� and QT interval �QT�INT�� The
evaluation has been done in terms of the mean and standard deviation of the di�erences between
intervals estimated by our algorithm �ME� and a� the intervals measured from the mean referee
estimates of CSE database �RECSE�� or b� the intervals measured from the mean program estimates��

of CSE database �PECSE�� In table � we present these results together with the interval measure
tolerances� mean ��tol� and standard deviation ��tol� reported in ����� The value no refers to the
number of measured beats available in the CSE database for comparisons�
ME PECSE
PDUR QRSDUR PRINT QTINT
no ��� �� ��� ��
��ms� ����� �� � ���� ������
��ms� ������ ����� �� �� ��� ��
ME RECSE
PDUR QRSDUR PRINT QTINT
no � � � �
��ms� ����� ���� ���� ����
��ms� ����� �� � ���� �����
Error limit tolerances for programs ����
�tol�ms� ���� ��� ��� ���
�tol�ms� ��� �� �� ����
Table � Evaluation results� comparing the ECG interval values measured from the waveform
boundary method estimates �ME� with those measures from the mean referee estimates �RECSE�
and with the mean program estimates �PECSE��
From this table we see that the interval measures obtained with the proposed method have mean
di�erences and standard deviations within the expert tolerance limits�
� Conclusions
Our algorithm for locating waveform boundaries in the ECG has been shown to be robust when
noise is present� The multilead QRS detector retains the single�lead QRS information� rejecting
��

those detections that can be identi�ed as erroneous when compared with other leads� which are not
possible to reject using only one lead� The availability of single�lead QRS detection marks permits
the use of a single�lead procedure for boundary detection� this procedure in turn permits recovery
of the temporal projections of cardiac electrical activity� The �nal decision is taken on the basis
that the larger temporal duration of a wave in one lead should not di�er signi�cantly from at least
a subset of the other leads� allowing the algorithm to reject erroneous measurements due to noise�
and to detect the larger temporal projection of the wave that is the �nal objective of the method�
The di culty of establishing an analytical rule that unambigously locates the wave boundaries
is solved in this work through a threshold that is adjusted by a constant �k� to be in the highest
possible agreement with manual expert measurement� Using additional training data might lead
to minor adjustments in the value of k� but we would not expect signi�cant changes �since the
ECG records of the CSE database already contain a large variety of ECG morphologies�� We have
shown that the measurements of clinically important intervals obtained using our algorithm are
comparable in accuracy with those obtained by human experts� In particular� our algorithm agrees
better with human expert measurements of the end of the T wave than did the algorithms studied
by the CSE� It is important to note� however� that these �ndings were obtained using only the
limited number of ECG records included in the CSE database�
The information about waveform shape obtained with this method is very useful for ECG
classi�cation and cardiac diagnosis� The detection of the T wave onset allows further measures
of the ST segment ����� The interval values� wave amplitudes� patterns of P� QRS and T waves�
and wave presence or absence� could be used to help cardiac diagnosis presenting statistical and
trend displays to the medical expert� Also this information can be the input to a system that allows
automatic cardiac diagnosis from ECG analysis� The algorithm at present works on either on a
VMS station or a UNIX machine taken as inputs the digitized ECG records�
��

� References
�� Nyg�ards M�E�� and S!ornmo L� ������� "Delineation of the QRS complex using the envelope
of the e�c�g�#� Med� � Biol� Eng� � Comput� ��� ��������
�� Laguna P�� Thakor N�V�� Caminal P�� Jan�e R�� and Hyung�Ro Y� ���� � "New algorithm
for QT interval analysis in �� hour Holter ECG Performance and applications#� Med� �
Biol� Eng� � Comput� �� ������ ��� �
�� Willems J�L� et al� ������ "Assessment of the performance of electrocardiographic computer
programs with the use of a reference database#� Circulation� �� ��������
�� Willems J�L� et al ���� � "Common Standards for Quantitative Electrocardiography Goals
and main results# Meth� Inform� Med� ��� ��������
�� Willems J�L�� Zywietz C�� Arnaud P�� Van Bemmel J�H�� Degani R�� and Macfarlane W�
�����a� "In�uence of noise on wave boundary recognition by ECG measurement programs#�
Computers and Biomedical Research� ��� ��������
�� Laguna P�� Bogatell E�� Jan�e R�� and Caminal P� ������ "Automatic detection of
characteristic points in the ECG# Proc� of the IV Int� Symposium on Biomedical
Engineering�� Pe$niscola� Spain� ��������
�� Laguna P�� Vigo D�� Jan�e R�� and Caminal P� ������ "Automatic wave onset and o�set
determination in ECG signals Validation with the CSE database# In Computers in
Cardiology� IEEE Society Press� ������ �
�� Willems J�L�� Arnaud P�� Van Bemmel J�H�� Bourdillon P�J�� Degani R�� Denis B�� Graham
I�� Harms F�M�A�� Macfarlane W�� Mazzocca G�� Meyer J�� and Zywietz C� �����b� "A
reference data base for multilead electrocardiographic computer measurement programs#�
Journal of American College of Cardiology� ��� no �� ����������
�� The CSE working party ������ "Recomendations for measurement standards in
quantitative electrocardiography#� European Heart Journal� � ��������
�

� � Pan J�� and Tompkins W�J� ������ "A real�time QRS detection algorithm#� IEEE Trans�
Biomed� Eng�� BME���� n� �� �� �����
��� Lynn P�A�� ������ "Online digital �lters for biological signals some fast designs for a small
computer#� Med� � Biol� Eng� � Comput��� �� ������ �
��� Webster J�G�� ������ "Enciclopedia of medical devices and instrumentation#� John Wiley
� ons� New York�
��� Thakor N�V�� Zhu Y�� and Pan K� ���� � "Ventricular Tachycardia and Fibrillation
Detection by a Sequential Hypothesis Testing Algorithm#� IEEE Trans� Biomed� Eng��
�� n� �� ��������
��� Willems J�L� ������ "Common standards for quantitative electrocardiography� CSE
multilead atlas#� Leuven� ACCO Publ� ������
��� Zywietz C�� and Celikag D� ������ "Testing results and derivation of minimum performance
criteria for computerized ECG�analysis#� Computers in Cardiology� IEEE Computer Society
Press� Venecia� ���� �
ACKNOWLEDGEMENTS
The authors want to acknowledge to Eudald Bogatell and David Vigo by their contribution to
the implementation and validation of the method� Also they greatly thank George B� Moody from
the Massachusetts Institute of Technology �MIT�� U�S�A� by his review and english editing of the
paper that made it improved�
��