utjecaj kise polimerni
DESCRIPTION
ddTRANSCRIPT

Abstract—This paper presents the results of electric field and
potential distributions simulation along surface of silicone
rubber polymer insulators. Finite element method (FEM) is
adopted for this paper. Identification of the electrical field and
the potential distributions at the dielectric insulation has always
been important; The water droplets increase the electric field
strength at the insulator surface because of their high
permittivity and conductivity, at first the results of water
droplets existing on the surface of silicone rubber materials has
been investigated and electric field distribution along the
surface are shown. Then Different Thickness and conductivity
of pollution layer on polymer insulator has been considered and
electrical field distribution has been analyzed.
Index Terms—Electric field, silicon rubber, FEM,
conductivity, pollution layer.
I. INTRODUCTION
Highlight The pollution performance of polymer insulators
is well known. The polymer insulators are more susceptible
to chemical changes, because of the weak bonds of polymer
materials. During the service life of an insulator the
combined effects of electric and environmental stresses such
as the energizing voltage, corona and arcing. The water
droplets play several roles in the pollution flashover and
aging of composite insulators, because of high permittivity
and conductivity of water droplets, electric field intensity
increase at the insulator surface. The surface corona
discharges from water droplets age the weather shed material
of the insulator [1], [2]. The corona discharge demolishes the
hydrophobicity causing the dispersed of water and adjacent
water droplets to coalesce. One of the ageing mechanisms
responsible for the failure of the insulators is Discharges on
the surface of polymeric insulators [3]. The discharges
usually take place between water drops on the surface of
insulators and create several radicals and ionized species that
may chemically react with the insulator surface so, change
the original properties of the insulator material. The situation
is further aggravated by the high temperature of such
discharges which thermally degrades the insulator surface
[3]. These effects and Changes in the surface properties of
material may cause flashover of the insulator. Recognize of
electrical field and potential distribution at the dielectric
insulation has always been important as a result of the general
necessity to reduce the physical size of HV systems and to
Manuscript received October 24, 2012; revised November 25, 2012.
The authors are with High Voltage Research Center, School of Electrical
and Computer Engineering, University of Tehran, Tehran, Iran. (E-mail:
[email protected], [email protected], [email protected]).
ensure a high degree of reliability in operation. Improvement
of HV systems reliability demands progress in the design
criteria as well as a better understanding of the insulation
behavior [4]. At higher voltages field can be high enough to
cause damage to the insulator sheath due to the corona
discharge, hence grading devices need to be used to reduce
the electric field to acceptable levels [5]. Calculation of stress
levels on an insulator when subjected to a high voltage
provides an important insight into the safety measures
pertaining to high voltage transmission lines. If the E-field
magnitude in any regions exceeds critical values, excessively
large magnitudes of discharge activity can ensue, and the
long or short term performance of the insulator may be
affected, there is a direct relationship between the E-field
distribution and the resulting discharge activity within
composite insulators. The presence, location and magnitude
of discharges are a function of the magnitude and direction of
the local E-field [6]. Under rain and fog conditions, the
presence of water droplets intensifies the electric field
strength on the surface of a polymer insulator. As a result, the
surface corona discharges from water droplets accelerate the
aging of the shed material of a polymer insulator. The study
of the electric field and voltage distributions of polymer
insulators under wet conditions is important for the in-depth
understanding of the aging process and the pollution
flashover beginning mechanism for polymer insulators [7].
The objective of this paper is to study the electric field
enhancement effects by water droplets on the surface of
polymer insulator, and to calculate the electric field
distribution along a polymer insulator under different
conditions of water droplet, and investigate the effect of
thickness and conductivity of pollution layer with 3-D
simulation with FEM, because of the presence of water
droplets at the surface of polymer insulator.
II. PROCEDURE OF SIMULATION
In order to analysis affects of contaminants on surface of
polymer insulator, 3-D calculation method is applied. For the
studies described in this paper, Comsol program has been
employed. Voltage, electric field distribution and maximum
electric field are examined by results of calculation.
Submit your manuscript electronically for review.
A. Equations for Electric Field and Potential
Distributions Calculation
Simply way for electric field distribution calculation is
calculate electric potential distribution. Then, electric field
distribution is calculated by minus gradient of electric
Electric Field Distribution under Water Droplet and Effect
of Thickness and Conductivity of Pollution Layer on
Polymer Insulators Using Finite Element Method
I. A. Joneidi, A. A. Shayegani, and H. Mohseni
266
International Journal of Computer and Electrical Engineering, Vol. 5, No. 2, April 2013
DOI: 10.7763/IJCEE.2013.V5.710

potential distribution. Due to electrostatic field distribution,
electric field distribution can be written as follows [8]:
E V (1)
From Maxwell’s equation:
.E
(2)
where ρ is resistivity /m,
ε is dielectric constant of dielectric material
0 is air dielectric constant ( 8.85×10 -12 F/m)
r is relative dielectric constant of dielectric material
Place equation (1) in equation (2) obtained Poisson’s
equation.
. V (3)
Without space charge ρ=0, Poisson’s equation becomes
Laplace’s equation.
. 0V (4)
B. Equation for FEM Analysis
The calculation of the electric potential at every knot in the
total network composed of many triangle elements was
carried out by minimizing the function W(v), that is:
2 210 ( )2 22
WV V Vj r drdz
V V r rr zii i
(5)
C. Characteristic of Composite Insulator for Fem
Analysis
Composite insulators essentially consist of a fiberglass
core rod covered by weather sheds of silicone rubber and
equipped with metal end fittings, the basic design of a
polymer insulator is as follows; a fiber reinforced plastic
(FRP) core having relative dielectric constant 6, attached
with two metal fittings, is used as the load bearing structure.
Weather sheds made of HTV silicone rubber having relative
dielectric constant 4.5 are installed outside the FRP core.
Surrounding of the insulator is air having relative dielectric
constant 1, AC 20 kV is energized on the lower electrode
while the upper electrode connected with ground.
III. EFFECT ON WATER DROPLETS ON ELECTRIC DISTRIBUTION
There are three main regions of interest when considering
the E-field distribution of composite insulators.
1) On the surface of, and in the air surrounding, the
polymer weather-shed surface and surrounding the
end-fitting seal [9].
2) Within the fiberglass rod and polymer rubber
weather-shed material, as well as at the interfaces between
these materials and the metal end fitting.
3) On the surface of, and in the air surrounding the metallic
end fittings and attached corona rings [10]-[12]. If the E-field
magnitude in any of these three regions exceeds critical
values, excessively large magnitudes of, discharge activity
can ensue, and the long or short term performance of the
insulator may be affected. There is a direct relationship
between the E-field distribution and the resulting discharge
activity on and within composite insulators. The presence,
location and magnitude of discharges are a function of the
magnitude and direction of the local E-field. In this paper we
investigate the effect of droplet on the insulators in two
stages.
A. Water Droplets on the Shed
In order to examine electric field distribution by water
droplets, 3 water droplets exposed to the shed of insulator,
and electric field distribution are investigated. The distances
between droplets are 1.5mm. The placements of droplets on
sheet of insulator are shown in Figure 1.
From Figure (2-8) shows electric field analysis result, it can
be found that the maximum of the electric field appeared at
the beginning and end of polymer insulator.
Fig. 1. The placement of droplets on sheet of insulator
The results of figure (2-7) are evident that electrical field
changes along the horizontal line are due to the change in the
dielectric constant of dielectric. The E-field distribution on
composite insulators is nonlinear with the regions close to the
energized end normally being subjected to the highest
magnitudes, for most transmission line applications, the
dominant direction of the E-field is along the axis of the
insulator. As can be seen from figures the magnitude of the
E-field close to the energized end is higher than that at the
grounded end. Increasing the number of droplets on the
insulator surface causes non-uniform field in insulator.
Increasing of electrical field and non-uniform field in long
term periods cause adverse effects on electrical insulators.
Fig. 2. Compare of electrical field distribution along the sheet with one drop
and without drop
Fig. 3. Compare of electrical field distribution along the sheet with two drops
and without drop
0 0.05 0.1 0.15 0.2 0.25 0.3 0.350
0.1
0.2
0.3
0.4
Line along the Sheet
Ele
crti
cal
Fie
ld (
KV
/mm
)
Without drop
one drop
0 0.05 0.1 0.15 0.2 0.25 0.3 0.350
0.1
0.2
0.3
0.4
Line along the Sheet
Ele
crtic
al F
ield
(K
V/m
m)
Without drop
Two drop
267
International Journal of Computer and Electrical Engineering, Vol. 5, No. 2, April 2013

Fig. 4. Compare of electrical field distribution along the sheet with three drops and without drop
Fig. 5. Compare of electrical field distribution along the sheet with one drop and without drop (m)
Fig. 6. Compare of electrical field distribution along the sheet with two drops and without drop (m)
Fig. 7. Compare of electrical field distribution along the sheet with three drops and without drop (m)
B. Water Droplets on the Sheath
The placements of droplets on sheath of insulator are
shown in Figure 8.
Fig. 8. The placement of droplets on sheath of insulator
Fig. 9. Compare of electrical field distribution along the sheath with one drop
and without drop along line A
Fig. 10. Compare of electrical field distribution along the sheath with two
drop and without drop along line A
Fig. 11. Compare of electrical field distribution along the sheath with three
drop and without drop along line A
Fig. 12. Compare of electrical field distribution along the sheath with one
drop and without drop along line B
Fig. 13. Compare of electrical field distribution along the sheath with two
drop and without drop along line B
0 0.05 0.1 0.15 0.2 0.25 0.3 0.350
0.1
0.2
0.3
0.4
Line along the Sheet
Ele
crtic
al F
ield
(K
V/m
m)
Without drop
Three drops
0 0.05 0.1 0.15 0.2 0.25 0.3 0.350
0.1
0.2
0.3
0.4
0.5
Line along the Sheet
Ele
ctri
cal
Fie
ld (
KV
/mm
)
Without drop
One drop
0 0.05 0.1 0.15 0.2 0.25 0.3 0.350
0.1
0.2
0.3
0.4
0.5
Line along the Sheet
Ele
ctri
cal F
ield
(K
V/m
m)
Without drop
Two drops
0 0.05 0.1 0.15 0.2 0.25 0.3 0.350
0.1
0.2
0.3
0.4
0.5
Line along the Sheet
Ele
ctri
cal F
ield
(K
V/m
m)
Without drop
Two drops
0 0.05 0.1 0.15 0.2 0.250
0.1
0.2
0.3
0.4
0.5
Lenght (m)
Elec
trica
l Fie
ld (K
V/m
m)
Without drop
one drop
0 0.05 0.1 0.15 0.2 0.250
0.1
0.2
0.3
0.4
0.5
Lenght (m)
Elec
trica
l Fie
ld (K
V/m
m)
Without drop
Two drops
0 0.05 0.1 0.15 0.2 0.250
0.1
0.2
0.3
0.4
0.5
Lenght (m)
Ele
ctri
cal F
ield
(K
V/m
m)
Without drop
Three drops
0 0.05 0.1 0.15 0.2 0.250
0.05
0.1
0.15
0.2
0.25
0.3
0.35
Lenght (m)
Elec
trica
l Fie
ld (K
V/m
m)
Without drop
One drop
0 0.05 0.1 0.15 0.2 0.250
0.05
0.1
0.15
0.2
0.25
0.3
0.35
Lenght (m)
Elec
trica
l Fie
ld (K
V/m
m)
Without drop
Two drops
268
International Journal of Computer and Electrical Engineering, Vol. 5, No. 2, April 2013
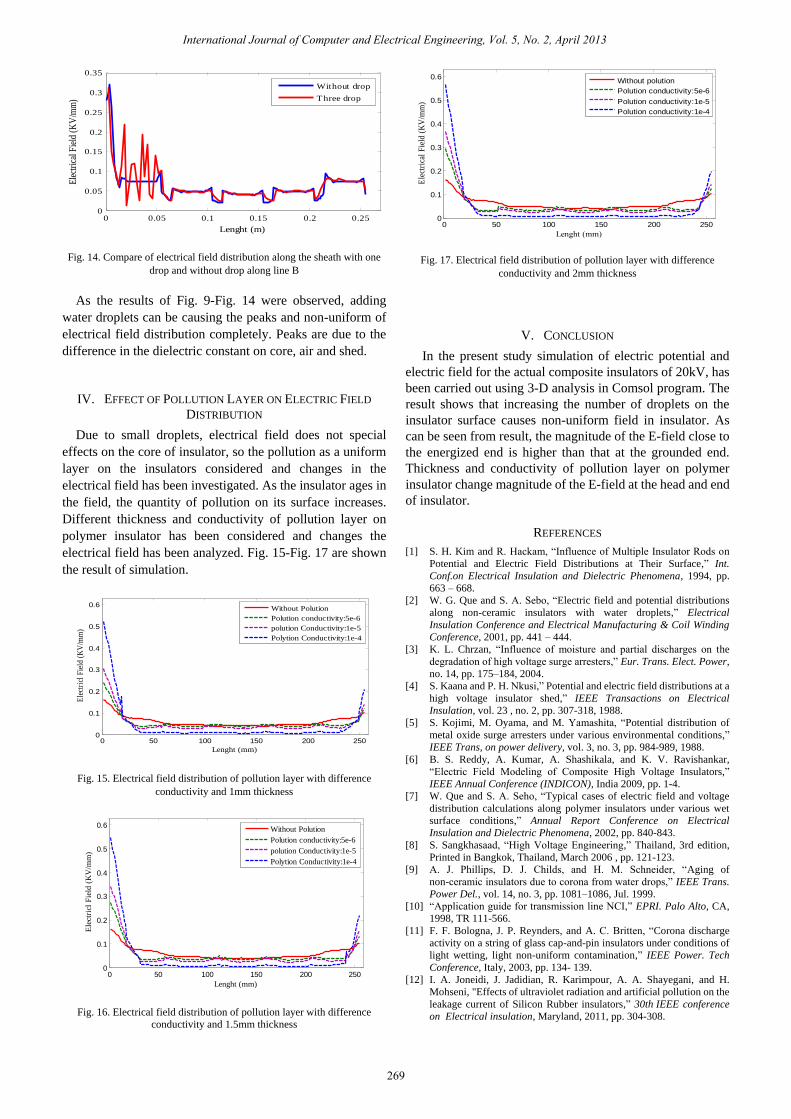
Fig. 14. Compare of electrical field distribution along the sheath with one
drop and without drop along line B
As the results of Fig. 9-Fig. 14 were observed, adding
water droplets can be causing the peaks and non-uniform of
electrical field distribution completely. Peaks are due to the
difference in the dielectric constant on core, air and shed.
IV. EFFECT OF POLLUTION LAYER ON ELECTRIC FIELD
DISTRIBUTION
Due to small droplets, electrical field does not special
effects on the core of insulator, so the pollution as a uniform
layer on the insulators considered and changes in the
electrical field has been investigated. As the insulator ages in
the field, the quantity of pollution on its surface increases.
Different thickness and conductivity of pollution layer on
polymer insulator has been considered and changes the
electrical field has been analyzed. Fig. 15-Fig. 17 are shown
the result of simulation.
Fig. 15. Electrical field distribution of pollution layer with difference
conductivity and 1mm thickness
Fig. 16. Electrical field distribution of pollution layer with difference
conductivity and 1.5mm thickness
Fig. 17. Electrical field distribution of pollution layer with difference
conductivity and 2mm thickness
V. CONCLUSION
In the present study simulation of electric potential and
electric field for the actual composite insulators of 20kV, has
been carried out using 3-D analysis in Comsol program. The
result shows that increasing the number of droplets on the
insulator surface causes non-uniform field in insulator. As
can be seen from result, the magnitude of the E-field close to
the energized end is higher than that at the grounded end.
Thickness and conductivity of pollution layer on polymer
insulator change magnitude of the E-field at the head and end
of insulator.
REFERENCES
[1] S. H. Kim and R. Hackam, “Influence of Multiple Insulator Rods on
Potential and Electric Field Distributions at Their Surface,” Int.
Conf.on Electrical Insulation and Dielectric Phenomena, 1994, pp.
663 – 668.
[2] W. G. Que and S. A. Sebo, “Electric field and potential distributions
along non-ceramic insulators with water droplets,” Electrical
Insulation Conference and Electrical Manufacturing & Coil Winding
Conference, 2001, pp. 441 – 444. [3] K. L. Chrzan, “Influence of moisture and partial discharges on the
degradation of high voltage surge arresters,” Eur. Trans. Elect. Power,
no. 14, pp. 175–184, 2004.
[4] S. Kaana and P. H. Nkusi,” Potential and electric field distributions at a
high voltage insulator shed,” IEEE Transactions on Electrical
Insulation, vol. 23 , no. 2, pp. 307-318, 1988.
[5] S. Kojimi, M. Oyama, and M. Yamashita, “Potential distribution of
metal oxide surge arresters under various environmental conditions,”
IEEE Trans, on power delivery, vol. 3, no. 3, pp. 984-989, 1988.
[6] B. S. Reddy, A. Kumar, A. Shashikala, and K. V. Ravishankar,
“Electric Field Modeling of Composite High Voltage Insulators,”
IEEE Annual Conference (INDICON), India 2009, pp. 1-4.
[7] W. Que and S. A. Seho, “Typical cases of electric field and voltage
distribution calculations along polymer insulators under various wet
surface conditions,” Annual Report Conference on Electrical
Insulation and Dielectric Phenomena, 2002, pp. 840-843.
[8] S. Sangkhasaad, “High Voltage Engineering,” Thailand, 3rd edition,
Printed in Bangkok, Thailand, March 2006 , pp. 121-123.
[9] A. J. Phillips, D. J. Childs, and H. M. Schneider, “Aging of
non-ceramic insulators due to corona from water drops,” IEEE Trans.
Power Del., vol. 14, no. 3, pp. 1081–1086, Jul. 1999.
[10] “Application guide for transmission line NCI,” EPRI. Palo Alto, CA,
1998, TR 111-566.
[11] F. F. Bologna, J. P. Reynders, and A. C. Britten, “Corona discharge
activity on a string of glass cap-and-pin insulators under conditions of
light wetting, light non-uniform contamination,” IEEE Power. Tech
Conference, Italy, 2003, pp. 134- 139.
[12] I. A. Joneidi, J. Jadidian, R. Karimpour, A. A. Shayegani, and H.
Mohseni, "Effects of ultraviolet radiation and artificial pollution on the
leakage current of Silicon Rubber insulators,” 30th IEEE conference
on Electrical insulation, Maryland, 2011, pp. 304-308.
0 0.05 0.1 0.15 0.2 0.250
0.05
0.1
0.15
0.2
0.25
0.3
0.35
Lenght (m)
Ele
ctri
cal F
ield
(K
V/m
m)
Without drop
Three drop
0 50 100 150 200 2500
0.1
0.2
0.3
0.4
0.5
0.6
Lenght (mm)
Ele
ctri
cl F
ield
(K
V/m
m)
Without Polution
Polution conductivity:5e-6
polution Conductivity:1e-5
Polytion Conductivity:1e-4
0 50 100 150 200 2500
0.1
0.2
0.3
0.4
0.5
0.6
Lenght (mm)
Ele
ctri
cl F
ield
(K
V/m
m)
Without Polution
Polution conductivity:5e-6
polution Conductivity:1e-5
Polytion Conductivity:1e-4
0 50 100 150 200 2500
0.1
0.2
0.3
0.4
0.5
0.6
Lenght (mm)
Ele
ctri
cal
Fie
ld (
KV
/mm
)
Without polution
Polution conductivity:5e-6
Polution conductivity:1e-5
Polution conductivity:1e-4
269
International Journal of Computer and Electrical Engineering, Vol. 5, No. 2, April 2013

270
International Journal of Computer and Electrical Engineering, Vol. 5, No. 2, April 2013
Iman Ahmadi Joneidi was born in Ghaemshahr, Iran,
in 1984. He received his B.S degree in Noshirvani
University of Technology, Babol, Iran in 2007 and
M.Sc. degrees in electrical engineering from the
University of Tehran, Tehran, Iran, in 2010. Since 2007
to now, he has been with the High Voltage laboratory.
His areas of interest are electrical insulation and
dielectrics partial discharge diagnostics. He has been a researcher of the Iran
Power Generation and Transmission Company (TAVANIR). Now he is as a
researcher at Niroo Research Institute (NRI).
Amir Abbas Shayegani Akmal received the B.Sc.
degree from the Sharif University of Technology,
Tehran, Iran in 1996 and M.Sc. and Ph.D. from the
University of Tehran in 1998 and 2005, respectively all
in electrical engineering. He worked at the High Voltage
Laboratory of the Sharif University of Technology and
University of Tehran, as assistant. He worked toward his
Ph.D. through the cooperation between the University of
Tehran and University of Hannover (Schering- Institute). Currently, he is an
Assistant Professor at Electrical and Computer Engineering Department of
University of Tehran. He works in high voltage laboratory and his principal
research interest is in high voltage insulation systems, testing, and
diagnostics.
Hossein Mohseni received the Dipl. Ing and Dr. Techn
from Technical University Graz, Austria in 1971 and
1975, respectively. From 1971 to 1976 he was with ELIN
UNION AG Austria, working as testing and research
engineer in the High Voltage Laboratory and the
Transformer R and D Department. In 1976 he joined the
Faculty of Engineering, University of Tehran,
Department of Electrical Engineering where is currently a
Professor and teaches high voltage engineering, high voltage insulation
technology, and transients in power System and Apparatus. During 1981/82
he was the chairman of Department of electrical engineering at the
University of Tehran. Since 1980 he has been a technical consultant of the
Iran Power Generation and Transmission Company (TAVANIR). Also since
1998 he is the dean of the High Voltage and Pulsed Power research center, at
the University of Tehran.