utilization of satellite data at the met office (uk)
TRANSCRIPT

© Crown copyright Met Office
Utilization of satellite data at the Met Office (UK)
Simon J. KeoghWMO ET-SUP, Geneva, 27-30 May 2013.

Contents
• Numerical Weather Prediction
• Imagery for Forecasting Applications
• Ocean Forecasting Applications
• Climate Service Applications
• Summary
© Crown copyright Met Office

NUMERICAL WEATHER PREDICTION (NWP)
© Crown copyright Met Office

33km ensemble
1.5km modelUp to 36hr f/c3-hourly update
4.4km modelUp to 120hr f/c
2.2km ensembleUp to 36hr f/c6-hourly update
Production NWP (end FY2013-14)
12km NAE18km MOGREPS-R
17km modelUp to 144hr f/c6-hourly update
33km ensembleUp to 3day f/c6-hourly update
60km coupled modelUp to 6 monthsDaily lagged ensemble
Up to 120hr f/c6-hourly update

Dec 12• MetOp-B GRAS
Jan 13• Correlated observation errors for IASI � reduced obs error variances• Variable obs errors for ATOVS (depending on scan angle, surface type, …) • OSCAT winds - from scatterometer on India's Oceansat-2• Radio occultation observations from new satellite, CNOFS
Recent upgrades in the use of satellite data in NWP
© Crown copyright Met Office
• Radio occultation observations from new satellite, CNOFS• Revised radio occultation observation errors• Revised AMV thinning• Clear-sky radiances from GOES-15• MetOp-B ATOVS (NB: We started receiving NRT Metop-B AMSU/MHS data on 1st Nov
2012 following launch only a few weeks earlier on 17th Sept 2012!)
Feb 13• MetOp-B IASI
April 13• MetOp-B ASCAT (The final MetOp-B instrument to be utilised for us)• Suomi NPP ATMS & CrIS• MODIS Aerosol Optical Depth

Forecast impacts in component tests:full observing system plus ATMS and CrIS
Verification versus OBS
Verificationversus ANALYSIS
+ATMS
+CrIS
© Crown copyright Met Office
Consistently +ve impacts from ATMS and CrIS, various configurations tested
+CrIS
+ATMS +CrIS
~+0.4
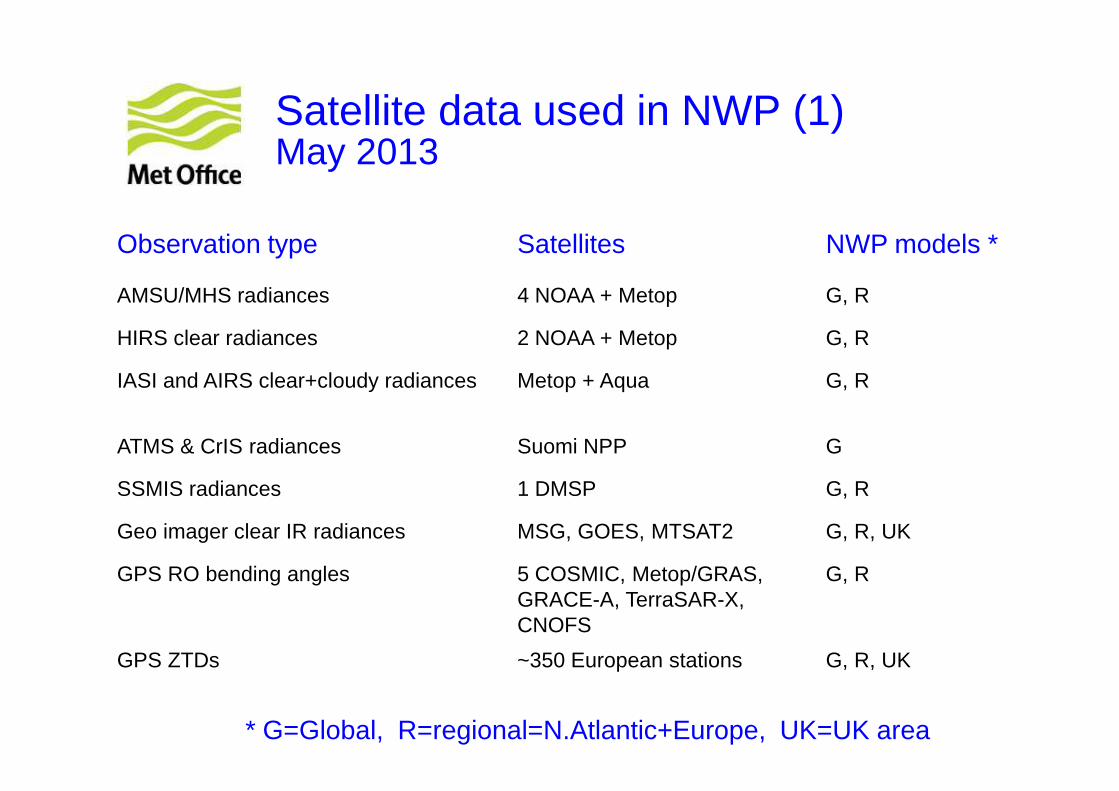
Satellite data used in NWP (1)May 2013
Observation type Satellites NWP models *
AMSU/MHS radiances 4 NOAA + Metop G, R
HIRS clear radiances 2 NOAA + Metop G, R
IASI and AIRS clear+cloudy radiances Metop + Aqua G, R
ATMS & CrIS radiances Suomi NPP G
SSMIS radiances 1 DMSP G, R
Geo imager clear IR radiances MSG, GOES, MTSAT2 G, R, UK
GPS RO bending angles 5 COSMIC, Metop/GRAS, GRACE-A, TerraSAR-X, CNOFS
G, R
GPS ZTDs ~350 European stations G, R, UK
* G=Global, R=regional=N.Atlantic+Europe, UK=UK area
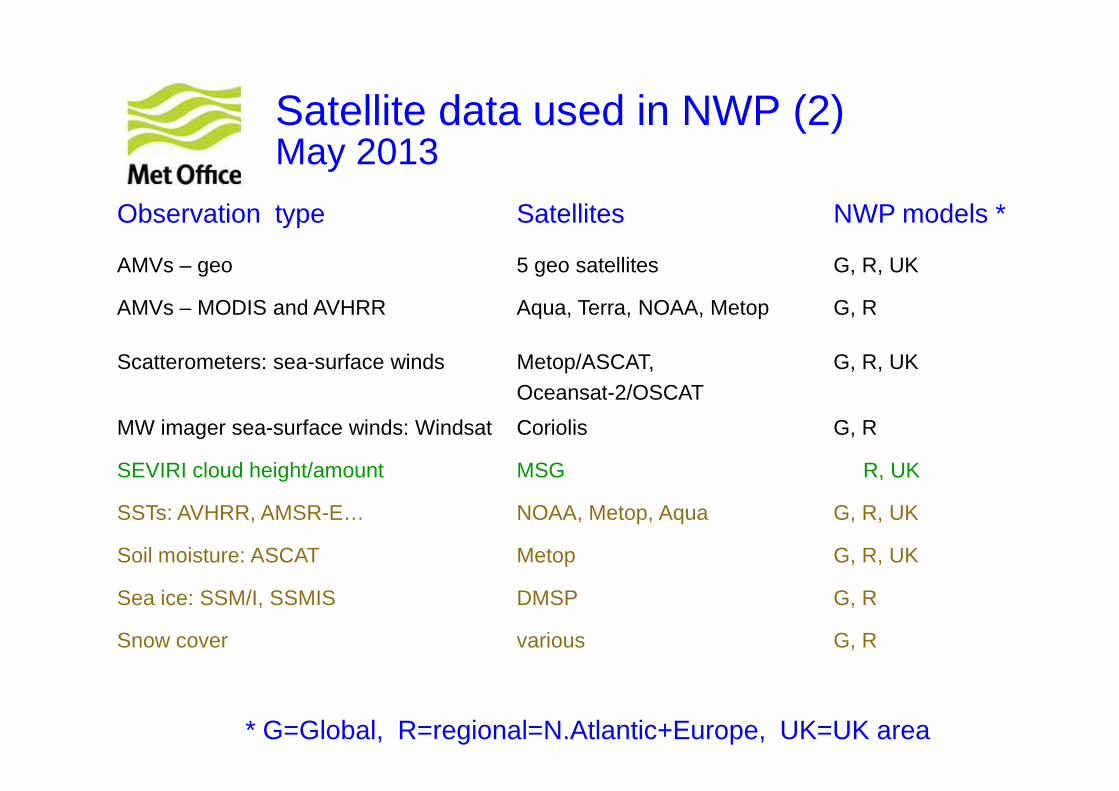
Satellite data used in NWP (2)May 2013
Observation type Satellites NWP models *
AMVs – geo 5 geo satellites G, R, UK
AMVs – MODIS and AVHRR Aqua, Terra, NOAA, Metop G, R
Scatterometers: sea-surface winds Metop/ASCAT, Oceansat-2/OSCAT
G, R, UKOceansat-2/OSCAT
MW imager sea-surface winds: Windsat Coriolis G, R
SEVIRI cloud height/amount MSG R, UK
SSTs: AVHRR, AMSR-E… NOAA, Metop, Aqua G, R, UK
Soil moisture: ASCAT Metop G, R, UK
Sea ice: SSM/I, SSMIS DMSP G, R
Snow cover various G, R
* G=Global, R=regional=N.Atlantic+Europe, UK=UK area

IMAGERY FOR WEATHER FORECASTING APPLICATIONS
© Crown copyright Met Office

Recent updates to our imagery for forecasters
Existing products include:
• Cloud top pressure/height, Fog, Ice, Water Vapour, IR, Visible from SEVIRI, MODIS, AVHRR and imagers on MTSAT and GOES
• Lightning imagery
New imagery products for forecasters:• Volcanic ash products via optimal estimation
• Ash cloud-top pressure, ash column amount, particle size• Imagery from VIIRS on Suomi-NPP• Imagery from FY-3 series satellites
© Crown copyright Met Office

Utilization of imagery
• Internal website (Showcase) to show our new imagery developments. This is the start of the “imagery lifecycle”
• Forecaster Desktop (SWIFT) allows forecasters to • Forecaster Desktop (SWIFT) allows forecasters to overlay imagery on other types of geospatial information (e.g. Forecast data, conventional observations, road/rail maps etc). Only the most useful satellite imagery will be imported into this tool due to the need to manage data volumes.
© Crown copyright Met Office

Dust RGB Ash(-top)
heightImproved detection
1D-Var scheme developed to retrieve quantitative volcanic ash information from SEVIRI dataUses channels at 10.8 µm, 12.0 µm and 13.4 µm
© Crown copyright Met Office
Ash size
Ash column loading
Francis, P., M. Cooke and R. Saunders (2012), Journal of Geophysical Research, 117.

Lightning Imagery
© Crown copyright Met Office
Cloud data is from MSG satellite. Lightning data is from our ATDnet network

Indian Ocean imagery
• Currently using the ageing Meteosat-7
• Very important for the generation of Atmospheric Motion Vectors
• Useful for general • Useful for general forecasting
• Also valuable for collection of DCP data from buoys etc
• We could do with an additional (more modern) satellite in this location with this capability
© Crown copyright Met Office

VIIRS imagery
© Crown copyright Met Office
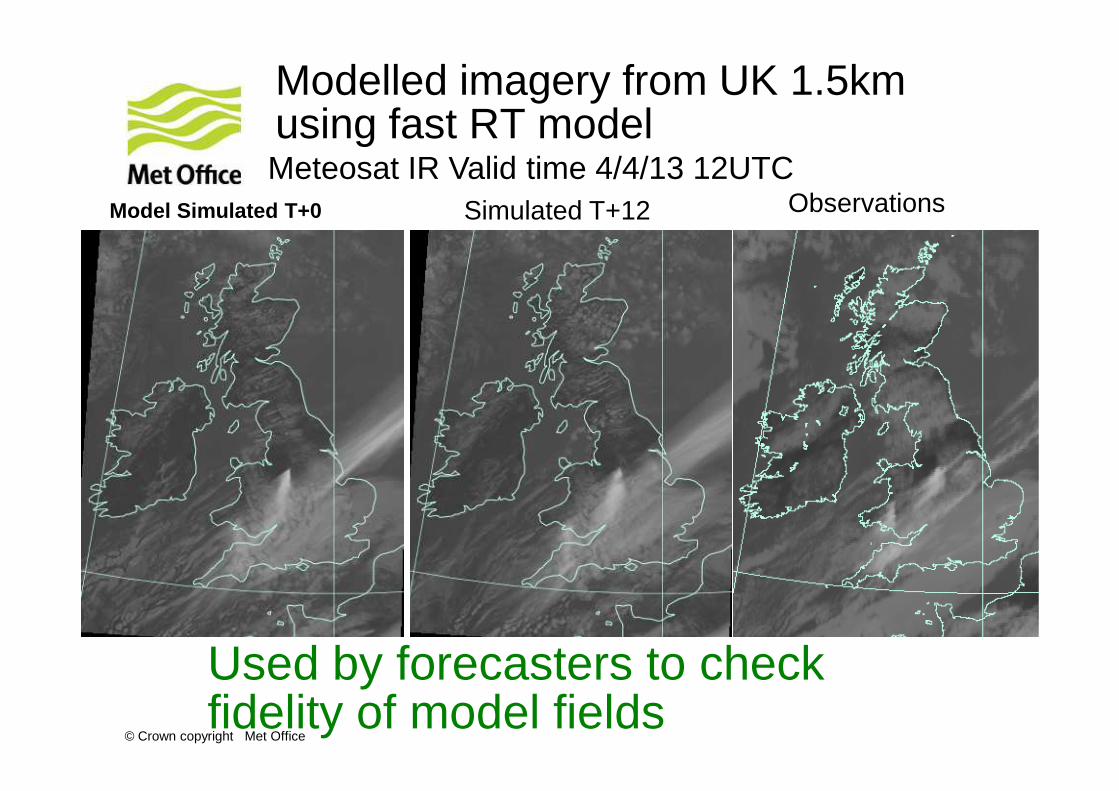
Modelled imagery from UK 1.5kmusing fast RT model
Model Simulated T+0
Meteosat IR Valid time 4/4/13 12UTCObservationsSimulated T+12
© Crown copyright Met Office
Used by forecasters to check fidelity of model fields

OCEAN FORECASTING APPLICATIONS
© Crown copyright Met Office

SST gradients, Gulf Stream, March 2012
• Used by ECMWF, DWD & Meteo-France for NWP
• Uses OSI-SAF ice analyses • Satellite bias correction was
based on AATSR; now uses MetOp AVHRR; will use SLSTR
OSTIA - Operational Sea-surface Temperature and sea-Ice Analysis
© Crown copyright Met Office© Crown copyright Met Office
Old system
New system
Observation type
RMS
Old New
Drifters 0.52 0.37
AATSR 0.45 0.37
Argo 0.47 0.43
SLSTR • New version implemented on
17 Jan 2013
Obs-background stats, March 2012

FOAM (Forecasting Ocean Assimilation Model)
• Our operational ocean forecasting system is called FOAM (Forecasting Ocean Assimilation Model). Running operationally since 1997.
• FOAM is run for the deep ocean (globally and basin-scale) and for shelf-seas. Described in Storkey et al. 2010, and O’Dea et al. 2012. The current operational FOAM system consists of:
• Ocean model (NEMO).
• Sea Ice model (LIM2).
• Data assimilation (Analysis Correction scheme);
• Quality control
• Flux processing
• Main users of the ocean information include:
• Royal Navy, MyOcean users (a large European project to provide operational ocean forecast data), Ship routing, oil spill, search and rescue.
• Currently working on developing coupled use within NWP systems (as the lower boundary condition).
• Initial conditions for the GloSea system generated since Autumn 2012.
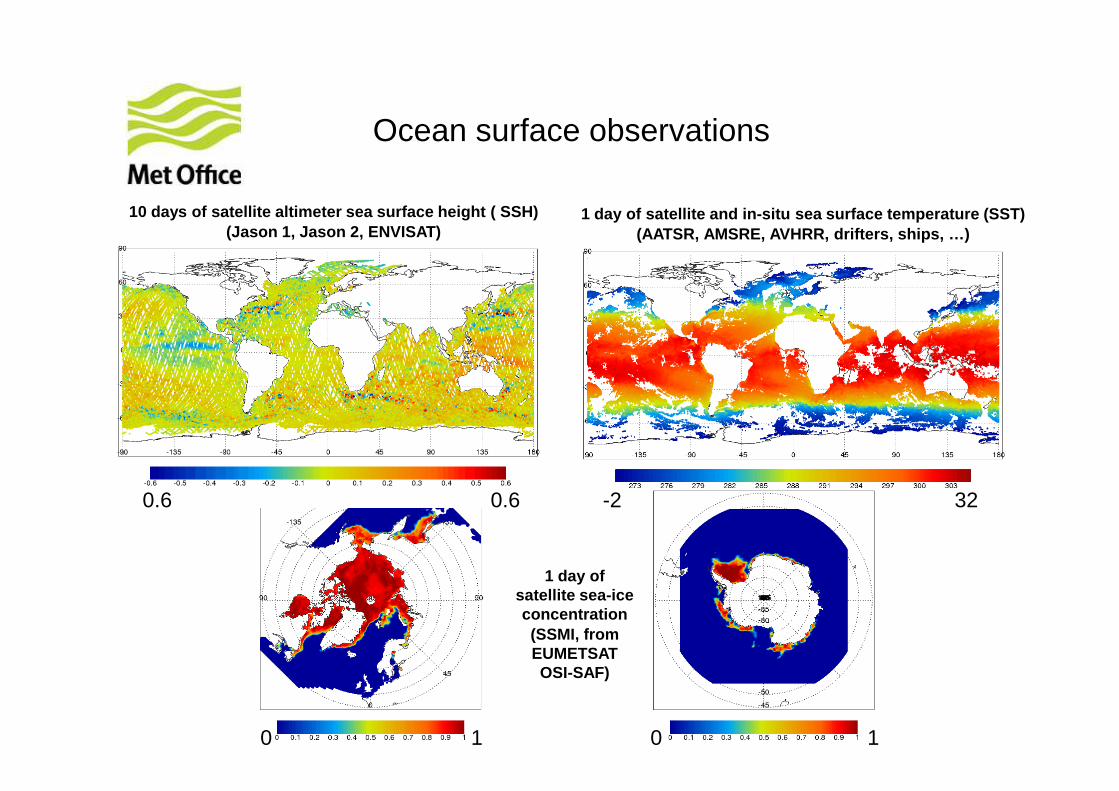
IntroductionOcean surface observations
10 days of satellite altimeter sea surface height ( SSH)(Jason 1, Jason 2, ENVISAT)
1 day of satellite and in-situ sea surface temperat ure (SST) (AATSR, AMSRE, AVHRR, drifters, ships, …)
0 1
1 day of satellite sea-ice concentration (SSMI, from EUMETSAT OSI-SAF)
-0.6 0.6 -2 32
0 1

GlobColour
Data Assimilation of Ocean Colour in an Operational Framework
1st Jan 2003
log 10(chlorophyll) errorNorth Atlantic
(mg/
m3 )
)
Error reduction
ESA CCI OC
-2 -1.5 -1 0-0.5 0.5log10(mg/m3)
RM
S e
rror
(lo
g 10(
mg/
m
Error reduction
Control GlobColour assim CCI assim 2003
The assimilation of OC data (regardless of its source) into global FOAM-HadOCC ORCA1 has a significant beneficial impact on the modelled chlorophyll, as the significant reduction in the rms error shows
CLIMATE APPLICATIONS
© Crown copyright Met Office

Satellite data in climate
•Sea Surface Temperature: ATSR, ATSR2, AATSR, AVHRR
•Radiation Budget: CERES, ISCCP-FD, ERBE, GERB
•Clouds/precipitation: ISCCP, CloudSat, CALIPSO, SSM/I, AMSR-E, TMI, MODIS, MISR, TRMM
© Crown copyright Met Office
•Land/ocean surface: MODIS, SEVIRI, QuikSCAT
•Cryosphere: SSMI, ENVISAT, CryoSat
•Other: GPS-RO
•Future
•EarthCARE, ESA-CCI.
Use not only driven by quality of products, but also by accessibility, documentation and format.

Model development: is the model improving? Look at SW radiation.
• Development of new Hadley Centre climate model
• Shortwave
Model 1-ISCCP Model 2-ISCCP
© Crown copyright Met Office
Model 1-CERES
• Shortwave radiation at TOA
• ISCCP � model improves
• CERES � model gets worse
Model 2-CERES
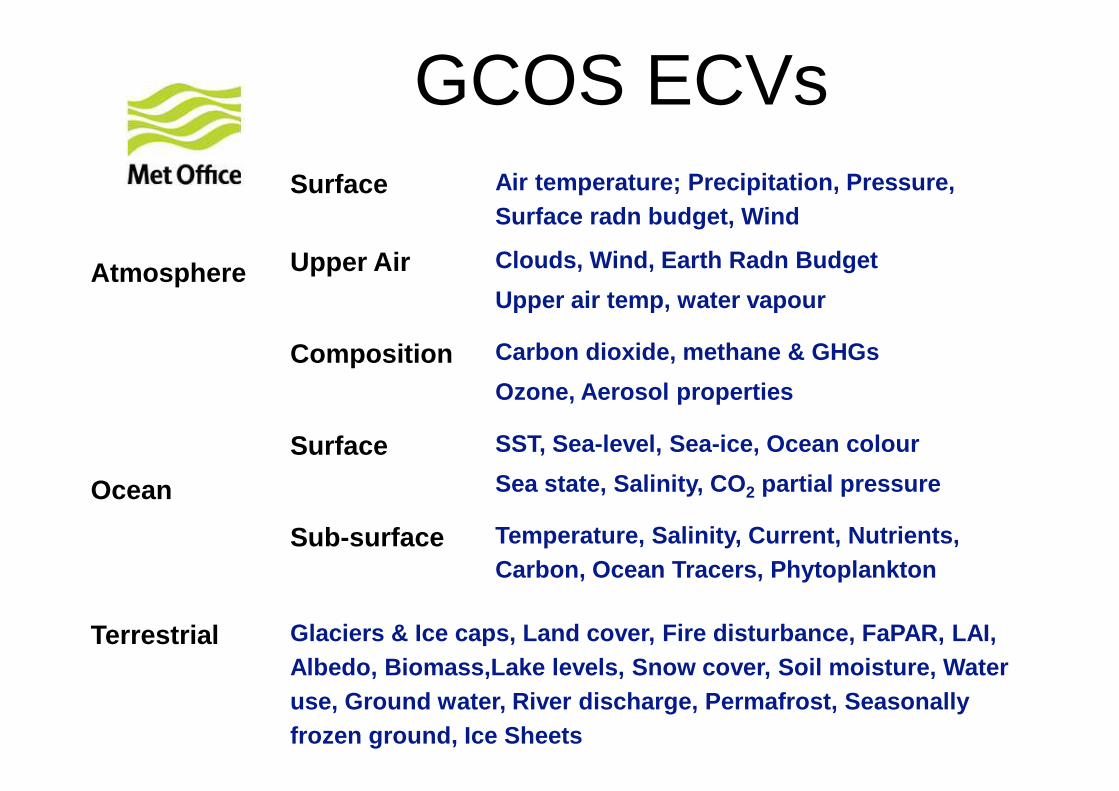
GCOS ECVs
Atmosphere
Surface Air temperature; Precipitation, Pressure, Surface radn budget, Wind
Upper Air Clouds, Wind, Earth Radn Budget
Upper air temp, water vapour
Composition Carbon dioxide, methane & GHGs
Ozone, Aerosol propertiesOzone, Aerosol properties
Ocean
Surface SST, Sea-level, Sea-ice, Ocean colour
Sea state, Salinity, CO 2 partial pressure
Sub-surface Temperature, Salinity, Current, Nutrients, Carbon, Ocean Tracers, Phytoplankton
Terrestrial Glaciers & Ice caps, Land cover, Fire disturbance, FaPAR, LAI, Albedo, Biomass,Lake levels, Snow cover, Soil moistu re, Water use, Ground water, River discharge, Permafrost, Sea sonally frozen ground, Ice Sheets

What ECVs are missing?
Atmosphere
Surface Air temperature , Precipitation, Pressure ,Surface radn budget, Wind
Upper Air Clouds, Wind, Earth Radn Budget
Upper air temp, water vapour
Composition Carbon dioxide, methane & GHGs
Ozone, Aerosol propertiesOzone, Aerosol properties
Ocean
Surface SST, Sea-level, Sea-ice, Ocean colour
Sea state, Salinity , CO2 partial pressure
Sub-surface Temperature, Salinity, Current, Nutrients, Carbon, Ocean Tracers, Phytoplankton
Terrestrial Glaciers & Ice caps, Land cover, Fire disturbance, FaPAR, LAI, Albedo, Biomass,Lake levels , Snow cover, Soil moisture, Water use, Ground water, River discharge, Permafrost, Seasonally frozen ground , Ice Sheets

SUMMARY
• Met Office is making active use of satellite data for NWP, Forecasting, Ocean Forecasting and Climate Applications
• MetOp-B and Suomi NPP are now assimilated operationally. Met-Op B ATOVS data were available from EUMETSAT so quickly in near real time that they were assimilated within only 120 days. It would be great if other satellite operators only 120 days. It would be great if other satellite operators could follow this example.
• It would be useful to have an additional geostationary satellite over the Indian Ocean which produces good quality AMVs and offers DCP communications services
• Use of products is not only driven by quality of products, but also by accessibility, documentation, format and ease of integration with existing systems (e.g. Forecaster desktops).
© Crown copyright Met Office

© Crown copyright Met Office
Thank you! Questions?