utilization of gene expression signature for quality control of traditional chinese medicine formula...
TRANSCRIPT
Research Article
Utilization of Gene Expression Signature for Quality Control of TraditionalChinese Medicine Formula Si-Wu-Tang
Chen Xie,1 Zhijun Wang,2 Charles Wang,4 Jun Xu,5 Zhining Wen,7 Haitian Wang,8 Leming Shi,3,6
Moses S. S. Chow,2 Ying Huang,2,9 and Zhong Zuo1,9
Received 15 October 2012; accepted 12 April 2013; published online 24 May 2013
Abstract. The current study utilized a combined pharmacokinetic and genomic approach to demonstratethe feasibility of a new quality control method by using a panel of special differentially expressed genes(DEGs) as unique fingerprint to serve as marker of in vivo bioactivity for a representative traditionalChinese medicine (TCM) formula, Si-Wu-Tang (SWT). The method involves firstly obtaining possible invivo active components, i.e., the “absorbable” components from the permeate of the Caco-2 monolayermodel to simulate oral administration of two specific SWT products (CU-SWT, J-SWT), their componentsingle herbs (Angelicae, Chuanxiong, Paeoniae, and Rehmanniae), and a standard mixture ofactive compounds (ferulic acid, ligustilide, senkyunolide A). Then, these respective absorbablecomponents were incubated with MCF-7 cells to determine the gene expression profile usingmicroarray processing/analysis as well as real-time PCR. From the available DEGs identifiedfollowing the incubation, the magnitude of change in DEGs by real-time PCR was found to beconsistent with that by microarray. The designated DEGs from the CU-SWT permeate were foundto be distinct from other 19 products. Furthermore, the changes in the DEGs resulting from MCF-7 cellstreated by eight replicate extracts of CU-SWT on three separate days were consistent. These resultsdemonstrated sufficient specificity and consistency of the DEG panel which could serve as a unique bioactive“fingerprint” for the designated SWTproduct. The presentmethod forDEGdeterminationmay be applied toother TCM products and with further definitive study can potentially provide a unique method for qualitycontrol of TCM in the future.
KEY WORDS: gene expression signature; pharmacokinetics; quality control; Si-Wu-Tang; traditionalChinese medicine.
INTRODUCTION
Chinese medicine, including traditional Chinese medicine(TCM) or TCM formula, has been widely used for preventionand treatment of diseases for over 2,000 years. Despite recentrenewed interest in the use of herbal medicine and TCMs forhuman health and disease, the lack of a standard or acceptablequality control (QC) method for these products has been adeterrent in the worldwide acceptance of their use (1).
The basic requirement for quality control of a medicinalproduct is its content and uniformity that can relate to itsactivity. The content represents the unique identity anduniformity represents the stability of the product. The qualitycontrol for TCM is complicated since its effect may resultfrom an integrative activity of a mixture of bioactivecompounds derived from various herbs present in the TCMor TCM formula. The current practice of QC relies primarilyon determination of the content and stability of certaindesignated chemical marker(s) of a given product. Thisapproach is inadequate since these marker(s) may not berelevant to the overall in vivo activity (2–4). Another practiceof QC is to use the chemical fingerprint. Identification of
Electronic supplementary material The online version of this article(doi:10.1208/s12248-013-9491-5) contains supplementary material,which is available to authorized users.1 School of Pharmacy, Faculty of Medicine, The Chinese University ofHong Kong, Shatin, N.T., Hong Kong, China.
2 Center for Advancement of Drug Research and Evaluation, Collegeof Pharmacy, Western University of Health Sciences, Pomona,California 91766, USA.
3 National Center for Toxicological Research, U.S. Food and DrugAdministration, Jefferson, Arkansas, USA.
4 Functional Genomics Core, Beckman Research Institute, City ofHope Comprehensive Cancer Center, Duarte, California, USA.
5 Clinical Transcriptional Genomics Core, Medical Genetics Institute,Cedars-Sinai Medical Center, David Geffen School of Medicine atUCLA, Los Angeles, California, USA.
6Department of Clinical Pharmacy and Center for Pharmacogenomics,School of Pharmacy, Fudan University, Shanghai, China.
7 College of Chemistry, Sichuan University, Chengdu, Sichuan, China.8 Division of Biostatistics, School of Public Health and Primary Care,The Chinese University of Hong Kong, Shatin, N.T., Hong Kong,China.
9 To whom correspondence should be addressed. (e-mail:[email protected]; [email protected])
The AAPS Journal, Vol. 15, No. 3, July 2013 (# 2013)DOI: 10.1208/s12248-013-9491-5
8841550-7416/13/0300-0884/0 # 2013 American Association of Pharmaceutical Scientists
chemical constituents composing the fingerprint may not berelated to bioactivity in vivo since many constituents are notabsorbed (5). Up to now, a relevant bioactive fingerprint ofTCM suitable for QC has not been established.
Our previous study established a stepwise bioactivityguided in vitro pharmacokinetic method to identify potentialrelevant (absorbable and bioactive) markers for Si-Wu-Tang(SWT), a representative TCM formula for women’s health(6). Using this method, three relevant chemical markers withhigh permeability and stability, namely ferulic acid (FA),ligustilide (Lig), and senkyunolide A (SA), were identified forSWT. Although the three active markers are more relevantthan any arbitrarily designated markers for stability testing,they are unlikely to be able to represent the overall in vivoactivity of a specific SWT product since many other unknowncomponents unique in the product can also contribute to theoverall in vivo activity. Thus, a QC method that can provide arepresentative composite bioactivity from absorbable compo-nents would be more desirable.
With the completion of the Human Genome Project,genomic research has now led to many new applications. Alandmark study has shown that DNA microarray-based geneexpression signatures can be a useful approach to link smallmolecules, genes, and diseases (7). This genomics approachhas been used for screening the relevant activity of variousmolecules to find association with specific genes and diseases(8). Thus, we hypothesize that the microarray technologycould be a useful tool in screening for the bioactive markersof a given TCM product. The identified genes with respectivefunction can be related to the absorbable components/fraction of the TCM product and can serve as a compositein vivo marker of activity unique to the specific TCM product.Among these expressed genes, a panel of highly differentiallyexpressed genes (DEGs) from the treatment effects of TCMmay be also measured by a more cost-effective real-timePCR.
The purpose of the present study is to investigate thefeasibility of identifying such DEG panel from DNA micro-array analysis and investigate its specificity and consistency,using the more cost-effective real-time PCR technique.
MATERIALS AND METHODS
Compounds
A number of herbal products were studied. The CU-SWT (a TCM formula, Si-Wu-Tang, from The ChineseUniversity of Hong Kong) and its component single herbextracts CU-Angelicae Sinensis, CU-Chuanxiong, CU-Rehmanniae Praeparata, and CU-Paeoniae Alba weremanufactured under GMP condition at the Hong KongInstitute of Biotechnology (Hong Kong, China) according tothe protocol described in Chinese Pharmacopoeia 2005 (9)with slight modifications. Another SWT product, J-SWT, wasprepared by mixing equal proportions of Angelicae Sinensis,Chuanxiong, Rehmanniae Praeparata, and Paeoniae Albapowders and obtained from a Hong Kong pharmaceuticalcompany. SWT_NBF, a SWT commercial product with soliddosage form, was manufactured by Nong’s (Nong Ben Fang)Company Limited in Hong Kong. Si-Wu-Tang Heji (SWHJ),another SWT commercial product with liquid formulation,
was purchased from mainland China. Radix Astragali powder(P1), Salvia Miltrorrhiza, and Radix Puerariae powder (P2)was obtained from The Chinese University of Hong Kong.Bupleuri Radix granules (P3), Lonicerae and Forsythiaepowder (P4), supplement wellness/energy granules (P5),hypolipidemic granules (P6), Fructus Momordicae coughreduction granules (P7), and Black Chicken White PhoenixPills (P8) were purchased from TCM product stores in HongKong and mainland China. (P1 to P8 designation was utilizedwhen performing specificity test and their respective Chinesenames were listed in supplementary Table I.)
Three chemical standards for assay, including Lig, SA,and butylphthalide, were purchased from Hong Kong JockeyClub Institute of Chinese Medicine Ltd (Hong Kong). Theremaining chemical standards, namely FA, gallic acid,paeoniflorin, paeonol, ligustrazine, and catalpol, wereobtained from National Institute for the Control of Pharma-ceutical and Biological Products (Beijing, China). Thepurity of these standards was above 98%. Methanol andacetonitrile were obtained from Labscan (Labscan Asia,Thailand) and DMSO was purchased from Sigma-Aldrich(St. Louis, MO, USA).
Absorbable Components from Extracts of SWT, Single Herb,and Standard Mixture in Caco-2 Monolayer Model
The Caco-2 monolayer model was utilized to simulatethe gastrointestinal absorption of orally administered SWT.Caco-2 cells purchased from American Type Culture Collec-tion (ATCC, Manassas, VA, USA) were cultured inDulbecco’s modified Eagle’s medium (DMEM) andsupplemented with 10% fetal bovine serum (FBS), 1%nonessential amino acids, 100 units/mL penicillin, and100 mg/mL streptomycin in an atmosphere of 5% CO2 and90% relative humidity at 37°C. The cells (passage 37∼42)were seeded onto six-well plates Transwell® inserts (CorningCostar Co., NY) coated with a collagen layer at a density of3×105 cells/well and cultured for 21 days (10). Caco-2monolayers with transepithelial electrical resistance above600Ω cm2 were employed in the permeability transport study.
Table I. Contents in Permeation Concentrates Collected Obtainedfrom Caco-2 cell Model by HPLC-DAD
Loadingproduct
Loadingconcentration
Component amountin permeationconcentrates (μg)
SA FA Lig
CU-SWT (batch 1) 2.50 mg/mL 1.756 25.903 9.743J-SWT 1.25 mg/mL 0.821 7.191 1.829CU-Angelica 2.50 mg/mL ND 11.149 1.492CU-Chuanxiong 2.50 mg/mL 3.821 45.835 1.925CU-Paeoniae 2.50 mg/mL NA NA NACU-Rehmanniae 2.50 mg/mL NA NA NAStandard
mixture of SA,FA, and Lig
0.23 μg/mL SAa,1.26 μg/mL FAa,3.52 μg/mL Liga
2.484 18.089 13.322
LOQ, 0.02 μg/mL for SA; Lig, 0.1 μg/mL for FANA not applicable, ND not detectable, FA ferulic acid, LigZ-ligustilide, SA senkyunolide AaCorresponding to the content of each component in CU-SWT
885SWT Quality Control by Gene Expression Signature

The permeates (containing absorbable components)from aqueous extracts of CU-SWT, J-SWT, four single herbs(CU-Angelicae, CU-Chuanxiong, CU-Paeoniae, and CU-Rehmanniae), and a standard mixture (FA, Lig, and SA atequivalent amount as that in the CU-SWT) were obtainedusing the Caco-2 cell model after loading and perfusion over2 h. The aqueous extracts of the herbs were prepared bydissolving the extracted powder into PBS followed bysonication. The standard mixture was prepared by dissolvingthe appropriate amount of each standard compound in PBS.Then, 1.5 mL of the extracts at noncytotoxic concentration(2.5 or 1.25 mg/mL) as well as the standard mixture wasloaded onto the apical site of Caco-2 monolayer and thesolutions from basolateral side were collected after 120 min ofincubation. A desalting procedure of the collected permeatewas carried out by lyophilization of all permeate samplesfollowed by recovering the absorbable components usingacetonitrile.
Determination of Major Components from SWT, SingleHerb, and Absorbable Components from Caco-2 Permeate
The major components of the extracts from SWT andfour herbs were identified and quantified by our LC-MS/MSmethod (11). The Caco-2 permeates of above products wereassayed by HPLC-DAD.
MCF-7 Cell Culture and Sample Treatment
The MCF-7 cells were purchased from ATCC (Manassas,VA, USA) and treated as described previously (12). Briefly,the cells were seeded at a density of 1×10⁵ cells/mL inDMEM supplemented with 10% FBS, 1% nonessentialamino acids, 100 units/mL penicillin, 100 mg/mLstreptomycin, 1 mM sodium pyruvate, and 2 mM L-glutamine in an atmosphere of 5% CO2 at 37°C. Aftergrowing for 24 h, the medium was then replaced with phenolred-free DMEM medium supplemented with 5% charcoal–dextrin-stripped FBS (CD-FBS).
The Caco-2 permeates from SWT extracts werereconstituted using 1 mL methanol and then diluted by 1:2,1:8, and 1:32 with methanol to generate the working solutionsas the high, medium, and low concentrations, respectively.The Caco-2 permeates from standard mixture and extracts offour single herbs were diluted by 1:2 and 1:8 with methanol torepresent the high and medium concentrations, respectively.The above corresponding working solutions were furtherdi luted 100 t imes with phenol red-free DMEM(supplemented with 5% CD-FBS). The MCF-7 cells werethen treated with 2 mL of above-prepared solutions for 6 h ina six-well plate at 37°C in an atmosphere of 5% CO2 and 90%relative humidity. Methanol (1%) was used as the negativecontrol. All the samples were processed in triplicates. Thedetailed information of treatment is shown in SupplementaryFig. 1 and Supplementary Table II.
RNA Extraction
Total RNA was extracted using RNeasy Mini Kit(QIAGEN, Valencia, CA, USA) according to the manufac-turer’s protocol. The concentrations of RNA were measured
by a NanoVue Plus (GE Healthcare, Piscataway, NJ, USA)and adjusted to about 0.2 μg/μL. The RNA samples werestored at −80°C before further processing.
Microarray Processing
Microarrays were carried out at the Functional Geno-mics Core, Beckman Research Institute, City of HopeComprehensive Cancer Center. Affymetrix Human GenomeU133 Plus 2.0 arrays (Santa Clara, CA, USA) containing54,675 probe sets detecting over 47,000 transcripts were used.Microarray analysis was performed according to a procedureas described previously (12). RNA quality was checked usingthe RNA 6000 LabChip and Agilent 2100 BioAnalyzer. Onlythe high-quality RNA samples [e.g., RNA integrity number≥9.0] were used for microarray experiments. The RNAsamples were randomized and blinded prior to the microarrayprocessing/analysis. The cRNA synthesis and labeling werecarried out following the Affymetrix GeneChip 3′ IVTExpress standard preparation protocol. Two hundred micro-gram of total RNA from each sample, along with polyAspike-in controls, was converted to double-stranded cDNA.After second-strand synthesis, the cDNA was purified withthe GeneChip sample cleanup module (Affymetrix).Biotinylated cRNAs were then synthesized by in vitrotranscription. For each sample, 10 mg of biotinylated cRNAalong hybridization spiked in controls (bioB, bioC, bioD, andcre) was hybridized with Affymetrix Human Genome U133Plus 2.0 array for 16 h at 45°C. Following hybridization,arrays were washed, stained, and then scanned with anAffymetrix GeneChipH 3000 7G scanner.
Microarray Data Analysis and Quality Assessmentof the Microarray Data
Microarray raw intensity measurements of all probe setswere corrected for the background, normalized, andconverted into expression measurements by using theAffymetrix expression console (v1.8.6). The microarray dataanalysis was carried out using Partek Genomics Suite 6.5(Partek, Inc.). Robust Multi-Array Analysis algorithm wasused to normalize and summarize the intensities of probesinto gene-level expression. The microarray data QC wasevaluated by examining the following: cRNA yield, 3′:5′ ratioof housekeeping gene (glyceraldehyde 3-phosphate dehydro-genase (GAPDH)), signal intensity, polyA spike and hybrid-ization spike in controls, histogram and box plot of log-transformed expression signal, principal component analysis(PCA), and hierarchical cluster analysis of the global geneexpression intensity of all samples. All samples that passed theQC metrics showed clean separation between different groups.
Identification of Differentially Expressed Genesand Construction of Multi-Gene Real-Time PCR Panel
The DEGs from microarray processing/analysis wereidentified according to the following specified criteria: (1)Fold change (FC) greater than a predefined threshold (e.g.FC>1.5 or FC<−1.5); (2) p<0.01 based on unpaired sample ttest; (3) false discovery rate (FDR)<0.05; (4) expression offold change in a dose-dependent manner; and (5) expression
886 Xie et al.

of genes selected consistent in three different batches ofmicroarray work. A multi-gene real-time PCR panel wasconstructed using the DEGs identified above.
Verification of Microarray DEG Expressionby Real-Time PCR
The DEGs obtained by microarray was further verifiedby quantitative real-time PCR using MCF-7 cells treated withsamples from a separate experiment. After RNA extraction,the fold changes in DEG identified above were verified usingRoche LightCycler® 480 Real-time PCR System (RocheApplied Science) with a SYBR Green protocol. Primers ofthe DEGs were designed by LightCycler® probe designsoftware 2.0 (Roche Applied Science). The PCR conditionswere: 5 min at 95°C and 45 cycles of 10 s at 95°C, 10 s at 60°C,and 10 s at 72°C. At the end of PCR cycling steps, data foreach sample were displayed as a melting curve and the“crossing point” which represented that the RNA expressionlevel was determined. Then, the expression fold changes ofthe DEGs were quantified with the GAPDH as the reference(normalizing control). The results were further adjusted incomparison to that from the negative control.
Evaluation of Specificity of DEG Panel
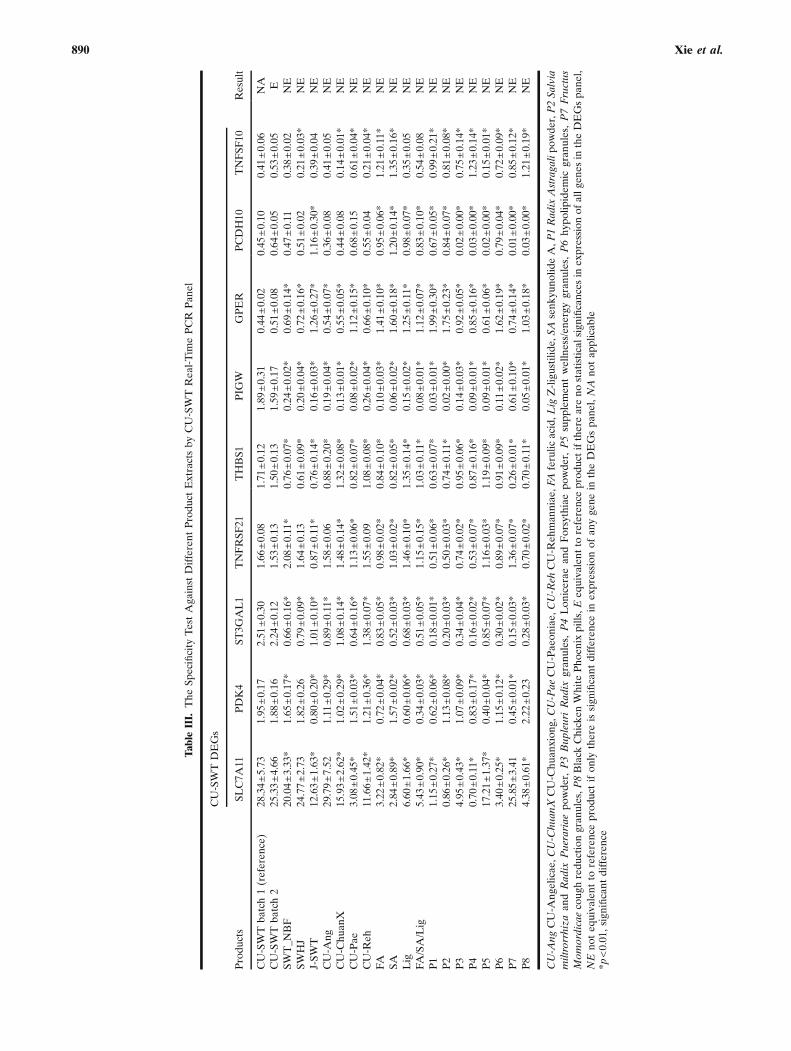
The DEG panel derived from CU-SWT was testedagainst 21 different products to determinate the specificityof the panel from real-time PCR. The 21 differentproducts included two batches of CU-SWT, three otherSWT products, four single herbs, single chemical stan-dards (FA, Lig, SA), and their mixture (at equivalentamount as that in the CU-SWT) and eight independentproducts (named P1∼P8) including Radix Astragali pow-der, Salvia miltrorrhiza and Radix Puerariae powder,Bupleuri Radix granules, Lonicerae and Forsythiae pow-der, supplement wellness/energy granules, hypolipidemicgranules, Fructus Momordicae cough reduction granules,and Black Chicken White Phoenix pills. The ingredientsof each formula for P1∼P8 are listed in SupplementaryTable I. All the products were extracted in phenol red-free DMEM (supplemented with 5% CD-FBS) by sonica-tion. The solution or extracts of these products atnoncytotoxic concentrations were utilized to treat theMCF-7 cells for 6 h followed by extraction of the RNA.The expression fold changes were determined using real-time PCR.
Fig. 1. The hierarchical clustering analysis and heat map of the correlation coefficients between geneexpression profiles. All 48 samples from control (C) and CU-SWT (T1), J-SWT (T2), standard mixture(T3), CU-Chuanxiong (T4), CU-Paeoniae (T5), CU-Rehmanniae (T6), and CU-Angelicae (T7) at high(H), medium (M), and low (L) concentrations. The clustering results suggest a concentration-dependenttreatment effect for each gene expression profile in comparison to the vehicle control
887SWT Quality Control by Gene Expression Signature
Evaluation of Consistency of DEG Panel
To verify the gene expression consistency, MCF-7 cellswere treated with eight replicate extracts of CU-SWT at2.5 mg/mL on three separate days. Fresh extracts wereprepared right before the experiment each day and onlyMCF-7 cells from passage number within a narrow rangewere used on different days. The expression fold changes ofthe CU-SWT DEGs in these products were determined usingreal-time PCR.
Statistical Analysis
The results are expressed as the mean±SD. For specific-ity determination, the Student’s t test was utilized to analyzethe expression fold change of different DEGs. A p<0.01 wasconsidered to be statistical significant. The product wasregarded as consistent if there were no statistical significances
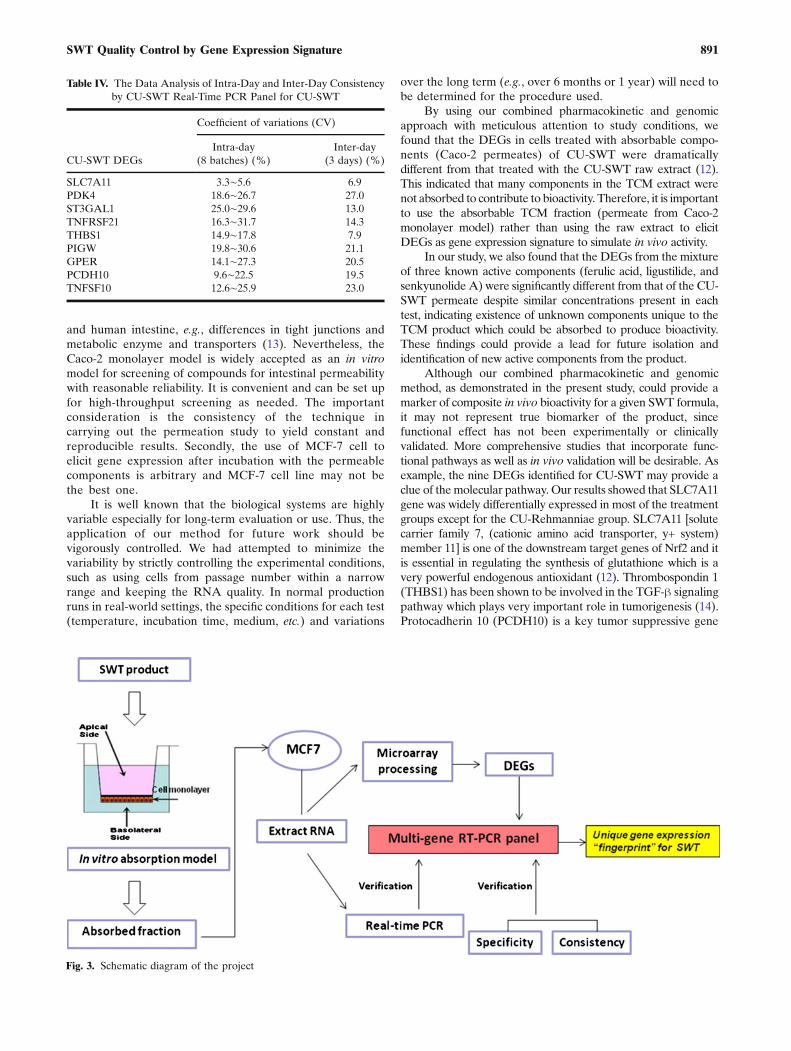
in the expression of all genes in the DEG panel. Also forconsistency evaluation, the inter- and intra-day consistencywas evaluated as the coefficient of variations (CV) and a CVless than 33.3% is considered acceptable for reproducibility ofa biological assay.
RESULTS
Major Components in Extracts of Different SWTs, SingleHerbs, and Corresponding Caco-2 Permeates
Themajor components and their amounts in different SWTproducts as measured by LC-MS/MS are listed in Supplemen-tary Table III. The three major permeable components (FA,Lig, and SA) were detectable in the Caco-2 permeates of CU-SWT, J-SWT, CU-Chuanxiong, and the standard mixture. Twopermeable components including FA and Lig were detected in
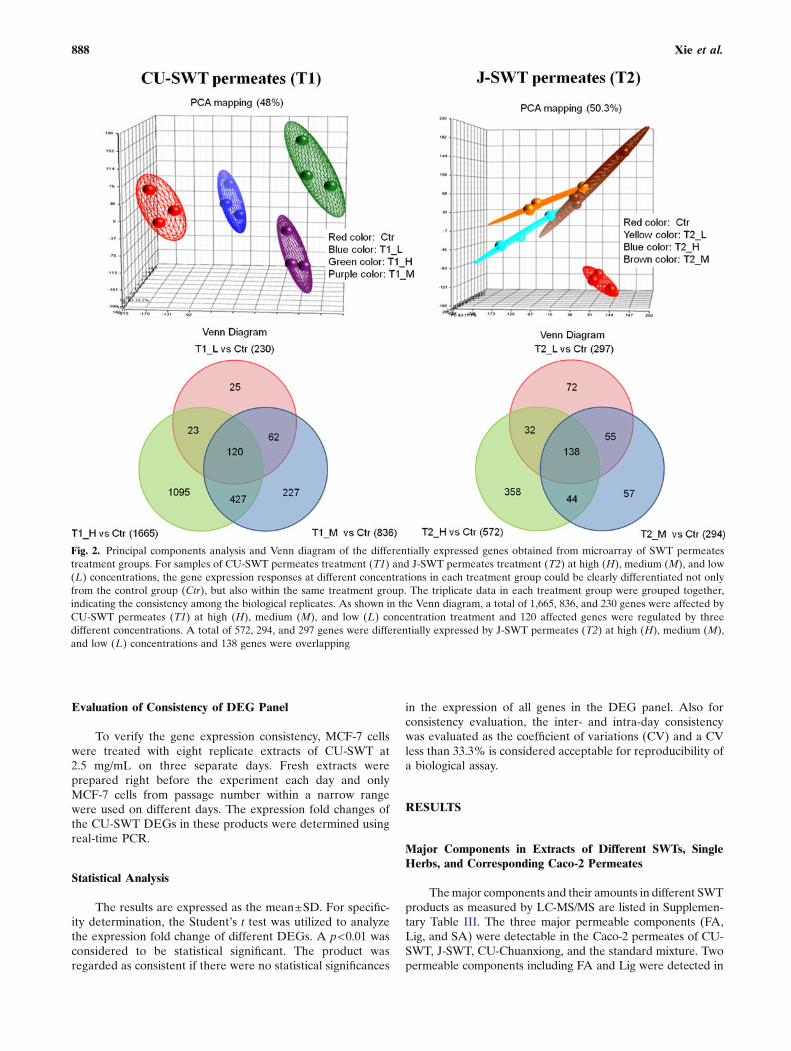
Fig. 2. Principal components analysis and Venn diagram of the differentially expressed genes obtained from microarray of SWT permeatestreatment groups. For samples of CU-SWT permeates treatment (T1) and J-SWT permeates treatment (T2) at high (H), medium (M), and low(L) concentrations, the gene expression responses at different concentrations in each treatment group could be clearly differentiated not onlyfrom the control group (Ctr), but also within the same treatment group. The triplicate data in each treatment group were grouped together,indicating the consistency among the biological replicates. As shown in the Venn diagram, a total of 1,665, 836, and 230 genes were affected byCU-SWT permeates (T1) at high (H), medium (M), and low (L) concentration treatment and 120 affected genes were regulated by threedifferent concentrations. A total of 572, 294, and 297 genes were differentially expressed by J-SWT permeates (T2) at high (H), medium (M),and low (L) concentrations and 138 genes were overlapping
888 Xie et al.
the CU-Angelicae permeate. Contents of the absorbablecomponents are shown in Table I.
Hierarchical Clustering Analysis, Principal ComponentsAnalysis, and Venn Diagram for Quality Assessmentof Array Data and Identification of Treatment Effects
Hierarchical clustering analysis was conducted toevaluate the overall similarities and differences of thetreatment effects of 48 products/concentrations (Fig. 1).The three replicates in the control group and thetreatment group CU-SWT (T1), but not in other treat-ment groups, showed a high pair-wise correlation. How-ever, the clustering patterns clearly indicate that thesamples treated with CU-SWT (T1), J-SWT (T2), standardmixture (T3), and four single herbs (T4–T7) showeddifferent expression profiles compared to that of thecontrol group. The clustering figure also suggested thetreatment effect in the high concentration of CU-SWT orJ-SWT to be much larger than that in the medium or lowconcentration of SWT treatment. The treatment effect ofCU-SWT was similar to J-SWT, suggesting that the analogousherbal composition in different brands of SWT could result incertain similarity in biological activities. Figure 1 also showedthat four single herbs and themixture of three major absorbablechemical markers did not cluster together with SWT products.However, among the single herbs, the gene expression profile ofCU-Angelicae was the closest to that of CU-SWT and J-SWT,suggesting that Angelicae contributed substantial activity ingene expression for SWT in comparison to the other herbs.
As shown by principal components analysis, the geneexpression responses at different concentrations in eachtreatment group could be clearly differentiated not onlyfrom the control group, but also within the sametreatment group (Fig. 2 and Supplementary Fig. 2). Thetriplicate data in each treatment group were groupedtogether, indicating the consistency among the biologicalreplicates. Some affected genes were overlapping forvarious treatment groups at different concentrations asshown in the Venn diagram (Fig. 2 and SupplementaryFig. 3). The information on the number of genes affectedis listed in Supplementary Table IV.
Verification of DEGs and Evaluation of Specificityand Consistency
Based on DEGs identified from microarray analysis(Table II), the expression fold changes of DEGs were alsoconfirmed using real-time PCR. As shown in SupplementaryTables V–X, their fold changes determined by real-time PCRwere concordant with those obtained by microarray.
The expression profile of CU-SWT batch 2 was concordantwith reference product (CU-SWT batch 1). Among four SWTproducts, the gene expression fold changes of three other SWTproducts were not equivalent to CU-SWT. Also, the geneexpression fold changes of all other products including themixture(FA, Lig, and SA), four single herbs, and eight independentproducts were not equivalent to the reference product (Table III).
The expression fold changes of the CU-SWT DEGs fromeight replicate extracts on three separate days are listed inSupplementary Tables XI–XIII. The CV of inter- and intra-day consistency was <27% (Table IV).
DISCUSSION
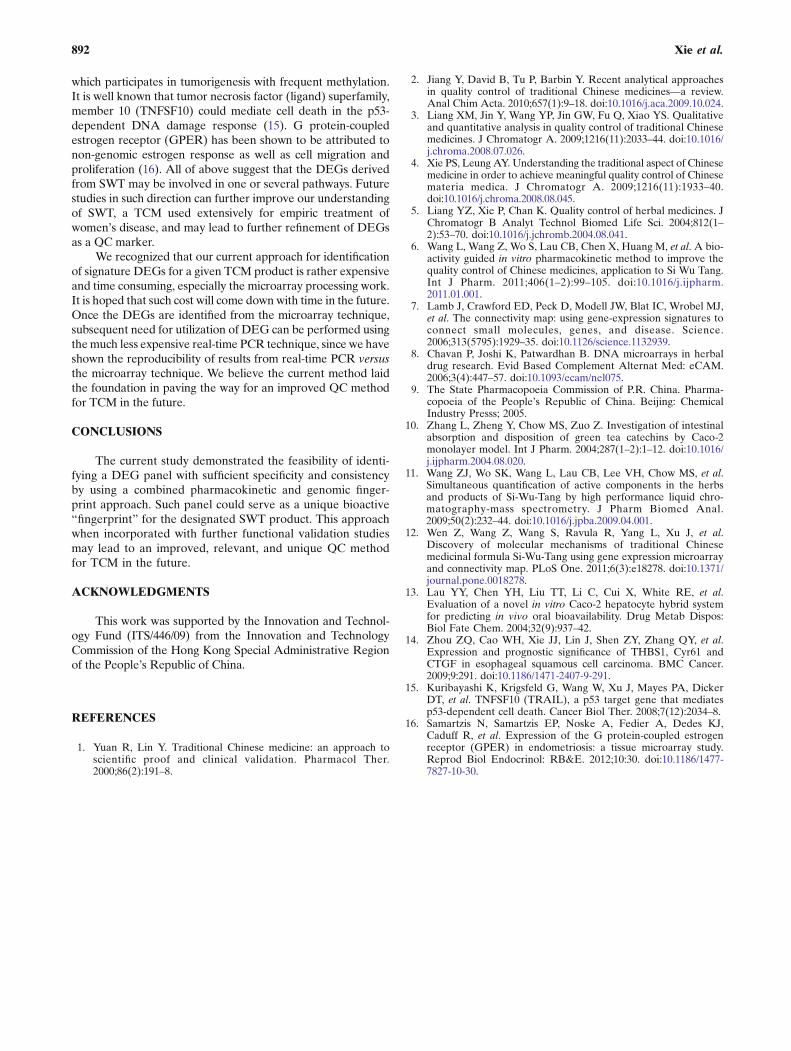
The present study demonstrated the feasibility of acombined pharmacokinetic and genomic approach in identi-fying a panel of DEGs which could serve as marker of acomposite in vivo bioactivity of a TCM formula, SWT(Fig. 3). The DEG panel identified is found to be unique,specific, and consistent for a given SWT product and thusmay be utilized for product identity. We believe thiscombined pharmacokinetic and genomic approach for DEGdetermination may be also applied to other TCM productsand with further definitive study can potentially provide aunique method for QC of TCM.
The DEGs identified by the present approach, whileunique, consistent, and specific for a given product, may notaccurately represent the DEG expression in human subjectsfollowing ingestion of a given TCM product. There areseveral major differences between our simulated approachversus real in vivo response that should be recognized andconsidered. First of all, the absorbable components from theCaco-2 cell line permeate may not represent human intestinalabsorption as there are difference between in vitro Caco-2
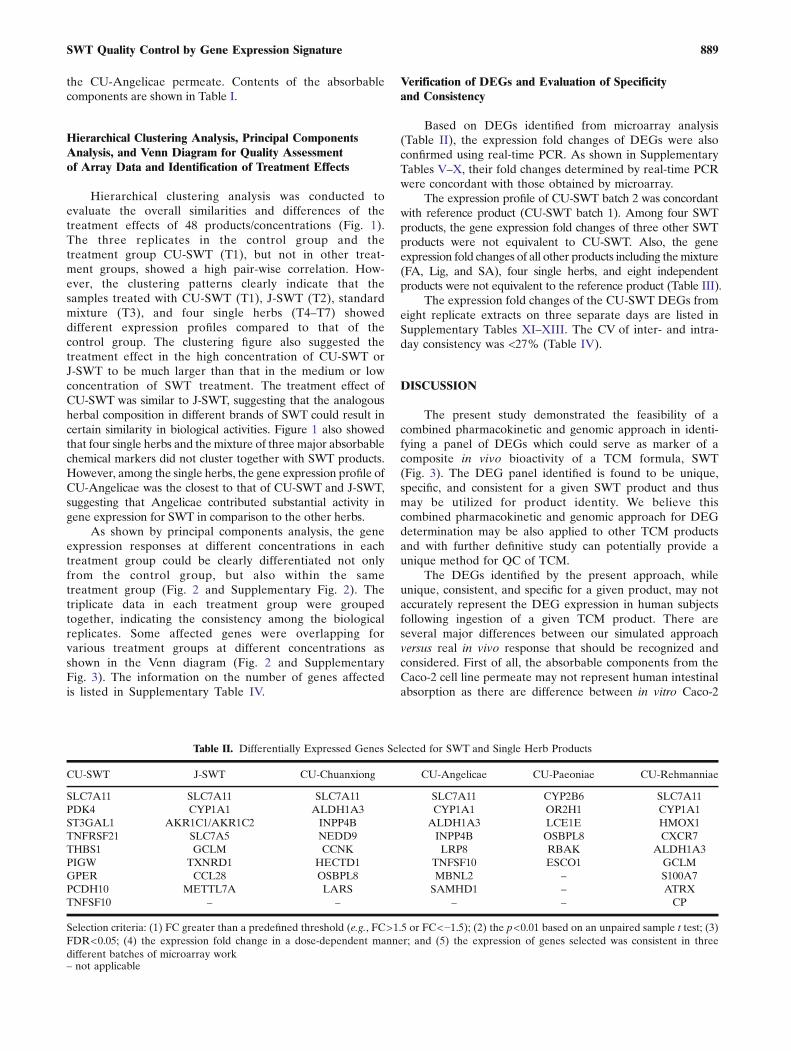
Table II. Differentially Expressed Genes Selected for SWT and Single Herb Products
CU-SWT J-SWT CU-Chuanxiong CU-Angelicae CU-Paeoniae CU-Rehmanniae
SLC7A11 SLC7A11 SLC7A11 SLC7A11 CYP2B6 SLC7A11PDK4 CYP1A1 ALDH1A3 CYP1A1 OR2H1 CYP1A1ST3GAL1 AKR1C1/AKR1C2 INPP4B ALDH1A3 LCE1E HMOX1TNFRSF21 SLC7A5 NEDD9 INPP4B OSBPL8 CXCR7THBS1 GCLM CCNK LRP8 RBAK ALDH1A3PIGW TXNRD1 HECTD1 TNFSF10 ESCO1 GCLMGPER CCL28 OSBPL8 MBNL2 – S100A7PCDH10 METTL7A LARS SAMHD1 – ATRXTNFSF10 – – – – CP
Selection criteria: (1) FC greater than a predefined threshold (e.g., FC>1.5 or FC<−1.5); (2) the p<0.01 based on an unpaired sample t test; (3)FDR<0.05; (4) the expression fold change in a dose-dependent manner; and (5) the expression of genes selected was consistent in threedifferent batches of microarray work– not applicable
889SWT Quality Control by Gene Expression Signature
TableIII.
The
Specificity
TestAga
inst
Different
Produ
ctExtractsby
CU-SW
TRea
l-Tim
ePCR
Pan
el
Produ
cts
CU-SW
TDEGs
Result
SLC7A
11PDK4
ST3G
AL1
TNFRSF
21THBS1
PIG
WGPER
PCDH10
TNFSF
10
CU-SWTba
tch1(referen
ce)
28.34±5.73
1.95
±0.17
2.51
±0.30
1.66
±0.08
1.71
±0.12
1.89
±0.31
0.44
±0.02
0.45
±0.10
0.41
±0.06
NA
CU-SWTba
tch2
25.33±4.66
1.88
±0.16
2.24
±0.12
1.53
±0.13
1.50
±0.13
1.59
±0.17
0.51
±0.08
0.64
±0.05
0.53
±0.05
ESW
T_N
BF
20.04±3.33*
1.65
±0.17*
0.66
±0.16
*2.08
±0.11*
0.76
±0.07*
0.24
±0.02*
0.69
±0.14*
0.47
±0.11
0.38
±0.02
NE
SWHJ
24.77±2.73
1.82
±0.26
0.79
±0.09
*1.64
±0.13
0.61
±0.09*
0.20
±0.04*
0.72
±0.16*
0.51
±0.02
0.21
±0.03*
NE
J-SW
T12
.63±1.63*
0.80
±0.20*
1.01
±0.10
*0.87
±0.11*
0.76
±0.14*
0.16
±0.03*
1.26
±0.27*
1.16
±0.30
*0.39
±0.04
NE
CU-A
ng29
.79±7.52
1.11
±0.29*
0.89
±0.11*
1.58
±0.06
0.88
±0.20*
0.19
±0.04*
0.54
±0.07*
0.36
±0.08
0.41
±0.05
NE
CU-C
huan
X15.93±2.62*
1.02
±0.29*
1.08
±0.14*
1.48
±0.14*
1.32
±0.08*
0.13
±0.01*
0.55
±0.05*
0.44
±0.08
0.14
±0.01*
NE
CU-Pae
3.08
±0.45*
1.51
±0.03*
0.64
±0.16*
1.13
±0.06*
0.82
±0.07*
0.08
±0.02*
1.12
±0.15*
0.68
±0.15
0.61
±0.04*
NE
CU-R
eh11.66±1.42
*1.21
±0.36*
1.38
±0.07
*1.55
±0.09
1.08
±0.08*
0.26
±0.04*
0.66
±0.10*
0.55
±0.04
0.21
±0.04*
NE
FA3.22
±0.82*
0.72
±0.04*
0.83
±0.05
*0.98
±0.02
*0.84
±0.10*
0.10
±0.03*
1.41
±0.10*
0.95
±0.06
*1.21
±0.11*
NE
SA2.84
±0.89*
1.57
±0.02*
0.52
±0.03
*1.03
±0.02
*0.82
±0.05*
0.06
±0.02*
1.60
±0.18*
1.20
±0.14
*1.35
±0.16*
NE
Lig
6.60
±1.66*
0.60
±0.06*
0.68
±0.03
*1.46
±0.10
*1.35
±0.14*
0.15
±0.02*
1.25
±0.11*
0.98
±0.07
*0.35
±0.05
NE
FA/SA/Lig
5.43
±0.90*
0.34
±0.03*
0.51
±0.05
*1.15
±0.15
*1.03
±0.11*
0.08
±0.01*
1.12
±0.07*
0.83
±0.10
*0.54
±0.08
NE
P1
1.15
±0.27*
0.62
±0.06*
0.18
±0.01
*0.51
±0.06
*0.63
±0.07*
0.03
±0.01*
1.99
±0.30*
0.67
±0.05
*0.99
±0.21*
NE
P2
0.86
±0.26*
1.13
±0.08*
0.20
±0.03
*0.50
±0.03
*0.74
±0.11*
0.02
±0.00*
1.75
±0.23*
0.84
±0.07
*0.81
±0.08*
NE
P3
4.95
±0.43*
1.07
±0.09*
0.34
±0.04
*0.74
±0.02
*0.95
±0.06*
0.14
±0.03*
0.92
±0.05*
0.02
±0.00
*0.75
±0.14*
NE
P4
0.70
±0.11*
0.83
±0.17*
0.16
±0.02
*0.53
±0.07
*0.87
±0.16*
0.09
±0.01*
0.85
±0.16*
0.03
±0.00
*1.23
±0.14*
NE
P5
17.21±1.37*
0.40
±0.04*
0.85
±0.07
*1.16
±0.03
*1.19
±0.09*
0.09
±0.01*
0.61
±0.06*
0.02
±0.00
*0.15
±0.01*
NE
P6
3.40
±0.25*
1.15
±0.12*
0.30
±0.02
*0.89
±0.07
*0.91
±0.09*
0.11
±0.02*
1.62
±0.19*
0.79
±0.04
*0.72
±0.09*
NE
P7
25.85±3.41
0.45
±0.01*
0.15
±0.03
*1.36
±0.07
*0.26
±0.01*
0.61
±0.10*
0.74
±0.14*
0.01
±0.00
*0.85
±0.12*
NE
P8
4.38
±0.61*
2.22
±0.23
0.28
±0.03
*0.70
±0.02
*0.70
±0.11*
0.05
±0.01*
1.03
±0.18*
0.03
±0.00
*1.21
±0.19*
NE
CU-A
ngCU-A
ngelicae,C
U-C
huan
XCU-C
huan
xion
g,CU-Pae
CU-Pae
oniae,
CU-R
ehCU-R
ehman
niae
,FA
ferulic
acid,L
igZ-ligustilid
e,SA
senk
yuno
lideA,P
1Rad
ixAstraga
lipo
wde
r,P2Salvia
miltrorrhizaan
dRad
ixPuerariae
powde
r,P3Bupleuri
Rad
ixgran
ules,P4Lon
icerae
andForsythiaepo
wde
r,P5supp
lemen
twellness/en
ergy
gran
ules,P6hy
polip
idem
icgran
ules,P7Fructus
Momordicae
coug
hredu
ctiongran
ules,P
8Black
Chicken
White
Pho
enix
pills,E
equivalent
toreferenceprod
uctifthereareno
statisticalsignificances
inex
pression
ofallg
enes
intheDEGspa
nel,
NE
noteq
uivalent
toreferenceprod
uctifon
lythereissign
ificant
differen
cein
expression
ofan
yge
nein
theDEGspa
nel,NA
notap
plicab
le*p
<0.01
,sign
ificant
differen
ce
890 Xie et al.
and human intestine, e.g., differences in tight junctions andmetabolic enzyme and transporters (13). Nevertheless, theCaco-2 monolayer model is widely accepted as an in vitromodel for screening of compounds for intestinal permeabilitywith reasonable reliability. It is convenient and can be set upfor high-throughput screening as needed. The importantconsideration is the consistency of the technique incarrying out the permeation study to yield constant andreproducible results. Secondly, the use of MCF-7 cell toelicit gene expression after incubation with the permeablecomponents is arbitrary and MCF-7 cell line may not bethe best one.
It is well known that the biological systems are highlyvariable especially for long-term evaluation or use. Thus, theapplication of our method for future work should bevigorously controlled. We had attempted to minimize thevariability by strictly controlling the experimental conditions,such as using cells from passage number within a narrowrange and keeping the RNA quality. In normal productionruns in real-world settings, the specific conditions for each test(temperature, incubation time, medium, etc.) and variations
over the long term (e.g., over 6 months or 1 year) will need tobe determined for the procedure used.
By using our combined pharmacokinetic and genomicapproach with meticulous attention to study conditions, wefound that the DEGs in cells treated with absorbable compo-nents (Caco-2 permeates) of CU-SWT were dramaticallydifferent from that treated with the CU-SWT raw extract (12).This indicated that many components in the TCM extract werenot absorbed to contribute to bioactivity. Therefore, it is importantto use the absorbable TCM fraction (permeate from Caco-2monolayer model) rather than using the raw extract to elicitDEGs as gene expression signature to simulate in vivo activity.
In our study, we also found that the DEGs from the mixtureof three known active components (ferulic acid, ligustilide, andsenkyunolide A) were significantly different from that of the CU-SWT permeate despite similar concentrations present in eachtest, indicating existence of unknown components unique to theTCM product which could be absorbed to produce bioactivity.These findings could provide a lead for future isolation andidentification of new active components from the product.
Although our combined pharmacokinetic and genomicmethod, as demonstrated in the present study, could provide amarker of composite in vivo bioactivity for a given SWT formula,it may not represent true biomarker of the product, sincefunctional effect has not been experimentally or clinicallyvalidated. More comprehensive studies that incorporate func-tional pathways as well as in vivo validation will be desirable. Asexample, the nine DEGs identified for CU-SWT may provide aclue of themolecular pathway. Our results showed that SLC7A11gene was widely differentially expressed in most of the treatmentgroups except for the CU-Rehmanniae group. SLC7A11 [solutecarrier family 7, (cationic amino acid transporter, y+ system)member 11] is one of the downstream target genes of Nrf2 and itis essential in regulating the synthesis of glutathione which is avery powerful endogenous antioxidant (12). Thrombospondin 1(THBS1) has been shown to be involved in the TGF-β signalingpathway which plays very important role in tumorigenesis (14).Protocadherin 10 (PCDH10) is a key tumor suppressive gene
Table IV. The Data Analysis of Intra-Day and Inter-Day Consistencyby CU-SWT Real-Time PCR Panel for CU-SWT
CU-SWT DEGs
Coefficient of variations (CV)
Intra-day(8 batches) (%)
Inter-day(3 days) (%)
SLC7A11 3.3∼5.6 6.9PDK4 18.6∼26.7 27.0ST3GAL1 25.0∼29.6 13.0TNFRSF21 16.3∼31.7 14.3THBS1 14.9∼17.8 7.9PIGW 19.8∼30.6 21.1GPER 14.1∼27.3 20.5PCDH10 9.6∼22.5 19.5TNFSF10 12.6∼25.9 23.0
Fig. 3. Schematic diagram of the project
891SWT Quality Control by Gene Expression Signature
which participates in tumorigenesis with frequent methylation.It is well known that tumor necrosis factor (ligand) superfamily,member 10 (TNFSF10) could mediate cell death in the p53-dependent DNA damage response (15). G protein-coupledestrogen receptor (GPER) has been shown to be attributed tonon-genomic estrogen response as well as cell migration andproliferation (16). All of above suggest that the DEGs derivedfrom SWT may be involved in one or several pathways. Futurestudies in such direction can further improve our understandingof SWT, a TCM used extensively for empiric treatment ofwomen’s disease, and may lead to further refinement of DEGsas a QC marker.
We recognized that our current approach for identificationof signature DEGs for a given TCM product is rather expensiveand time consuming, especially the microarray processing work.It is hoped that such cost will come downwith time in the future.Once the DEGs are identified from the microarray technique,subsequent need for utilization of DEG can be performed usingthemuch less expensive real-time PCR technique, since we haveshown the reproducibility of results from real-time PCR versusthe microarray technique. We believe the current method laidthe foundation in paving the way for an improved QC methodfor TCM in the future.
CONCLUSIONS
The current study demonstrated the feasibility of identi-fying a DEG panel with sufficient specificity and consistencyby using a combined pharmacokinetic and genomic finger-print approach. Such panel could serve as a unique bioactive“fingerprint” for the designated SWT product. This approachwhen incorporated with further functional validation studiesmay lead to an improved, relevant, and unique QC methodfor TCM in the future.
ACKNOWLEDGMENTS
This work was supported by the Innovation and Technol-ogy Fund (ITS/446/09) from the Innovation and TechnologyCommission of the Hong Kong Special Administrative Regionof the People’s Republic of China.
REFERENCES
1. Yuan R, Lin Y. Traditional Chinese medicine: an approach toscientific proof and clinical validation. Pharmacol Ther.2000;86(2):191–8.
2. Jiang Y, David B, Tu P, Barbin Y. Recent analytical approachesin quality control of traditional Chinese medicines—a review.Anal Chim Acta. 2010;657(1):9–18. doi:10.1016/j.aca.2009.10.024.
3. Liang XM, Jin Y, Wang YP, Jin GW, Fu Q, Xiao YS. Qualitativeand quantitative analysis in quality control of traditional Chinesemedicines. J Chromatogr A. 2009;1216(11):2033–44. doi:10.1016/j.chroma.2008.07.026.
4. Xie PS, Leung AY. Understanding the traditional aspect of Chinesemedicine in order to achieve meaningful quality control of Chinesemateria medica. J Chromatogr A. 2009;1216(11):1933–40.doi:10.1016/j.chroma.2008.08.045.
5. Liang YZ, Xie P, Chan K. Quality control of herbal medicines. JChromatogr B Analyt Technol Biomed Life Sci. 2004;812(1–2):53–70. doi:10.1016/j.jchromb.2004.08.041.
6. Wang L, Wang Z, Wo S, Lau CB, Chen X, Huang M, et al. A bio-activity guided in vitro pharmacokinetic method to improve thequality control of Chinese medicines, application to Si Wu Tang.Int J Pharm. 2011;406(1–2):99–105. doi:10.1016/j.ijpharm.2011.01.001.
7. Lamb J, Crawford ED, Peck D, Modell JW, Blat IC, Wrobel MJ,et al. The connectivity map: using gene-expression signatures toconnect small molecules, genes, and disease. Science.2006;313(5795):1929–35. doi:10.1126/science.1132939.
8. Chavan P, Joshi K, Patwardhan B. DNA microarrays in herbaldrug research. Evid Based Complement Alternat Med: eCAM.2006;3(4):447–57. doi:10.1093/ecam/nel075.
9. The State Pharmacopoeia Commission of P.R. China. Pharma-copoeia of the People’s Republic of China. Beijing: ChemicalIndustry Presss; 2005.
10. Zhang L, Zheng Y, Chow MS, Zuo Z. Investigation of intestinalabsorption and disposition of green tea catechins by Caco-2monolayer model. Int J Pharm. 2004;287(1–2):1–12. doi:10.1016/j.ijpharm.2004.08.020.
11. Wang ZJ, Wo SK, Wang L, Lau CB, Lee VH, Chow MS, et al.Simultaneous quantification of active components in the herbsand products of Si-Wu-Tang by high performance liquid chro-matography-mass spectrometry. J Pharm Biomed Anal.2009;50(2):232–44. doi:10.1016/j.jpba.2009.04.001.
12. Wen Z, Wang Z, Wang S, Ravula R, Yang L, Xu J, et al.Discovery of molecular mechanisms of traditional Chinesemedicinal formula Si-Wu-Tang using gene expression microarrayand connectivity map. PLoS One. 2011;6(3):e18278. doi:10.1371/journal.pone.0018278.
13. Lau YY, Chen YH, Liu TT, Li C, Cui X, White RE, et al.Evaluation of a novel in vitro Caco-2 hepatocyte hybrid systemfor predicting in vivo oral bioavailability. Drug Metab Dispos:Biol Fate Chem. 2004;32(9):937–42.
14. Zhou ZQ, Cao WH, Xie JJ, Lin J, Shen ZY, Zhang QY, et al.Expression and prognostic significance of THBS1, Cyr61 andCTGF in esophageal squamous cell carcinoma. BMC Cancer.2009;9:291. doi:10.1186/1471-2407-9-291.
15. Kuribayashi K, Krigsfeld G, Wang W, Xu J, Mayes PA, DickerDT, et al. TNFSF10 (TRAIL), a p53 target gene that mediatesp53-dependent cell death. Cancer Biol Ther. 2008;7(12):2034–8.
16. Samartzis N, Samartzis EP, Noske A, Fedier A, Dedes KJ,Caduff R, et al. Expression of the G protein-coupled estrogenreceptor (GPER) in endometriosis: a tissue microarray study.Reprod Biol Endocrinol: RB&E. 2012;10:30. doi:10.1186/1477-7827-10-30.
892 Xie et al.