utilization of credit and investment pattern...
TRANSCRIPT

Chapter – V
UTILIZATION OF CREDIT AND INVESTMENT PATTERN OF SAMPLED FARMERS IN PUNJAB
Utilization aspect of credit is as important or in a sense more important
than availability of credit. If available credit is utilized for the proper uses, it helps
not only in increasing the returns of the farmer, but also creates its repaying
capacity with the resource-starved farmers. On the other hand, if the available
funds are misutilized for unproductive purposes or diverted to other motives, the
income does not increase to the desired extent, the very purpose of credit
availability is defied. The burden of debt when keeps on piling, over the years we
face the problem of mounting overdues, which further mars the financial health of
the institutions indulged in credit and if the loan has been taken from non-
institutional sources, it gives rise to many personal and social problems in the
society. Darling rightly stressed that the problem of agricultural credit is not to
find more money for the peasant but to teach him to use it economically and
productively (Gill, 1993).
As we are aware that agriculture is more like a biological enterprise and
turnover is slow, so farmers generally face a financial crunch for their personal
and professional needs. Also, farmers live in social matrix, they are required to
fulfil many personal and social obligations, but returns are lagged with respect to
investment in this activity. So, when credit is made available to them for some
specific purposes, tendency to divert the funds is high. So, utilization aspect of
agricultural credit has been analyzed to highlight the problem of
diversion/misutilization. This aspect becomes more significant in the wake of
current scenario in Punjab especially regarding problem of indebtedness,
mounting overdues, depleting financial health of the farmers.
Utilization of credit / impact analysis has been undertaken by many
authors from time to time.
Mitra (1983) has analyzed an important aspect of rural credit market i.e.
interlinkages. It was found that a landlord / owner cultivator who is unable to
monitor a tenant / labourer’s effort input, will link a wage-cum-output sharing
160

contract with the provision of consumption credit. Thus, interlinking is an efficient
economic response to unequally distributed information arising from uncertainty,
which characterizes subsistence. Panda (1985) has studied the credit utilization
in Orissa, where majority share was coming through institutional sources.
Medium and large size farms were obtaining a higher proportion of credit than
the small farmers. Crop loan was the main constituent of borrowings. The extent
of diversion of loan was found to be 22 per cent in irrigated region and 38 per
cent in non-irrigated region of the state. Also, the diversion was higher in
medium and large sized farms. Extent of misutilization of loan was found to be
more in non-irrigated region. Naidu and Prasad (1987) found that proportion of
cooperative credit (short-term) used for production purpose and farm size were
positively related. The diverted loan was used for consumption purposes by
small and marginal farmers and for other non-agricultural purposes by medium
and large farmers. Productivity of cooperative credit was found to be poor and
inversely related with the farm size. Patel et al (1987) conducted a Gujarat
based study and found that about 70 per cent of the total credit was used for
productive purposes and 30 per cent for non-productive purposes. Among
productive purposes crop loan was dominant in all categories except for small
farmers. The percentage of defaulters was less in small and marginal farmers as
compared to large farmers. The results of the study by Chand and Singh (1987)
indicated that purchase of seeds, fertilizers, tractors, buffaloes and installation of
tubewells were the main purposes of borrowing. On an average, the net income
increased by 53-66 per cent in case of borrower farmers over non-borrowers in
the study. Gangopadhyay and Sengupta (1987) have analyzed ‘distress sales’
by small farmers and found that these were not necessarily due to inaccessibility
of the farmer to the product market. Rather credit imperfections manifest
themselves in the under pricing of the farmer’s product. Naidu (1988) has also
found that gross income and net income per household has increased by Rs.
7092 and Rs. 4327, respectively in the post loan period. Also the bank
assistance generated an average 184 additional man days of employment. The
average return on labour per man day of employment has increased to Rs. 18.94
in the post loan period from Rs. 15.65 in the pre-loan period showing favourable
161
impact on return to labour. It was also observed that return on investment
measured in terms of incremental net value of output per 100 rupees of loan per
month was positive in agriculture sector. Vaikunthe (1988) studied Karnatka and
found that credit disbursed was more of kind component in irrigated areas and
cash in non-irrigated areas.
All the farm size categories were using credit mostly for productive
purposes in irrigated area, while misutilization of credit was high in non-irrigated
areas mainly for consumption purposes. In a study based in Assam, Saikia
(1988) found that the loan covered 47 per cent of total input cost per hectare for
marginal farms and 26 per cent in other categories. The gross income per
hectare was about 16 per cent higher in beneficiary than in non-beneficiary
households. Only about 4 per cent of loan was found to be diverted to
unproductive purposes. Ninety-eight per cent of loan was utilized for productive
purposes in case of medium and large farms and in case of small and marginal
the proportion was 94 and 93 per cent, respectively. Prasad and Roy (1988)
studied the loan utilization of credit in case of dairy loans in Bihar. It was found
that 50 per cent of loanees had properly utilized the loan, 26 per cent partially
utilized and rest 24 per cent had diverted the loans. Out of diverters, 50 per cent
were marginal farmers and 50 per cent were agricultural labourers. Thirty-three
per cent had diverted the loan for family consumption, 17 per cent had used it for
repayment of debt and 50 per cent had purchased another cattle of their choice.
Bell and Srinivasan (1989) found a prominent place for interlinked transactions in
Indian rural economic life. In Punjab, interlinkage involves fairly large number of
farmers with marketable surplus and urban traders and commission agents. A
similar trend was observed in Andhra Pradesh and Bihar. Interlinkages of credit
and tenancy appears more in backward areas. Chandravarkar (1990) has
reviewed the work of Bbabman and Netherlands on informal rural finance in
India. ‘Bishi’ is a kind of self-help group common in Maharashtra based on caste
or income of members. Default was non-existent. These act as an alternative to
moneylenders, having links with commercial banks Pawn-brokers were found to
be important link between informal and institutional finance. With the
162
development of dairy industry, milk collectors act like registered moneylenders
who refinance the unregistered pawn brokers through commercial banks.
Reddy (1992) has analyzed the interlinkages of credit with factor
and product markets in Andhra Pradesh. The extent of interlinkage was found to
be less in developed villages. The credit linkage with marketing was totally
absent. The credit interlinkage was beneficial in developed village for both
agricultural labourers as well as lender farmers. While in backward village, input-
output linked transactions were dominant and were exploitative due to hidden
costs. The type of linkage which influences the positive or negative effect may
be dependent on the relative bargaining power of parties involved, urgency of
transaction and availability of formal credit. Pathuluru (1993) has also indicated a
diversion of about 40 per cent of the borrowed money towards non-development
purposes in Telangana. Singh et al (1985) have reported a problem of
repayment especially the ‘willful default’. It was found that small farmers had the
capacity to discharge their short term loan obligations but not of medium and
long term loans. However, in case of medium and large farmers they had the
repayment capacity, but did not repay willfully. Rao and Babu (1993) found that
crop loans, irrigation structure and machinery loans had relatively greater impact
on economic conditions of borrowers, while opinion was mixed on economic
impact of livestock loans. Binswanger and Khandker (1995) have studied the
impact of formal finance on rural economy of India. He had found a positive
effect of expanding network of commercial banks on rural non-farm employment
and output but output effect of expanded rural finance in agriculture was not
much. The impact was positive on rural wages, as the creation of non-farm
employment has added more to total employment. But poor repayment
performance has led to unviability of credit institutions. Basu and Quibria (1995)
highlighted that credit is considered as the instrument for monitoring other factor
inputs and has resulted in the practice of interlinkages in rural markets. Credit
market failure has caused a variety of institutions and practices and interlinkage
is one of these. It was found that formal credit market often excludes the poor,
thus least impact on alleviating poverty. Shergill (1997) found that out of total
debt of farmers, 54.72 per cent is short-term annually recurring type crop loans,
163

25.39 per cent is amount of long-term productive loans and 7.12 per cent is
mortgage debt in Punjab. Moorti et al (1998) conducted a study in Himachal
Pradesh. It was found that maximum loans were advanced for purchase of
seeds followed by milch animals and bullocks. However, overdues were found to
be increasing at a growth rate of 16.70 per cent due to slackness on the part of
management of societies. Rao and Narendra (1999) found in Karimnagar district
of Andhra Pradesh that after aailing credit, all the sampled farmers were
benefited in terms of increased human labour employment of 27.3 man days,
increased bullock labour employment of 3.1 bullock pair days per hectare for the
pooled data. Human labour generation was highest for medium farms and
bullock labour generated was highest in case of small farms. Net income from
farm business increased to the tune of Rs. 2225.13 per hectare for pooled farms.
The increase after the loan was highest for small farms. Bhaumic and Rahim
(1999) brought out that incidence of interlinkages between credit and other
contracts was much higher in agriculturally advanced areas and more so in
marginal farmers and labourers. Seven different types of interlinked credit
contracts were identified as input-cash, cash-labour, input-product, cash-
product-, cash-land tenancy, cash-land and product-labour. The probability of
entering into linked credit transactions was higher for the small, lower caste and
less educated cultivators. Mamta (1999) revealed that interlinkages were more
prevalent in the irrigated areas than in non-irrigated areas. These symbolize
class relations and are methods of surplus appropriation. A macro framework is
needed to explain persistence of tenancy and the interlinked deal. Singh and
Rawat (2001) found that in Deoria district farmers were using higher inputs in the
expectation of promising returns. The value of MVR of seed, manure and
fertilizers and irrigation were significantly higher than one in borrower farms
thereby suggesting a positive impact of credit on productivity through higher
inputs-use. Srinivasa (2001) conducted a study in Tamil Nadu and found that
misutilization was more among educated borrowers than illiterate and thus
leading to default. It was also higher in the age group of 35-50 years and was
least in below 35 years of age category. Political affiliations of the borrowers
have significant impact on their repayment pattern. Bera and Santra (2001)
164

found a decline in percentage of borrowers with the increase in the size of
ownership holdings. Defaulting was less in lower caste groups as compared to
higher castes. Also, defaulters as a percentage of borrowers of the lowest credit
class is found to be highest, whereas the intensity of default is observed to be
lowest in the highest loan class of borrower farmers. Defaulting was found to be
less when loan is taken for cash crops than when it is taken for subsistence crop.
However, no defined relationship was found between the scale of finance and
intensity of default.
Sidhu et al (2001) found that average productivity per hectare on credit
taking farms was higher by 29 per cent in case of small farms, 47.7 per cent in
semi-medium farms, 26 per cent on medium farms and 19 per cent in case of
large farms due to higher use of production inputs. Abdullah et al (2001) focused
to measure the credit use efficiency of Bangladesh Rural Advancement (BRAC)
and NGO’s agricultural credit programme. It was found that only about 48.76 per
cent of the total amount of credit was properly utilized by the borrowers while
utilization of agricultural credit for non-agricultural purposes was mainly for
repayment of debt, small business, food purchasing etc. Thus, majority of the
borrower respondents i.e. 85 per cent achieved very low economic development.
Roy et al (2003) studied Burdwan district of West Bengal. Among the 14 socio-
economic and situational variables, age, educational level and farm power
availability with the loanees had shown significant impact in changing the income
level of borrowers. Singh et al (2003-04) have studied the utilization of crop
loans in Chhattisgarh state. The non-defaulter group was found to be having
twice as better worth of assets than defaulters. Total income of non-defaulters
was found to be higher by 83 per cent than that of defaulters.
Gill (2004) in a study established a linkage between economic hardship,
indebtedness and increasing number of suicides in the farming community of
Punjab. The high interest rates charged on loans and diversion of loans for non-
productive purposes or crop failure led to debt trap creating pressure for suicides
through a variety of factors. The use of agricultural credit on non-productive uses
(59% of debt) was also highlighted by Singh (2005) in a study. Marginal farmers
were found to be incurring highest (71%) of the debt on ‘unproductive purpose’.
165

Sohi and Chahal (2004) have studied interlinked credit transactions in
rural Punjab. Credit-product linkage was found to be dominant, while product-
labour linkage was least important. Percentage of household links was found to
be decreasing as the farm size increases. In case of less developed regions,
credit linkage was high due to lower education level, less infrastructure facilities,
poor access to formal credit agencies etc. But the various types of linkages in
the credit transactions were found to ensure business activity for the lenders.
Narayanmoorthy and Kalamkar (2005) have related the problem of indebtedness
to credit availability across the states. It was found that wherever the availability
of credit per hectare of net sown area is higher, the extent of indebtedness was
also higher. Thus, incidence of indebtedness was found to be higher in the
agricultural advanced states i.e. 18 per cent in Assam to 82 per cent in Andhra
Pradesh. Gill and Singh (2006) had found that majority of borrowing cultivators
utilized the credit for productive purposes. Even 60 per cent of informal
borrowings had also been utilized for productive purposes like repair, fuel, hiring
of machinery, tubewells etc. Commission agents are thriving as they interlink
sale of crop with credit availability.
Sharma et al (2007) found that house construction is the major purpose of
borrowing and called it productive loan as assembling, storage, grading and
packing of produce is undertaken there, followed by crop production loan. Farm
size, education of head of the family, non-farm income were found to be
important factors affecting the borrowing behaviour of the households.
Investment in the farming business for longer period of time becomes
important due to slow rate of turnover in agriculture as well as the durability of
assets. With the advent of ‘green revolution’ in Punjab, farming business has
become more capital intensive. Farm investment has increased not only on
divisible inputs, but also on durable assets like irrigation structures, water
channels, construction of farm buildings, purchase of tractors, other tools and
implements etc. Long term credit is made available to farmers for investment.
The utilization of credit or its diversion is studied for the sampled farms in this
chapter. The analysis has been split according to zones as well as the state
level.
166

The category-wise farm investment for various zones, as well as state has
been studied on per household and per hectare basis. Tables 5.1 a and b show
the investment on purchase of land by the sampled farmers on per farm and per
hectare basis, respectively. It is found that on an average in Zone I, the
investment is Rs. 1,33,749/- per farm and Rs. 22,795/- per hectare for land
purchase. The amount borrowed for this purpose is worked out at Rs. 68,377/-
per farm and Rs. 11,654/- per hectare in Zone I which formed 51 per cent of
amount invested and diversion of borrowed amount is upto the extent of 10 per
cent. However, amount utilized as a percentage of amount invested is calculated
at 45.98 per cent in Zone I.
On an average, the investment for land purchase is Rs. 150469 per farm
and Rs. 31348 per hectare in zone-II. The amount borrowed is Rs. 51456 per
farm and Rs. 10720 per hectare for this purpose. The diversion of borrowed
funds for other purposes is found to the tune of 2 per cent. 34 per cent of land
purchase investment is comprised of borrowed funds but 33 per cent of these are
utilized for this purpose.
On the whole, in zone-III, no diversion of borrowed amount is reported and
53 per cent of borrowed funds are utilized for purpose of land purchase
investment.
For the state as a whole, in case of marginal farms, the investment is Rs.
56579 per farm and Rs. 71323 per hectare. The amount borrowed is Rs. 13158
per farm and Rs. 16586 per hectare. However, diversion of borrowed amount is
to the tune of 10 per cent and 23 per cent of the borrowed funds contributed
towards purchase of land, however, 21 percent of borrowed funds are utilized for
the investment on said purpose. On small farms, the investment is Rs. 8750 on
per farm basis and Rs. 5151 on per hectare basis. The borrowings are Rs. 9474
per farm and Rs. 3311 per hectare, respectively. The diversion is reported as nil
in case of small category farms, but 64 per cent of borrowed funds are utilized for
investment on land purchase. In case of semi-medium farms, the investment on
land purchase came to be Rs. 42617 per farm and Rs. 13060 per hectare and
Rs. 16162 per farm and Rs. 4952 per hectare are, respectively, borrowed for this
purpose. No diversion of borrowed funds is reported in this category and 38 per
167
cent of investment on land purchase is through borrowed funds. On medium
farms, the investment is found to be Rs. 267150 per farm and Rs. 38762 per
hectare, respectively. The amount borrowed is Rs. 117268 on per farm basis
and Rs. 17017 on per hectare basis. Here, the diverted amount is found to be
negligible and 44 per cent of borrowed funds are utilized for the said purpose. In
large category of farms Rs. 376958 are invested for land purchase on per farm
basis and Rs. 24080 on per hectare basis. The amount borrowed for this
purpose is Rs. 166522 per farm and Rs. 10637 per hectare, respectively. The
diversion is to the tune of 2 per cent on large farms of the state and borrowed
funds comprised 44 per cent of investment on land purchase. However, 43 per
cent of the borrowed funds are utilized for this purpose.
On the whole in state, only one per cent of borrowed amount for the
purpose of land purchase is diverted to other purposes. 43 per cent of the total
investment for this purpose is comprised of borrowed funds and 42 per cent of
these funds are utilized for land purchase in the state. The area purchased is
found to be increasing with the size of category in the state.
Tables 5.2 a and b give the account of amount invested and utilization of
credit for the purpose of leveling of land on per farm and per hectare basis,
respectively. On an average Rs. 10244 per farm are invested on leveling of land
in zone-I. The average amount borrowed for this purpose is Rs. 1325 per farm
and Rs. 226 on per hectare basis. The diversion of borrowed amount for this
purpose is found to be nil in zone-I. However, 13 per cent of borrowed amount
utilization as a percentage of amount invested is found in zone-I.
In zone-II, Rs. 7845 per farm and Rs. 1746 per hectare are invested on
leveling of land. The average amount borrowed came to be Rs. 5736 per farm
and Rs. 1195 per hectare for this purpose. 73 per cent of investment is
contributed by borrowed funds, while no amount of it is diverted for other
purposes. The analysis of zone-III shows that Rs. 5187 per farm and Rs. 837 per
hectare are invested for the said purpose and 54 per cent of this investment is
through borrowed funds, but borrowed amount is not diverted for any other
purposes.
168
For the state as a whole, the investment is Rs 934, Rs. 8421, Rs. 3552,
Rs. 11364 and Rs. 13714 on per farm basis for marginal, small, semi-medium,
medium and large categories, respectively. On per hectare basis, this
investment is Rs. 1178, Rs 4957, Rs. 1088, Rs. 1649, and Rs. 876, respectively
for the same categories. On an average, the investment for state came to be Rs.
7775 per farm and Rs. 1436 per hectare. The borrowed amount comprised for
28 per cent, 90 per cent, 72 per cent, 37 per cent, 27 per cent and 50 per cent of
investment in marginal, small, semi-medium, medium and large categories for
the state. Almost negligible diversion is found in case of small and semi-medium
categories, otherwise, no diversion of borrowed amount is found. The area
leveled is found to be increasing with the size of categories. The average
investment is found to be maximum for zone-I (Rs. 10244 per farm) as it is a sub-
mountainous zone with unleveled topography. However, maximum amount
borrowed is found in zone-II (average Rs. 5736 per farm).
The next purpose of investment is on water channels. It is an important
investment to smooth the flow of irrigation and also a strategic decision to invest
as the impact is long lasting and can not be revoked easily. On an average Rs.
6828 per farm and 1164 per hectare are invested on water channels in zone-I
(Tables 5.3 a and b). Rs. 3749 per farm and 639 per hectare are borrowed for
this purpose. Thus borrowed amount utilization as a per cent of amount invested
is to the tune of 54.91 per cent in zone-I as no diversion of borrowed amount is
found.
In zone-II Rs. 4572 per farm and Rs. 953 per hectare are invested on
water channels. Borrowed amount contributed 41.98 per cent of total investment
on water channels in this zone. On the whole, Rs. 1650 per farm are invested for
water channels in zone-III. On per hectare basis, this amount is Rs. 266. The
borrowed amount as a per cent of amount invested came to be 56.73 per cent.
The analysis of state reveals that self financed investment of Rs. 1342 per
farm and Rs. 1692 per hectare took place on marginal farms for the said purpose
and on small farms this amount is Rs. 497 per farm and Rs. 292 per hectare. On
semi-medium farms, the sum of Rs. 1848 per farm and Rs. 566 per hectare is
invested on water channels. The borrowed amount comprised 18.84 per cent of
169

this investment. The amount invested for the same purpose is Rs. 8411 per farm
and Rs. 1220 per hectare on medium farms of the state. The borrowed amount
is Rs. 3976 per farm and Rs. 245 per hectare, which accounted for 47.27 per
cent of investment on water channels. On large farm category, the investment
for the same purpose is Rs. 9651 per farm and Rs. 616 per hectare. Out of this
69.81 per cent of invested amount is contributed by borrowed amount.
On the whole, in state Rs. 4403 per farm are invested on water channels.
On per hectare basis, this investment tuned out to be Rs. 813. The borrowed
amount for this purpose is Rs. 2131 per farm and Rs. 393 per hectare, which
comprised for 48.38 per cent of amount invested and amount utilized for
investment, as no amount of borrowed funds is diverted for other purposes. It is
found that per farm investment is maximum in zone-I, while on per hectare basis
it is maximum in zone-II. Per farm borrowed amount is also maximum in zone-I.
On marginal as well as small farms, only in zone-II self financed investment for
this purpose is reported.
Investment on cattle shed is another purpose studied under this analysis
(Tables 5.4 a and b). On an average Rs. 20624 per farm are invested on cattle
shed in zone-I. On per hectare basis this amount is Rs. 3514. The borrowed
amount for the same purpose is Rs. 6626 per farm and Rs. 1129 per hectare.
This accounted for 32.13 per cent of the investment on cattle shed. However,
utilization of borrowed amount for the investment purpose is 31.82 per cent,
whereas, amount utilized of borrowed funds is 99 per cent because only 1 per
cent of borrowed funds are diverted for other purposes.
The zone-II scenario reveals that the average investment is Rs. 12581
per farm and Rs. 2621 on per hectare basis for the cattle sheds. Rs. 7851 per
farm and Rs. 1636 per hectare are borrowed for this purpose. The borrowed
funds accounted for 62.41 per cent of investment, also the utilization of these as
a percentage of investment is also 62.41 per cent as the diversion of borrowed
funds is nil. The proportion of borrowed funds is found to be less in top two
categories as compared to the lower categories in zone-II.
In case of zone-III, Rs. 27088 per farm and Rs. 4369 per hectare are
invested for the said purpose on an average. The borrowing for the purpose is to
170

the tune of Rs. 16269 per farm and Rs. 2624 per hectare i.e. 60.06 per cent of
investment. But 15 per cent of the borrowed funds are diverted for other
purposes and 85 per cent are utilized. So, utilization of borrowed funds for
investment came to be 50.83 percent.
For the state as a whole, in marginal category farms Rs. 6421 per farm
and Rs. 8094 per hectare are invested for the construction of cattle sheds. 90.17
per cent of this investment is through borrowed funds. On small farms, the
investment is Rs. 8047 per farm and Rs. 4737 per hectare for the same purpose.
Rs. 6203 per farm and Rs. 3651 per hectare are borrowed for cattle sheds i.e.
77.08 per cent of invested amount. As diversion reported of borrowed funds is
nil, so, all of the borrowed funds are utilized for the purpose of investment. Rs.
13070 per farm and Rs. 4004 per hectare are invested in case of semi-medium
farms on cattle sheds Rs. 11163 per farm and Rs. 3420 on per hectare basis are
borrowed for this purpose, which comprises 85.41 per cent of investment. As 95
per cent of borrowed funds are reported to be utilized due to 5 per cent is
diversion for other purposes. On medium farm category of the state, the
investment on cattle sheds is Rs. 21161 per farm and Rs. 3070 on per hectare
basis. The borrowed amount for this purpose is Rs. 11745 per farm and Rs.
1704 per hectare i.e. 55.5 per cent of invested amount. 15 per cent of borrowed
funds are reported to be diverted and 85 per cent are utilized, so 47.26 per cent
of borrowings actually comprised the investment due to this diversion. The
investment for the said purpose is Rs. 46157 per farm and Rs. 2948 per hectare
on large farms of the state. Rs. 10826 per farm and Rs. 692 per hectare are
borrowed and utilized for construction of cattle sheds i.e. 23.45 per cent of
investment as there is no diversion of borrowed of borrowed funds. On the
whole, Rs. 18206 per farm and Rs. 3363 per hectare are invested on cattle
sheds in the state. Rs. 9641 per farm and Rs. 1781 per hectare are borrowed for
this purpose, which accounts for 52.95 per cent of investment, but utilization of
borrowed funds for total investment is at 49.51 per cent as 7 per cent of these
borrowed funds are reported to be diverted for other purposes.
Construction of implements sheds is another purpose for which farmers
borrow funds. The average investment as shown in Tables 5.5 a and b, in zone-I
171

is Rs. 6374 per farm and Rs. 1086 per hectare for the said purpose, borrowed
funds are sought for 81.39 per cent of this investment. But, actual proportion of
credit amount in investment is 80.39 per cent as the diversion of borrowed
amount is reported at one percent. So, the ratio of amount utilized to amount
borrowed is 99 per cent for zone-I.
The analysis of zone-II shows the average investment is Rs. 3141 per
farm and Rs. 654 per hectare for implement sheds. The borrowed amount is Rs.
1751 per farm and Rs. 365 per hectare for this purpose. The 55.75 per cent of
total investment is through borrowed funds in zone-II.
The average investment of zone-III is Rs. 2338 per farm or Rs. 377 per
hectare on implement sheds. The amount borrowed for this purpose is Rs. 963
per farm and Rs. 155 per hectare, which comprise 41.20 per cent of this
investment.
At the state level money invested is nil on marginal farms. It is Rs. 953 per
farm and Rs. 561 per hectare in small category farms, 65.57 per cent of which is
through borrowed funds. On semi-medium farms, an investment of Rs.871 per
farm and Rs. 267 on per hectare is undertaken for this purpose. The borrowed
amount is Rs. 755 per farm or Rs. 231 per hectare i.e. 86.68 per cent. But, actual
share of borrowed amount is 85.65 per cent in invested amount due to diversion
of credit fund by 1.19 per cent for other purposes. So, utilization of borrowed
amount is 98.81 per cent. On medium farms of the state, Rs. 5268 per farm or
Rs. 665 per hectare are invested. The borrowed funds had comprised 81.04 per
cent of the investment for the purpose. In case of large category, the invested
amount is Rs. 13261 per farm and Rs. 847 on per hectare basis. The borrowings
are to the extent of Rs. 6520 per farm or Rs. 416 per hectare which accounted
for 49.17 per cent of the investment as diversions are negligible (0.39%) in this
category. On the whole, in state Rs. 3747 per farm and Rs. 692 on per hectare
basis are invested for the construction of implement sheds. 64.39 per cent of the
borrowed amount is utilized for this investment as negligible amount (0.25%) is
diverted for other purposes.
Irrigation is the basic requirement of agricultural growth. So, investment
on irrigation structures is an important component of capital formation in
172

agriculture. The investment pattern for this purpose has been shown in Tables
5.6 a and b. The average investment on electric motor in zone-I is Rs. 1044 per
farm or Rs. 178 per hectare. The borrowed proportion of this is 83.94 per cent
i.e. Rs. 873 per farm or Rs. 149 per hectare but this amount is not diverted for
any other purpose.
The analysis of zone-II shows that on an average, an investment of Rs.
4845 per farm or Rs. 1009 per hectare is undertaken here. The borrowed funds
comprised 60.87 per cent of this investment. However, 4 per cent of borrowed
amount is diverted for other purposes, so 96 per cent of these are utilized out of
the credit funds. This puts the share of loans in investment at 58.31 per cent.
In case of zone-III, the investment is of Rs. 930 per farm or Rs. 150 per
hectare. The borrowed funds accounted for 32.81 per cent of this investment as
Rs. 305 per farm and Rs. 49 per hectare are borrowed for electric motors.
On the whole, in state Rs. 2395 per farm and Rs. 3019 per hectare are
invested for this purpose in marginal category. The borrowed amount is Rs.
2105 per farm and Rs. 2654 per hectare i.e. 87.90 per cent of investment. As no
diversion of funds is reported, borrowed funds utilized for investment are 100 per
cent. On small farms, Rs. 547 per farm or Rs. 322 per hectare are invested for
the said purpose, but no borrowing is reported. In semi-medium category of
farms, the investment is Rs. 2013 per farm or Rs. 617 per hectare on implement
sheds. Rs. 598 per farm and Rs. 183 on per hectare basis are borrowed for this
purpose i.e. 29.69 per cent of the investment. The investment of Rs. 5316 per
farm and Rs. 771 per hectare is undertaken on medium farms of the state. Rs.
4377 per farm or Rs. 635 per hectare are borrowed for this purpose which
accounted for 82.34 per cent of the amount utilized for investment. In large
category farms, the investment is Rs. 3823 per farm and Rs. 244 per hectare.
The borrowed amount is Rs. 1261 per farm or Rs. 81 per hectare. 34 per cent of
the borrowed funds are reported to be diverted for other purposes, thus,
utilization of borrowed amount is 66 per cent. But, proportion of borrowed funds
in invested amount came to be 21.68 per cent due to diversion of loan amount.
On an average Rs. 2913 are invested on implement sheds on per farm basis in
the state and Rs. 538 per hectare basis. Rs. 1768 per farm are borrowed for this
173

purpose and on per hectare basis Rs. 327, which accounts for 60.70 per cent of
investment. However, actual proportion came at 58.49 per cent as 4 per cent of
borrowed funds are diverted for other purposes, so amount utilized for this
purpose is 96 per cent.
Diesel engine is also an important component of irrigation structure as well
as other machinery used on the farm. So, investment analysis is also
undertaken on this item head (Tables 5.7 a and b). Rs. 3069 per farm or Rs. 523
per hectare are invested on diesel engines in zone-I. The borrowed funds
accounted for 53.34 per cent of this investment as, no diversion of funds is
reported in this zone on an average.
The average investment for diesel engine is Rs. 1065 per farm or Rs. 222
per hectare in zone-II i.e. 80.22 per cent of this investment, but 17 per cent of
borrowed amount is reported to be diverted for other purposes. So, 83 per cent
of borrowed funds are utilized, but this led to 66.57 per cent share of the credit
amount in the investment for the said purposes..
On the whole, Rs. 1065 per farm are invested on diesel engines in zone-
III. On per hectare basis this amount is Rs. 804. The borrowed amount is Rs.
3191 per farm or Rs. 515 per hectare i.e. 64.05 per cent of amount invested.
However, 17 per cent of borrowed amount is reported to be diverted for other
motives and 83 per cent of it is utilized. So, borrowed funds utilized for the
purpose of investment came to be 53.46 per cent in real terms.
For the state as a whole, Rs. 2618 per farm and Rs. 3299 per hectare are
invested on diesel engines in marginal farm category. The borrowing is to the
extent of 81.41 per cent of investment, but 21 per cent of the borrowed amount is
diverted for other purposes and 79 per cent of it is utilized. So, 64.32 per cent of
the investment is through borrowing due to this diversion. On small farm
category, the investment is Rs. 313 per farm or Rs. 184 per hectare for the said
purpose. 50.03 per cent of borrowed funds are utilized for this purpose as no
diversion of funds is reported. In semi-medium category farms, Rs. 2139 per
farm or Rs. 655 per hectare are invested on diesel engines. The borrowed funds
are Rs. 1150 per farm or Rs. 353 per hectare, but 41 per cent of these funds are
utilized for other purposes. So, amount utilized of amount borrowed is 59 per
174

cent, but amount utilized of amount invested is 31.98 per cent of borrowed funds.
An investment of Rs. 4390 per farm and Rs. 637 per hectare is undertaken on
diesel engines in medium farm category of the state. 64.88 per cent of funds are
borrowed for this purpose, but only 1 per cent of these funds are diverted for
other purposes and 99 per cent are utilized, but utilization of borrowed amount of
amount invested is at 64.49 per cent. On large farms of the state, Rs. 2888 per
farm and Rs. 184 per hectare are invested on diesel engines. Rs. 1903 per farm
and Rs. 122 per hectare are borrowed for this purpose, though 9 per cent of
these are diverted for other purposes i.e. 91 per cent of borrowings are utilized.
So, 59.83 per cent of borrowed amount accounted for investment purpose in
actual terms. On the whole, in state Rs. 2543 per farm or Rs. 470 per hectare
are invested. Investment is maximum in marginal category, due to borrowing
under the schemes. A high extent of diversion is found under this purpose. On
an average, 13 per cent of borrowed funds are diverted in the state which means
87 per cent of amount borrowed is utilized. But, on an average 56.04 per cent of
invested amount for the said purpose is comprised of credit amount.
Tractor comprises the major component of machinery in Punjab
agriculture as it involves lumpy investment and credit availability on easier terms
for this purpose. The investment analysis for this purpose as undertaken in
Tables 5.8 a and b shows that in zone-I, average investment of Rs. 42375 per
farm or Rs. 7221 per hectare is undertaken on tractors in zone-I. 51.03 per cent
of this investment is comprised of borrowed funds, since no diversion of
borrowed amount is found.
The average investment on tractors in zone-II is Rs. 34802 per farm or Rs.
7250 per hectare. 69.08 per cent of invested amount is borrowed, however, 1
per cent of borrowed funds are utilized for other purposes. So, 99 per cent of
borrowed amount is utilized for this investment. Due to the diversion of funds,
the proportion of borrowed amount in amount invested decreased to 68.45 per
cent.
On an average, Rs. 25984 per farm and Rs. 4191 per hectare are
invested on tractors in zone-III. 62.80 per cent of this investment is comprised of
borrowed funds as no diversion of borrowed amount is reported.
175

The state level analysis shows that on marginal farms Rs. 12274 per
hectare or Rs. 9737 per farm are invested on purchase of tractors. Rs. 7895 per
farm and Rs. 9952 on per hectare basis are borrowed for this purpose i.e. 81.08
per cent of the invested amount. In small farm category, an investment of Rs.
9063 per farm and Rs. 5334 per hectare is undertaken for the said purpose. This
investment is comprised of borrowed funds to the extent of 65.52 per cent. Rs.
18953 per farm or Rs. 5803 per hectare are invested on tractors on semi-medium
farms of the state. The borrowed amount for this purpose is Rs. 10175 per farm
or Rs. 3115 per hectare i.e. 53.69 per cent of investment on tractors as only 4
per cent of borrowed amount is diverted for other purposes. On medium farms of
the state, Rs. 43464 per farm or Rs. 6307 per hectare are invested for the said
purpose. 63.19 per cent of this investment is funded through borrowed amount,
which is Rs. 27465 per farm and Rs. 3985 on per hectare basis. The diversion of
borrowed amount is almost negligible. In large farm category, the invested
amount is Rs. 102433 per farm or Rs. 6543 per hectare on tractors. Rs. 64350
per farm and Rs. 4111 per hectare are borrowed for this purpose. Thus 62.82
per cent of investment is comprised of borrowed funds. On the whole, Rs. 34468
per farm and Rs. 6367 per hectare are invested on tractors in the state. 62.35 per
cent of invested amount is borrowed, but 1 per cent of this is diverted to other
purposes. Thus 99 per cent of borrowed funds are utilized for the purpose of
tractor purchase in the state. This led to actual share of borrowed amount in
investment on tractors at 61.98 per cent.
With increased number of mechanized operations and activities on the
farm, the investment on other farm machinery / implements also gained
importance. The investment analysis for this component is also undertaken on
sampled farms and is shown in Tables 5.9 a and b. On an average Rs. 13710
per farm and Rs. 2335 per hectare are invested on farm machinery and
implements. Rs. 8138 per farm and Rs. 1386 per hectare borrowed for this
purpose. Thus borrowed funds account for 59.36 per cent of this investment.
The average amount invested is Rs. 5886 per farm and Rs. 1226 per
hectare are invested on farm machinery / implements in zone-II. The average
borrowing for the said purpose is Rs. 2658 per farm and Rs. 554 per hectare,
176

which accounted for 45.15 per cent of investment. But, actual share of credit
amount came to be 43.03 per cent as 5 per cent of borrowed amount is diverted
for other purposes. So, 95 per cent of borrowed amount is utilized for investment
on given purpose.
The analysis of zone-III shows that on an average investment for the said
purpose in zone-III is Rs. 9728 per farm and Rs. 1569 per hectare. The
proportion of borrowed funds in this investment is 78.39 per cent of. 100 per cent
of borrowed amount is utilized for this investment. However, no diversion of
borrowed funds is reported in this zone.
The marginal category on the state level shows negligible investment on
farm machinery and implements. Rs. 2172 per farm and Rs. 1278 per hectare
are invested in small farm category. The borrowed amount for this purpose is
Rs. 1718 per farm and Rs. 1011 per hectare, which accounted for 79.12 per cent
of the invested amount. On semi-medium farms Rs. 8268 per farm and Rs.
2530 per hectare are invested on the said purpose. The amount borrowed for
this purpose is Rs. 4093 per farm and Rs. 1253 per hectare i.e. 49.50 per cent of
investment. However, 6 per cent of borrowed amount is diverted to other
purposes, so, 94 per cent of these are utilized for investment purposes. This
diversion of credit amount put the proportion of amount borrowed in amount
invested at 46.50 per cent. On medium farms of the state the investment on farm
machinery / implements is Rs. 13542 per farm or Rs. 1965 per hectare. Rs. 8604
per farm or Rs. 1248 per hectare are borrowed for this i.e. 63.50 per cent of the
investment is through borrowed funds as no diversion of this fund is reported
here. On large farms of the state, an amount of Rs. 17395 per farm and Rs.
1111 per hectare is invested for the same purpose. 60.50 per cent of this
investment is comprised of borrowed funds as Rs. 10524 per farm and Rs. 672
per hectare is borrowed amount. For the state as a whole Rs. 8800 per farm is
the invested amount on farm machinery and implements. On per hectare basis
this investment is Rs. 1625. 59.87 per cent of the invested amount is borrowed,
but 1 per cent of it is utilized for other purposes. Thus, share of borrowing in
investment decreased to 59.11 per cent for the purpose of investment on farm
machinery and implements.
177
With the emergence of dairying as a major allied enterprise in Punjab
Agriculture, the investment on cattle assumes importance. The investment
pattern for this purpose has been shown in Tables 5.10 a and b. The average
investment on cattle in zone-I is Rs. 2075 per farm and Rs. 453 per hectare. Rs.
187 per farm and Rs. 32 per hectare are borrowed for this i.e. 9.03 per cent of
investment is through borrowed amount.
On the whole Rs. 13185 per farm are invested on cattle in zone-II. On per
hectare basis this investment is Rs. 2747. Rs. 7918 per farm or Rs. 1650 per
hectare are borrowed for this purpose i.e. 60.05 per cent of invested amount.
The average diversion of borrowed funds is 4 per cent in zone-II. This led to fall
in proportion of borrowed amount in investment and it is now 57.44 per cent.
The average investment in zone-III is Rs. 8308 per farm and Rs. 1340 per
hectare on cattle. An amount of Rs. 6463 per farm or Rs. 1042 per hectare is
borrowed for this purpose. On an average 77.79 per cent of investment is
through borrowed funds, as no diversion of credit is reported by the respondents.
The analysis of state shows that Rs. 10394 per farm and Rs. 13103 per
hectare is the investment on cattle in marginal farms. The amount borrowed for
this purpose is Rs. 7789 per farm or Rs. 9820 per hectare which is 74.94 per
cent of the investment. On small farms Rs. 14305 per farm and Rs. 8419 per
hectare are invested on cattle. Rs. 10250 per farm and Rs. 6033 per hectare are
borrowed for this investment, but 2 per cent of credit amount is diverted for other
uses and 98 per cent of borrowed funds are utilized for investment purposes.
So, 70.51 per cent of investment is through credit amount. The invested amount
on cattle is Rs. 9005 per farm or Rs. 2759 per hectare. 64.17 per cent of invested
funds are borrowed in this category, but 4 per cent of these are diverted for other
motives. Thus, utilization of borrowed funds for investment purpose is 96 per
cent. This led to 61.58 per cent of investment with the loan funds. On medium
farms, an investment of Rs. 5767 per farm or Rs. 837 per hectare is undertaken
on cattle. The credit for this investment is Rs. 3337 per farm and Rs. 484 per
hectare i.e. 57.85 percent of investment. However, 9 per cent of borrowed funds
are diverted for other motives causing a fall in proportion of borrowed funds
utilization in total investment i.e. at 52.85 per cent. In case of large farms Rs.
178

7717 per farm or Rs. 493 per hectare are invested for the said purpose. This
investment is comprised of 16.88 per cent of borrowed funds, but no diversion is
reported here. The average investment on cattle in the state is Rs. 9175 per
farm or Rs. 1696 per hectare. Rs. 5612 per farm and Rs. 1037 on per hectare
basis are borrowed for this purpose, thus accounting for 61.17 per cent of
invested funds. But 3 per cent of credit amount is reported to be diverted for
other purposes. Thus, 97 per cent of borrowed amount is utilized for investment
on cattle. But the share of loan amount shows a decline in amount invested due
to diversion and is 59.82 per cent. Thus, it is clear that per farm investment on
cattle is highest in zone-II and minimum in zone-I. But utilization of borrowed
funds for the said purpose is maximum in zone-III and minimum in zone-I
The problem of falling ground water table is widespread in Punjab
agriculture and the number of grey and dark blocks is increasing with higher use
of ground water. So, investment on deepening of wells to extract the water has
become important and has a bearing on cost of cultivation. The investment
pattern for this item head has been shown in Tables 5.11 a and b. The average
investment on deepening of wells in zone-I is Rs. 2013 per farm or Rs. 343 per
hectare. 68.89 per cent of this investment is contributed through borrowed funds,
but no diversion of borrowed amount is found.
On an average Rs. 8041 per farm and Rs. 1675 per hectare are invested
on deepening of wells in zone-II. 38.05 per cent of invested amount is borrowed,
however, 4 per cent of these are diverted to other motives. So, actually 36.49
per cent of borrowed funds comprised for invested amount here.
The average investment for the said purpose is Rs. 7753 per farm and Rs.
1250 on per hectare basis in zone-III. The borrowing is Rs. 5438 per farm and
Rs. 877 on per hectare basis i.e. 70.15 per cent of investment. But 4 per cent of
borrowed funds are diverted elsewhere. This led to decreasing the proportion of
amount borrowed in amount invested or actual utilization of credit for investment
at 67.24 per cent.
Rs. 4137 per farm and Rs. 5214 per hectare are invested on marginal
farms of state through self-owned resources for the said purpose. In case of
small farms, Rs. 5773 per farm and Rs. 3398 per hectare are invested. The
179

borrowed funds comprised 50.47 per cent of it. The investment is of Rs. 4340
per farm and Rs. 1330 per hectare on semi-medium category farms of the state.
Rs. 2448 per farm and Rs. 750 per hectare are borrowed for this. The diversion
of borrowed funds is to the extent of 19 per cent, which caused proportion of
credit amount for investment to the extent of 45.67 per cent. On medium farms,
the invested amount is Rs. 7685 per farm or Rs. 1115 per hectare. The
borrowed amount is Rs. 6045 per farm or Rs. 877 per hectare. This comprised
for 78.66 per cent of investment as only negligible amount (0.18%) is diverted to
other uses. In large category farms, Rs. 10976 per farm and Rs. 701 per hectare
are invested for deepening of wells. The credit utilization in this investment is
23.48 per cent as Rs. 2567 per farm and Rs. 164 per hectare are borrowed for
this. For the state as a whole, Rs. 6455 per farm and Rs. 1793 on per hectare
basis are invested for the said purpose. 50.10 per cent of investment is
borrowed, however, 4 per cent of these are diverted to other uses, thereby,
leading to a decline in share of borrowed amount in investment, which is now
48.12 per cent i.e. actual utilization of borrowed funds in total invested amount in
the state.
In the foregoing investment analysis the next purpose of investment is on
submersible pumps as presented in Tables 5.12 a and b. This is also a lumpy
investment and has gained importance due to falling water table in the state.
The average invested amount on submersible pumps is Rs. 72813 per farm or
Rs. 15636 per hectare in zone-I. 39.38 per cent of these are borrowed funds.
But diversion of borrowed amount is reported at 2 per cent. So, 98 per cent of
borrowings are utilized for the investment purpose. However, ratio of borrowed
amount utilized to amount invested declined to 38.43 per cent here.
The average invested amount in zone-II is Rs. 26046 per farm and Rs.
5426 per hectare on submersible pumps. The borrowing for this purpose is Rs.
17126 per farm or Rs. 3568 per hectare i.e. 65.75 per cent of investment. The
average diversion of funds is to the extent of 1 per cent. So, actually 65.15 per
cent of investment for the said purpose is comprised of credit amount.
In case of zone-III, installation of submersible pumps is not found to be an
important item of investment. No investment for this purpose is undertaken on
180
marginal, small, semi-medium and medium farm category. However, on large
farms Rs. 32245 per farm and Rs. 1878 on per hectare basis are invested for this
purpose and 91.75 percent of this investment is comprised of borrowed amount.
The average investment in zone-III came to be Rs. 4839 per farm and Rs. 716
per hectare. On an average Rs. 4440 per farm and Rs. 716 per hectare are
borrowed for this purpose in zone-III.
The state level investment on submersible pumps shows that on marginal
farms it is Rs. 5947 per farm and Rs. 7497 per hectare. 88.19 per cent share of
this investment is borrowed, but 13 per cent of borrowed amount is utilized for
other purposes. This diversion of funds caused the actual share of credit amount
for the said purpose at 77.13 percent on marginal farms. On small farm category,
an amount of Rs. 20859 per farm and Rs. 12276 per hectare are invested for the
same purpose. The borrowing for this investment is to the extent of 50.33
percent. In case of semi-medium farms, Rs. 29047 per farm and Rs. 8888 per
hectare are invested on submersible pumps. A sum of Rs.10686 per farm or Rs.
3270 per hectare is borrowed for this purpose which accounts for 36.79 per cent
of invested funds. Rs. 52965 per farm and Rs. 7686 per hectare are invested for
the said purpose in medium category farms of the state. The borrowed amount
for this investment is Rs. 31697 per farm and Rs. 4600 on per hectare basis i.e.
59.85 per cent of investment. In large farm category, Rs. 38280 per farm and
Rs. 4552 per hectare are invested for the same purpose and 49.41 per cent of
this investment is comprised of borrowed funds as Rs. 18913 per farm and Rs.
3291 per hectare are borrowed for this. On the whole, an amount of Rs. 32422
per farm or Rs. 6863 per hectare is invested on submersible pumps on the state
sample. Rs. 16832 per farm or Rs. 3975 per hectare are borrowed for the said
purpose i.e. 51.92 per cent of invested amount. But 1 per cent of borrowed
amount is diverted for other purposes. So, 99 per cent of credit amount is
utilized for this investment, thus now the real proportion of borrowed funds in
amount invested is 51.65 percent. The zone-wise analysis shows that per farm
investment is maximum in zone-I and minimum in zone-III. Investment on the
said purpose took place in all the categories of zone-II, but the marginal farms
witnessed maximum percentage of diversion. But overall diversion of credit
181
amount is more in zone-II than zone-I. Only marginal farms of zone-II reported
investment for the said purpose, but diversion rate of borrowed amount is also
found be high here.
‘Consumption purpose’ an other item of investment which is sometimes
referred to as ‘unproductive investment’. But in a way it is equally important as
farm inventory and it adds to efficiency of faming class though in an indirect way.
Purposes like construction of house, education, medical expenses are basic
items of expenditure. Other item heads like ceremonies and social obligations
assume significance as framers lives in a social matrix and has to comply with
certain customs and norms of society.
The first purpose discussed is construction of house of the sampled
farmers in Table 5.13. The average investment on construction of dwelling
house is Rs. 117325 per household of zone-I. Rs. 44989 per household are
borrowed on average basis here, which accounted for 38.35 per cent of invested
funds as only negligible amount is diverted at the zone level.
The average investment is of Rs. 141301 per household on construction
of house in zone-II. 28.42 per cent of invested funds are borrowed, but 8.98 per
cent of the borrowing is utilized elsewhere. So, the credit utilization in real sense
for the said purpose is calculated at 25.87 per cent of investment.
In case of zone-III, the average amount invested is Rs. 75951 per
household. Rs. 49687 per household are borrowed for the same. 6.42 per cent
of the borrowed funds are reported to be utilized for other purposes. So, credit
utilization for construction of dwelling house is calculated to be 61.22 per cent for
the purpose of investment in zone-III.
The overall analysis of the state shows that Rs. 72145 per household are
invested on the construction of dwelling house in marginal farms. The borrowed
amount in this category is Rs. 40092 per household i.e. 55.57 per cent of amount
invested. The diversion of borrowed funds is found to be high at 19.38 per cent
and led to decline in share of credit amount at 44.80 per cent of investment.
Thus, utilization of credit for the said investment is 80.62 per cent. On small
farms of the state, an amount of Rs. 59610 per household is invested on house
construction. 27.81 per cent of this investment is borrowed amount. But 10.86
182

per cent of borrowings are utilized for other purposes. The caused actual
utilization of loan amounts at 24.79 per cent of investment. An amount of Rs.
86279 per household is invested on the said purpose in case of semi-medium
farms. Rs. 35524 per household are borrowed for the same i.e. 41.17 per cent of
the invested amount. However, 7.06 per cent of the borrowings are channelised
to other motives. Thus, 92.94 per cent of borrowed amount is utilized for the
cited purpose of investment. Due to diversion of funds, the real share of credit
amount in the investment for the said purpose is 38.26 per cent now. On medium
farm category, an investment of Rs. 116397 per household is undertaken for the
construction of house. The borrowings are at Rs. 44071 per household, which
accounted for 37.86 per cent of investment. But, actual proportion of credit came
to be 36.40 per cent, as 3.87 per cent of borrowed funds are utilized for other
purposes. In case of large farms, the invested amount reported on the said
purpose is Rs. 306435 per household. The credit for the same is Rs. 99024 per
household i.e. 32.43 per cent of investment. But utilization in the real sense of
loan amount declined for the cited purpose and is 31.99 per cent as 1.33 per cent
of borrowed amount is utilized for other motives. The average investment in
sampled household is Rs. 118865 per household for Punjab state for the purpose
of construction of house. Rs. 43702 per household are borrowed to carry out this
investment, which accounted for 36.77 per cent of invested funds. The actual
utilization of borrowed funds is found to be 34.57 per cent because 5.96 per cent
of credit amount is utilized for other purposes. Thus, it is found that construction
of dwelling house emerged as an important item head of investment across the
categories as well as zones. The average per household investment is
maximum in zone-I and minimum in zone-III in the last five years. The utilization
of credit for this purpose is maximum in zone-III and minimum in zone-I. The
diversion of borrowed amount is maximum in zone-II, but almost negligible in
zone-I for the said purpose.
‘Expenditure on education’ is considered as another item head of
investment which plays an important role in development of human resource and
skill formation. With commercialization of agriculture, the farming community
needs to be more aware and well informed about various aspects of the
183

enterprise. Education, be it general or technical equips the person with sharp
acumen and capacity to adjust as well as respond to changing environment in
and around the farms well. The analysis of investment for this purpose has been
shown in Table 5.14.
The analysis of zone-I reveals that on an average Rs. 12186 per
household are spent on education here. Rs. 1562 per household or 12.82 per
cent of this expenditure is contributed by borrowed funds, but no diversion of this
fund is reported.
The average investment on the said purpose is Rs. 1597 per household in
zone-II. Rs. 564 per household are reported to be borrowed for this purpose
which accounts for 35.35 per cent of invested funds. But 38.96 per cent of credit
is utilized for other purposes. Thus, 21.54 per cent of loan amount is utilized for
the said purpose in zone-II.
In zone-III, invested amount on the said purpose is reported as Rs. 1500
per household and 58.42 per cent of it is comprised of credit amount.
The analysis of state shows that Rs. 3158 per household are spent on the
purpose of education in marginal category farms. 50 per cent of this amount is
borrowed. However, 58.33 per cent of loan amount is utilized for other purposes.
Amount utilized for the said purpose is 41.67 per cent. Thus, 20.84 per cent of
credit amount accounted for the investment purpose. The amount invested is
found to be nil in case of small farms. In semi-medium category of the state, Rs.
2908 per household are invested on the said purpose. The borrowed amount for
the same is Rs. 1511 per household, which accounted for 51.98 percent of
investment as only negligible amount (0.48%) of loan amount is diverted to other
uses. In medium category farms, Rs. 290 per household is invested on an
average and 100 per cent of these are financed through borrowed funds. The
invested amount is Rs. 20756 per household in case of large category farms.
7.34 per cent of this expenditure is comprised of loan amount as Rs. 1523 per
household are borrowed for this investment. The average investment on
education purpose is calculated at Rs. 4218 per household in the state. Rs. 891
per household is the credit amount for this purpose i.e. 21.11 per cent of
investment. However, 12.50 per cent of borrowed funds are diverted to other
184

purposes. So, the share of credit amount declined to 18.49 per cent of the
investment on education in sampled households of the state.
Another purpose analyzed in the present study as shown in Table 5.15, is
investment expenditure on the treatment of a sick person in the household. This
expenditure though productive in nature as it leads to investment in human
resource capital, is mostly considered under consumption purpose.
The average expenditure on medical treatment of a sick person in the
family is Rs. 13538 per household in zone-I in the last five years. 72.67 per cent
of the money spent is comprised of loan amount as Rs. 9838 per household are
borrowed for this expenditure. The proportion of credit amount in invested funds
is found to be declining in top two categories.
In case of zone-II, the average expenditure on medical treatment is Rs.
35258 per household. The borrowed amount for this purpose is Rs. 19425 per
household. 1.13 per cent of this loan amount is utilized for other purposes, thus
54.47 per cent of credit funds are actually utilized for the investment in said
purpose.
In zone-III, the average expenditure on medical treatment purpose is Rs.
16744 per household. The loan amount for this purpose is found to be Rs. 8545
per household, which accounted for 51.03 per cent of the expenditure
undertaken. No diversion of credit amount for the said purpose is found in zone-
III.
For the state as a whole, Rs. 10869 per household is the expenditure on
this purpose in marginal category farms. Rs. 4448 per household are borrowed
for the same i.e. 40.92 per cent of the expenditure. In case of small category
farms, the amount spent on treatment of sick is Rs. 30984 per household. Rs.
11454 per household are taken as loan for this motive, which amounted to 36.97
per cent of expenditure. But 3.47 per cent of borrowed funds are diverted to
other motives. Thus, utilization of credit amount in real sense is to the extent of
35.68 per cent of investment expenditure. The amount spent of the said purpose
is Rs. 12790 per household in semi-medium category of farms. Rs. 7884 per
household are borrowed for the same i.e. 61.64 per cent of amount spent.
However, 1.54 per cent of borrowed funds are utilized elsewhere. This led to
185

decline in the share of credit amount to 60.69 per cent of credit amount invested
for this purpose. On medium category farms, the amount spent on this purpose
is Rs. 15465 per household. 71.80 per cent of this expenditure is through
borrowed funds, as Rs. 11103 per household are taken on credit for the same.
In case of large farm category, Rs. 70220 per household are spent on the
treatment purpose of sick in the family. The borrowed amount for this purpose is
Rs. 44346 per household i.e. 63.15 per cent of the amount spent. On the whole,
an amount of Rs. 25175 per household is spent on the said purpose in the state.
Rs. 14296 per household are taken on credit for the same i.e. 56.79 per cent.
0.83 per cent of loan amount is diverted to other purposes. Thus, 56.32 per cent
of credit amount accounted for the investment for this purpose.
From the above analysis, it is clear that per household expenditure is
minimum in zone-I and maximum in zone-II. The diversion of loan amount is
found in zone-II only and is found to be nil in zone-I and zone-III.
While living in the society, farmer is bound by many social, religious rituals
and customs, which though totally unproductive from economic point of view,
became necessary from social point of view. ‘Marriage ceremony’ is one such
important item head in the category of consumption expenditure as it involves
huge expenditure in the light of ‘Big-Fat Punjabi Wedding’ concept. The
demonstration effect of this expenditure has trickled down to rural sector as well.
The expenditure pattern on this item head has been shown in Table 5.16. The
average expenditure in ‘marriage ceremonies’ is Rs. 88687 per household in
zone-I. The amount borrowed for this purpose is Rs. 29188 per household. The
diversion of borrowed funds is reported at 4.30 per cent. This led to 31.49 per
cent of credit accounting towards the above said expenditure in zone-I.
On an average, Rs. 116294 per household are spent on solemnizing of
weddings in sampled households of zone-II. The average amount borrowed for
the said purpose is Rs. 52214 per household. The diversion of this borrowed
amount is reported at 2.94 per cent. Thus, actual utilization of loan amount is
43.58 per cent of expenditure undertaken.
The average expenditure on the said purpose in zone-III is Rs. 81402 per
household. 42.81 per cent of this amount is borrowed i.e. Rs. 34332 per
186

household. But 0.73 per cent of credit amount is diverted to other purposes.
This caused credit contribution at 41.87 per cent of amount spent on the said
purpose.
Overall analysis of sampled households in the state shows that the
expenditure incurred on marriage ceremonies in case of marginal farms is
Rs.65132 per household. An amount of Rs. 40921 per household is borrowed
for this, but 2.59 per cent of loan amount is diverted to other uses. Thus,
proportion of borrowed funds is 61.19 per cent of total expenditure on marriage
ceremonies in this category. On small farms, the expenditure on the same
purpose is Rs. 61485 per household. Borrowed funds comprised 40.41 per cent
of the amount spent. In case of semi-medium farms, the expenditure undertaken
on the said purpose is Rs. 87616 per household. The borrowings for the same
are Rs. 38313 per household. However, 3.49 per cent of borrowed amount is
utilized for other motives. Thus, 42.20 per cent of expenditure is undertaken with
borrowed funds. An amount of Rs. 138604 per household is spent on the said
motive in medium category of farms. 28.52 per cent of the expenditure is
comprised of loan amount. 1.79 per cent of the loan amount is diverted to other
uses. Thus, actual utilization of credit for the said purpose in this category is
28.01 per cent of the expenditure. On large farms of the state, the expenditure
increased on wedding ceremonies is Rs. 137392 per household. The loan
amount taken for the said purpose is Rs. 77825 per household i.e. 56.64 per cent
of the expenditure. But 1.41 per cent of loan amount is utilized for other motives.
Thus, share of borrowed funds for the said purpose is 55.84 per cent of the
amount spent. The average amount in the state of Punjab on marriage
ceremonies is Rs. 100578 per household on the basis of sampled farms. The
amount borrowed for this is calculated at Rs. 41938 per household i.e. 41.70 per
cent of expenditure. However, 1.99 per cent of loan amount is diverted to other
purposes. Thus, 40.87 per cent of loan amount accounted for undertaking the
expenditure on marriage ceremonies in Punjab.
It is found that expenditure on per household basis on the basis of last five
years information is maximum in zone-II, and minimum in zone-III. The failure of
cotton crop in zone-III, during these years can be the reason for low expenditure
187

here. On the other hand, financial assistance provided by NRI relatives may
have led to higher expenditure in zone-I. The diversion of loan amount for this
purpose is more in zone-I than in zone-II and least in zone-III. The analysis
highlighted that borrowed amount as a percentage of investment expenditure is
maximum in zone-II and minimum in zone-I.
All other types of major consumption expenditures like performing of other
social and religious ceremonies, providing gifts, purchase of vehicles for private
use and other types of household gadgets are clubbed together under the adhoc
expenditure, which is also discussed in the present study as shown in Table
5.17.
It is found that adhoc expenditure undertaken is Rs. 22100 per household
in zone-I. The borrowed amount for this purpose is at Rs. 12694 per household
i.e. 57.44 per cent of the expenditure.
On an average, a sum of Rs. 44871 per household is spent in zone-II on
adhoc purposes. The borrowing for this item head is to the extent of 65.46 per
cent. But 10.23 per cent of loan amount is utilized elsewhere. This caused
58.77 per cent of actual utilization of credit for the said purpose.
However, Rs. 22492 per household are spent on adhoc purposes in zone-
III. A sum of Rs. 13174 per household is borrowed for the same i.e. 58.57 per
cent. However, 12.37 per cent of loan amount is utilized elsewhere. Thus 51.33
per cent of the credit is utilized in real sense for the purpose of expenditure.
For the state as a whole, the expenditure undertaken is Rs. 3263 per
household in case of marginal farm category. 43.55 per cent of this is through
credit amount as Rs. 1421 per household are borrowed for the said purpose. On
small farms, the amount spent is Rs. 60829 per household. The borrowings are
reported at Rs. 43484 per household i.e. 71.49 per cent of the expenditure. But
10.78 per cent of the loan amount is reported to be diverted for other purposes.
This led to proportion of credit amount at 63.78 per cent of the expenditure. In
case of semi-medium farms, the expenditure undertaken under the same item
head is Rs. 21313 per household. The amount borrowed for the same is Rs.
13232 per household which accounted for 62.08 per cent of the expenditure. The
diversion out of the borrowed amount is reported at 6.17 per cent. This loared
188

the utilization of credit for the said expenditure at 58.26 per cent. The
expenditure undertaken is Rs. 24547 per household in medium category of
farms. The amount borrowed for the same is Rs. 16807 per household i.e. 68.47
per cent of the expenditure. 6.92 per cent of the loan amount is utilized for
purposes other that cited. So, utilization of loan amount on cited purposes is
63.73 per cent of amount spent. In case of large farm category, the expenditure
is Rs. 60377 per household on adhoc purposes. The borrowed funds accounted
for 48.38 per cent of the expenditure. But, diversion of borrowed amount to the
extent of 10.44 per cent for purposes other than cited is reported. This led to
actual utilization of credit towards expenditure at 43.33 per cent. The average
expenditure in the state adhoc purposes is calculated at Rs. 33557 per
household. An amount of Rs. 21138 per household is borrowed for the same on
average basis, which is 62.99 per cent of the expenditure. But, 9.03 per cent of
credit amount is found to be utilized for purposes other than cited. Thus 57.31
per cent of the borrowed funds are found to be contributing towards adhoc
expenditure in the state.
REASONS FOR DIVERSION OF LOANWith rising overdues of institutional sources and increasing burden of
indebtedness, it is assumed that diversion of loans can be high in agricultural
sector. So, reasons are enlisted and on the basis of responses of farmers, these
are tabulated by expressing in percentage terms. The analysis is carried out
according to categories, across the zones. The results are presented in Table
5.18.
In zone-I, 21 farmers indulged in diversion of loan from the purpose cited
for procuring of loan amount which accounted for 26.25 per cent of sampled
farmers here. Maximum number of diversions i.e. 57.14 per cent are for
installation of submersible pumps. Construction of the house is the second
important reason for diversion cited by the farmers, which accounted for 42.86
per cent of the number of diversions. Two other reasons emerged for diversions
are found to be performing social/religious ceremonies and medical treatment
expenditure accounting for 23.81 per cent of diversions. 9.52 per cent of
diversions are for the expenditure on immigration of their wards to other
189

countries. Other reasons for diversion of loans are lack of consumption credit,
purchase of land, car, plot, tractor and animals each accounting for 4.76 per cent
of total diversions in zone-I. Category wise diversions are reported by a higher
number of farmers in upper categories than in lower categories. The number of
total diversions is maximum in medium category of farms and nil in the marginal
farms category.
There are 56 farmers who found to be indulged in diversion of borrowed
amount in zone-II i.e. 35 per cent of the sample size. Highest number of
diversions are due to lack of consumption credit. 42.86 per cent of diversions are
for consumption purposes. Two other important purposes of diversion are cited
as construction of dwelling house and to maintain the family expenditure by 23
farmers i.e. 41.07 per cent. Fifteen farmers diverted the borrowed amount for
social/religious ceremonies. Six farmers i.e. 10.71 per cent diverted the
borrowed amount for repayment of old debt and six farmers for the purchase of
land. There are five farmers (8.93%) who diverted the funds for medical
treatment expenditure. Two farmers each cited the installation of submersible
pump and immigration expenses of a family member as a purpose of diverting
the borrowed amount. In the zone-II as whole, purchase of tractor, purchase of
plot and purchase of animals is cited as a reason for diversion of borrowed
amount by one farmer for each purpose.
On the whole, 14 farmers reported the diversion in zone-III or 17.5 per
cent of the selected samples. The maximum number of diversions i.e. 8 farmers
(57.14%) are for the construction of houses. Six farmers i.e. 42.86 per cent
diverted the money for medical treatment expenses. Five farmers which
accounted for 35.71 per cent spent the loan amount on social/religious
ceremonies, while three farmers spent the money for purchase of animals. Two
farmers each diverted the borrowed funds for consumption purposes, installation
of submersible pumps and commission for procuring more loans. Repayment of
old debt and purchase of tractor is cited as a reason for diversion of funds by one
farmer each.
The diversion analysis of state as a whole shows that 10 farmers diverted
the loan amount in marginal farm category. Six farmers i.e. 26.09 per cent used
190

the funds for consumption purposes and six also for construction of dwelling
house. Five farmers diverted the funds for family maintenance expenditure.
Three farmers i.e. 13.04 per cent cited expenditure on social/religious
ceremonies as a reason for diversion of funds. One farm each in this category
diverted the loan amount due to medical treatment expenses, installation of
submersible pump, purchase of land and repayment of old debt.
Twenty-two farmers reported diversion in small farm category of the state.
Eight farmers i.e. 15.09 per cent diverted the money due to lack of consumption
credit and also eight due to construction of dwelling house. Six farmers i.e. 11.32
per cent spent the loan amount on family maintenance expenditure. Five farmers
i.e. 9.43 per cent used the borrowed funds for medical expenses. Three farmers
in this category diverted the funds for installation of submersible pumps. Two
farmers each used the funds for repayment of old debt, social/religious
ceremonies, for immigration expenses of a family member and commission for
procuring the fresh loans.
In case of semi-medium farms, the diversion is reported by 26 farmers.
Maximum number of diversions 10 in number are for expenses on social/religious
ceremonies. Nine farmers diverted the money on construction of dwelling
houses. Seven farmers i.e. 8.97 per cent diverted the amount for consumption
purposes. Four sampled farmers in this category used the loan amount for
medical treatment expenses. Three farmers i.e. 3.85 per cent and cited the
repayment of old debt and purchase of car as a reason of diverting the loan
amount. Installation of submersible pump and purchase of land is the cause of
using the loan amount by two farmers each. One farmer each used the loan
funds for education expenses of their ward, immigration expenses and purchase
of land, respectively.
The number of diversions reported on medium farmers are twenty three.
Maximum number of diversions i.e. 13 farmers are for construction of dwelling
house. Seven farmers used the borrowed funds for installation of submersible
pump. Six farmers diverted the funds for consumption purposes and six also for
expenditure on social/religious ceremonies. Family maintenance expenditure is
the cause of diversion of five farmers. Medical treatment expenditure of a sick
191
family member forced four farmers to divert the loan amount. Two persons are
found to be using borrowed funds for purchase of land. One farmer each utilized
the loan amount for repayment of old debt, for purchase of car and for
immigration expenses.
In large farm category of the sampled farmers, 10 diversions are reported
for the state as a whole. Four farmers made the diversion of loan amount for the
construction of dwelling house and four also for expenditure on social/religious
ceremonies. Installation of submersible pump is the cause of diversion of three
farmers. Two farmers diverted the money for purchase of land and two also for
medical treatment expenses. One farmer each diverted the loan amount for
purchase of car, for immigration expenses and one for family maintenance
expenditure.
Overall analysis of the state reveals that 91 diversions are reported from
the total sample size i.e. 28.44 per cent of the total sample size. Maximum
number of diversions i.e. 40 farmers are reported for the construction of dwelling
house. Next important cause of diversion is for consumption purpose i.e. 27
farmers. Twenty five farmers diverted the money for the purpose of
social/religious ceremonies. Overall sixteen farmers made the diversions for
medical treatment expenditure and sixteen for the installation of submersible
pumps. Seven farmers out of the total sample size diverted the money for
repayment of old debt, seven also reported it for the purchase of land. Five
farmers diverted the loan amount for the purchase of car and four persons
diverted it for immigration expenses. Two farmers made the diversion for
payment of commission for procurement of fresh loan.
The zone-wise comparison of number of diversions shows that the
diversions are maximum in case of zone II i.e. 35 per cent of total sample of zone
II, followed by zone I, in which number of diversions are found to the extent of
26.25 per cent. Zone III is at third position, where diversion percentage is 17.5 of
the sample size of zone III. The purpose of diversion also varied across the
zone, though construction of dwelling house the predominant cause of diversion
across the zones. In zone I, maximum number of diversions are for the purpose
of installation of submersible pumps. On the other hand, in zone II, consumption
192

purpose or the family maintenance expenditure is the major cause of diverting
the borrowed amount. However, in zone III, medical treatment expenditure
emerged as the major cause of diverting the borrowed funds. Immigration
expenses is one of the causes of diversion in zone I and zone II, but it did not
figure in zone III. Also, the repayment of old debt is a reason for diversion in
zone II. The expenditure on social/religious ceremonies is a prominent reason in
zone III i.e. 35.71 of total diversions in the zone, followed by zone II i.e. 26.79 per
cent of total diversions of the zone and least in zone I i.e. 23.81 per cent of total
diversions of the zone.
So, overall analysis shows that construction of house is the main reason,
followed by lack of consumption credit, expenditure on social/religious
ceremonies, medical expenses and installation of submersible pumps which
forced the sampled farmers to divert the borrowed amount for the purposes other
than stated with the borrowing agency.
Factors Affecting Diversion of LoanDiversion of loan means to divert a part of the loan from the purpose for
which it has been taken. Diversion of loan is considered a major problem in case
of agricultural credit. There may be several socio-personal and economic
reasons responsible for this. An attempt is made hereunder to identify the
factors affecting diversion of loan.
The factors are identified through regression analysis. Two forms of
regression equation are tried; one in its linear form and the other log-linear form.
One equation is finally chosen for the study keeping in view:
(i) Higher value of R2
(ii) Economic significance of variables; and
(iii) Logical significance of variables
Basing on the above criteria, linear form of regression equation is selected for
the study, which in its algebraic form is as under:
Y = a + x1b1 + x2
b2 + x3b3 + x4
b4 + x5b5 + x6
b6 + x7b7
+ x8b8
+ µ
Where Y = diversion as proportion of total loan taken
a = a constant term
x1 = farm size (ha)
193

x2 = non-institutional loan as proportion of total loan
x3 = cost of debt per hundred rupees
x4 = non-farm income (Rs. / annum)
x5 = household expenditure (Rs. / capita / annum)
x6 = Type of loan : Dummy
1 for short-term loan
2 for long-term loan
x7 = Education status of the borrower
x8 = Expenditure on social ceremonies, Rs. / farm
µ = Error term
The results of regression analysis are presented in Table 5.19.
The value of coefficient of multiple determination ranged between 0.5782
in zone-I and 0.7854 in zone-III. Therefore, the model is more powerful in
explaining the diversion of loan in zone-III, followed by zone-II and zone-I. This
pattern corresponds with the pattern of diversion of loan. For the state as a
whole, as much as 62.48 per cent of the variation in diversion of loan is explained
by the explanatory variables included in the equation.
The regression coefficient of farm size came to be significantly negative in
all the zones as well as in the state which ranged between -0.1937 in zone-II to
-0.4462 in zone-III. This indicates that an increase in farm size would lead
towards a decline in diversion of loan. This implies that diversion of loan is more
on smaller farms as compared to the larger ones. Similar is the pattern in case
of non-farm income. Diversion of loan would significantly decline with the
increase in income from non-farm sources. An increase of one rupee in non-farm
income would lead to a decline from 0.21 per cent in zone-I to 0.30 per cent in
zone-II in diversion of loan. This indicates that to check the diversion of loan,
non-farm employment should be generated.
The regression coefficient of share of non-institutional loan came to be
non-significant, which indicated that diversion has nothing to do with the source
of loan. Diversion of loan is irrespective of its source, because human needs and
194

habits are independent of source of loan. Similar is the case with cost of debt.
Whatsoever may be the cost of obtaining loan, diversion will be there.
Per capita household expenditure played no role towards increase or
decrease in diversion of loan in zone-I and zone-II but it contributed significantly
towards increasing the diversion of loan in zone-III. An increase of one unit in per
capita household expenditure would lead to an increase of 0.21 units in diversion
of loan in zone-III. The farmers in zone-III may have taken loan for other
purposes but used to fulfil their food and non-food requirements. The type of
loan, whether it is short-term loan or long-term loan, is also found to be
responsible for diversion of loan in zone-III only. This highlighted that diversion is
higher in long-term loan as compared to the short-term loan.
Education status of the borrower has emerged as a significant factor in
zone-II. It indicates that higher the level of education, lower will be the diversion
of loan. The expenditure on social ceremonies is considered as unproductive
expenditure and leads to misutilization of loans. This type of expenditure is
found to be playing a significant role in zone-I and zone-III as well as state as a
whole. That is more is the expenditure incurred on social ceremonies, more is
the diversion of loan.
Therefore, farm size, education status and non-farm income are significant
factors to make a decline in the diversion of loan, while long-term loan provides
more chances for diversion of loan compared to short-term loan. Household
expenditure is another factor in zone-III, while expenditure on social ceremonies
in zone-II, zone-III and state contributes to the diversion of loan.
195
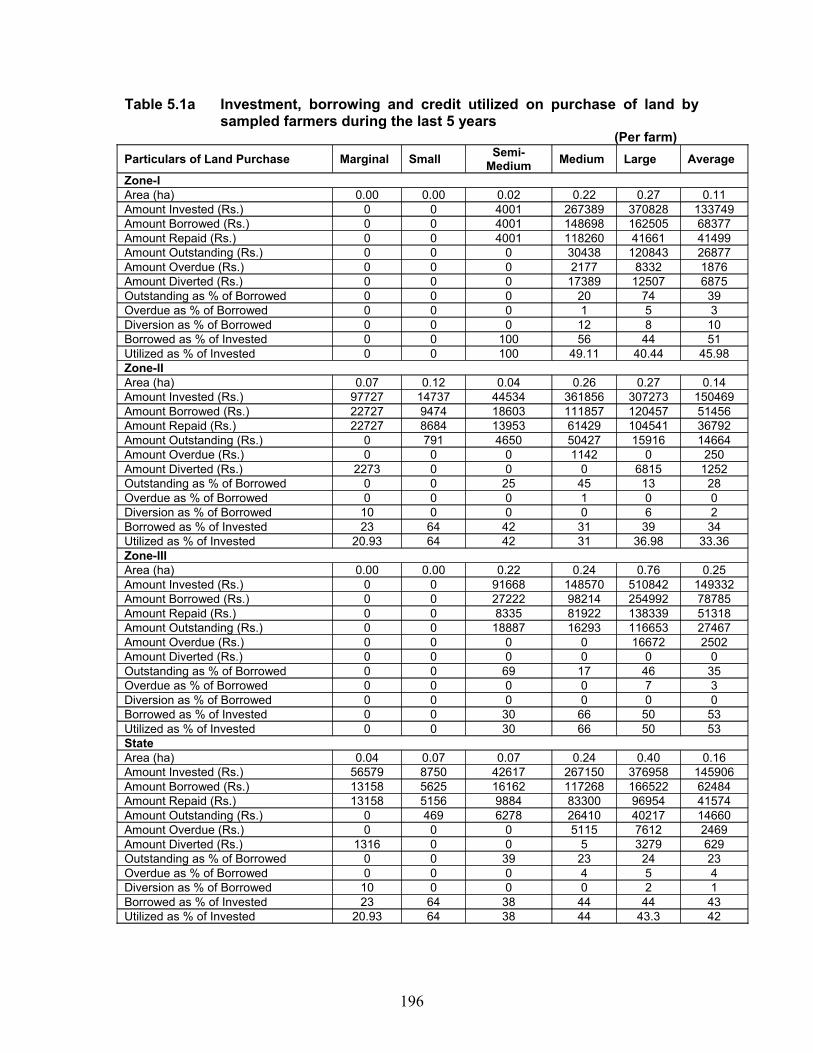
Table 5.1a Investment, borrowing and credit utilized on purchase of land by sampled farmers during the last 5 years
(Per farm)Particulars of Land Purchase Marginal Small Semi-
Medium Medium Large Average
Zone-IArea (ha) 0.00 0.00 0.02 0.22 0.27 0.11Amount Invested (Rs.) 0 0 4001 267389 370828 133749Amount Borrowed (Rs.) 0 0 4001 148698 162505 68377Amount Repaid (Rs.) 0 0 4001 118260 41661 41499Amount Outstanding (Rs.) 0 0 0 30438 120843 26877Amount Overdue (Rs.) 0 0 0 2177 8332 1876Amount Diverted (Rs.) 0 0 0 17389 12507 6875Outstanding as % of Borrowed 0 0 0 20 74 39Overdue as % of Borrowed 0 0 0 1 5 3Diversion as % of Borrowed 0 0 0 12 8 10Borrowed as % of Invested 0 0 100 56 44 51Utilized as % of Invested 0 0 100 49.11 40.44 45.98Zone-IIArea (ha) 0.07 0.12 0.04 0.26 0.27 0.14Amount Invested (Rs.) 97727 14737 44534 361856 307273 150469Amount Borrowed (Rs.) 22727 9474 18603 111857 120457 51456Amount Repaid (Rs.) 22727 8684 13953 61429 104541 36792Amount Outstanding (Rs.) 0 791 4650 50427 15916 14664Amount Overdue (Rs.) 0 0 0 1142 0 250Amount Diverted (Rs.) 2273 0 0 0 6815 1252Outstanding as % of Borrowed 0 0 25 45 13 28Overdue as % of Borrowed 0 0 0 1 0 0Diversion as % of Borrowed 10 0 0 0 6 2Borrowed as % of Invested 23 64 42 31 39 34Utilized as % of Invested 20.93 64 42 31 36.98 33.36Zone-IIIArea (ha) 0.00 0.00 0.22 0.24 0.76 0.25Amount Invested (Rs.) 0 0 91668 148570 510842 149332Amount Borrowed (Rs.) 0 0 27222 98214 254992 78785Amount Repaid (Rs.) 0 0 8335 81922 138339 51318Amount Outstanding (Rs.) 0 0 18887 16293 116653 27467Amount Overdue (Rs.) 0 0 0 0 16672 2502Amount Diverted (Rs.) 0 0 0 0 0 0Outstanding as % of Borrowed 0 0 69 17 46 35Overdue as % of Borrowed 0 0 0 0 7 3Diversion as % of Borrowed 0 0 0 0 0 0Borrowed as % of Invested 0 0 30 66 50 53Utilized as % of Invested 0 0 30 66 50 53StateArea (ha) 0.04 0.07 0.07 0.24 0.40 0.16Amount Invested (Rs.) 56579 8750 42617 267150 376958 145906Amount Borrowed (Rs.) 13158 5625 16162 117268 166522 62484Amount Repaid (Rs.) 13158 5156 9884 83300 96954 41574Amount Outstanding (Rs.) 0 469 6278 26410 40217 14660Amount Overdue (Rs.) 0 0 0 5115 7612 2469Amount Diverted (Rs.) 1316 0 0 5 3279 629Outstanding as % of Borrowed 0 0 39 23 24 23Overdue as % of Borrowed 0 0 0 4 5 4Diversion as % of Borrowed 10 0 0 0 2 1Borrowed as % of Invested 23 64 38 44 44 43Utilized as % of Invested 20.93 64 38 44 43.3 42
196

Table 5.1b Investment, borrowing and credit utilized on purchase of land by sampled farmers during the last 5 years
(Per hectare)Particulars of Land Purchase Marginal Small Semi-
Medium Medium Large Average
Zone-I
Amount Invested (Rs.) 0 0 1198 39672 21852 22795
Amount Borrowed (Rs.) 0 0 1198 22062 9576 11654
Amount Repaid (Rs.) 0 0 1198 17546 2455 7073
Amount Outstanding (Rs.) 0 0 0 4516 7121 4581
Amount Overdue (Rs.) 0 0 0 323 491 320
Amount Diverted (Rs.) 0 0 0 2580 737 1172
Zone-II
Amount Invested (Rs.) 120651 8669 13619 54170 21777 31348
Amount Borrowed (Rs.) 28058 5573 5689 16745 8537 10720
Amount Repaid (Rs.) 28058 5108 4267 9196 7409 7665
Amount Outstanding (Rs.) 0 465 1422 7549 1128 3055
Amount Overdue (Rs.) 0 0 0 171 0 52
Amount Diverted (Rs.) 2806 0 0 0 483 261
Zone-III
Amount Invested (Rs.) 0 0 29101 20408 29752 24086
Amount Borrowed (Rs.) 0 0 8642 13491 14851 12707
Amount Repaid (Rs.) 0 0 2646 11253 8057 8277
Amount Outstanding (Rs.) 0 0 5996 2238 6794 4430
Amount Overdue (Rs.) 0 0 0 0 971 404
Amount Diverted (Rs.) 0 0 0 0 0 0
State
Amount Invested (Rs.) 71323 5151 13060 38762 24080 26952
Amount Borrowed (Rs.) 16586 3311 4952 17017 10637 11542
Amount Repaid (Rs.) 16586 3035 3028 12088 6194 7680
Amount Outstanding (Rs.) 0 276 1924 4928 4444 3862
Amount Overdue (Rs.) 0 0 0 152 417 225
Amount Diverted (Rs.) 1659 0 0 675 417 433
197

Table 5.2a Investment, borrowing and credit utilized for levelling of land by sampled farmers during the last 5 years
(Per farm)Particulars of Land Levelling Marginal Small Semi-
Medium Medium Large Average
Zone-IArea (ha) 0.05 0.07 0.10 0.41 0.27 0.21Amount Invested (Rs.) 312 1666 2839 26785 9164 10244Amount Borrowed (Rs.) 0 834 2599 1348 0 1325Amount Repaid (Rs.) 0 625 2001 1348 0 1106Amount Outstanding (Rs.) 0 209 598 0 0 218Amount Overdue (Rs.) 0 0 595 0 0 186Amount Diverted (Rs.) 0 0 0 0 0 0Outstanding as % of Borrowed 0 25 23 0 0 16Overdue as % of Borrowed 0 0 23 0 0 14Diversion as % of Borrowed 0 0 0 0 0 0Borrowed as % of Invested 0 50 92 5 0 13Utilized as % of Invested 0 50 92 5 0 13Zone-IIArea (ha) 0.04 0.13 0.26 0.34 1.54 0.39Amount Invested (Rs.) 1046 13314 3675 8003 13038 7845Amount Borrowed (Rs.) 0 12500 2557 7428 3274 5736Amount Repaid (Rs.) 0 1710 2557 6860 3274 3046Amount Outstanding (Rs.) 0 10790 0 568 0 2690Amount Overdue (Rs.) 0 0 0 0 0 0Amount Diverted (Rs.) 0 0 0 0 0 0Outstanding as % of Borrowed 0 0 0 8 0 47Overdue as % of Borrowed 0 0 0 0 0 0Diversion as % of Borrowed 0 0 0 0 0 0Borrowed as % of Invested 0 94 70 93 25 73Utilized as % of Invested 0 94 70 93 25 73Zone-IIIArea (ha) 0.13 0.12 0.42 0.24 0.41 0.27Amount Invested (Rs.) 1250 928 4249 2897 19505 5187Amount Borrowed (Rs.) 1250 0 2501 2497 8327 2813Amount Repaid (Rs.) 1250 0 1389 2497 8327 2563Amount Outstanding (Rs.) 0 0 1112 0 0 251Amount Overdue (Rs.) 0 0 0 0 0 0Amount Diverted (Rs.) 0 0 0 0 0 0Outstanding as % of Borrowed 0 0 44 0 0 9Overdue as % of Borrowed 0 0 0 0 0 0Diversion as % of Borrowed 0 0 0 0 0 0Borrowed as % of Invested 100 0 59 86 43 54Utilized as % of Invested 100 0 59 86 43 54StateArea (ha) 0.06 0.12 0.25 0.33 0.91 0.32Amount Invested (Rs.) 934 8421 3552 11364 13714 7775Amount Borrowed (Rs.) 263 7578 2557 4197 3738 3899Amount Repaid (Rs.) 263 1133 2151 3966 3738 2439Amount Outstanding (Rs.) 0 6407 406 231 0 1452Amount Overdue (Rs.) 0 0 0 0 0 0Amount Diverted (Rs.) 0 5 7 0 0 3Outstanding as % of Borrowed 0 0 16 6 0 37Overdue as % of Borrowed 0 0 0 0 0 0Diversion as % of Borrowed 0 0 0 0 0 0Borrowed as % of Invested 28 90 72 37 27 50Utilized as % of Invested 28 90 72 37 27 50
198

Table 5.2b Investment, borrowing and credit utilized for levelling of land by sampled farmers during the last 5 years
(Per hectare)Levelling of Land Purchase Marginal Small Semi-
Medium Medium Large Average
Zone-I
Amount Invested (Rs.) 428 931 850 3974 540 1746
Amount Borrowed (Rs.) 0 466 778 200 0 226
Amount Repaid (Rs.) 0 349 599 200 0 188
Amount Outstanding (Rs.) 0 117 179 0 0 37
Amount Overdue (Rs.) 0 0 178 0 0 32
Amount Diverted (Rs.) 0 0 0 0 0 0
Zone-II
Amount Invested (Rs.) 1291 7832 1124 1198 924 1634
Amount Borrowed (Rs.) 0 7353 782 1112 232 1195
Amount Repaid (Rs.) 0 1006 782 1027 232 635
Amount Outstanding (Rs.) 0 6347 0 85 0 560
Amount Overdue (Rs.) 0 0 0 0 0 0
Amount Diverted (Rs.) 0 0 0 0 0 0
Zone-III
Amount Invested (Rs.) 1543 573 1349 398 1136 837
Amount Borrowed (Rs.) 1543 0 794 343 485 454
Amount Repaid (Rs.) 1543 0 441 343 485 413
Amount Outstanding (Rs.) 0 0 353 0 0 40
Amount Overdue (Rs.) 0 0 0 0 0 0
Amount Diverted (Rs.) 0 0 0 0 0 0
State
Amount Invested (Rs.) 1178 4957 1088 1649 876 1436
Amount Borrowed (Rs.) 332 4461 783 609 239 720
Amount Repaid (Rs.) 332 667 659 575 239 450
Amount Outstanding (Rs.) 0 3794 125 34 0 270
Amount Overdue (Rs.) 0 0 53 0 0 9
Amount Diverted (Rs.) 0 0 0 0 0 0
199

Table 5.3a Investment, borrowing and credit utilized on water channels by sampled farmers during the last 5 years
(Per farm)Investment on Water Channel Marginal Small Semi-
Medium Medium Large Average
Zone-IAmount Invested (Rs.) 0 0 2001 8533 24997 6828Amount Borrowed (Rs.) 0 0 0 2824 19583 3749Amount Repaid (Rs.) 0 0 0 2824 19583 3749Amount Outstanding (Rs.) 0 0 0 0 0 0Amount Overdue (Rs.) 0 0 0 0 0 0Amount Diverted (Rs.) 0 0 0 0 0 0Outstanding as % of Borrowed 0 0 0 0 0 0Overdue as % of Borrowed 0 0 0 0 0 0Diversion as % of Borrowed 0 0 0 0 0 0Borrowed as % of Invested 0 0 0 33.10 78.34 54.91Utilized as % of Invested 0 0 0 33.10 78.34 54.91Zone-IIAmount Invested (Rs.) 2318 836 2184 12632 5094 4572Amount Borrowed (Rs.) 0 0 697 6486 2272 1919Amount Repaid (Rs.) 0 0 582 4456 0 1132Amount Outstanding (Rs.) 0 0 114 2031 2272 788Amount Overdue (Rs.) 0 0 0 0 0 0Amount Diverted (Rs.) 0 0 0 0 0 0Outstanding as % of Borrowed 0 0 16 31 100 41Overdue as % of Borrowed 0 0 0 0 0 0Diversion as % of Borrowed 0 0 0 0 0 0Borrowed as % of Invested 0 0 31.89 51.35 44.60 41.98Utilized as % of Invested 0 0 31.89 51.35 44.60 41.98Zone-IIIAmount Invested (Rs.) 0 0 835 3036 2661 1650Amount Borrowed (Rs.) 0 0 0 1784 2078 936Amount Repaid (Rs.) 0 0 0 1784 2078 936Amount Outstanding (Rs.) 0 0 0 0 0 0Amount Overdue (Rs.) 0 0 0 0 0 0Amount Diverted (Rs.) 0 0 0 0 0 0Outstanding as % of Borrowed 0 0 0 0 0 0Overdue as % of Borrowed 0 0 0 0 0 0Diversion as % of Borrowed 0 0 0 0 0 0Borrowed as % of Invested 0 0 0 58.75 78.06 56.73Utilized as % of Invested 0 0 0 58.75 78.06 56.73StateAmount Invested (Rs.) 1342 497 1848 8411 9651 4403Amount Borrowed (Rs.) 0 0 348 3976 6737 2131Amount Repaid (Rs.) 0 0 291 3149 5651 1737Amount Outstanding (Rs.) 0 0 57 826 1086 394Amount Overdue (Rs.) 0 0 0 0 0 0Amount Diverted (Rs.) 0 0 0 0 0 0Outstanding as % of Borrowed 0 0 16 21 16 18Overdue as % of Borrowed 0 0 0 0 0 0Diversion as % of Borrowed 0 0 0 0 0 0Borrowed as % of Invested 0 0 18.84 47.27 69.81 48.38Utilized as % of Invested 0 0 18.84 47.27 69.81 48.38
200
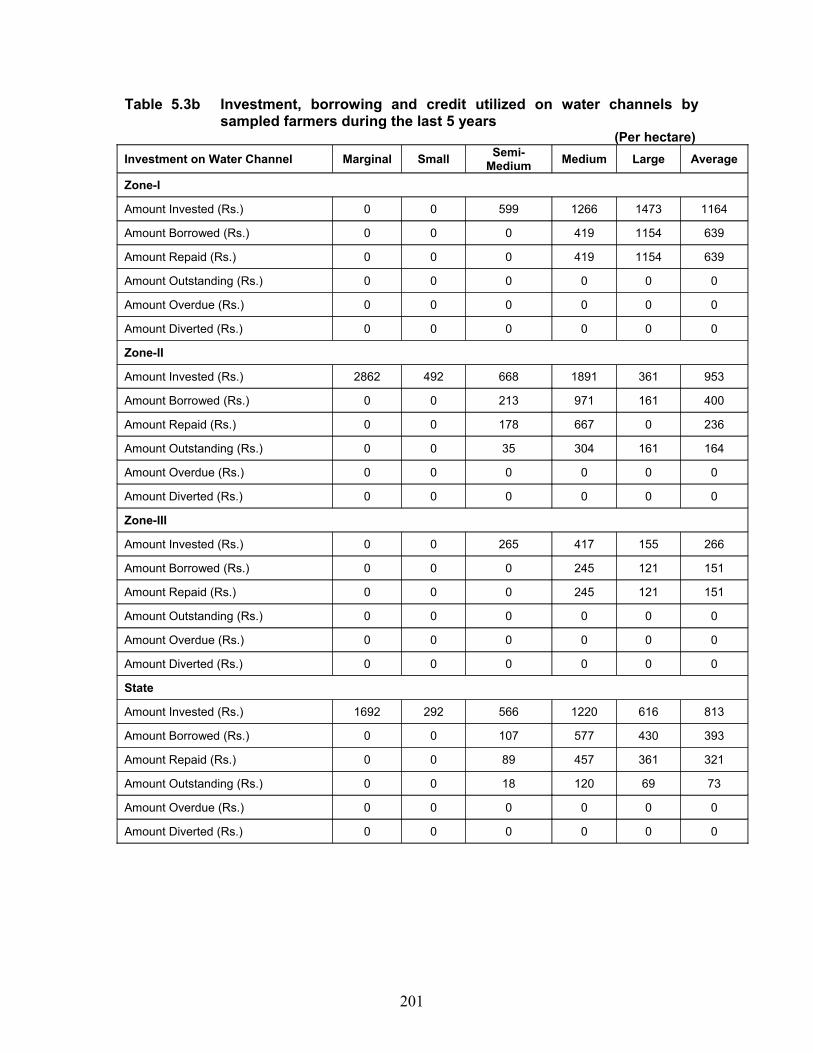
Table 5.3b Investment, borrowing and credit utilized on water channels by sampled farmers during the last 5 years
(Per hectare)Investment on Water Channel Marginal Small Semi-
Medium Medium Large Average
Zone-I
Amount Invested (Rs.) 0 0 599 1266 1473 1164
Amount Borrowed (Rs.) 0 0 0 419 1154 639
Amount Repaid (Rs.) 0 0 0 419 1154 639
Amount Outstanding (Rs.) 0 0 0 0 0 0
Amount Overdue (Rs.) 0 0 0 0 0 0
Amount Diverted (Rs.) 0 0 0 0 0 0
Zone-II
Amount Invested (Rs.) 2862 492 668 1891 361 953
Amount Borrowed (Rs.) 0 0 213 971 161 400
Amount Repaid (Rs.) 0 0 178 667 0 236
Amount Outstanding (Rs.) 0 0 35 304 161 164
Amount Overdue (Rs.) 0 0 0 0 0 0
Amount Diverted (Rs.) 0 0 0 0 0 0
Zone-III
Amount Invested (Rs.) 0 0 265 417 155 266
Amount Borrowed (Rs.) 0 0 0 245 121 151
Amount Repaid (Rs.) 0 0 0 245 121 151
Amount Outstanding (Rs.) 0 0 0 0 0 0
Amount Overdue (Rs.) 0 0 0 0 0 0
Amount Diverted (Rs.) 0 0 0 0 0 0
State
Amount Invested (Rs.) 1692 292 566 1220 616 813
Amount Borrowed (Rs.) 0 0 107 577 430 393
Amount Repaid (Rs.) 0 0 89 457 361 321
Amount Outstanding (Rs.) 0 0 18 120 69 73
Amount Overdue (Rs.) 0 0 0 0 0 0
Amount Diverted (Rs.) 0 0 0 0 0 0
201

Table 5.4a Investment, borrowing and utilization of credit on cattle sheds by sampled farmers during the last 5 years
(Per farm)Investment on Cattle Shed Marginal Small Semi-
Medium Medium Large Average
Zone-IAmount Invested (Rs.) 3750 0 12201 11519 87497 20624Amount Borrowed (Rs.) 3750 0 8801 2393 18752 6626Amount Repaid (Rs.) 3750 0 5999 2393 17089 5501Amount Outstanding (Rs.) 0 0 2802 0 1663 1125Amount Overdue (Rs.) 0 0 0 0 0 0Amount Diverted (Rs.) 0 0 200 0 0 63Outstanding as % of Borrowed 0 0 32 0 9 17Overdue as % of Borrowed 0 0 0 0 0 0Diversion as % of Borrowed 0 0 2 0 0 1Borrowed as % of Invested 100.00 0 72.13 20.77 21.43 32.13Utilized as % of Invested 100.00 0 70.49 20.77 21.43 31.82Zone-IIAmount Invested (Rs.) 2909 13158 8348 24997 9694 12581Amount Borrowed (Rs.) 1818 10052 6511 14001 2864 7851Amount Repaid (Rs.) 1818 4452 5582 11717 2864 5770Amount Outstanding (Rs.) 0 5600 929 2285 0 2081Amount Overdue (Rs.) 0 0 0 0 0 0Amount Diverted (Rs.) 0 0 0 0 0 0Outstanding as % of Borrowed 0 0 14 16 0 27Overdue as % of Borrowed 0 0 0 0 0 0Diversion as % of Borrowed 0 0 0 0 0 0Borrowed as % of Invested 62.52 76.40 77.99 56.01 29.55 62.41Utilized as % of Invested 62.52 76.40 77.99 56.01 29.55 62.41Zone-IIIAmount Invested (Rs.) 18750 1071 25556 24286 71668 27088Amount Borrowed (Rs.) 18750 1071 25556 16606 17496 16269Amount Repaid (Rs.) 12750 1071 8889 10003 8327 8223Amount Outstanding (Rs.) 6000 0 16667 6603 9169 8046Amount Overdue (Rs.) 0 0 0 0 4172 626Amount Diverted (Rs.) 0 0 2775 5358 0 2501Outstanding as % of Borrowed 0 0 0 40 52 49Overdue as % of Borrowed 0 0 0 0 24 4Diversion as % of Borrowed 0 0 10.86 32 0 15Borrowed as % of Invested 100.00 100.00 100.00 68.38 24.41 60.06Utilized as % of Invested 100.00 100.00 89.14 46.31 24.41 50.83StateAmount Invested (Rs.) 6421 8047 13070 21161 46157 18206Amount Borrowed (Rs.) 5790 6203 11163 11745 10826 9641Amount Repaid (Rs.) 4527 2878 6395 8665 8000 6311Amount Outstanding (Rs.) 1263 3325 3953 3080 2392 3049Amount Overdue (Rs.) 0 0 58 0 1088 172Amount Diverted (Rs.) 0 0 590 1744 0 628Outstanding as % of Borrowed 0 0 35 26 22 32Overdue as % of Borrowed 0 0 1 0 10 2Diversion as % of Borrowed 0 0 5 15 0 7Borrowed as % of Invested 90.17 77.08 85.41 55.50 23.45 52.95Utilized as % of Invested 90.70 77.08 80.89 47.26 23.45 49.51
202
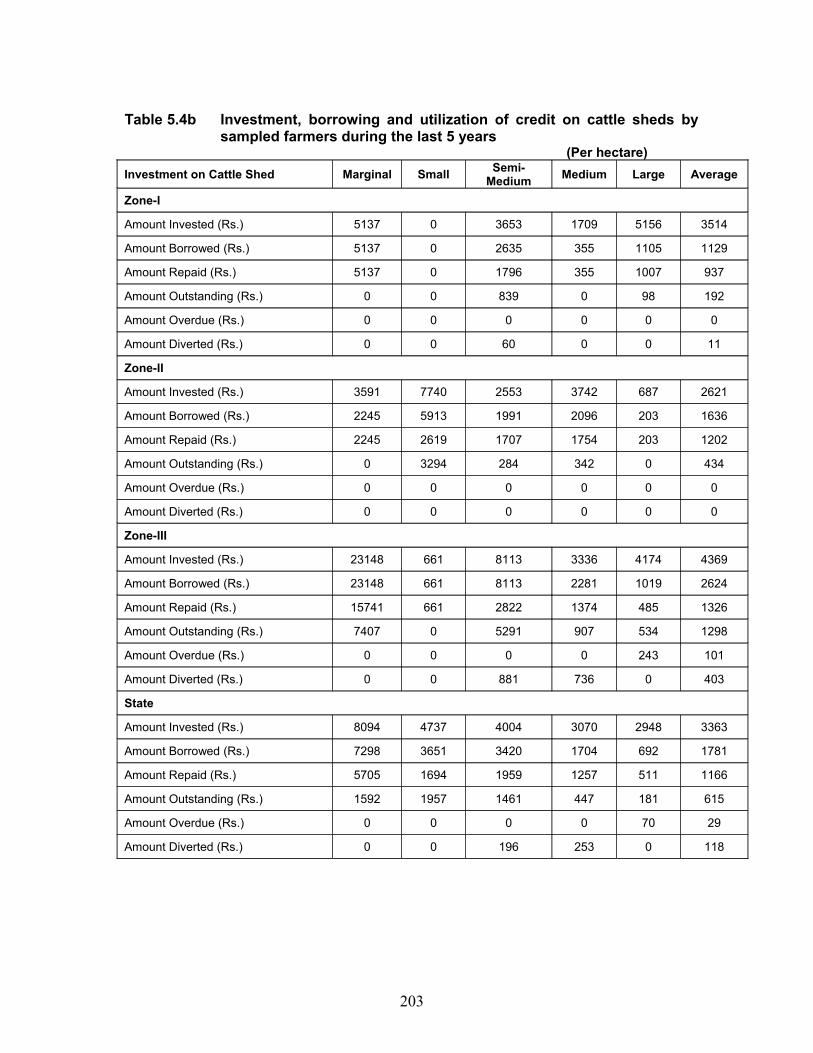
Table 5.4b Investment, borrowing and utilization of credit on cattle sheds by sampled farmers during the last 5 years
(Per hectare)Investment on Cattle Shed Marginal Small Semi-
Medium Medium Large Average
Zone-I
Amount Invested (Rs.) 5137 0 3653 1709 5156 3514
Amount Borrowed (Rs.) 5137 0 2635 355 1105 1129
Amount Repaid (Rs.) 5137 0 1796 355 1007 937
Amount Outstanding (Rs.) 0 0 839 0 98 192
Amount Overdue (Rs.) 0 0 0 0 0 0
Amount Diverted (Rs.) 0 0 60 0 0 11
Zone-II
Amount Invested (Rs.) 3591 7740 2553 3742 687 2621
Amount Borrowed (Rs.) 2245 5913 1991 2096 203 1636
Amount Repaid (Rs.) 2245 2619 1707 1754 203 1202
Amount Outstanding (Rs.) 0 3294 284 342 0 434
Amount Overdue (Rs.) 0 0 0 0 0 0
Amount Diverted (Rs.) 0 0 0 0 0 0
Zone-III
Amount Invested (Rs.) 23148 661 8113 3336 4174 4369
Amount Borrowed (Rs.) 23148 661 8113 2281 1019 2624
Amount Repaid (Rs.) 15741 661 2822 1374 485 1326
Amount Outstanding (Rs.) 7407 0 5291 907 534 1298
Amount Overdue (Rs.) 0 0 0 0 243 101
Amount Diverted (Rs.) 0 0 881 736 0 403
State
Amount Invested (Rs.) 8094 4737 4004 3070 2948 3363
Amount Borrowed (Rs.) 7298 3651 3420 1704 692 1781
Amount Repaid (Rs.) 5705 1694 1959 1257 511 1166
Amount Outstanding (Rs.) 1592 1957 1461 447 181 615
Amount Overdue (Rs.) 0 0 0 0 70 29
Amount Diverted (Rs.) 0 0 196 253 0 118
203

Table 5.5a Investment, borrowing and utilization of credit on implements sheds by sampled farmers during the last 5 years
(Per farm)Investment on Implements Shed Marginal Small Semi-
Medium Medium Large Average
Zone-IAmount Invested (Rs.) 0 0 2599 8695 20415 6374Amount Borrowed (Rs.) 0 0 2599 6524 16665 5187Amount Repaid (Rs.) 0 0 1800 6524 0 2438Amount Outstanding (Rs.) 0 0 798 0 16665 2749Amount Overdue (Rs.) 0 0 0 0 0 0Amount Diverted (Rs.) 0 0 200 0 0 63Outstanding as % of Borrowed 0 0 31 0 100 53Overdue as % of Borrowed 0 0 0 0 0 0Diversion as % of Borrowed 0 0 8 0 0 1Borrowed as % of Invested 0 0 100.00 75.04 81.63 81.39Utilized as % of Invested 0 0 92.3 75.04 81.63 80.39Zone-IIAmount Invested (Rs.) 0 1605 0 5030 12050 3141Amount Borrowed (Rs.) 0 1052 0 4001 4543 1751Amount Repaid (Rs.) 0 1052 0 4001 2272 1438Amount Outstanding (Rs.) 0 0 0 0 2272 313Amount Overdue (Rs.) 0 0 0 0 0 0Amount Diverted (Rs.) 0 0 0 0 0 0Outstanding as % of Borrowed 0 0 0 0 50 18Overdue as % of Borrowed 0 0 0 0 0 0Diversion as % of Borrowed 0 0 0 0 0 0Borrowed as % of Invested 0 65.57 0 79.55 37.70 55.75Utilized as % of Invested 0 65.57 0 79.55 37.70 55.75Zone-IIIAmount Invested (Rs.) 0 0 554 2752 8327 2338Amount Borrowed (Rs.) 0 0 0 2752 0 963Amount Repaid (Rs.) 0 0 0 248 0 87Amount Outstanding (Rs.) 0 0 0 2504 0 877Amount Overdue (Rs.) 0 0 0 0 0 0Amount Diverted (Rs.) 0 0 0 0 0 0Outstanding as % of Borrowed 0 0 0 91 0 91Overdue as % of Borrowed 0 0 0 0 0 0Diversion as % of Borrowed 0 0 0 0 0 0Borrowed as % of Invested 0 0 0 100.00 0 41.20Utilized as % of Invested 0 0 0 100.00 0 41.20StateAmount Invested (Rs.) 0 953 871 5268 13261 3747Amount Borrowed (Rs.) 0 625 755 4269 6520 2413Amount Repaid (Rs.) 0 625 523 3454 1086 1350Amount Outstanding (Rs.) 0 0 0 815 1086 375Amount Overdue (Rs.) 0 0 58 0 0 16Amount Diverted (Rs.) 0 0 9 0 26 6Outstanding as % of Borrowed 0 0 0 19 17 16Overdue as % of Borrowed 0 0 0 0 0 1Diversion as % of Borrowed 0 0 1.19 0 0.39 0.25Borrowed as % of Invested 0 65.57 86.68 81.04 49.17 64.39Utilized as % of Invested 0 65.57 85.65 81.04 48.97 64.23
204
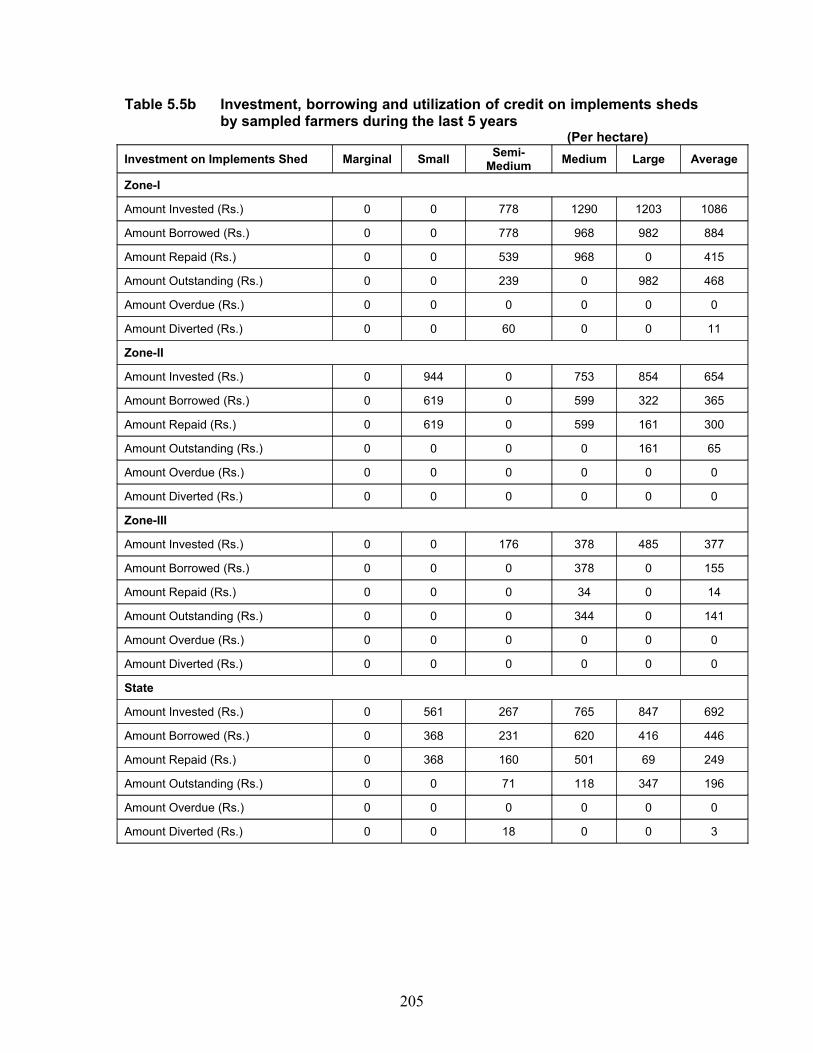
Table 5.5b Investment, borrowing and utilization of credit on implements sheds by sampled farmers during the last 5 years
(Per hectare)Investment on Implements Shed Marginal Small Semi-
Medium Medium Large Average
Zone-I
Amount Invested (Rs.) 0 0 778 1290 1203 1086
Amount Borrowed (Rs.) 0 0 778 968 982 884
Amount Repaid (Rs.) 0 0 539 968 0 415
Amount Outstanding (Rs.) 0 0 239 0 982 468
Amount Overdue (Rs.) 0 0 0 0 0 0
Amount Diverted (Rs.) 0 0 60 0 0 11
Zone-II
Amount Invested (Rs.) 0 944 0 753 854 654
Amount Borrowed (Rs.) 0 619 0 599 322 365
Amount Repaid (Rs.) 0 619 0 599 161 300
Amount Outstanding (Rs.) 0 0 0 0 161 65
Amount Overdue (Rs.) 0 0 0 0 0 0
Amount Diverted (Rs.) 0 0 0 0 0 0
Zone-III
Amount Invested (Rs.) 0 0 176 378 485 377
Amount Borrowed (Rs.) 0 0 0 378 0 155
Amount Repaid (Rs.) 0 0 0 34 0 14
Amount Outstanding (Rs.) 0 0 0 344 0 141
Amount Overdue (Rs.) 0 0 0 0 0 0
Amount Diverted (Rs.) 0 0 0 0 0 0
State
Amount Invested (Rs.) 0 561 267 765 847 692
Amount Borrowed (Rs.) 0 368 231 620 416 446
Amount Repaid (Rs.) 0 368 160 501 69 249
Amount Outstanding (Rs.) 0 0 71 118 347 196
Amount Overdue (Rs.) 0 0 0 0 0 0
Amount Diverted (Rs.) 0 0 18 0 0 3
205

Table 5.6a Investment, borrowing and utilization of credit on electric motors by sampled farmers during the last 5 years
(Per farm)Investment on Electric Motors Marginal Small Semi-
Medium Medium Large Average
Zone-IAmount Invested (Rs.) 0 0 1239 2285 0 1044Amount Borrowed (Rs.) 0 0 802 2177 0 876Amount Repaid (Rs.) 0 0 802 1739 0 750Amount Outstanding (Rs.) 0 0 0 438 0 126Amount Overdue (Rs.) 0 0 0 0 0 0Amount Diverted (Rs.) 0 0 0 0 0 0Outstanding as % of Borrowed 0 0 0 20 0 14Overdue as % of Borrowed 0 0 0 0 0 0Diversion as % of Borrowed 0 0 0 0 0 0Borrowed as % of Invested 0 0 64.69 95.28 0 83.94Utilized as % of Invested 0 0 64.69 95.28 0 83.94Zone-IIAmount Invested (Rs.) 4137 921 3306 10949 5588 4845Amount Borrowed (Rs.) 3636 0 729 8998 2046 2949Amount Repaid (Rs.) 1136 0 729 8998 0 2322Amount Outstanding (Rs.) 2500 0 0 0 2046 627Amount Overdue (Rs.) 0 0 0 0 0 0Amount Diverted (Rs.) 0 0 0 0 903 124Outstanding as % of Borrowed 69 0 0 0 100 21Overdue as % of Borrowed 0 0 0 0 0 0Diversion as % of Borrowed 0 0 0 0 44 4Borrowed as % of Invested 87.90 0 22.06 82.18 36.62 60.87Utilized as % of Invested 87.90 0 22.06 82.18 20.45 58.31Zone-IIIAmount Invested (Rs.) 0 0 0 764 4413 930Amount Borrowed (Rs.) 0 0 0 408 1082 305Amount Repaid (Rs.) 0 0 0 408 1082 305Amount Outstanding (Rs.) 0 0 0 0 0 0Amount Overdue (Rs.) 0 0 0 0 0 0Amount Diverted (Rs.) 0 0 0 0 0 0Outstanding as % of Borrowed 0 0 0 0 0 0Overdue as % of Borrowed 0 0 0 0 0 0Diversion as % of Borrowed 0 0 0 0 0 0Borrowed as % of Invested 0 0 0 53.33 24.51 32.81Utilized as % of Invested 0 0 0 53.33 24.51 32.81StateAmount Invested (Rs.) 2395 547 2013 5316 3823 2913Amount Borrowed (Rs.) 2105 0 598 4377 1261 1768Amount Repaid (Rs.) 658 0 598 4260 282 1424Amount Outstanding (Rs.) 1447 0 0 0 978 313Amount Overdue (Rs.) 0 0 0 0 0 0Amount Diverted (Rs.) 0 0 0 5 432 64Outstanding as % of Borrowed 69 0 0 0 78 18Overdue as % of Borrowed 0 0 0 0 0 0Diversion as % of Borrowed 0 0 0 0 34 4Borrowed as % of Invested 87.90 0 29.69 82.34 32.97 60.70Utilized as % of Invested 87.90 0 29.69 82.34 21.68 58.49
206

Table 5.6b Investment, borrowing and utilization of credit on electric motors by sampled farmers during the last 5 years
(Per hectare)Investment on electric motor Marginal Small Semi-
Medium Medium Large Average
Zone-I
Amount Invested (Rs.) 0 0 371 339 0 178
Amount Borrowed (Rs.) 0 0 240 323 0 149
Amount Repaid (Rs.) 0 0 240 258 0 128
Amount Outstanding (Rs.) 0 0 0 65 0 21
Amount Overdue (Rs.) 0 0 0 0 0 0
Amount Diverted (Rs.) 0 0 0 0 0 0
Zone-II
Amount Invested (Rs.) 5107 542 1011 1639 396 1009
Amount Borrowed (Rs.) 4489 0 223 1347 145 614
Amount Repaid (Rs.) 1403 0 223 1347 0 484
Amount Outstanding (Rs.) 3086 0 0 0 145 131
Amount Overdue (Rs.) 0 0 0 0 0 0
Amount Diverted (Rs.) 0 0 0 0 64 26
Zone-III
Amount Invested (Rs.) 0 0 0 105 257 150
Amount Borrowed (Rs.) 0 0 0 56 63 49
Amount Repaid (Rs.) 0 0 0 56 63 49
Amount Outstanding (Rs.) 0 0 0 0 0 0
Amount Overdue (Rs.) 0 0 0 0 0 0
Amount Diverted (Rs.) 0 0 0 0 0 0
State
Amount Invested (Rs.) 3019 322 617 771 244 538
Amount Borrowed (Rs.) 2654 0 183 635 81 327
Amount Repaid (Rs.) 829 0 183 618 18 263
Amount Outstanding (Rs.) 1824 0 0 17 63 64
Amount Overdue (Rs.) 0 0 0 0 0 0
Amount Diverted (Rs.) 0 0 0 0 28 11
207

Table 5.7a Investment, borrowing and utilization of credit on diesel engines by sampled farmers during the last 5 years
(Per farm)Investment on diesel engine Marginal Small Semi-
Medium Medium Large Average
Zone-IAmount Invested (Rs.) 5750 0 2201 6282 0 3069Amount Borrowed (Rs.) 5749 0 0 3694 0 1637Amount Repaid (Rs.) 5749 0 0 1308 0 951Amount Outstanding (Rs.) 0 0 0 2386 0 686Amount Overdue (Rs.) 0 0 0 0 0 0Amount Diverted (Rs.) 0 0 0 0 0 0Outstanding as % of Borrowed 0 0 0 65 0 42Overdue as % of Borrowed 0 0 0 0 0 0Diversion as % of Borrowed 0 0 0 0 0 0Borrowed as % of Invested 99.99 0 0 58.80 0 53.34Utilized as % of Invested 99.99 0 0 58.80 0 53.34Zone-IIAmount Invested (Rs.) 159 264 906 428 4670 1065Amount Borrowed (Rs.) 0 264 906 0 3979 854Amount Repaid (Rs.) 0 0 906 0 3161 679Amount Outstanding (Rs.) 0 264 0 0 818 175Amount Overdue (Rs.) 0 0 0 0 0 0Amount Diverted (Rs.) 0 0 350 0 367 145Outstanding as % of Borrowed 0 100 0 0 21 21Overdue as % of Borrowed 0 0 0 0 0 0Diversion as % of Borrowed 0 0 38.63 0 9 17Borrowed as % of Invested 0 100.00 100.00 0 85.20 80.22Utilized as % of Invested 0 100.00 61.37 0 77.34 66.57Zone-IIIAmount Invested (Rs.) 6250 714 4999 7790 2507 4983Amount Borrowed (Rs.) 4375 0 3333 5715 0 3191Amount Repaid (Rs.) 2250 0 554 5715 0 2352Amount Outstanding (Rs.) 2125 0 2778 0 0 840Amount Overdue (Rs.) 0 0 1499 0 0 338Amount Diverted (Rs.) 2125 0 1392 0 0 527Outstanding as % of Borrowed 49 0 83 0 0 26Overdue as % of Borrowed 0 0 45 0 0 11Diversion as % of Borrowed 49 0 42 0 0 17Borrowed as % of Invested 70.00 0 66.67 73.36 0 64.05Utilized as % of Invested 36.00 0 38.83 73.36 0 53.46StateAmount Invested (Rs.) 2618 313 2139 4390 2888 2543Amount Borrowed (Rs.) 2131 156 1150 2848 1903 1633Amount Repaid (Rs.) 1684 0 569 2210 1512 1164Amount Outstanding (Rs.) 447 156 582 0 391 297Amount Overdue (Rs.) 0 0 314 0 0 84Amount Diverted (Rs.) 447 0 466 17 175 208Outstanding as % of Borrowed 21 100 51 0 21 18Overdue as % of Borrowed 0 0 27 0 0 5Diversion as % of Borrowed 21 0 41 1 9 13Borrowed as % of Invested 81.41 50.03 53.78 64.88 65.90 64.19Utilized as % of Invested 64.32 50.03 31.98 64.49 59.83 56.04
208

Table 5.7b Investment, borrowing and utilization of credit on diesel engines by sampled farmers during the last 5 years
(Per hectare)Investment on diesel engine Marginal Small Semi-
Medium Medium Large Average
Zone-I
Amount Invested (Rs.) 7877 0 659 932 0 523
Amount Borrowed (Rs.) 7876 0 0 548 0 279
Amount Repaid (Rs.) 7876 0 0 194 0 162
Amount Outstanding (Rs.) 0 0 0 354 0 117
Amount Overdue (Rs.) 0 0 0 0 0 0
Amount Diverted (Rs.) 0 0 0 0 0 0
Zone-II
Amount Invested (Rs.) 196 155 277 64 331 222
Amount Borrowed (Rs.) 0 155 277 0 282 178
Amount Repaid (Rs.) 0 0 277 0 224 141
Amount Outstanding (Rs.) 0 155 0 0 58 37
Amount Overdue (Rs.) 0 0 0 0 0 0
Amount Diverted (Rs.) 0 0 107 0 26 30
Zone-III
Amount Invested (Rs.) 7716 441 1587 1070 146 804
Amount Borrowed (Rs.) 5401 0 1058 785 0 515
Amount Repaid (Rs.) 2778 0 176 785 0 379
Amount Outstanding (Rs.) 2623 0 882 0 0 135
Amount Overdue (Rs.) 0 0 476 0 0 54
Amount Diverted (Rs.) 2623 0 442 0 0 85
State
Amount Invested (Rs.) 3299 184 655 637 184 470
Amount Borrowed (Rs.) 2685 92 353 413 122 302
Amount Repaid (Rs.) 2121 0 174 321 97 215
Amount Outstanding (Rs.) 564 92 178 93 25 87
Amount Overdue (Rs.) 0 0 96 0 0 16
Amount Diverted (Rs.) 564 0 143 0 11 38
209

Table 5.8a Investment, borrowing and utilization of credit on tractor by sampled farmers during the last 5 years
(Per farm)Investment on Tractor Marginal Small Semi-
Medium Medium Large Average
Zone-IAmount Invested (Rs.) 0 0 24399 65216 106673 42375Amount Borrowed (Rs.) 0 0 14001 33916 49994 21625Amount Repaid (Rs.) 0 0 0 0 10827 1624Amount Outstanding (Rs.) 0 0 14001 33916 39167 20001Amount Overdue (Rs.) 0 0 0 0 0 0Amount Diverted (Rs.) 0 0 0 0 0 0Outstanding as % of Borrowed 0 0 100 100 78 92Overdue as % of Borrowed 0 0 0 0 0 0Diversion as % of Borrowed 0 0 0 0 0 0Borrowed as % of Invested 0 0 57.39 52.00 46.87 51.03Utilized as % of Invested 0 0 57.38 52.00 46.87 51.03Zone-IIAmount Invested (Rs.) 16818 12237 23721 45858 95539 34802Amount Borrowed (Rs.) 13636 7106 12210 32198 73640 24042Amount Repaid (Rs.) 13636 4473 5232 11483 42725 12750Amount Outstanding (Rs.) 0 2633 6978 20715 30915 11292Amount Overdue (Rs.) 0 0 0 0 0 0Amount Diverted (Rs.) 0 0 814 0 0 219Outstanding as % of Borrowed 0 37 57 64 42 47Overdue as % of Borrowed 0 0 0 0 0 0Diversion as % of Borrowed 0 0 7 0 0 1Borrowed as % of Invested 81.08 58.07 51.48 70.21 77.08 69.08Utilized as % of Invested 81.08 58.07 48.04 70.21 77.08 68.45Zone-IIIAmount Invested (Rs.) 0 8215 0 22604 110832 25984Amount Borrowed (Rs.) 0 7857 0 16249 61675 16319Amount Repaid (Rs.) 0 5714 0 16249 59580 15630Amount Outstanding (Rs.) 0 2143 0 0 2095 689Amount Overdue (Rs.) 0 0 0 0 0 0Amount Diverted (Rs.) 0 0 0 0 0 0Outstanding as % of Borrowed 0 27 0 0 3 4Overdue as % of Borrowed 0 0 0 0 0 0Diversion as % of Borrowed 0 0 0 0 0 0Borrowed as % of Invested 0 95.64 0 71.88 55.65 62.80Utilized as % of Invested 0 95.64 0 71.88 55.65 62.80StateAmount Invested (Rs.) 9737 9063 18953 43464 102433 34468Amount Borrowed (Rs.) 7895 5938 10175 27465 64350 21491Amount Repaid (Rs.) 7895 3906 2616 9964 38801 10677Amount Outstanding (Rs.) 0 2032 3489 8430 15332 5814Amount Overdue (Rs.) 0 0 0 0 0 0Amount Diverted (Rs.) 0 0 436 27 20 127Outstanding as % of Borrowed 0 34 34 31 24 27Overdue as % of Borrowed 0 0 0 0 0 0Diversion as % of Borrowed 0 0 4 0.09 0 1Borrowed as % of Invested 81.08 65.52 53.69 63.19 62.82 62.35Utilized as % of Invested 81.08 65.52 51.38 63.13 62.82 61.98
210

Table 5.8b Investment, borrowing and utilization of credit on tractor by sampled farmers during the last 5 years
(Per hectare)Investment on Tractor Marginal Small Semi-
Medium Medium Large Average
Zone-I
Amount Invested (Rs.) 0 0 7305 9676 6286 7221
Amount Borrowed (Rs.) 0 0 4192 5032 2946 3685
Amount Repaid (Rs.) 0 0 0 0 638 277
Amount Outstanding (Rs.) 0 0 4192 5032 2308 3408
Amount Overdue (Rs.) 0 0 0 0 0 0
Amount Diverted (Rs.) 0 0 0 0 0 0
Zone-II
Amount Invested (Rs.) 20763 7198 7254 6865 6771 7250
Amount Borrowed (Rs.) 16835 4180 3734 4820 5219 5009
Amount Repaid (Rs.) 16835 2631 1600 1719 3028 2656
Amount Outstanding (Rs.) 0 1549 2134 3101 2191 2352
Amount Overdue (Rs.) 0 0 0 0 0 0
Amount Diverted (Rs.) 0 0 249 0 0 46
Zone-III
Amount Invested (Rs.) 0 5071 0 3105 6455 4191
Amount Borrowed (Rs.) 0 4850 0 2232 3592 2632
Amount Repaid (Rs.) 0 3527 0 2232 3470 2521
Amount Outstanding (Rs.) 0 1323 0 0 122 111
Amount Overdue (Rs.) 0 0 0 0 0 0
Amount Diverted (Rs.) 0 0 0 0 0 0
State
Amount Invested (Rs.) 12274 5334 5803 6307 6543 6367
Amount Borrowed (Rs.) 9952 3494 3115 3985 4111 3970
Amount Repaid (Rs.) 9952 2298 801 1446 2479 1973
Amount Outstanding (Rs.) 0 1196 2314 2540 1632 1997
Amount Overdue (Rs.) 0 0 0 0 0 0
Amount Diverted (Rs.) 0 0 125 0 0 20
211

Table 5.9a Investment, borrowing and utilization of credit by sampled farmers on other farm machinery and implements during the last 5 years
(Per farm)Investment on farm machinery and implement Marginal Small Semi-
Medium Medium Large Average
Zone-IAmount Invested (Rs.) 150 0 18280 12024 30173 13710Amount Borrowed (Rs.) 0 0 9041 3694 28340 8138Amount Repaid (Rs.) 0 0 4001 3694 28340 6563Amount Outstanding (Rs.) 0 0 5040 0 0 1575Amount Overdue (Rs.) 0 0 0 0 0 0Amount Diverted (Rs.) 0 0 0 0 0 0Outstanding as % of Borrowed 0 0 56 0 0 19Overdue as % of Borrowed 0 0 0 0 0 0Diversion as % of Borrowed 0 0 0 0 0 0Borrowed as % of Invested 0 0 49.46 30.72 93.93 59.36Utilized as % of Invested 0 0 49.46 30.72 93.93 59.36Zone-IIAmount Invested (Rs.) 0 1447 5327 12886 9369 5886Amount Borrowed (Rs.) 0 789 2348 7141 2004 2658Amount Repaid (Rs.) 0 789 2348 2772 2004 1702Amount Outstanding (Rs.) 0 0 0 4369 0 956Amount Overdue (Rs.) 0 0 0 0 0 0Amount Diverted (Rs.) 0 0 464 0 0 125Outstanding as % of Borrowed 0 0 0 61 0 36Overdue as % of Borrowed 0 0 0 0 0 0Diversion as % of Borrowed 0 0 20 0 0 5Borrowed as % of Invested 0 54.52 44.08 55.42 21.39 45.15Utilized as % of Invested 0 54.52 35.37 55.42 21.39 43.03Zone-IIIAmount Invested (Rs.) 0 6000 1389 15608 19333 9728Amount Borrowed (Rs.) 0 5714 1389 14465 8327 7626Amount Repaid (Rs.) 0 714 0 11604 8327 5437Amount Outstanding (Rs.) 0 4999 1389 2861 0 2189Amount Overdue (Rs.) 0 0 0 0 0 0Amount Diverted (Rs.) 0 0 0 0 0 0Outstanding as % of Borrowed 0 87 100 20 0 29Overdue as % of Borrowed 0 0 0 0 0 0Diversion as % of Borrowed 0 0 0 0 0 0Borrowed as % of Invested 0 95.22 100.00 92.68 43.07 78.39Utilized as % of Invested 0 95.22 100.00 92.68 43.07 78.39StateAmount Invested (Rs.) 32 2172 8268 13542 17395 8800Amount Borrowed (Rs.) 0 1718 4093 8604 10524 5269Amount Repaid (Rs.) 0 625 2337 5894 10524 3850Amount Outstanding (Rs.) 0 1094 291 2709 0 1025Amount Overdue (Rs.) 0 0 0 0 0 0Amount Diverted (Rs.) 0 0 248 0 0 67Outstanding as % of Borrowed 0 64 7 31 0 19Overdue as % of Borrowed 0 0 0 0 0 0Diversion as % of Borrowed 0 0 6 0 0 1Borrowed as % of Invested 0 79.12 49.50 63.53 60.50 59.87Utilized as % of Invested 0 79.12 46.50 63.53 60.50 59.11
212

Table 5.9b Investment, borrowing and utilization of credit by sampled farmers on other farm machinery and implements during the last 5 years
(Per hectare)Investment on farm machinery and implement Marginal Small Semi-
Medium Medium Large Average
Zone-I
Amount Invested (Rs.) 205 0 5473 1784 1778 2335
Amount Borrowed (Rs.) 0 0 2707 548 1670 1386
Amount Repaid (Rs.) 0 0 1198 548 1670 1118
Amount Outstanding (Rs.) 0 0 1509 0 0 268
Amount Overdue (Rs.) 0 0 0 0 0 0
Amount Diverted (Rs.) 0 0 0 0 0 0
Zone-II
Amount Invested (Rs.) 0 851 1629 1929 664 1226
Amount Borrowed (Rs.) 0 464 718 1069 142 554
Amount Repaid (Rs.) 0 464 718 415 142 355
Amount Outstanding (Rs.) 0 0 0 654 0 199
Amount Overdue (Rs.) 0 0 0 0 0 0
Amount Diverted (Rs.) 0 0 142 0 0 26
Zone-III
Amount Invested (Rs.) 0 3704 441 2144 1126 1569
Amount Borrowed (Rs.) 0 3527 441 1987 485 1230
Amount Repaid (Rs.) 0 441 0 1594 485 877
Amount Outstanding (Rs.) 0 3086 441 393 0 353
Amount Overdue (Rs.) 0 0 0 0 0 0
Amount Diverted (Rs.) 0 0 0 0 0 0
State
Amount Invested (Rs.) 40 1278 2530 1965 1111 1625
Amount Borrowed (Rs.) 0 1011 1253 1248 672 973
Amount Repaid (Rs.) 0 368 715 855 672 711
Amount Outstanding (Rs.) 0 643 537 393 0 262
Amount Overdue (Rs.) 0 0 0 0 0 0
Amount Diverted (Rs.) 0 0 71 0 0 12
213

Table 5.10a Investment, borrowing and utilization of credit by sampled farmers on cattle by farmers during the last 5 years
(Per farm)Investment on Cattle Marginal Small Semi-
Medium Medium Large Average
Zone-IAmount Invested (Rs.) 1625 2916 3320 0 2919 2075Amount Borrowed (Rs.) 0 1249 0 0 0 187Amount Repaid (Rs.) 0 750 0 0 0 113Amount Outstanding (Rs.) 0 499 0 0 0 75Amount Overdue (Rs.) 0 0 0 0 0 0Amount Diverted (Rs.) 0 0 0 0 0 0Outstanding as % of Borrowed 0 40 0 0 0 40Overdue as % of Borrowed 0 0 0 0 0 0Diversion as % of Borrowed 0 0 0 0 0 0Borrowed as % of Invested 0 42.85 0 0 0 9.03Utilized as % of Invested 0 42.85 0 0 0 9.03Zone-IIAmount Invested (Rs.) 11091 20356 8999 12057 12727 13185Amount Borrowed (Rs.) 7181 15606 5278 6486 2723 7918Amount Repaid (Rs.) 5818 10237 4768 6486 2723 6315Amount Outstanding (Rs.) 1363 5369 510 0 0 1602Amount Overdue (Rs.) 0 0 0 0 0 0Amount Diverted (Rs.) 0 264 464 715 0 344Outstanding as % of Borrowed 0 34 10 0 0 20Overdue as % of Borrowed 0 0 0 0 0 0Diversion as % of Borrowed 0 2 9 11 0 4Borrowed as % of Invested 64.75 76.67 58.65 53.80 21.40 60.05Utilized as % of Invested 64.75 75.37 53.49 47.86 21.40 57.44Zone-IIIAmount Invested (Rs.) 17250 7643 16916 2643 3331 8308Amount Borrowed (Rs.) 17250 3428 15000 2140 0 6463Amount Repaid (Rs.) 10375 2143 11668 1427 0 4546Amount Outstanding (Rs.) 6874 1285 3333 713 0 1916Amount Overdue (Rs.) 3125 0 0 0 0 314Amount Diverted (Rs.) 0 0 0 0 0 0Outstanding as % of Borrowed 40 37 22 33 0 30Overdue as % of Borrowed 18 0 0 0 0 5Diversion as % of Borrowed 0 0 0 0 0 0Borrowed as % of Invested 100.00 44.85 88.68 80.99 0 77.79Utilized as % of Invested 100.00 44.85 88.68 80.99 0 77.79StateAmount Invested (Rs.) 10394 14305 9005 5767 7717 9175Amount Borrowed (Rs.) 7789 10250 5778 3337 1302 5612Amount Repaid (Rs.) 5553 6688 4826 3104 1302 4315Amount Outstanding (Rs.) 2236 3469 953 232 0 1278Amount Overdue (Rs.) 658 0 0 0 0 78Amount Diverted (Rs.) 0 164 232 291 0 173Outstanding as % of Borrowed 29 34 16 7 0 23Overdue as % of Borrowed 8 0 0 0 0 1Diversion as % of Borrowed 0 2 4 9 0 3Borrowed as % of Invested 74.94 71.65 64.17 57.85 16.88 61.17Utilized as % of Invested 74.94 70.51 61.58 52.82 16.88 59.28
214

Table 5.10b Investment, borrowing and utilization of credit by sampled farmers on cattle by farmers during the last 5 years
(Per hectare)Investment on Cattle Marginal Small Semi-
Medium Medium Large Average
Zone-I
Amount Invested (Rs.) 2226 1629 994 0 172 354
Amount Borrowed (Rs.) 0 698 0 0 0 32
Amount Repaid (Rs.) 0 419 0 0 0 19
Amount Outstanding (Rs.) 0 279 0 0 0 13
Amount Overdue (Rs.) 0 0 0 0 0 0
Amount Diverted (Rs.) 0 0 0 0 0 0
Zone-II
Amount Invested (Rs.) 13692 11974 2752 1805 902 2747
Amount Borrowed (Rs.) 8866 9180 1614 971 193 1650
Amount Repaid (Rs.) 7183 6022 1458 971 193 1316
Amount Outstanding (Rs.) 1683 3158 156 0 0 334
Amount Overdue (Rs.) 0 0 0 0 0 0
Amount Diverted (Rs.) 0 155 142 107 0 72
Zone-III
Amount Invested (Rs.) 21296 4718 5370 363 194 1340
Amount Borrowed (Rs.) 21296 2116 4762 294 0 1042
Amount Repaid (Rs.) 12809 1323 3704 196 0 733
Amount Outstanding (Rs.) 8487 793 1058 98 0 309
Amount Overdue (Rs.) 3858 0 0 0 0 51
Amount Diverted (Rs.) 0 0 0 0 0 0
State
Amount Invested (Rs.) 13103 8419 2759 837 493 1696
Amount Borrowed (Rs.) 9820 6033 1771 484 83 1037
Amount Repaid (Rs.) 7000 3936 1479 450 83 798
Amount Outstanding (Rs.) 2820 2097 292 34 0 240
Amount Overdue (Rs.) 829 0 0 0 0 14
Amount Diverted (Rs.) 0 92 71 42 0 32
215

Table 5.11a Investment, borrowing and utilization of credit by sampled farmers on deepening of well by farmers during the last 5 years
(Per farm)Investment on Deepening of Well Marginal Small Semi-
Medium Medium Large Average
Zone-IAmount Invested (Rs.) 3500 4208 1900 1523 0 2013Amount Borrowed (Rs.) 0 4042 1500 1085 0 1387Amount Repaid (Rs.) 0 4042 200 654 0 857Amount Outstanding (Rs.) 0 0 1299 431 0 530Amount Overdue (Rs.) 0 0 0 0 0 0Amount Diverted (Rs.) 0 0 0 0 0 0Outstanding as % of Borrowed 0 0 87 40 0 38Overdue as % of Borrowed 0 0 0 0 0 0Diversion as % of Borrowed 0 0 0 0 0 0Borrowed as % of Invested 0 96.04 78.91 71.24 0 68.89Utilized as % of Invested 0 96.04 78.91 71.24 0 68.89Zone-IIAmount Invested (Rs.) 5418 7132 5157 10427 13997 8041Amount Borrowed (Rs.) 0 2368 1815 8457 1143 3059Amount Repaid (Rs.) 0 1579 1488 2231 1143 1421Amount Outstanding (Rs.) 0 789 327 6226 0 1638Amount Overdue (Rs.) 0 0 0 0 0 0Amount Diverted (Rs.) 0 0 464 0 0 125Outstanding as % of Borrowed 0 33 18 74 0 54Overdue as % of Borrowed 0 0 0 0 0 0Diversion as % of Borrowed 0 0 26 0 0 4Borrowed as % of Invested 0 33.21 35.19 81.10 8.17 38.05Utilized as % of Invested 0 33.21 26.19 81.10 8.17 36.49Zone-IIIAmount Invested (Rs.) 1250 3428 5777 9318 16415 7753Amount Borrowed (Rs.) 0 3428 5276 7105 7744 5438Amount Repaid (Rs.) 0 3428 4889 2999 6078 3664Amount Outstanding (Rs.) 0 0 387 4106 1665 1775Amount Overdue (Rs.) 0 0 0 0 0 0Amount Diverted (Rs.) 0 0 999 0 0 225Outstanding as % of Borrowed 0 0 7 58 22 33Overdue as % of Borrowed 0 0 0 0 0 0Diversion as % of Borrowed 0 0 19 0 0 4Borrowed as % of Invested 0 100.00 91.33 76.25 47.18 70.15Utilized as % of Invested 0 100.00 74.03 76.25 47.18 67.24StateAmount Invested (Rs.) 4137 5773 4340 7685 10976 6455Amount Borrowed (Rs.) 0 2914 2448 6045 2567 3234Amount Repaid (Rs.) 0 2445 1825 2059 2132 1840Amount Outstanding (Rs.) 0 468 245 3871 434 1262Amount Overdue (Rs.) 0 0 0 0 0 0Amount Diverted (Rs.) 0 0 466 11 0 128Outstanding as % of Borrowed 0 16 10 64 17 39Overdue as % of Borrowed 0 0 0 0 0 0Diversion as % of Borrowed 0 0 19 0 0.18 4Borrowed as % of Invested 0 50.47 56.40 78.66 23.38 50.10Utilized as % of Invested 0 50.47 45.67 78.51 23.38 48.12
216

Table 5.11b Investment, borrowing and utilization of credit by sampled farmers on deepening of well by farmers during the last 5 years
(Per hectare)Investment on Deepening of Well Marginal Small Semi-
Medium Medium Large Average
Zone-I
Amount Invested (Rs.) 4795 2351 569 226 0 343
Amount Borrowed (Rs.) 0 2258 449 161 0 236
Amount Repaid (Rs.) 0 2258 60 97 0 146
Amount Outstanding (Rs.) 0 0 389 64 0 90
Amount Overdue (Rs.) 0 0 0 0 0 0
Amount Diverted (Rs.) 0 0 0 0 0 0
Zone-II
Amount Invested (Rs.) 6689 4195 1577 1561 992 1675
Amount Borrowed (Rs.) 0 1393 555 1266 81 637
Amount Repaid (Rs.) 0 929 455 334 81 296
Amount Outstanding (Rs.) 0 464 100 932 0 341
Amount Overdue (Rs.) 0 0 0 0 0 0
Amount Diverted (Rs.) 0 0 142 0 0 26
Zone-III
Amount Invested (Rs.) 1543 2116 1834 1280 956 1250
Amount Borrowed (Rs.) 0 2116 1675 976 451 877
Amount Repaid (Rs.) 0 2116 1552 412 354 591
Amount Outstanding (Rs.) 0 0 123 564 97 286
Amount Overdue (Rs.) 0 0 0 0 0 0
Amount Diverted (Rs.) 0 0 317 0 0 36
State
Amount Invested (Rs.) 5214 3398 1330 1115 701 1193
Amount Borrowed (Rs.) 0 1714 750 877 164 597
Amount Repaid (Rs.) 0 1439 559 299 136 340
Amount Outstanding (Rs.) 0 276 190 578 28 257
Amount Overdue (Rs.) 0 0 0 0 0 0
Amount Diverted (Rs.) 0 0 135 0 0 22
217

Table 5.12a Investment, borrowing and utilization of credit by sampled farmerson submersible pump by farmers during the last 5 years
(Per farm)Investment on Submersible Pump Marginal Small Semi-
Medium Medium Large Average
Zone-IAmount Invested (Rs.) 0 30833 73640 128869 54168 72813Amount Borrowed (Rs.) 0 8332 26800 66261 37495 28675Amount Repaid (Rs.) 0 7083 12999 34778 21248 16060Amount Outstanding (Rs.) 0 1249 13801 31483 16247 13551Amount Overdue (Rs.) 0 0 0 0 0 0Amount Diverted (Rs.) 0 0 2201 0 1500 688Outstanding as % of Borrowed 0 15 51 48 43.33 47Overdue as % of Borrowed 0 0 0 0 0 0Diversion as % of Borrowed 0 0 8 0 5 2Borrowed as % of Invested 0 27.02 36.39 51.42 69.22 39.38Utilized as % of Invested 0 27.02 33.40 51.42 66.45 38.43Zone-IIAmount Invested (Rs.) 10272 25395 15281 45457 32905 26046Amount Borrowed (Rs.) 9059 15052 5791 34342 23408 17126Amount Repaid (Rs.) 4500 9132 1861 22912 15916 10498Amount Outstanding (Rs.) 4559 5919 3931 11429 7492 6627Amount Overdue (Rs.) 0 0 0 0 0 0Amount Diverted (Rs.) 1136 0 0 0 0 157Outstanding as % of Borrowed 50 39 68 33 32 39Overdue as % of Borrowed 0 0 0 0 0 0Diversion as % of Borrowed 13 0 0 0 0 1Borrowed as % of Invested 88.19 59.27 37.90 75.55 71.14 65.75Utilized as % of Invested 77.13 59.27 37.90 75.55 71.14 65.15Zone-IIIAmount Invested (Rs.) 0 0 0 0 32245 4839Amount Borrowed (Rs.) 0 0 0 0 29584 4440Amount Repaid (Rs.) 0 0 0 0 29584 4440Amount Outstanding (Rs.) 0 0 0 0 0 0Amount Overdue (Rs.) 0 0 0 0 0 0Amount Diverted (Rs.) 0 0 0 0 0 0Outstanding as % of Borrowed 0 0 0 0 0 0Overdue as % of Borrowed 0 0 0 0 0 0Diversion as % of Borrowed 0 0 0 0 0 0Borrowed as % of Invested 0 0 0 0 91.75 91.75Utilized as % of Invested 0 0 0 0 91.75 91.75StateAmount Invested (Rs.) 5947 20859 29047 52965 38280 32422Amount Borrowed (Rs.) 5245 10499 10686 31697 18913 16832Amount Repaid (Rs.) 2605 6750 4709 18626 16959 10369Amount Outstanding (Rs.) 2639 3515 1965 4652 3583 3310Amount Overdue (Rs.) 0 0 640 0 0 172Amount Diverted (Rs.) 658 3 15 13 0 86Outstanding as % of Borrowed 50 33 18 15 19 20Overdue as % of Borrowed 0 0 6 0 0 1Diversion as % of Borrowed 13 0 0 0 0 1Borrowed as % of Invested 88.19 50.33 36.79 59.85 49.41 51.92Utilized as % of Invested 77.13 50.33 36.79 59.85 49.41 51.92
218
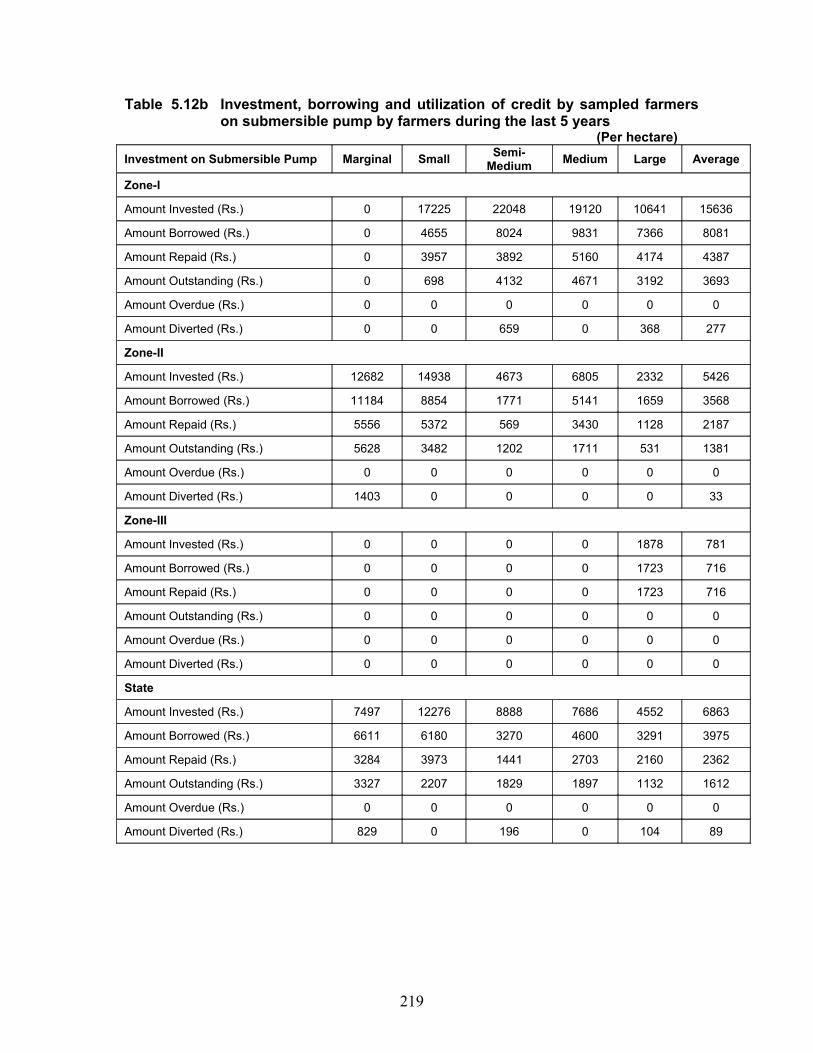
Table 5.12b Investment, borrowing and utilization of credit by sampled farmers on submersible pump by farmers during the last 5 years
(Per hectare)Investment on Submersible Pump Marginal Small Semi-
Medium Medium Large Average
Zone-I
Amount Invested (Rs.) 0 17225 22048 19120 10641 15636
Amount Borrowed (Rs.) 0 4655 8024 9831 7366 8081
Amount Repaid (Rs.) 0 3957 3892 5160 4174 4387
Amount Outstanding (Rs.) 0 698 4132 4671 3192 3693
Amount Overdue (Rs.) 0 0 0 0 0 0
Amount Diverted (Rs.) 0 0 659 0 368 277
Zone-II
Amount Invested (Rs.) 12682 14938 4673 6805 2332 5426
Amount Borrowed (Rs.) 11184 8854 1771 5141 1659 3568
Amount Repaid (Rs.) 5556 5372 569 3430 1128 2187
Amount Outstanding (Rs.) 5628 3482 1202 1711 531 1381
Amount Overdue (Rs.) 0 0 0 0 0 0
Amount Diverted (Rs.) 1403 0 0 0 0 33
Zone-III
Amount Invested (Rs.) 0 0 0 0 1878 781
Amount Borrowed (Rs.) 0 0 0 0 1723 716
Amount Repaid (Rs.) 0 0 0 0 1723 716
Amount Outstanding (Rs.) 0 0 0 0 0 0
Amount Overdue (Rs.) 0 0 0 0 0 0
Amount Diverted (Rs.) 0 0 0 0 0 0
State
Amount Invested (Rs.) 7497 12276 8888 7686 4552 6863
Amount Borrowed (Rs.) 6611 6180 3270 4600 3291 3975
Amount Repaid (Rs.) 3284 3973 1441 2703 2160 2362
Amount Outstanding (Rs.) 3327 2207 1829 1897 1132 1612
Amount Overdue (Rs.) 0 0 0 0 0 0
Amount Diverted (Rs.) 829 0 196 0 104 89
219

Table 5.13 Investment, borrowing and utilization of credit by sampled farmers on house construction during the last 5 years
(Per farm)Loan for Construction Marginal Small Semi-
Medium Medium Large Average
Zone-IAmount Invested (Rs.) 79000 142833 74399 112174 216673 117325Amount Borrowed (Rs.) 14375 7833 27201 33046 162505 44989Amount Repaid (Rs.) 10000 6251 19599 8695 87497 23687Amount Outstanding (Rs.) 4375 1582 7602 24352 75007 21303Amount Overdue (Rs.) 0 0 0 0 0 0Amount Diverted (Rs.) 0 834 0 0 0 125Outstanding as % of Borrowed 30.43 20.20 27.95 73.69 46.16 47.35Overdue as % of Borrowed 0.00 0.00 0.00 0.00 0.00 0.00Diversion as % of Borrowed 0.00 10.65 0.00 0.00 0.00 0.28Borrowed as % of Invested 18.20 5.48 36.56 29.46 75.00 38.35Utilized as % of Invested 18.20 4.90 36.56 29.46 75.00 38.24Zone-IIAmount Invested (Rs.) 93682 45895 98443 135430 445453 141301Amount Borrowed (Rs.) 63409 18948 33792 42572 61590 40156Amount Repaid (Rs.) 8864 8500 19071 38003 52503 23920Amount Outstanding (Rs.) 54545 10448 14722 4569 9087 16236Amount Overdue (Rs.) 0 0 0 0 0 0Amount Diverted (Rs.) 13409 1710 1164 2999 2723 3605Outstanding as % of Borrowed 86.02 55.14 43.56 10.73 14.75 40.43Overdue as % of Borrowed 0.00 0.00 0.00 0.00 0.00 0.00Diversion as % of Borrowed 21.15 9.03 3.44 7.05 4.42 8.98Borrowed as % of Invested 67.69 41.29 34.33 31.43 13.83 28.42Utilized as % of Invested 53.37 37.56 33.14 29.22 13.22 25.87Zone-IIIAmount Invested (Rs.) 6063 25500 73723 96074 137497 75951Amount Borrowed (Rs.) 1687 17643 51222 55000 104170 49687Amount Repaid (Rs.) 1687 4999 19445 24395 95826 28347Amount Outstanding (Rs.) 0 12644 31777 30605 8345 21339Amount Overdue (Rs.) 0 0 0 0 0 0Amount Diverted (Rs.) 0 3572 9167 1427 0 3190Outstanding as % of Borrowed 0.00 71.66 62.04 55.65 8.01 42.95Overdue as % of Borrowed 0.00 0.00 0.00 0.00 0.00 0.00Diversion as % of Borrowed 0.00 20.25 17.90 2.59 0.00 6.42Borrowed as % of Invested 27.83 69.19 69.48 57.25 75.76 65.42Utilized as % of Invested 27.83 55.18 57.04 55.76 75.76 61.22StateAmount Invested (Rs.) 72145 59610 86279 116397 305435 118865Amount Borrowed (Rs.) 40092 16579 35524 44071 99024 43702Amount Repaid (Rs.) 7592 7312 19303 25734 72934 24952Amount Outstanding (Rs.) 31579 8970 14012 11824 6523 13425Amount Overdue (Rs.) 0 156 0 0 0 31Amount Diverted (Rs.) 7769 1801 2509 1705 1314 2604Outstanding as % of Borrowed 78.77 54.10 39.44 26.83 6.59 30.72Overdue as % of Borrowed 0.00 0.94 0.00 0.00 0.00 0.07Diversion as % of Borrowed 19.38 10.86 7.06 3.87 1.33 5.96Borrowed as % of Invested 55.57 27.81 41.17 37.86 32.42 36.77Utilized as % of Invested 44.80 24.79 38.26 36.40 31.99 34.57
220

Table 5.14 Investment, borrowing and utilization of credit by sampled farmers on education during the last 5 years
(Per farm)Loan for Education Marginal Small Semi-
Medium Medium Large Average
Zone-IAmount Invested (Rs.) 7500 0 4800 1085 64164 12186Amount Borrowed (Rs.) 0 0 4001 1085 0 1562Amount Repaid (Rs.) 0 0 2999 1085 0 1249Amount Outstanding (Rs.) 0 0 1002 0 0 313Amount Overdue (Rs.) 0 0 0 0 0 0Amount Diverted (Rs.) 0 0 0 0 0 0Outstanding as % of Borrowed 0 0 25.04 0 0 20.04Overdue as % of Borrowed 0 0 0 0 0 0Diversion as % of Borrowed 0 0 0 0 0 0Borrowed as % of Invested 0 0 83.37 100.00 0 12.82Utilized as % of Invested 0 0 83.37 100.00 0 12.82Zone-IIAmount Invested (Rs.) 2727 0 3025 0 2949 1597Amount Borrowed (Rs.) 2727 0 697 0 0 564Amount Repaid (Rs.) 2727 0 697 0 0 564Amount Outstanding (Rs.) 0 0 0 0 0 0Amount Overdue (Rs.) 0 0 0 0 0 0Amount Diverted (Rs.) 1591 0 0 0 0 220Outstanding as % of Borrowed 0 0 0 0 0 0Overdue as % of Borrowed 0 0 0 0 0 0Diversion as % of Borrowed 58.33 0 0 0 0 38.96Borrowed as % of Invested 100.00 0 23.03 0 0 35.35Utilized as % of Invested 41.66 0 23.03 0 0 21.54Zone-IIIAmount Invested (Rs.) 0 0 0 0 9993 1500Amount Borrowed (Rs.) 0 0 0 0 5838 876Amount Repaid (Rs.) 0 0 0 0 5838 876Amount Outstanding (Rs.) 0 0 0 0 0 0Amount Overdue (Rs.) 0 0 0 0 0 0Amount Diverted (Rs.) 0 0 0 0 0 0Outstanding as % of Borrowed 0 0 0 0 0 0Overdue as % of Borrowed 0 0 0 0 0 0Diversion as % of Borrowed 0 0 0 0 0 0Borrowed as % of Invested 0 0 0 0 58.42 58.42Utilized as % of Invested 0 0 0 0 58.42 58.42StateAmount Invested (Rs.) 3158 0 2908 290 20756 4218Amount Borrowed (Rs.) 1579 0 1511 290 1523 891Amount Repaid (Rs.) 1579 0 1220 290 1523 812Amount Outstanding (Rs.) 0 0 0 0 0 0Amount Overdue (Rs.) 0 0 0 0 0 0Amount Diverted (Rs.) 921 0 7 0 0 111Outstanding as % of Borrowed 0 0 0 0 0 0Overdue as % of Borrowed 0 0 0 0 0 0Diversion as % of Borrowed 58.33 0 0.48 0 0 12.50Borrowed as % of Invested 50.00 0 51.98 100.00 7.34 21.11Utilized as % of Invested 20.84 0 51.72 100.00 7.34 18.49
221

Table 5.15 Investment, borrowing and utilization of credit by sampled farmers for medical treatment during the last 5 years
(Per farm)
Loan for Medical Treatment Marginal Small Semi-Medium Medium Large Average
Zone-IAmount Invested (Rs.) 5125 19584 16880 6956 18752 13538Amount Borrowed (Rs.) 3375 12500 16800 3916 8332 9838Amount Repaid (Rs.) 3375 8334 13600 438 8332 7214Amount Outstanding (Rs.) 0 4165 3200 3478 0 2625Amount Overdue (Rs.) 0 0 0 0 0 0Amount Diverted (Rs.) 0 0 0 0 0 0Outstanding as % of Borrowed 0 33.32 19.05 88.81 0 26.68Overdue as % of Borrowed 0 0 0 0 0 0Diversion as % of Borrowed 0 0 0 0 0 0Borrowed as % of Invested 65.85 63.82 99.53 56.30 44.43 72.67Utilized as % of Invested 65.85 63.82 99.53 56.30 44.43 72.67Zone-IIAmount Invested (Rs.) 5000 37368 11046 21717 130461 35258Amount Borrowed (Rs.) 1364 11711 5814 15711 83178 19425Amount Repaid (Rs.) 1136 4211 2093 9860 50232 10793Amount Outstanding (Rs.) 228 7500 3721 5852 32947 8632Amount Overdue (Rs.) 0 0 0 0 0 0Amount Diverted (Rs.) 0 658 232 0 0 219Outstanding as % of Borrowed 16.69 64.04 64.00 37.24 39.61 44.44Overdue as % of Borrowed 0 0 0 0 0 0Diversion as % of Borrowed 0 5.62 3.99 0 0 1.13Borrowed as % of Invested 27.28 31.34 52.63 72.35 63.76 55.09Utilized as % of Invested 27.28 29.58 50.53 72.35 63.76 54.47Zone-IIIAmount Invested (Rs.) 32750 23428 11277 14640 11246 16744Amount Borrowed (Rs.) 14000 9858 444 11248 9169 8545Amount Repaid (Rs.) 5000 2929 167 2322 3331 2365Amount Outstanding (Rs.) 9000 6929 277 8925 5838 6180Amount Overdue (Rs.) 0 0 0 0 0 0Amount Diverted (Rs.) 0 0 0 0 0 0Outstanding as % of Borrowed 64.28 70.29 62.41 79.35 63.67 72.32Overdue as % of Borrowed 0 0 0 0 0 0Diversion as % of Borrowed 0 0 0 0 0 0Borrowed as % of Invested 42.75 42.08 3.94 76.83 81.53 51.03Utilized as % of Invested 42.75 42.08 3.94 76.83 81.53 51.03StateAmount Invested (Rs.) 10869 30984 12790 15465 70220 25175Amount Borrowed (Rs.) 4448 11454 7884 11103 44346 14296Amount Repaid (Rs.) 2421 4704 5035 4886 27066 7785Amount Outstanding (Rs.) 2026 5969 1919 5287 17280 5855Amount Overdue (Rs.) 0 0 0 0 0 0Amount Diverted (Rs.) 0 397 122 24 0 118Outstanding as % of Borrowed 45.56 52.11 24.34 47.62 38.97 40.95Overdue as % of Borrowed 0 0 0 0 0 0Diversion as % of Borrowed 0 3.47 1.54 0.21 0 0.83Borrowed as % of Invested 40.92 36.97 61.64 71.80 63.15 56.79Utilized as % of Invested 40.92 35.68 60.69 71.80 63.15 56.32
222

Table 5.16 Amount spent, borrowing and utilization of credit by sampled farmers on marriage ceremonies during the last 5 years
(Per farm)Loan for Marriage Ceremonies Marginal Small Semi-
Medium Medium Large Average
Zone-IAmount spent (Rs.) 18750 91666 75801 93477 149998 88687Amount Borrowed (Rs.) 16875 12500 7999 30438 95830 29188Amount Repaid (Rs.) 10625 8332 7999 19566 41661 16687Amount Outstanding (Rs.) 6250 4167 0 10872 54168 12501Amount Overdue (Rs.) 0 0 0 0 0 0Amount Diverted (Rs.) 0 0 0 2184 4175 1254Outstanding as % of Borrowed 37.03 33.34 0.00 35.72 56.53 42.83Overdue as % of Borrowed 0.00 0.00 0.00 0.00 0.00 0.00Diversion as % of Borrowed 0.00 0.00 0.00 7.17 4.36 4.30Borrowed as % of Invested 90.00 13.64 10.55 32.56 63.89 32.91Utilized as % of Invested 90.00 13.64 10.55 30.23 61.10 31.49Zone-IIAmount spent (Rs.) 104546 68422 116510 139144 172735 116294Amount Borrowed (Rs.) 63409 32368 59069 40000 80681 52214Amount Repaid (Rs.) 40000 21184 35918 24288 60221 33835Amount Outstanding (Rs.) 23409 11184 23152 15711 20460 18379Amount Overdue (Rs.) 0 0 0 0 0 0Amount Diverted (Rs.) 1818 0 2211 1717 2272 1535Outstanding as % of Borrowed 36.92 34.55 39.19 39.28 25.36 35.20Overdue as % of Borrowed 0.00 0.00 0.00 0.00 0.00 0.00Diversion as % of Borrowed 2.87 0.00 3.74 4.29 2.82 2.94Borrowed as % of Invested 60.65 47.31 50.70 28.75 46.71 44.90Utilized as % of Invested 58.91 47.31 48.80 27.51 45.39 43.58Zone-IIIAmount spent (Rs.) 3125 16786 35000 174997 59992 81402Amount Borrowed (Rs.) 3125 15000 30832 46432 54583 34332Amount Repaid (Rs.) 625 3572 30832 21425 12912 17074Amount Outstanding (Rs.) 2500 11427 0 25007 41672 17259Amount Overdue (Rs.) 0 0 0 0 0 0Amount Diverted (Rs.) 0 0 1112 0 0 251Outstanding as % of Borrowed 79.99 76.19 0.00 53.86 76.34 50.27Overdue as % of Borrowed 0.00 0.00 0.00 0.00 0.00 0.00Diversion as % of Borrowed 0.00 0.00 3.61 0.00 0.00 0.73Borrowed as % of Invested 100.00 89.36 88.09 26.53 90.98 42.18Utilized as % of Invested 100.00 89.36 84.91 26.53 90.98 41.87StateAmount spent (Rs.) 65132 61485 87616 138604 137392 100578Amount Borrowed (Rs.) 40921 24843 38313 39537 77825 41938Amount Repaid (Rs.) 25527 14922 26737 22093 43038 25326Amount Outstanding (Rs.) 14079 9140 11576 14536 20656 13487Amount Overdue (Rs.) 0 0 0 584 1089 314Amount Diverted (Rs.) 1061 6 1338 708 1101 835Outstanding as % of Borrowed 34.40 36.79 30.21 36.77 26.54 32.16Overdue as % of Borrowed 0.00 0.00 0.00 1.48 1.40 0.75Diversion as % of Borrowed 2.59 0.03 3.49 1.79 1.41 1.99Borrowed as % of Invested 62.83 40.41 43.73 28.52 56.64 41.70Utilized as % of Invested 61.19 40.41 42.40 28.01 55.84 40.87
223

Table 5.17 Amount spent, borrowing and utilization of credit by sampled farmers for other ad hoc expenditure during the last 5 years
Loan for Other Adhoc Expenditure Marginal Small Semi-Medium Medium Large Average
Zone-IAmount spent (Rs.) 2875 1500 28600 19998 46006 22100Amount Borrowed (Rs.) 0 1500 22999 10979 14170 12694Amount Repaid (Rs.) 0 1500 21600 10434 14170 12100Amount Outstanding (Rs.) 0 0 1399 546 0 594Amount Overdue (Rs.) 0 0 0 0 0 0Amount Diverted (Rs.) 0 0 0 0 0 0Outstanding as % of Borrowed 0 0 6.08 4.97 0 4.68Overdue as % of Borrowed 0 0 0 0 0 0Diversion as % of Borrowed 0 0 0 0 0 0Borrowed as % of Invested 0 100.00 80.42 54.90 30.80 57.44Utilized as % of Invested 0 100.00 80.42 54.90 30.80 57.44Zone-IIAmount spent (Rs.) 1682 90790 21278 29713 78635 44871Amount Borrowed (Rs.) 0 61579 12907 27715 37730 29373Amount Repaid (Rs.) 0 28948 10932 24856 19542 17953Amount Outstanding (Rs.) 0 32632 1975 2859 18188 11420Amount Overdue (Rs.) 0 0 0 0 0 0Amount Diverted (Rs.) 0 7895 1628 287 4543 3004Outstanding as % of Borrowed 0 52.99 15.30 10.32 48.20 38.88Overdue as % of Borrowed 0 0 0 0 0 0Diversion as % of Borrowed 0 12.82 12.62 1.04 12.04 10.23Borrowed as % of Invested 0 67.83 60.66 93.28 47.98 65.46Utilized as % of Invested 0 59.13 53.00 92.31 42.20 58.77Zone-IIIAmount spent (Rs.) 8000 30357 11277 21825 41277 22492Amount Borrowed (Rs.) 6750 30357 444 7957 28640 13174Amount Repaid (Rs.) 4250 28572 167 0 22321 8814Amount Outstanding (Rs.) 2500 1785 277 7957 6319 4360Amount Overdue (Rs.) 0 0 0 0 0 0Amount Diverted (Rs.) 0 0 0 3210 3365 1629Outstanding as % of Borrowed 37.03 5.88 62.41 100.00 22.06 33.09Overdue as % of Borrowed 0 0 0 0 0 0Diversion as % of Borrowed 0 0 0 40.35 11.75 12.37Borrowed as % of Invested 84.37 100.00 3.94 36.46 69.38 58.57Utilized as % of Invested 84.37 100.00 3.94 21.75 61.23 51.33StateAmount spent (Rs.) 3263 60829 21313 24547 60377 33557Amount Borrowed (Rs.) 1421 43484 13232 16807 29213 21138Amount Repaid (Rs.) 895 23719 11780 12906 18866 14196Amount Outstanding (Rs.) 526 19765 1046 3754 10347 6793Amount Overdue (Rs.) 0 0 0 0 0 0Amount Diverted (Rs.) 0 4688 816 1164 3051 1908Outstanding as % of Borrowed 37.03 45.45 7.90 22.34 35.42 32.14Overdue as % of Borrowed 0 0 0 0 0 0Diversion as % of Borrowed 0 10.78 6.17 6.92 10.44 9.03Borrowed as % of Invested 43.55 71.49 62.08 68.47 48.38 62.99Utilized as % of Invested 43.55 63.78 58.26 63.73 43.33 57.31
224

Table 5.18 Reasons for diversion of loan as mentioned by the sampled farmers
(Multiple responses)
Reasons for diversionMarginal Small Semi-
medium Medium Large Overall
No. %age No. %age No. %age No. %age No. %age No. %age
Zone-I 0 3 4 9 5 21
Lack of consumption credit 0 0.00 0 0.00 0 0.00 1 11.11 0 0.00 1 4.76Repayment of old debt 0 0.00 0 0.00 0 0.00 0 0.00 0 0.00 0 0.00Construction of dwelling house 0 0.00 2 66.67 1 25.00 3 33.33 3 60.00 9 42.86
Family maintenance expenditure 0 0.00 0 0.00 0 0.00 0 0.00 0 0.00 0 0.00
Social/religious ceremonies 0 0.00 1 33.33 1 25.00 1 11.11 2 40.00 5 23.81Medical treatment expenditure 0 0.00 1 33.33 1 25.00 2 22.22 1 20.00 5 32.81Other reasons: Submersible pumps 0 0.00 1 33.33 2 50.00 6 66.67 3 60.00 12 57.14 Education 0 0.00 0 0.00 1 25.00 0 0.00 0 0.00 1 4.76 Immigration 0 0.00 0 0.00 1 25.00 1 11.11 0 0.00 2 9.52 Purchase of land 0 0.00 0 0.00 0 0.00 1 11.11 0 0.00 1 4.76 Purchase of car 0 0.00 0 0.00 0 0.00 0 0.00 1 20.00 1 4.76 Purchase of tractor 0 0.00 0 0.00 0 0.00 0 0.00 1 20.00 1 4.76 Purchase of plot 0 0.00 0 0.00 0 0.00 0 0.00 1 20.00 1 4.76 Purchase of animals 0 0.00 0 0.00 0 0.00 0 0.00 1 20.00 1 4.76 Commission for loan 0 0.00 0 0.00 0 0.00 0 0.00 0 0.00 0 0.00
Zone-II 9 17 16 10 4 56
Lack of consumption credit 5 55.56 8 47.06 6 37.50 5 50.00 0 0.00 24 42.86Repayment of old debt 1 11.11 2 11.76 2 12.50 1 10.00 0 0.00 6 10.71Construction of dwelling house 5 55.56 5 29.41 6 37.50 6 60.00 1 25.00 23 41.07
Family maintenance expenditure 4 44.44 6 35.29 7 43.75 5 50.00 1 25.00 23 41.07
Social/religious ceremonies 3 33.33 1 5.88 6 37.50 4 40.00 1 25.00 15 26.79Medical treatment expenditure 0 0.00 3 17.65 1 6.25 1 10.00 0 0.00 5 8.93Other reasons: Submersible pumps 1 11.11 1 5.88 0 0.00 0 0.00 0 0.00 2 3.57 Education 0 0.00 0 0.00 0 0.00 0 0.00 0 0.00 0 0.00 Immigration 0 0.00 2 11.76 0 0.00 0 0.00 0 0.00 2 3.57 Purchase of land 1 11.11 0 0.00 2 12.50 1 10.00 2 50.00 6 10.71 Purchase of car 0 0.00 0 0.00 0 0.00 0 0.00 0 0.00 0 0.00 Purchase of tractor 0 0.00 0 0.00 1 6.25 0 0.00 0 0.00 1 1.79 Purchase of plot 0 0.00 0 0.00 1 6.25 0 0.00 0 0.00 1 1.79 Purchase of animals 0 0.00 0 0.00 1 6.25 0 0.00 0 0.00 1 1.79 Commission for loan 0 0.00 0 0.00 0 0.00 0 0.00 0 0.00 0 0.00
225

Reasons for diversion Marginal Small Semi-medium Medium Large Overall
No. %age No. %age No. %age No. %age No. %age No. %age
Zone-III 1 2 6 4 1 14
Lack of consumption credit 1 100.0 0 0.00 1 16.67 0 0.00 0 0.00 2 14.29Repayment of old debt 0 0.00 0 0.00 1 16.67 0 0.00 0 0.00 1 7.14Construction of dwelling house 1 100.00 1 50.00 2 33.33 4 100.00 0 0.00 8 57.14
Family maintenance expenditure 1 100.00 0 0.00 0 0.00 0 0.00 0 0.00 1 7.14
Social/religious ceremonies 0 0.00 0 0.00 3 50.00 1 25.00 1 100.00 5 35.71Medical treatment expenditure 1 100.00 1 50.00 2 33.33 1 25.00 1 100.00 6 42.86Other reasons: Submersible pumps 0 0.00 1 50.00 0 0.00 1 25.00 0 0.00 2 14.29 Education 0 0.00 0 0.00 0 0.00 0 0.00 0 0.00 0 0.00 Immigration 0 0.00 0 0.00 0 0.00 0 0.00 0 0.00 0 0.00 Purchase of land 0 0.00 0 0.00 0 0.00 0 0.00 0 0.00 0 0.00 Purchase of car 0 0.00 0 0.00 0 0.00 0 0.00 0 0.00 0 0.00 Purchase of tractor 0 0.00 1 50.00 0 0.00 0 0.00 0 0.00 1 7.14 Purchase of plot 0 0.00 0 0.00 0 0.00 0 0.00 0 0.00 0 0.00 Purchase of animals 0 0.00 0 0.00 2 33.33 1 25.00 0 0.00 3 21.43 Purchase of fertilizer 0 0.00 0 0.00 0 0.00 0 0.00 0 0.00 0 0.00 Commission for loan 0 0.00 0 0.00 2 33.33 0 0.00 0 0.00 2 14.29
State 10 22 26 23 10 91
Lack of consumption credit 6 26.09 8 15.09 7 8.97 6 7.41 0 0.00 27 9.71Repayment of old debt 1 4.35 2 3.77 3 3.85 1 1.23 0 0.00 7 2.52Construction of dwelling house 6 26.09 8 15.09 9 11.54 13 16.05 4 9.30 40 14.39
Family maintenance expenditure 5 21.74 6 11.32 7 8.97 5 6.17 1 2.33 24 8.63
Social/religious ceremonies 3 13.04 2 3.77 10 12.82 6 7.41 4 9.30 25 8.99Medical treatment expenditure 1 4.35 5 9.43 4 5.13 4 4.94 2 4.65 16 5.76Other reasons: Submersible pumps 1 4.35 3 5.66 2 2.56 7 8.64 3 6.98 16 5.76 Education 0 0.00 0 0.00 1 1.28 0 0.00 0 0.00 1 0.36 Immigration 0 0.00 2 3.77 1 1.28 1 1.23 0 0.00 4 1.44 Purchase of land 1 4.35 0 0.00 2 2.56 2 2.47 2 4.65 7 2.52 Purchase of car 0 0.00 0 0.00 0 0.00 1 0.00 1 2.33 1 0.36 Purchase of tractor 0 0 1 1.89 1 1.28 0 0 1 2.33 3 1.08 Purchase of plot 0 0 0 0 1 1.28 0 0 1 2.33 2 0.72 Purchase of animals 0 0 0 0 3 3.85 1 1.23 1 2.33 5 1.80 Purchase of fertilizer 0 0 0 0 0 0.00 0 0.00 0 0.00 0 0.00 Commission for loan 0 0 2 3.77 0 0.00 0 0.00 0 0.00 2 0.72
226

Table 5.19 Factors affecting diversion of loan across various zones as well as state
Factors Zone-I Zone-II Zone-III State
Constant 0.1349 0.1894 0.1248 0.1621
Farm size (ha) -0.3392** -0.1937** -0.4462*** -0.3162**
Non-institutional share (%) 0.1242 0.1055 0.1931 0.1357
Cost of debt (per 100 Rs.) 0.0902 0.1239 0.0987 0.1022
Non-farm income -0.2097** -0.2987** -0.2945** -0.2763**Household expenditure per capita 0.1219 0.1641 0.2068 0.1734
Type of loan (short / term) 0.1702 0.1409 0.2175** 0.1668
Education status -0.1804 -0.1395** -0.0857 -0.1276Social ceremonies expenditure (Rs. / farm) 0.1944** 0.1167 0.2155** 0.1823**
R2 0.5782 0.6058 0.7854 0.6248
*** indicates significance at 1% level ** indicates significance at 5% level
227