utility customer-funded energy efficiency presentation to ohio legislative study committee may 7...
TRANSCRIPT

Utility Customer-Funded Energy EfficiencyPresentation to Ohio Legislative Study Committee
May 7 2015
Charles GoldmanDivision Director and Staff ScientistElectricity Markets and Policy Group
Lawrence Berkeley National Laboratory
This work was supported by the National Electricity Delivery Division of the U.S. Department of Energy’s Office of Electricity Delivery and Energy Reliability under Lawrence Berkeley National Laboratory Contract No. DE-AC02-05CH11231.

Presentation of Topics
• What is energy efficiency (EE) and what are some of the barriers?
• What is the cost of saved energy for electricity efficiency programs?
• Why should EE be considered a utility resource (and customer service)?
2

Efficiency versus Conservation
Energy Conservation: Doing with less of a service in order to save energy
• Using less energy and probably getting less of a result
• Example: Turning down the thermostat to get less heating
Energy Efficiency: The use of less energy to provide the same or an improved level of service
• Using less energy to perform the same function
• Example: A more efficient furnace
Example: Turning street lights off versus installing efficient
streetlight lamps and controls
3

What are the Barriers to Energy Efficiency?
Barriers to Energy Efficiency
• Front-end investment requirements• Principal agent problem (property owner/tenant)• Lack of information and understanding of benefits (and risks)• Transaction costs• Lack of knowledgeable contractors and/or suppliers• Uncertainty in documenting benefits
5

Barriers to Energy Efficiency
Examples of issues in different markets
Institutional/Public Sector
Buildings- Large backlog of deferred capital
investments- Lack of financial resources- Lack of people resources
Commercial Businesses - Split incentive problem- Lack of interest even in long tenancy
situations since energy costs represent small percentage of business costs
Residential- Poor: not able to make investments- Middle class: lack financing - Well-off: energy costs represent a small
portion of disposable income so not that interested
- Split incentive problem· Tenants pay energy bills· No incentive for owner improvements
Industrial- Short investment horizon (1-3 year
paybacks sought)- Energy costs can represent small
percentage of business costs
6
What is the Cost of Saved Energy for Electric Efficiency Programs?
Energy Efficiency Programs
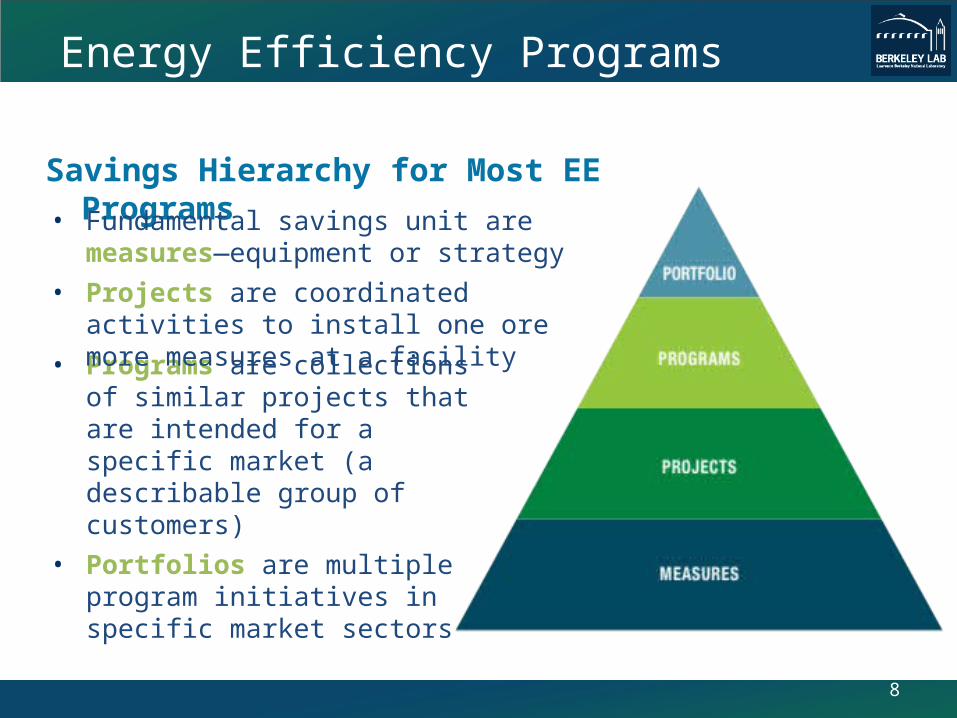
• Programs are collections of similar projects that are intended for a specific market (a describable group of customers)
• Portfolios are multiple program initiatives in specific market sectors
Savings Hierarchy for Most EE Programs• Fundamental savings unit are measures
—equipment or strategy
• Projects are coordinated activities to install one ore more measures at a facility
8

LBNL Cost of Saved Energy ProjectThe cost of saved energy (CSE) has not been comprehensively documented or analyzed at the program level
Approach Collected & analyzed reported annual EE program data in 34 states
Objectives Enable policymakers and program administrators to compare and
weigh resource options Encourage more consistent reporting of EE program impacts and costs Enable assessment of program approaches and performance across
different markets, delivery mechanisms and designs
Uses for Regulators More informed choices among demand and supply resources Better understanding of the costs of efficiency Keener insight and input into DSM investments
9

Data Collection and Standardization
LBNL DSM Program Database• Program Administrator (PA)
CSE: 100+ administrators in 34 states
– 5,900 program years for 2009-2013• Total Resource CSE: 50
administrators in 19 states– 2,100 program years for 2009-2013
Types of Data Collected• Net & gross savings• Annual incremental & lifetime
savings• Budgets & expenditures
– Administrative costs– Incentive costs– Education, marketing & outreach
• Participant costs• Measure lifetimes for programs• Number of program participants
10
Standardization Is Critical to Aggregating Data and Comparing Performance• Standard terms and definitions for program data and metrics• A national typology of programs
10
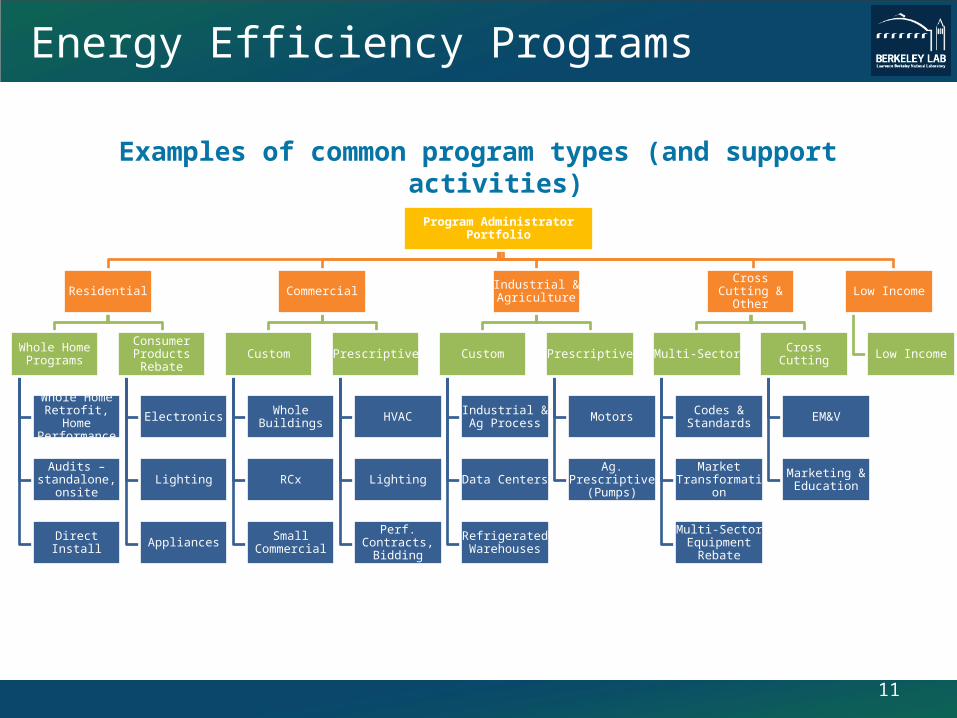
Energy Efficiency Programs
Program Administrator Portfolio
Residential
Whole Home Programs
Whole Home Retrofit, Home Performance
Audits – standalone,
onsite
Direct Install
Consumer Products Rebate
Electronics
Lighting
Appliances
Commercial
Custom
Whole Buildings
RCx
Small Commercial
Prescriptive
HVAC
Lighting
Perf. Contracts, Bidding
Industrial & Agriculture
Custom
Industrial & Ag Process
Data Centers
Refrigerated Warehouses
Prescriptive
Motors
Ag. Prescriptive (Pumps)
Cross Cutting & Other
Multi-Sector
Codes & Standards
Market Transformation
Multi-Sector Equipment
Rebate
Cross Cutting
EM&V
Marketing & Education
Low Income
Low Income
Examples of common program types (and support activities)
11

Cost of Saved Electricity: National Results– The U.S. average levelized CSE is slightly more than two cents per kilowatt-
hour – Residential programs had the lowest savings weighted CSE ($0.018/kWh)
followed by C&I programs ($0.021/kWh)
12
n = 1752 n = 1338 n = 339 n = 699

Cost of Saved Electricity: Commercial and Industrial Programs
– C&I Custom (287) and Prescriptive (259) programs were the most common and had savings-weighted average CSE below $0.02/kWh
13

Cost of Saved Electricity: Residential Programs
– Consumer Product Rebate and Prescriptive (HVAC, insulation) programs had a savings-weighted average CSE of $0.009/kWh and $0.016/kWh respectively
14
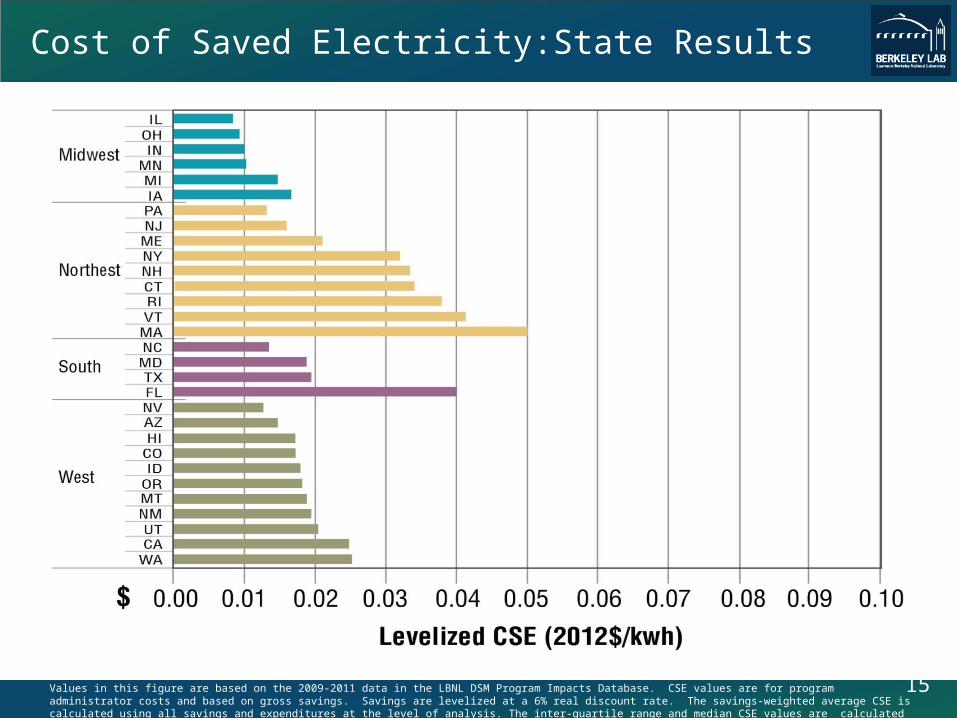
Cost of Saved Electricity:State Results
15Values in this figure are based on the 2009-2011 data in the LBNL DSM Program Impacts Database. CSE values are for program administrator costs and based on gross savings. Savings are levelized at a 6% real discount rate. The savings-weighted average CSE is calculated using all savings and expenditures at the level of analysis. The inter-quartile range and median CSE values are calculated for each program type.
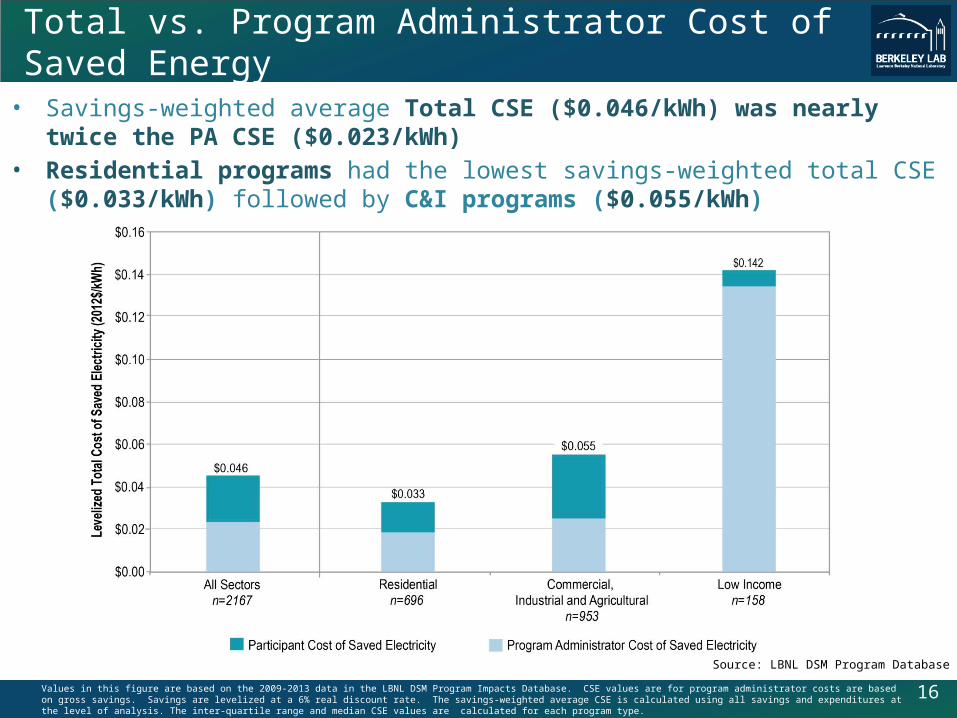
Total vs. Program Administrator Cost of Saved Energy
• Savings-weighted average Total CSE ($0.046/kWh) was nearly twice the PA CSE ($0.023/kWh)
• Residential programs had the lowest savings-weighted total CSE ($0.033/kWh) followed by C&I programs ($0.055/kWh)
Values in this figure are based on the 2009-2013 data in the LBNL DSM Program Impacts Database. CSE values are for program administrator costs are based on gross savings. Savings are levelized at a 6% real discount rate. The savings-weighted average CSE is calculated using all savings and expenditures at the level of analysis. The inter-quartile range and median CSE values are calculated for each program type.
Source: LBNL DSM Program Database
16

Why should Energy Efficiency be considered a utility resource (and customer service)?

Why do Energy Efficiency?
• Has already done a lot to reduce wasting of energy
• Is relatively cheap—reduces investment requirements for supply-side resources
• There are plenty of opportunities
• Is not a limited resource—there are new technologies and strategies
• Can be implemented quickly and can be targeted (e.g. geographic area)
• Diversifies utility resource portfolios
18

EE Reduces a Utility’s Cost to Serve
• EE avoids the need for new generation additions which reduces capital expenditures
• EE reduces total sales and peak demand which reduces energy production costs
0.871.23
00.20.40.60.8
11.21.4
Mod. EE Agg. EE
Purchased Power/Capital Expenditure Budget Savings ($B, 20-Yr. PV)
Case 2018 2019 2020 2021 2022 2023 2024 2025 2026 2027 2028 2029 2030 2031 2032
BAU P P M P M M P P
Mod. EE P P P & M M M P P
P – Peaker M – Mid-Merit Red – Deferred Plant
19

Non-Energy Benefits: Participant Benefits
• Indoor air quality improvements, improved comfort (e.g., quality of light, less noise, fewer drafts, better building temperature control)
• Higher productivity and lower rates of absenteeism through better-performing systems (e.g., ventilation, building shell, lighting)
• Reduced equipment O&M costs because of more efficient systems (although more complex systems could require more maintenance)
• Water and wastewater savings
• For commercial businesses and public entities, improved public perceptions and the ability to market products and tenant leases
• Avoided capital cost for equipment or building component replacements whose capital costs can be paid from savings
20
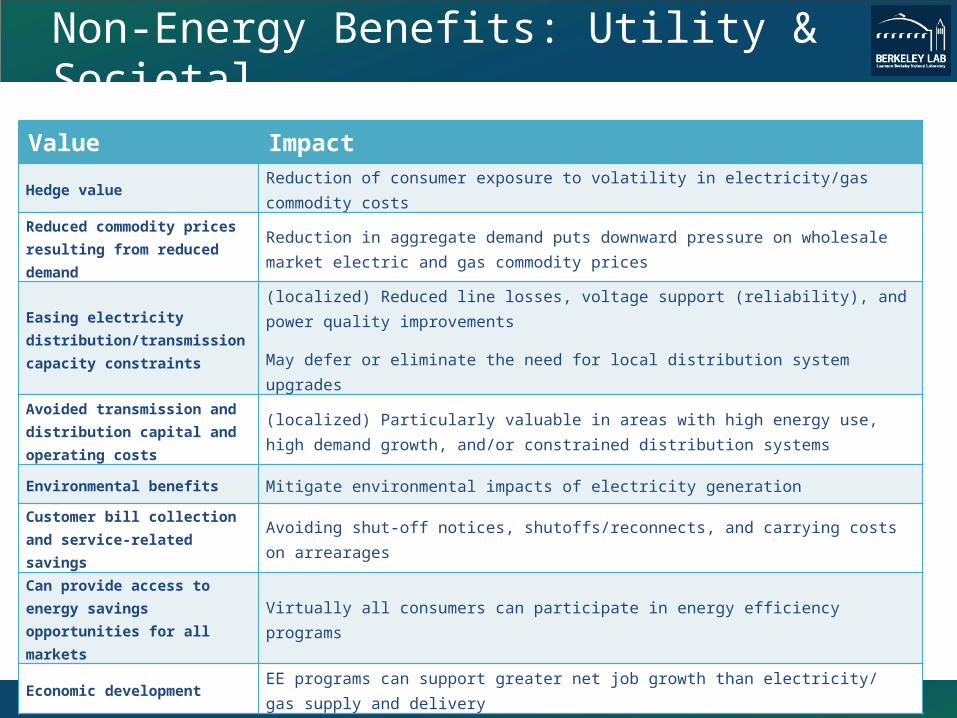
Non-Energy Benefits: Utility & Societal
Value Impact
Hedge value Reduction of consumer exposure to volatility in electricity/gas commodity costs
Reduced commodity prices resulting from reduced demand
Reduction in aggregate demand puts downward pressure on wholesale market electric and gas commodity prices
Easing electricity distribution/transmission capacity constraints
(localized) Reduced line losses, voltage support (reliability), and power quality improvements
May defer or eliminate the need for local distribution system upgrades
Avoided transmission and distribution capital and operating costs
(localized) Particularly valuable in areas with high energy use, high demand growth, and/or constrained distribution systems
Environmental benefits Mitigate environmental impacts of electricity generation
Customer bill collection and service-related savings Avoiding shut-off notices, shutoffs/reconnects, and carrying costs on arrearages
Can provide access to energy savings opportunities for all markets Virtually all consumers can participate in energy efficiency programs
Economic development EE programs can support greater net job growth than electricity/ gas supply and delivery
21
Non-Energy Benefits: Jobs
• Direct. Jobs in firms that receive efficiency program dollars and implement EE projects
• Indirect. Jobs in firms supplying goods and services to energy efficiency firms
• Induced. Those created by the demand generated by wage and business income from energy efficiency investments and by energy bill savings.
22

Key Policy Drivers for Energy Efficiency
Key Policy Drivers for Energy Efficiency Spending and Savings
Applicable to Electric Efficiency Programs
Applicable to Natural Gas Efficiency Programs
Energy Efficiency Resource Standard (EERS)
AZ, CA, CO, HI, IL, IN, MD, MI, MN, MO, NM, NY, OH, PA, TX
CA, CO, MI, MN, NY, IL
Energy efficiency eligibility under state RPS
HI, MI, NC, OH, NV
Statutory requirement that utilities acquire all cost-effective energy efficiency
CA, CT, MA, RI, VT, WA CA, CT, MA, RI, VT, WA
Systems benefit charges CA, CT, DC, MA, ME, MT, NH, NJ, NY, OH, OR, RI, VT, WI
CA, DC, ME, MT, NJ, NY, RI,WI
Integrated resource planning 34 States (primarily in the West and Southeast) and TVA
17 States (primarily in the West and Northeast)
Demand Side Management plan or energy efficiency budget
28 States 21 States (primarily in the Northeast and Midwest)
23

Thank You
Charles GoldmanStaff Scientist Electricity Markets and Policy GroupLawrence Berkeley National [email protected]
24