utah department of health 1 1 identifying peer areas for community health collaboration and data...
TRANSCRIPT

Utah Department of HealthUtah Department of Health11
Identifying Peer Areas for Community Health Collaboration and Data Smoothing
Identifying Peer Areas for Community Health Collaboration and Data SmoothingBrian Paoli
Utah Department of Health
6/6/2007

Utah Department of HealthUtah Department of Health22
AcknowledgmentsAcknowledgments
-Dr. Lois Haggard, UDOH
-Dr. David Mason, Univ. of Utah
-Mohammed Chaara, Univ. of Utah
-Michael Friedrichs, UDOH
-Kathryn Marti, UDOH

Utah Department of HealthUtah Department of Health33
OutlineOutline
-Background: – Why Peer Areas?
– Data Smoothing
– Previous Peer Area Attempts
-Methodology and Procedures– Utah’s 61 Small Areas
– Demographic Similarity
– Producing Smoothed Estimates

Utah Department of HealthUtah Department of Health44
Why Peer Areas?Why Peer Areas?
-Community Collaboration– Identify areas that are similar for
purposes of comparison– Collaborate on strategies,
interventions
-Data Smoothing– “Borrow strength” from geographic
areas that are similar.– Especially useful when multi-year
trend data are not available

Utah Department of HealthUtah Department of Health55
Data SmoothingData Smoothing
-Why smooth?
– We calculate measures, such as rates of death and disease, to assess the underlying disease risk in a population.
– Measures from small populations are inherently erratic – subject to sampling variation.
– Rare events such as infant mortality can vary widely from year to year.

Utah Department of HealthUtah Department of Health66
Utah Small Area "Provo South" Infant Mortality Rates by Year
0
2
4
6
8
10
12
14
16
18
1996 1997 1998 1999 2000 2001 2002 2003 2004 2005
Infa
nt
Dea
ths
per
1,0
00 L
ive
Bir
ths

Utah Department of HealthUtah Department of Health77
Data SmoothingData Smoothing
-Most methods smooth data over time, requiring data from multiple years– Pool multiple years (e.g., 3- or 5-
year averages)
– Moving average
– Combine areas to increase the number of cases

Utah Department of HealthUtah Department of Health88
GoalGoal
-Produce reliable (smooth, not erratic) and timely estimates.
-Make appropriate inferences about the underlying disease risk in each community
-Method must be simple to apply –and easy to implement

Utah Department of HealthUtah Department of Health99
29 UT Counties

Utah Department of HealthUtah Department of Health1010
2006 UT Population Estimates by County
979
986,073
0
100,000
200,000
300,000
400,000
500,000
600,000
700,000
800,000
900,000
1,000,000

Utah Department of HealthUtah Department of Health1111
Utah Small AreasUtah Small Areas
-61 small areas were defined using both ZIP code and County– Each area is either a ZIP code area,
– two or more contiguous ZIP codes, or
– a combination of ZIP code and county information.

Utah Department of HealthUtah Department of Health1212
61 UT Small Areas

Utah Department of HealthUtah Department of Health1313
2006 UT Population Estimates by 61 Small Areas
72,063
20,9740
100,000
200,000
300,000
400,000
500,000
600,000
700,000
800,000
900,000
1,000,000

Utah Department of HealthUtah Department of Health1414
Previous AttemptsPrevious Attempts
-Geographic adjacency– rooks’s adjacency
– queen’s adjacency
– geographic centroid
– population centroid

Utah Department of HealthUtah Department of Health1515
Previous AttemptsPrevious Attempts
S tep 1 S tep 1
S tep 2
S tep 3
S tep 1
S tep 2
S tep 1
S tep 2
S tep 3
S tep 4
S tep 1
S tep 2
S tep 3
S tep 4
S tep 5
-Cluster analysis– odd-sized
groups
– odd-ball areas
– groups mutually exclusive (okay, but not necessary)

Utah Department of HealthUtah Department of Health1616
Develop Methodology to:Develop Methodology to:
-Identify Peer Areas– Create “Demographic Distance”
matrix
-Smooth Data– Median? Pooled? Weighted?
-Measure Our Success– Reliability of results– Appropriateness of making inference
to index area from smoothed rates

Utah Department of HealthUtah Department of Health1717
1. Identify Peer Areas1. Identify Peer Areas
-Demographic Characteristics– Use available demographic
information from the U.S. Bureau of the Census
– Use demographic variables that are associated with population health
– Select a small number of these demographic variables
– Produce a methodology others can replicate

Utah Department of HealthUtah Department of Health1818
1. Identify Peer Areas1. Identify Peer Areas
-Factor analysis to reduce dimensionality. – Foreign born/Hispanic– Education– Income/Poverty– Employment– Age– Urban and Rural

Utah Department of HealthUtah Department of Health1919
1. Identify Peer Areas1. Identify Peer Areas
-Selected 5 variables based on factor analysis and correlation with health outcomes (e.g., infant mortality, heart disease, etc.)– % Hispanic– % age 25+ with Bachelor’s degree– % children in poverty– % owner-occupied housing– % age 65+

Utah Department of HealthUtah Department of Health2020
1. Identify Peer Areas1. Identify Peer Areas
-Create distance matrix
The distance d(x,y) between two areas with n dimensional observations x=[x1,x2,…,xn]’ and y=[y1,y2,…,yn]’ is:
d(x,y)= ([x-y]’S-1[x-y])1/2 The matrix S contains the variances and
covariances of the n variables.
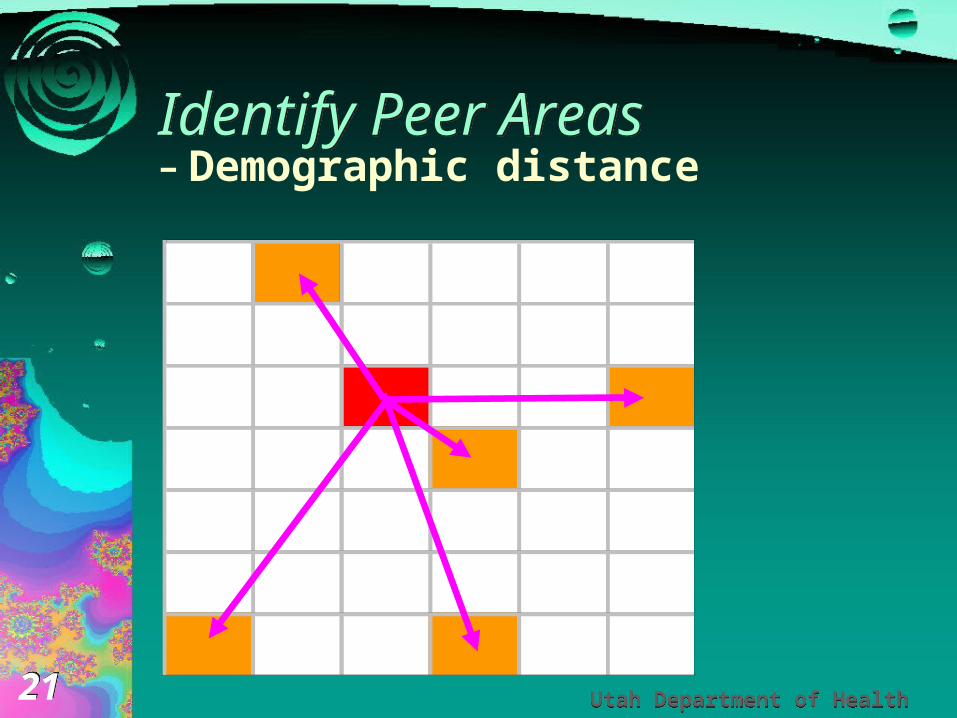
Utah Department of HealthUtah Department of Health2121
Identify Peer AreasIdentify Peer Areas-Demographic distance

Utah Department of HealthUtah Department of Health2222
1. Identify Peer Areas1. Identify Peer Areas
-Which are the Peer Areas for purposes of collaboration?– 3 (or some #) areas with smallest
distances?
– All areas within a certain distance?1Brig 2OthBox 3Logan 4OthCac/R 5BenLo 6Mor/EWeb
1Brig 02OthBox 1.2 03Logan 2.9 3.0 04OthCac/R 1.6 1.3 2.7 05BenLo 0.9 1.0 3.2 2.0 06Mor/EWeb 1.4 1.6 3.1 1.1 2.0 0

Utah Department of HealthUtah Department of Health2323
1. Identify Peer Areas1. Identify Peer Areas
-Which are the Peer Areas for purposes of data smoothing?– Same areas as for collaboration?
-Need to think about the smoothing algorithm.

Utah Department of HealthUtah Department of Health2424
2. Smooth the Data2. Smooth the Data
-Options– Weighted Median rate using a group
of five areas– Pool a selected number of areas
together and treat them as a single area (crude rate for the combined areas)
– Pool all areas together and weight them by a function of their distances to the index area (closer areas -> more weight)

Utah Department of HealthUtah Department of Health2525
Brigham City Distance Scores
0
1
2
3
4
5
61 3 5 7 9
11 13 15 17 19 21 23 25 27 29 31 33 35 37 39 41 43 45 47 49 51 53 55 57 59 61
Other 60 Areas
Dem
og
rap
hic
Dis
tan
ce S
core
Close Neighbors Distant Neighbors

Utah Department of HealthUtah Department of Health2626
Brigham City Distance Scores
0
1
2
3
4
5
6
1 3 5 7 9
11
13
15
17
19
21
23
25
27
29
31
33
35
37
39
41
43
45
47
49
51
53
55
57
59
61
Other 60 Areas
De
mo
gra
ph
ic D
ista
nc
e S
co
re
Areas that are close contribute more to the smoothed rate
Areas that are distant contribute little to the smoothed rate

Utah Department of HealthUtah Department of Health2727
Weight=exp(-.5*d2)
0.0
0.2
0.4
0.6
0.8
1.0
1.20.
0
0.3
0.6
0.9
1.2
1.5
1.8
2.1
2.4
2.7
3.0
3.3
3.6
3.9
4.2
4.5
4.8
Distance
Wei
ght

Utah Department of HealthUtah Department of Health2828
Smoothing Weights and Demographic Distance Scores: Wasatch, UT
0.0
0.1
0.2
0.3
0.4
0.5
0.6
0.7
0.8
0.9
1.0
61 UT Small Areas
Sm
ooth
ing
Wei
ghts
0
1
2
3
4
5
6
7
Dis
tanc
e S
core
s
Smoothing Weights
Demographic Distance Scores

Utah Department of HealthUtah Department of Health2929
Smoothing Weights and Demographic Distance Scores: Summit, UT
0.0
0.1
0.2
0.3
0.4
0.5
0.6
0.7
0.8
0.9
1.0
61 UT Small Areas
Sm
oo
thin
g W
eig
hts
0
1
2
3
4
5
6
7
Dis
tan
ce S
core
s
Smoothing Weights
Demographic Distance Scores

Utah Department of HealthUtah Department of Health3030
Smoothing Weights and Demographic Distance Scores: Rose Park, UT
0.0
0.1
0.2
0.3
0.4
0.5
0.6
0.7
0.8
0.9
1.0
61 UT Small Areas
Sm
oo
thin
g W
eig
hts
0
1
2
3
4
5
6
7
Dis
tan
ce S
core
s
Smoothing Weights
Demographic Distance Scores

Utah Department of HealthUtah Department of Health3131
3. Measure Our Success3. Measure Our Success
-Reliability– Did the data get smoother?
– Intraclass Correlation Coefficient (ICC)• Ratio of the amount of variance between areas to
the sum of the variance within and between areas
• (MSbetween – MSwithin )/( MSbetween+(k-1)Mswithin )
• Range from 0 to 1
• 1 = perfectly smooth and level, only variance in the data is from one area to the next

Utah Department of HealthUtah Department of Health3232
3. Measure Our Success3. Measure Our Success
-Appropriateness of Inference– Is it appropriate to infer that the
smoothed rate represents the true underlying disease risk in the community? (Overall, are the smoothed scores in the ballpark?)
– Sum of Squared Differences (SS) from smoothed data to original data.• Smoothed estimate should be close to
the index area’s crude rate

Utah Department of HealthUtah Department of Health3333
3. Measure Our Success3. Measure Our Success
-ICC – Want high scores, close to 1
-SS – Want low scores, given high ICC
-HOW DID THE SMOOTHED RATES PERFORM?

Utah Department of HealthUtah Department of Health3434
60 Cedar City Teen Birth Rate
10
12
14
16
18
20
22
24
26
28
30Te
en B
irths
Per
1,00
0 Gi
rls A
ge 15
-17
Crude 20.3125 24.27184466 23.68866328 27.57619739 11.8694362 11.21794872 18.77133106
Reg 24.23154509 22.71188346 21.19222182 19.67256019 18.15289855 16.63323692 15.11357528
WgtDist61 20.94588086 23.28469917 22.6727552 23.87547733 14.17099223 13.43574372 17.025612
1999 2000 2001 2002 2003 2004 2005
Smoothed ICC=.901
Crude ICC=.835

Utah Department of HealthUtah Department of Health3535
17 Rose Park Teen Birth Rate
40
50
60
70
80
90Te
en B
irths
Per
1,00
0 Gi
rls A
ge 15
-17
Crude 55.63282337 49.86149585 55.86592179 79.4520548 65.45961003 49.43502825 56.41748942
Reg 57.6861943 58.08243542 58.47867653 58.87491764 59.27115876 59.66739987 60.06364099
WgtDist61 69.99113259 69.575952 64.28596285 71.54188979 57.39244186 61.56317478 54.98647241
1999 2000 2001 2002 2003 2004 2005
Smoothed ICC=.901
Crude ICC=.835

Utah Department of HealthUtah Department of Health3636
51 Summit Co. Teen Birth Rate
5
7
9
11
13
15
17
19Te
en B
irths
Per
1,0
00
Girl
s Ag
e 15
-17
Crude 17.02786378 10.71975498 12.36476043 17.310253 9.708737864 8.43373494 8.343265793
Reg 15.55282332 14.36418558 13.17554785 11.98691011 10.79827238 9.609634641 8.420996905
WgtDist61 13.91569041 11.50390131 12.61882649 10.36809453 8.211847304 7.909326566 7.445266947
1999 2000 2001 2002 2003 2004 2005
Smoothed ICC=.901
Crude ICC=.835

Utah Department of HealthUtah Department of Health3737
4 Oth Cache/Rich Co. Teen Birth Rate
0
5
10
15
20
25Te
en B
irths
Per
1,00
0 Gi
rls A
ge 15
-17
Crude 17.11711712 16.39344262 16.48351648 9.685230024 8.34028357 8.658008658 13.67365542
Reg 16.54423119 15.33192812 14.11962505 12.90732199 11.69501892 10.48271585 9.270412777
WgtDist61 20.72739618 19.02061662 18.75861749 16.92813858 13.87932363 13.40885036 13.19325263
1999 2000 2001 2002 2003 2004 2005
Smoothed ICC=.901
Crude ICC=.835

Utah Department of HealthUtah Department of Health3838
SummarySummary
-A small number of demographic variables were identified– Capture the demographic
variability
– Related to health outcomes
-Peer Areas were identified– Groupings seem intuitive

Utah Department of HealthUtah Department of Health3939
SummarySummary
-Smoothing algorithm was identified– Had characteristics we liked
• Index area gets highest weight
• Peer areas get high weights
• Dissimilar areas weight=0

Utah Department of HealthUtah Department of Health4040
SummarySummary
-Smoothed rates performed generally well– They were smooth (ICC ~ 1.0)
– They represented the underlying risk in the index area (SS relatively small)

Utah Department of HealthUtah Department of Health4141
SummarySummary
-Easy to replicate?– Excel spreadsheet
• You:– Enter your demographic variables – Enter health outcomes for the same areas– Change smoothing parameters (if desired)
• Excel:– Calculates distance matrix– Generates smoothed rates – Generates performance measures

Utah Department of HealthUtah Department of Health4242
Challenges/LimitationsChallenges/Limitations
-Demographic characteristics change, distance scores will need to be updated (decennial census years?)
-How much smoothing to use is a subjective decision.
-Smoothing may not seem credible to members of community
-Peer Groups are not symmetric

Utah Department of HealthUtah Department of Health4343
Excel SpreadsheetExcel Spreadsheet
The spreadsheet is free and the files can be downloaded from the IBIS website. Go to
http://ibis.health.utah.gov Look for “Peer Area Analysis
Tool” under the “News and System Enhancements” heading.

Utah Department of HealthUtah Department of Health4444
-Contact Information:
-Brian Paoli
Office of Public Health Assessment
Utah Department of Health
288 North 1460 West
P.O. Box 14201
Salt Lake City, Utah 84114-2101
email: [email protected]