uspostava tumorske linije debelog crijeva s mutacijom u
TRANSCRIPT
Uspostava tumorske linije debelog crijeva smutacijom u genu B7H3 i njena funkcionalna analiza
Južnić, Lea
Master's thesis / Diplomski rad
2017
Degree Grantor / Ustanova koja je dodijelila akademski / stručni stupanj: University of Zagreb, Faculty of Science / Sveučilište u Zagrebu, Prirodoslovno-matematički fakultet
Permanent link / Trajna poveznica: https://urn.nsk.hr/urn:nbn:hr:217:170519
Rights / Prava: In copyright
Download date / Datum preuzimanja: 2021-11-26
Repository / Repozitorij:
Repository of Faculty of Science - University of Zagreb

University of Zagreb
Faculty of Science
Department of Biology
Lea Južnić
Generation of colorectal cancer cell line with mutation in B7H3 gene and its
functional analysis
Uspostava tumorske linije debelog crijeva s mutacijom u genu B7H3 i njena
funkcionalna analiza
Graduation Thesis
Zagreb, 2017.

II
This thesis was conducted in the laboratory of Prof. Dr. med. Sebastian Zeissig at the
Center for Regenerative Therapies Dresden, Cluster of Excellence, TU Dresden, under
supervision of Prof. Dr. med Sebastian Zeissig and co-supervision of Dr. Maja Matulić, Assoc.
Prof. The thesis was submitted for evaluation to the Department of Biology, Faculty of Science,
University of Zagreb in order to obtain the title of Master of Molecular Biology (mag.biol.mol.).

III
Acknowledgements
I would first like to thank Prof. Dr. med. Sebastian Zeissig, for giving me the
opportunity to work on this project, but especially for sharing his knowledge and being an
inspiration for my further research. I would also like to thank Dr. Maja Matulić, Assoc. Prof.,
for her co-supervision, advice and guidance during this thesis.
Next, I would like express my gratitude to Dr. Kenneth Peuker and Dr. Anne Strigli for
their patience, guidance, advice and immense support in independent thinking, as well as
development of my research skills. Thank you for answering all the questions, listening to all
the crazy ideas and keeping me on track during this thesis. Further acknowledgement goes to
all members of the Zeissig research group for accepting me, creating a motivational and fun
work environment, and taking time to discuss and enrich my work. Special thanks go to my
amazing lab mate Liz Matthiesen, with whom I’ve shared moments of anxiety but also big
excitement and I’m looking forward to even more of those to come.
Finally, I wish to express my profound gratitude to my parents Hrvoje and Lidija and
my sister Nora for providing me with unfailing support and continuous encouragement
throughout my years of study and through the process of researching and writing this thesis.
This accomplishment would not have been possible without them. Thank you.
Lea

IV
TEMELJNA DOKUMENTACIJSKA KARTICA
Sveučilište u Zagrebu
Prirodoslovno-matematički fakultet Biološki odsjek Diplomski rad
USPOSTAVA TUMORSKE LINIJE DEBELOG CRIJEVA S MUTACIJOM U
GENU B7-H3 I NJENA FUNKCIONALNA ANALIZA
Lea Južnić
Rooseveltov trg 6, 10000 Zagreb, Hrvatska
Tumori uspostavljaju različite mehanizme kako bi se zaštitili od protu-tumorskog odgovora imunološkog sustava. Ljudski imunološki sustav stoga sadrži niz različitih regulatornih molekula, koje mogu stimulirati ili inhibirati imunološke reakcije. Pri tom, receptori i ligandi iz CD28 i B7 obitelji imaju središnju ulogu u posredovanju interakcija između tumorskih i imunoloških stanica. B7 homolog 3 (B7-H3, Cd276) opisan je kao član obitelji B7 koji je aberantno eksprimiran u različitim tumorima, uključujući rak debelog crijeva (CRC). Prethodna istraživanja pokazala su kontradiktorne uloge B7-H3 unutar imunološkog sustava, upućujući na imunosupresivno i imunostimuliratorno djelovanje. Dodatno, nekoliko je studija pokazalo da je B7-H3 uključen u intrinzičnu regulaciju razvoja i progresije tumora, poput apoptoze, proliferacije, migracije, invazije i metastaza. Stoga, kako bi se razjasnila potencijalna uloga B7-H3 u CRC-u, ovaj je rad imao za cilj uspostaviti tumorsku liniju raka debelog crijeva bez ekspresije B7-H3 uz pomoć CRISPR/Cas9 sustava, te istražiti potencijalne autonomne uloge B7-H3 molekule neovisno o imunološkom sustavu. Analiza pomoću metoda qRT-PCR-a, Western blota i imunofluorescencije pokazala je nedostatak B7-H3 nakon što su mutacije uvedene. Nadalje, apoptoza i proliferacija nisu promijenjene u stanicama koje su deficijentne za B7-H3. Prema tome, rezultati ovog rada upućuju na to da B7-H3 ne regulira staničnu smrt i proliferaciju tumora na staničnoj razini, već potencijalno posredno djeluje putem kontrole aktivacije imunološkog odgovora.
(34 stranice, 9 slika, 10 tablica, 52 literaturnih navoda, jezik izvornika: engleski) Rad je pohranjen u Središnjoj biološkoj knjižnici.
Ključne riječi: rak debelog crijeva, imunološki sustav, B7 homolog 3, Cd276, B7-H3, CRISPR/Cas9
Voditelj: prof. dr. med. Sebastian Zeissig Suvoditelj: izv. prof. dr. sc. Maja Matulić
Ocjenitelji: izv. prof. dr. sc. Maja Matulić; izv. prof. dr. sc. Martina Šeruga Musić; izv. prof. dr. sc. Mirta Tkalec
Rad prihvaćen: 30. studenog 2017.
V
BASIC DOCUMENTATION CARD
University of Zagreb
Faculty of Science Department of Biology Graduation Thesis
GENERATION OF COLORECTAL CANCER CELL LINE WITH
MUTATION IN B7-H3 GENE AND ITS FUNCTIONAL ANALYSIS
Lea Južnić
Rooseveltov trg 6, 10000 Zagreb, Croatia
Tumors establish a variety of different mechanisms to protect themselves from immune-mediated recognition and rejection. The human immune system is orchestrated by a variety of different regulatory molecules, which can either stimulate or inhibit immune cell responses. Receptors and ligands of the CD28 and B7 family have a central role in regulating the interaction between tumor and immune cells. The B7 homolog 3 (B7-H3, Cd276) has been described as a member of the B7 family which is aberrantly expressed in various tumors, including colorectal cancer (CRC) where its expression has also been shown to correlate with poor prognosis. Previous studies showed contradictory roles of B7-H3 within the immune system, demonstrating both immunosuppressive and immunostimulatory actions. In addition, it was suggested that B7-H3 may regulate tumor apoptosis, proliferation, migration, invasion and metastasis in a cell-autonomous manner. To address the question of potential cell-autonomous actions of B7-H3 in CRC, this work aimed at the generation of a CRC cell line with mutated B7-H3 using the CRISPR/Cas9 system and the investigation of potential cell-intrinsic functions of B7-H3. Analysis via qRT-PCR, Western blot and immunofluorescence methods showed a lack of B7-H3 after mutations were introduced in the Cd276 gene coding for B7-H3. Furthermore, apoptosis and proliferation were unaltered in cells deficient for B7-H3. Therefore, the results of this work suggest that B7-H3 does not regulate CRC cell death and proliferation in a cell-intrinsic manner but rather acts indirectly through the control of immune cell activation.
(34 pages, 9 figures, 10 tables, 52 references, original in: English)
Thesis deposited in the Central Biological Library. Keywords: colorectal cancer, immune system, B7 homolog 3, Cd276, B7-H3, CRISPR/Cas9
Supervisor: Dr. med. Sebastian Zeissig, Prof. Cosupervisor: Dr. Maja Matulić, Assoc. Prof.
Reviewers: Dr. Maja Matulić, Assoc. Prof.; Dr. Martina Šeruga Musić, Assoc. Prof.; Dr. Mirta Tkalec, Assoc. Prof.
Thesis accepted: November 30th, 2017
VI
TABLE OF CONTENTS
1 INTRODUCTION ........................................................................................................... 1
1.1 Colorectal cancer ....................................................................................................... 1
1.1.1 Molecular pathogenesis ..................................................................................... 1
1.2 Immune system .......................................................................................................... 2
1.2.1 Immunosurveillance, immunoediting and immune escape ................................ 3
1.2.2 The role of co-stimulatory and co-inhibitory molecules in T cell activation .... 5
1.3 B7 homolog 3 ............................................................................................................. 6
2 METHODS ....................................................................................................................... 9
2.1 Molecular methods ..................................................................................................... 9
2.1.1 Generation of PX458-gB7-H3 plasmid for targeting Cd276 gene .................... 9
2.1.2 Genotyping by polymerase chain reaction (PCR) ........................................... 11
2.1.3 cDNA sythesis and real time PCR ................................................................... 12
2.2 Cell Culture .............................................................................................................. 14
2.2.1 General conditions ........................................................................................... 14
2.2.2 Transfection and single cell sort ...................................................................... 14
2.3 Biochemical methods ............................................................................................... 14
2.3.1 Protein recovery ............................................................................................... 14
2.3.2 Protein deglycosylation .................................................................................... 15
2.3.3 Western blot ..................................................................................................... 15
2.3.4 Immunofluorescence staining .......................................................................... 17
2.4 Functional in vitro assays ......................................................................................... 17
2.4.1 BrDU assay ...................................................................................................... 17
2.4.2 Growth assay .................................................................................................... 18
2.4.3 MTT assay ....................................................................................................... 18
2.4.4 Cell death analysis ........................................................................................... 18
2.5 Statistics ................................................................................................................... 18
3 RESULTS ....................................................................................................................... 19
3.1 Generation of B7-H3 knockout clones .................................................................... 19
3.2 Mutated clones are deficient in B7-H3 .................................................................... 21
3.3 Cell death is not altered by B7-H3 deletion ............................................................. 23
3.4 Cell proliferation is not significantly affected by loss of B7-H3 expression ........... 24

VII
4 DISCUSSION ................................................................................................................. 27
4.1 Use of CRISPR/Cas9 system to generate B7-H3 knockout clones ......................... 27
4.2 Loss of B7-H3 does not influence apoptosis or proliferation in CMT-93 ............... 28
4.3 Prospects .................................................................................................................. 29
5 CONCLUSION .............................................................................................................. 30
6 REFERENCES ............................................................................................................... 31
7 APPENDICES ................................................................................................................ 34
LIST OF ABBREVIATIONS AND ACRONYMS
7-AAD 7-aminoactinomycin D
Ann Annexin V
APC antigen-presenting cell
APC adenomatous polyposis coli
B7-H3, Cd276 B7 homolog 3
BRAF v-Raf murine sarcoma viral oncogene homolog B
BrDU bromodeoxyuridine
CRC colorectal cancer
CRISPR clustered regularly interspaced short palindromic repeats
CTL cytotoxic T lymphocytes
CTLA4 cytotoxic T lymphocyte associated antigen 4
D-PBS Dulbecco's phosphate-buffered saline
DAPI 4',6-diamidino-2-phenylindole
DMEM Dulbecco's Modified Eagle Medium
DMSO dimethyl sufoxide
DTT dithiothreitol
FBS fetal bovine serum
GM-CSF granulocyte-macrophage colony stimulating factor
IFN-γ� interferon gamma
KRAS Kirsten rat sarcoma viral oncogene homolog
MHC major histocompatibility complex
MLH1 MutL homolog 1
MMP matrix-metalloproteinase
MTT 3-(4,5-dimethylthiazol-2-yl)-2,5-diphenyltetrazolium bromide
NK natural killer
PCR polymerase chain reaction
PD-L1 programmed cell death ligand 1
PMA phorbol 12-myristate 13-acetate
PNGase F Protein-N-Glycosidase F
PVDF polyvinylidene difluoride
qRT-PCR quantitative real-time polymerase chain reaction
RIPA radioimmunoprecipitation assay
s.e.m. standard error of the mean
SDS-PAGE sodium dodecyl sulfate polyacrylamide gel electrophoresis
TAM Tumor-associated macrophage
TBS-T Tris-buffered saline with Tween 50
TCR T cell receptor
TP53 Tumor protein p53
TREML2, TLT-2 triggering receptor expressed on myeloid cell-like transcript 2
1
1 INTRODUCTION
1.1 Colorectal cancer
Colorectal cancer (CRC) is the third most common malignancy and the fourth leading
cause of death in the global human population, accounting for about 1.4 million new cases and
almost 700 000 deaths in 2012 worldwide (Ferlay et al, 2015). These numbers are expected to
annually increase to more than 2.2 million new cases and 1.1 million cancer deaths by 2030
worldwide (globocan.iarc.fr 2017).
Colorectal cancer is a result of multiple risk factors that co-occur and interact. They
include sociodemographic factors, such as old age and male sex (Brenner et al, 2014), family
history of CRC (Taylor et al, 2010), predisposing diseases like inflammatory bowel disease
(Jess et al, 2012), obesity (Ma et al, 2013) or diabetes (Jiang et al, 2011), lifestyle and
environmental factors such as smoking (Liang et al, 2009), excessive alcohol consumption
(Fedirko et al, 2011) and high consumption of red and processed meat (Chan et al, 2011) or the
intestinal microbiota (Lucas et al, 2017). Within the microbiota, colonization with Bacteroides
fragilis or Fusobacterium spp has also been implicated in CRC growth (Brenner et al, 2014).
These risk factors can promote a sporadic onset of CRC which is the case for about 90% of all
CRC cases (Lucas et al, 2017). As previously mentioned, also familial inheritance for CRC can
occur, which accounts for approximately 10% of all cases. Depending on inherited genetic
alterations involved, it is possible to distinguish two main forms of hereditary CRC – Lynch
syndrome (hereditary non-polyposis colorectal cancer; mutations in DNA mismatch repair) and
familial adenomatous polyposis (germline mutations in the APC gene) (Lucas et al, 2017).
1.1.1 Molecular pathogenesis
All of the above mentioned causes of CRC can lead to genetic instability, reduced DNA
integrity and subsequently to the loss of DNA stability which allows the accumulation of
mutations (Terzic et al, 2010). Somatic mutations in defined genes are required to initiate and
promote CRC development along the adenoma-carcinoma sequence (Fig 1.). Among the
earliest events occurring in CRC are mutations in the tumor suppressor gene adenomatous
polyposis coli (APC). Progression to malignancy is further promoted by activating mutations
in the Kirsten rat sarcoma viral oncogene homolog (KRAS) and inactivating mutation of tumor
protein p53 (TP53), a tumor suppressor gene. Additionally, mutations in the v-Raf murine
sarcoma viral oncogene homolog B (BRAF) with CpG island methylator phenotype, as well as

2
MutL homolog 1 (MLH1) gene promoter methylation which leads to high levels of
microsatellite instability, are also causes for CRC development (Brenner et al, 2014).
Therefore, loss of control of cell proliferation, unlimited cell growth and hence tumor
development are orchestrated by mutations in a variety of genes which are introduced over time.
CRC development begins with the formation of a hyper-proliferative intestinal
epithelium, which thereby loses its cellular organization and consequently structure and
ultimately leads to the formation of benign polyps or adenomas (Fig 1.). Some of these
adenomas develop into adenocarcinoma while accumulating more genetic mutations, which can
take up to 10 years. Later on, cancerous cells may invade surrounding tissue even further,
reaching lymph nodes or blood vessels and leading to metastasis to the liver and/or the lung
(Davies et al, 2005).
1.2 Immune system
Once a tumor is established, processes to evade recognition by the host immune system
are activated. The immune system is a host defense system which uses a complex array of
protective mechanisms in order to control and eliminate pathogenic organisms, infectious
agents, toxins or cancer cells. The immune system is conceptually divided into two parts – the
innate immune system and the adaptive immune system (humoral or cell-mediated), both of
which have characteristic features.
Innate immunity involves rapid immune responses after a pathogen is encountered and
therefore leads the host’s initial response. In the intestine, it comprises various physical barriers
(epithelial or mucus layers), soluble proteins and biomolecules (cytokines, chemokines,
Figure 1. Adenoma-carcinoma sequence. Somatic mutations lead from hyper-proliferative epithelium to adenomas, adenocarcinomas and ultimately cancer (hopkinscoloncancer.org 2017)

3
complement proteins) as well as membrane-bound or cytoplasmic receptors which bind
molecular patterns expressed on surfaces of microbes. Cells included in innate immune
response are neutrophils, basophils, eosinophils, dendritic cells, natural killer (NK) cells and
monocyte-derived macrophages (Chaplin, 2010).
In addition, adaptive immunity leads to a slower, but more targeted response. It depends
on antigens presented by antigen presenting cells (APCs), which are recognized by B and T
lymphocytes in the context of major histocompatibility (MHC) molecules (Pecorino, 2012).
MHC molecules are cell surface glycoproteins that bind fragments of proteins that have either
been synthesized within the cell (MHC class I, MHCI) or ingested by the cell and proteolytically
processed (MHC class II, MHCII). These mentioned lymphocytes express respective antigen-
specific receptors that are encoded by genes assembled through somatic rearrangement of germ-
line gene elements. In this way, the immune system creates a great variety of antigen receptors,
each with potentially unique specificity for a different antigen (Chaplin, 2010).
However, T and B lymphocytes respond differently upon antigen recognition. Main
functions of B cells are to synthesize and secrete antibodies, therefore contributing to humoral
immunity. In contrast, T cells, specifically CD8+ cytotoxic T cells (CTLs) and CD4+ T helper
cells (Th1, Th2, Th17, regulatory T cells), are responsible for cell-mediated immunity and
mostly eliminate virally infected cells and tumor cells. They are activated through a broad
spectrum of transmembrane heterodimeric proteins called T cell receptors (TCRs).
Additionally, TCRs require accessory chains (CD3) which allow signal transduction after
antigen recognition, leading to the activation of T cells. Activated T cells release perforins or
granzymes, and express ligands for death receptors on the target cells. Because of high
specificity and strict control of T cell activation and host-pathogen discrimination, cytotoxic T
cell responses are considered as one of the most important anti-tumor defenses of the body
(Pecorino, 2012). On the other hand, as inflammation is one of the main drivers of cancer
development, active T cells can also exert protumorigenic functions by establishing and
maintaining inflammatory tumor environment. Therefore, the immune system is an important
regulator of tumor growth.
1.2.1 Immunosurveillance, immunoediting and immune escape
When the immune system recognizes and eliminates primary developing tumors,
immunosurveillance takes place. It is expected that the immune system can recognize tumor-
specific antigens (molecules that are unique to cancer cells) or tumor-associated antigens

4
(molecules that are differently expressed in cancer and healthy cells) and start to eliminate the
tumor cells (Pecorino, 2012). It has been shown that components of both the adaptive and the
innate immune system are involved in immunosurveillance (Marcus et al, 2014). Means of
action depend on tumor’s origin, mechanism of transformation, anatomic localization and
mechanism of immunological recognition (Dunn et al, 2004).
Tumors can escape or limit immunosurveillance and even shift the immune response to
a tumor-promoting role. This concept was termed immunoediting due to the fact that cancer
cells are constantly able to modulate and edit the host’s anti-tumor immune response (Pecorino,
2012). This is facilitated by a specific tumor microenvironment which is characterized by a
chronic intrinsic inflammatory response that leads to the recruitment of various innate and
adaptive immune cells (Grivennikov et al, 2010). Their abundance and activation state as well
as the expression of various immune mediators and modulators dictate whether the immune
cells will drive tumor-promoting inflammation or anti-tumor immunity.
The immune cells most frequently found within the tumor microenvironment are tumor
associated macrophages (TAMs) and T lymphocytes (Grivennikov et al, 2010). TAMs usually
promote tumor growth and are considered important for angiogenesis, invasion and metastasis
(Condeelis i Pollard, 2006). On the other hand, T cells can exert both tumor-suppressive and
tumor–promoting effects. The presence of activated CTLs or Th1 cells correlates with better
survival in some cancers such as colon cancer or melanoma. However, many of the same T cell
subsets are also involved in tumor promotion, progression or metastasis in other types of
cancers. (Grivennikov et al, 2010). On the other hand, it is known that Th17 cells and its
secreted interleukins have a prominent role in early stages of CRC development as shown in
CRC patients with elevated levels of IL-17A which had a drastic reduction in survival rates
(Formica et al, 2014; De Simone et al, 2013; Tosolini et al, 2011). Therefore, modulating T
cell activation within the tumor microenvironment has been rapidly studied in the past years
and shall further be explained.

5
1.2.2 The role of co-stimulatory and co-inhibitory molecules in T cell activation
In order to activate T cells, two stimuli are required. First, the before mentioned
TCR/CD3 complex is able to interact with antigens only in the context of MHC molecules.
However, this interaction provides only a partial signal for T cell activation. The second signal
originates from interactions of the CD28 family of receptors on T cells with the B7 family of
ligands on APCs (Fig. 2) (Chaplin, 2010; Ni i Dong, 2017). The second signal can be co-
stimulatory or co-inhibitory, either promoting or inhibiting T cell activation. The absence of a
co-stimulator, the first interaction leads to an anergic state of prolonged T cell non-
responsiveness (Chaplin, 2010).
Many recent studies investigated properties of these co-stimulatory and co-inhibitory
molecules, which are involved in the interaction between APCs and T cells (Figure 2). One
example are ligands of the B7 family such as B7.1 (CD80) and B7.2 (CD86) which are
expressed on APCs and interact with receptors on T cells such as CD28 or the cytotoxic T
lymphocyte associated antigen 4 (CTLA4) to promote or inhibit T cell activation, respectively.
As CD80 and CD86 are induced or up-regulated on stimulated APCs, they interact with CD28
receptors on T cells and enhance TCR-mediated signaling and promote T cell survival, leading
to clonal expansion and differentiation of effector T cells (Lenschow et al, 1996). After T cell
activation, CTLA4 is induced and CD80/CD86 binding leads to the down-regulation of T cell
Figure 2. Overview of CD28/B7-family members on APCs and T cells. MHC class I or II interaction with TCR gives rise to the first signal for T cell activation. B7 ligands on APCs bind multiple receptors on T cells which can deliver co-stimulatory or co-inhibitory signals. For some of the newly identified B7 members, the respective receptor still remains unknown (Pardoll, 2012)

6
proliferation (Suh et al, 2003). There are about 10 other B7 proteins which are structurally
related to CD80 and CD86 and can be expressed in multiple organs with non-immune function,
as well as on APCs. In this way, self-tolerance is maintained and tissues are protected from
damage when the immune system is reacting to pathogenic infection. However, expression of
both ligands or receptors might be dysregulated in tumors, which are therefore taking part in
one of the additional mechanisms of immune escape. Generally, it is expected for inhibitory
ligands or receptors which regulate T cell effector functions in tissues, to be overexpressed on
tumor cells or non-transformed cells within tumor microenvironment (Pardoll, 2012). One
important example of this case is programmed cell death ligand 1 (PD-L1), which was found
to be expressed in many immune but also cancer cells and leads to the co-inhibition of T cell
activation, and therefore impaired cytokine production as well as loss of cytotoxicity of
activated T cells (Ni i Dong, 2017). Since this thesis focuses on the function of B7 homolog 3
(B7-H3), it shall further be explained in more detail.
1.3 B7 homolog 3
B7-H3 (CD276) is an immunoregulatory proteins of the B7 family that was discovered
in 2001 (Chapoval et al, 2001). It is located on chromosome 15 in humans and chromosome 9
in mice. The gene, comprised of 10 exons, gives rise to a 316 amino acid long type I
transmembrane glycoprotein belonging to the immunoglobulin superfamily with an expected
molecular weight of 45-66 kDa. Due to exon duplication in humans it can be found in two
isoforms depending on the number of pairs of V-like and C-like immunoglobulin domains –
4IgB7H3 or 2IgB7H3, while in mice only 2Ig forms are present (Fig. 3) (Janakiram et al, 2017).
Figure 3. The structure of human and mouse B7-H3. Numbers on top represent amino acid numbers. Sig - signal peptide; IgV - V-like Ig; IgC - C-like Ig; Ts - transmembrane region; Cyto - cytoplasmic tail (adapted from Wang et al, 2014)

7
The interacting receptor on T cells still remains to be determined, as triggering receptor
expressed on myeloid cell-like transcript 2 (TLT-2, TREML2) had been described as its
costimulatory receptor in mice (Hashiguchi et al, 2008), but was not confirmed by other studies
(Leitner et al, 2009).
B7-H3 is one the most evolutionary conserved B7 family member as it is universally
expressed across various species from fish to mammals on mRNA-level (Sun et al, 2011).
Furthermore, its mRNA is widely expressed in many tissues such as heart, prostate, testis,
uterus, liver, pancreas, small intestine and colon (Chapoval et al, 2001). Low expression was
also found in brain, skeletal muscle, kidney, lung and some lymphoid organs (Chapoval et al,
2001). Its expression by immune cells such as T cells and APCs (dendritic cells, macrophages)
can be induced by phorbol 12-myristate 13-acetate (PMA) + ionomycin, interferon gamma
(IFN-γ) and granulocyte-macrophage colony stimulating factor (GM-CSF) (Chapoval et al,
2001). However, even though the B7-H3 mRNA is constitutively present, there is a tight post-
transcriptional regulation, as B7-H3 protein expression is limited and maintained at low levels.
It seems that microRNA mechanisms are involved in this regulation, as B7-H3 mRNA and
protein expression was shown to be inversely correlated with expression of miRNA-29 and
miRNA-187 (Wang et al, 2014, 2016). Still, aberrant B7-H3 protein expression has been
described in various malignancies such as melanoma, glioma, lung cancer, pancreatic cancer,
colon cancer, ovarian cancer, breast cancer and gastric cancer (Janakiram et al, 2017). In most
cases, increased protein expression of B7-H3 correlates with shorter overall survival of patients,
as well as with larger tumor size and more invasive tumor grade and was, therefore, identified
as a poor prognosis factor (Ingebrigtsen et al, 2014; Mao et al, 2015). However, in mouse
models for lymphoma and mastocystoma, B7-H3 expression was associated with favorable
clinical outcomes (Janakiram et al, 2017; Sun et al, 2010).
The immunomodulatory role of B7-H3 has been studied intensively in the past few years
leading to quite contradictory results since these studies showed both co-stimulatory and co-
inhibitory activities of B7-H3 on T cells. Additionally, B7-H3 has been shown to interact with
NK cells and inhibit their activity leading to reduced NK-mediated lysis both in vitro and in
vivo (Janakiram et al, 2017; Lee et al, 2017).
On the other hand, B7-H3 has been shown to have non-immunological roles. It promotes
osteoblast differentiation and bone mineralization (Suh et al, 2004), but it was also shown to
exhibit immune cell-independent roles in the context of cancer progression. It was shown to
induce expression of matrix-metalloproteinase (MMP) 9 trough Janus kinase 2 and signal
8
transducer and activator of transcription 3 (Jak2/Stat3) in CRC cell lines (Liu et al, 2015) and
also showed positive correlation with MMP-2 (Jiang et al, 2016), suggesting pro-migratory and
pro-invasive roles for B7-H3. Furthermore, it was demonstrated that B7-H3 down-regulates the
expression of E-cadherin and β-catenin, and up-regulates N-cadherin and vimentin in CRC at
the same time. This would suggest its involvement in epithelial-to-mesenchymal transition and
consequently cancer cell invasion, migration and metastasis formation (Jiang et al, 2016). B7-
H3 also promotes the Warburg effect by increasing protein levels of Hypoxia-inducible factor
1-alpha (HIF1-α) and key enzymes of glycolytic pathway (lactate dehydrogenase A - LDHA,
pyruvate dehydrogenase kinase 1 - PDK1) (Lim et al, 2016) indicating functions of B7-H3 that
might be independent of its role in shaping the immune system’s response. Furthermore, recent
data showed nuclear localization of B7-H3 in cancer cells, hinting for cell-intrinsic roles for
B7-H3 in the absence of an immune compartment (Ingebrigtsen et al, 2012). However, little is
known about immune cell-independent roles of B7-H3.
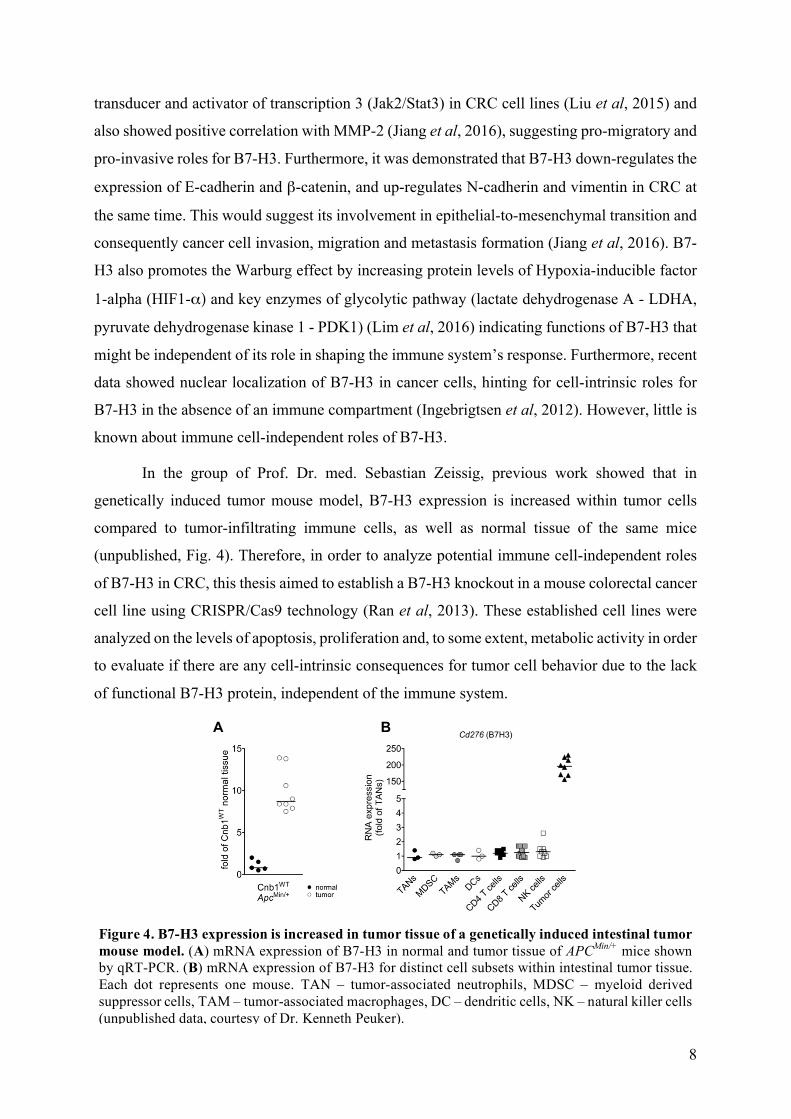
In the group of Prof. Dr. med. Sebastian Zeissig, previous work showed that in
genetically induced tumor mouse model, B7-H3 expression is increased within tumor cells
compared to tumor-infiltrating immune cells, as well as normal tissue of the same mice
(unpublished, Fig. 4). Therefore, in order to analyze potential immune cell-independent roles
of B7-H3 in CRC, this thesis aimed to establish a B7-H3 knockout in a mouse colorectal cancer
cell line using CRISPR/Cas9 technology (Ran et al, 2013). These established cell lines were
analyzed on the levels of apoptosis, proliferation and, to some extent, metabolic activity in order
to evaluate if there are any cell-intrinsic consequences for tumor cell behavior due to the lack
of functional B7-H3 protein, independent of the immune system.
A B
Figure 4. B7-H3 expression is increased in tumor tissue of a genetically induced intestinal tumor mouse model. (A) mRNA expression of B7-H3 in normal and tumor tissue of APCMin/+ mice shown by qRT-PCR. (B) mRNA expression of B7-H3 for distinct cell subsets within intestinal tumor tissue. Each dot represents one mouse. TAN – tumor-associated neutrophils, MDSC – myeloid derived suppressor cells, TAM – tumor-associated macrophages, DC – dendritic cells, NK – natural killer cells (unpublished data, courtesy of Dr. Kenneth Peuker).

9
2 METHODS
2.1 Molecular methods
2.1.1 Generation of PX458-gB7-H3 plasmid for targeting Cd276 gene
For targeting the Cd276 gene (Gene ID: 102657; ncbi.nlm.nih.gov 2017) in murine
CMT-93 CRC cells, a pair of DNA oligonucleotides coding for gRNA was designed using the
design wizard provided online (Benchling.com, 2017). gRNA targeting exon 3 was chosen
depending on its reasonably high on-target score and very good off-target score to minimize
off-targeting (Table 1).
Table 1. Oligonucleotide sequences and their on- and off-target scores. Four base pairs (marked in red) had to be added accordingly, in order to ligate the insert into the reading frame of the plasmid. gRNA Sequence (5’ à 3’) On-target Off-target
gRNA (F) CACCGCGCGTCCGAGTAACCGACGA
71.4 98.8 (R) AAACTCGTCGGTTACTCGGACGCGC
For genome targeting, the mentioned DNA oligonucleotide pair coding for gRNA was
cloned into the pSpCas9(BB)-2A-GFP (PX458) plasmid, obtained from Addgene (Addgene
plasmid #48138, Appendix A). The plasmid expresses the Cas9 nuclease and gRNA
simultaneously, allowing precise gene modifications upon binding of Cas9 to the target
sequence. Therefore, PX458 was digested with Fast Digest BpsI (Thermo Fischer Scientific) in
1x FastDigest Buffer (Thermo Scientific) at 37 °C overnight, and later dephosphorylated with
Fast AP (Thermo Fisher Scientific) at 37 °C for 10 minutes. Afterwards, the digested plasmid
was size fractioned by agarose gel electrophoresis and later purified from the gel using the
PureLink Quick Gel Extraction Kit (Invitrogen). Thus, gel slices were dissolved in “Buffer L3”
at 50 °C and then loaded onto a DNA-binding column. DNA was bound to the column by
centrifugation at 13 000 g for 1 minute. Flow through was discarded and column was washed
with “Wash Buffer”. “Elution Buffer” was added to the column and incubated for 1 minute at
room temperature. Finally, plasmid DNA was collected by centrifugation at 13 000 g for 1
minute. Final concentration was determined using Nanodrop 2000 (Thermo Scientific).
Additionally, the oligonucleotides (Eurofins Genomics) were phosphorylated with T4
PNK (Thermo Fisher Scientific) and annealed using the following protocol: 37 °C for 30
minutes, 95 °C for 5 minutes, ramp down to 25 °C by 0,1 °C/s. The duplexes were ligated into

10
a linearized PX458 with T4 DNA Ligase (Thermo Fisher Scientific) at 17 °C overnight and
afterwards heat-inactivated at 65 °C for 10 minutes.
The ligated plasmids were transformed into chemically competent Echerichia coli (E.
coli) strain Stbl3 (Thermo Fisher Scientific) via heat-shock. Stbl3 were thawed on ice, 5 µl of
the ligation mix was added to the bacteria, followed by incubation on ice for 30 minutes, heat-
shock (42 oC) for 30 seconds, cooling down on ice for 2 minutes and then incubated in 250 µl
LB medium at 37 oC for 1 hour with shaking Finally, bacteria were spread onto Luria-Bertani
(LB) plates with ampicillin (Amp+, 100 ng /ml) and incubated overnight at 37 °C.
Next day, single bacterial colonies were picked with sterile pipette tips and transferred
into round-bottom tubes in 5 ml of LB Amp+ medium (100 µg /ml), and incubated overnight
at 37 °C with shaking. After approximately 18 hours, plasmid DNA was isolated using the
Thermo Scientific GeneJET Plasmid Miniprep Kit. Bacterial cultures were harvested by
centrifugation at 8000 rpm for 2 minutes. Pellet was resuspended in “Resuspension Solution”,
cells were lysed by addition of “Lysis Buffer”, followed by “Neutralization Buffer” and
centrifugation at 12 000 g. Supernatant was transferred to a DNA-binding column and DNA
was bound to it by centrifugation at 12 000 g for 1 minute. Column was washed twice with
“Wash Solution”, and afterwards membrane was dried by centrifugation at 12 000 g for 2
minutes. “Elution Buffer” was added to the membrane and incubated for 2 minutes at room
temperature. Plasmids were collected by centrifugation at 12 000 g for 2 minutes. Finally,
plasmids were sent for sequencing (GATC Sanger sequencing) (Table 7) and later analyzed by
ApE (M. Wayne Davis).
Validated plasmids were again transformed into Stbl3 as described and propagated on
a larger scale via Maxiprep (Qiagen EndoFree Plasmid Maxi Kit). Bacterial cultures (250 ml)
were harvested by centrifugation at 6000 g for 15 minutes at 4 °C, Pellet was resuspended in
“Buffer P1”. Cells were lysed by addition of “Buffer P2” and incubation at room temperature
for 5 minutes. Lysis was stopped by addition of chilled “Buffer P3”. Lysate was filtered and
“Buffer ER” was added to the filtrate, which was then incubated on ice for 30 minutes. Filtered
lysate was applied to a column, which was later washed twice with “Buffer QC”. DNA was
eluted with “Buffer QN” and precipitated by addition of isopropanol and centrifugation at 15
000 g for 30 minutes at 4 °C. Pellet was washed with 70% ethanol at 15 000 g for 10 minutes,
air dried, redissolved in “Buffer TE” and stored at -20 °C for further use.

11
2.1.2 Genotyping by polymerase chain reaction (PCR)
Whole cell DNA of CMT-93 cells transfected with control vector or vector containing
gRNA-coding sequence (PX458-gB7-H3; vector map in the appendix) was isolated by addition
of 50 mM NaOH and boiling for 30 minutes at 100 °C, with a final addition of 10 µl of 1 M
Tris/HCl (pH 8). PCR genotyping was done using the primers listed in Table 7 and set up
according to Table 2 and Table 3.
Table 2. PCR genotyping reaction mix.
Reagent
µl per
reaction
Final
concentration
5x OneTaq Buffer (NEBioLabs) 5 1x
dNTP mix (10 mM) 0.5 200 µM
Forward primer 0.1 0.2 µM
Reverse primer 0.1 0.2 µM
OneTaq Polymerase (NEBioLabs) 0.125 1.25 U/50 µl
Nuclease-free water 17.675 NA
DNA 1.5 < 1000 ng
Total volume 25
Table 3. PCR genotyping amplification protocol. Step Temperature Time
Initial denaturation 94 °C 30 sec
Denaturation 94 °C 30 sec
Annealing 56 °C 30 sec 35 cycles
Elongation 68 °C 1 min
Final elongation 68 °C 5 min
Hold 4 °C ∞
PCRs from all clones were first analyzed on a QIAxcel fragment analyzer and the clones
which showed a different size than the expected 252 (Cd276 (B7H3)_1) or 934 base pairs
(Cd276 (B7-H3)_2) were further size fractioned on an agarose gel. Fragments of interest were
isolated from the gel using the NucleoSpin Gel and PCR Clean-up kit (Macherey-Nagel). Thus,
“Buffer NTI” was added to gel slices and incubated at 50 °C until dissolved. Samples were
loaded onato a DNA binding column and centrifuged at 11 000 g for 1 minute. Column was

12
washed twice with “Buffer NT3”, and membrane was dried by centrifugation at 11 000 g for 1
minute. “Elution Buffer” was heated to 70 °C and added to the column which was then
incubated for 5 minutes at 70 °C. PCR fragments were collected by centrifugation at 11 000 g
for 1 minute. Isolated PCR fragments were sent for sequencing in order to check for potential
mutations. Mutations were discovered by alignment of the obtained sequence to the known
sequence of Cd276 using ApE.
2.1.3 cDNA sythesis and real time PCR
Whole cell mRNA was isolated using the PeqGold Total RNA Kit (VWR, peqlab).
Culture medium was aspirated completely and “RNA Lysis Buffer T” was added. Cells were
scraped to aid cell lysis. Lysate was transferred into a DNA-removing column and centrifuged
at 12 000 g for 1 minute at room temperature. Equal volume of 70% ethanol was added to the
flow through, which was then transferred into a RNA-binding column. RNA was bound by
centrifugation at 10 000 g for 1 minute. Column was washed with “RNA Wash Buffer I” and
“RNA Wash Buffer II” and membrane was dried by centrifugation at 10 000 g for 2 minutes.
RNA was eluted in RNase free H2O. cDNA was synthesized using the High-capacity cDNA
Reverse Transcription kit (Thermo Fisher Scientific) according to Tables 4 and 5. Real time
PCR was performed using SYBR Green (Thermo Fisher Scientific), primers (Table 7) and the
appropriate protocol (Table 6) on the real time PCR machine Stratagene MX 3005P. Relative
gene expression was calculated from Ct values using the ΔΔCt method (Livak and Schmittgen,
2001).
Table 4. cDNA synthesis reaction mix
Reagent
µl per
reaction
10x RT Buffer 2
25x dNTP mix (100 mM) 0.8
10x Random primers 2
Reverse Transcription (RT) Polymerase 1
RNase inhibitor 1
Nuclease free-water 3.2
RNA 10
Total volume 20
13
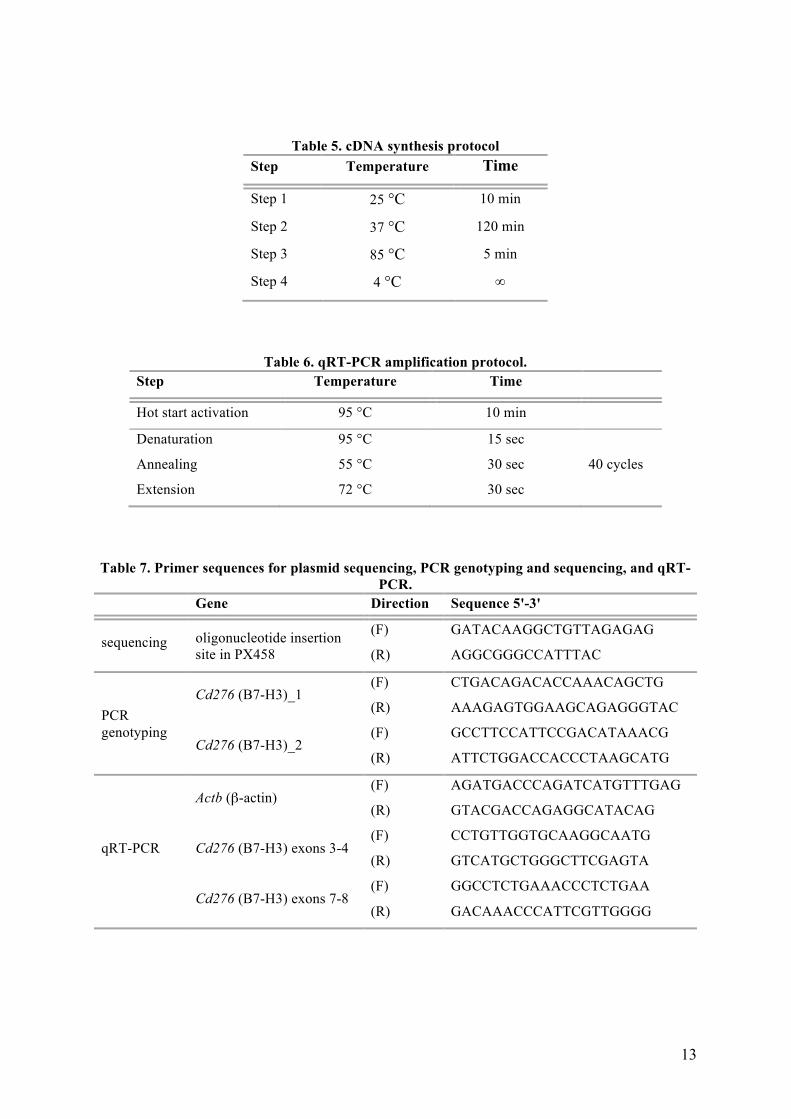
Table 5. cDNA synthesis protocol Step Temperature Time
Step 1 25 °C 10 min
Step 2 37 °C 120 min
Step 3 85 °C 5 min
Step 4 4 °C ∞
Table 6. qRT-PCR amplification protocol. Step Temperature Time
Hot start activation 95 °C 10 min
Denaturation 95 °C 15 sec
Annealing 55 °C 30 sec 40 cycles
Extension 72 °C 30 sec
Table 7. Primer sequences for plasmid sequencing, PCR genotyping and sequencing, and qRT-PCR.
Gene Direction Sequence 5'-3'
sequencing oligonucleotide insertion site in PX458
(F) GATACAAGGCTGTTAGAGAG
(R) AGGCGGGCCATTTAC
Cd276 (B7-H3)_1
(F) CTGACAGACACCAAACAGCTG
PCR genotyping
(R) AAAGAGTGGAAGCAGAGGGTAC
Cd276 (B7-H3)_2 (F) GCCTTCCATTCCGACATAAACG
(R) ATTCTGGACCACCCTAAGCATG
Actb (β-actin)
(F) AGATGACCCAGATCATGTTTGAG
(R) GTACGACCAGAGGCATACAG
qRT-PCR Cd276 (B7-H3) exons 3-4 (F) CCTGTTGGTGCAAGGCAATG
(R) GTCATGCTGGGCTTCGAGTA
Cd276 (B7-H3) exons 7-8
(F) GGCCTCTGAAACCCTCTGAA
(R) GACAAACCCATTCGTTGGGG

14
2.2 Cell Culture
2.2.1 General conditions
For this research mouse colorectal carcinoma cell line CMT-93 was used. These cells
have epithelial morphology and grow in clumps as an adherent culture.
If not stated differently, cells were grown in Dulbecco's Modified Eagle Medium
(DMEM, Gibco) with 10% fetal bovine serum (FBS, BiochromAG/MerksMillipore), 1% L-
glutamine (BiochromAG/MerksMillipore) and 1% penicillin/streptomycin (P/S,
BiochromAG/MerksMillipore) at 37 °C with 5% CO2. Upon splitting or experimental use, cells
were incubated with trypsin until detached at 37 °C. The reaction was stopped using pre-
warmed medium and cells were further handled as needed. For freezing, cells were trypsinized,
centrifuged (1 400 rpm, 4 °C, 5 minutes) and the supernatant was removed. Cells were
resuspended in 10% dimethyl sufoxide (DMSO, Sigma Aldrich) in FBS and frozen to -80 °C
instantly.
2.2.2 Transfection and single cell sort
3x10⁵ CMT-93 cells per well were seeded in 6-well plates 24 hours prior to transfection.
Cells were transfected using 1 µg of the generated plasmid, or PX458 as a control and
appropriate amount of Lipofectamine 2000 (Thermo Fisher Scientific). Six hours post-
transfection, cells were washed with 1x Dulbecco's phosphate-buffered saline (D-PBS), new
media was added, and cells were grown for an additional 48 hours before the single cell sort.
The transfected CMT-93 cells were trypsinized, washed with 1x D-PBS, centrifuged at
1400 rpm and 4 °C for 5 minutes, and resuspended in FACS buffer (1x D-PBS + 10% FBS).
Prior to sorting, 7-aminoactionmycin D (7-AAD, BD Bioscience) viability dye was added to
the cells. Cells positive for GFP and negative for 7-AAD were sorted using FACS Aria III (BD
Bioscience) into flat bottomed 96-well plates containing DMEM with 20% FBS, 2% P/S, 1%
L-glutamine per well and grown until confluency. Afterwards, cells were seeded into bigger
wells and medium was changed to regular type when clones reached 12-well plate.
2.3 Biochemical methods
2.3.1 Protein recovery
Cells were lysed with 1x radioimmunoprecipitation assay (RIPA) buffer (50 mM Tris-
HCl, pH 7.4, 150 mM NaCl, 5 mM EDTA, 1% Igepal, 0.5% sodium desoxycholat, 0.1% SDS),

15
incubated by shaking at 4 °C for 1 hour and subsequently centrifuged at 13 000 g for 5 minutes.
The supernatant was used for further analysis.
Total protein concentration was determined with Bio-Rad Protein Assay Dye Reagent
Concentrate by mixing standards or diluted samples (1:30) with diluted concentrate (1:5).
Absorbance was measured at 595 nm on FlexStation 3 microplate reader (Molecular Devices).
2.3.2 Protein deglycosylation
Prior to B7-H3 protein analysis via Western blotting, supernatants were treated with
Protein-N-glycosidase F (PNGase F, Roche). First, the amounts of buffers 1 and 2 needed for
reaction were calculated according to the formula:
𝑦 = 28 − 𝑥
𝑉(𝑏𝑢𝑓𝑓𝑒𝑟 1) = 1/2 𝑦
𝑉(𝑏𝑢𝑓𝑓𝑒𝑟 2) = 1/2 𝑦
For the reaction, protein extracts of each sample were mixed with the respective amount
of buffer 1 (50 mM Na3PO4, 1% SDS, 1% β-mercaptoethanol, 1x complete proteinase inhibitor,
pH 7.8), and the mix was incubated for 5 minutes at 95 °C with shaking. After incubation, each
mix was left to cool down partially, buffer 2 (50 mM Na3PO4, 1% NP-40, 1x complete
proteinase inhibitor, pH 7.5) was added and left to cool down to room temperature. Finally, 2
µl of PNGase was added and samples were shaken at 37 °C overnight. Subsequently, for SDS-
PAGE, samples were mixed with 5x Laemmli buffer with DTT (16 µl per 40 µg of protein) and
H2O (4 µl per 40µg of protein), incubated in the thermomixer at 60 °C for 20 minutes and
subjected to Western blotting as described in 2.3.3.
2.3.3 Western blot
Prior to sodium dodecyl sulfate-polyacrylamide gel electrophoresis (SDS-PAGE) 20 µg
of protein was diluted in total volume of 16 ml 1x RIPA buffer with 4 ml of 5x Laemmli buffer
with DTT and cooked for 5 minutes at 95 °C (if not stated differently). Samples were loaded
on a SDS-PAGE gel composed of stacking and running gels of relevant concentrations (Table
8). 40 µl aliquots were loaded to the gel, stacked at 80 V until protein ladder started to separate,
where x is the volume of protein extract needed for 40 µg of protein to be used for analysis in Western blot.

16
and then separated at 110 V until finished. The gel was blotted on the methanol-activated
polyvinylidene difluoride (PVDF) membrane (Roth) using Trans-Blot Turbo™ Transfer
System (Bio-Rad) and semi-dry blotting program (45 minutes, 1.0 A, 25 V). The blots were
blocked in 5% skim milk in TBS-T (50 mM Tris/HCl, pH 7.6; 150 mM NaCl; 1% Tween 50)
for 1 hour at room temperature and then incubated overnight at 4 °C in appropriate primary
antibodies diluted in 5% skim milk in TBS-T (Table 9).
On the following day, membranes were transferred into corresponding secondary
antibodies (Table 9) in 5% skim milk/TBS-T and incubated for 1 hour at room temperature.
Finally, membranes were incubated for 5 minutes in 1:1 solution of Clarity™ Western ECL
Blotting Substrate (Bio-Rad) and then visualized chemiluminilescently using ImageQuant™
LAS 4000 (GE Healthcare).
Table 8. Formulation of 1 X Running and Stacking gels used for SDS-PAGE. Running gel Stacking gel
7.5% 12.5% 4%
dH2O (ml) 4.5 3.5 2.48
Running Gel Buffer (ml) 2 2 -
Stacking Gel Buffer (ml) - - 0.9
40% PAA (ml) 1.5 2.5 0.38
TEMED (µl) 10 10 4.5
10% APS (µl) 40 40 12
Table 9. Primary and secondary antibodies used for Western blotting. Antibody Dilution Source Company
Primary antibodies
Mouse anti-β-actin 1:2000 rabbit Sigma Aldrich
Human anti-B7-H3 1:200 goat R&D Systems
Mouse anti-PARP 1:2000 rabbit Cell Signaling
Mouse anti-caspase 3 1:2000 rabbit Cell Signaling
Secondary antibodies
HRP-conjugated anti-rabbit IgG 1:1000 goat NEBioLabs
HRP-conjugated anti-goat IgG 1:2000 donkey Santa Cruz Biotechnology

17
2.3.4 Immunofluorescence staining
300,000 cells were seeded onto 12 mm round coverslips. On the next day, cells were
washed, and then fixated for 30 minutes in cold 4% paraformaldehyde in 1x D-PBS at 4 °C.
After fixation, cells were permeabilized first with 0.02% saponin in 1x D-PBS (5 minutes), and
then with 0.02% saponin and 0.2% glycin in 1x D-PBS (10 minutes). Subsequently, cells were
blocked with 0.02% saponin and 10% FBS in 1x D-PBS for 30 minutes and incubated in a
humid chamber with primary goat anti-B7H3 antibody (1:40 in blocking buffer, R&D Systems)
at 4 °C overnight. On the following day, cover slips were incubated in the secondary donkey
anti-goat antibody conjugated with Alexa Flour® 488 (1:1000 in blocking buffer, Invitrogen)
and DAPI (1:1000 in blocking buffer, Sigma Aldrich) for 1 hour at room temperature, mounted
on slides with FluorSave (MerckMillipore) and kept at 4 °C in the dark. Images were taken
using Zeiss’ Axiovert 200M inverted microscope, and analyzed via ImageJ.
2.4 Functional in vitro assays
2.4.1 BrDU assay
500 000 cells per well were seeded in a 6-well plate. On the next day, 10 µl of 1 mM
BrDU solution (BD Biosciences BrDU Flow kit) per ml of medium was added to each well,
and cells were incubated at 37 °C for 45 minutes. After incubation, cells were trypsinized,
centrifuged and washed with 1x D-PBS. Between each step cells were washed with 1x “BD
Perm/Wash Buffer”.
After centrifugation, supernatant was removed, as well as in all the following washing
steps. Cells were then resuspended in 100 µl of “BD Cytofix/Cytoperm Buffer”, incubated on
ice for 30 minutes, and afterwards washed with 1 ml of 1x “BD Perm/Wash Buffer”. Next, cells
were resuspended in 100 µl of “BD Cytoperm Permeabilization Buffer plus”, incubated on ice
for 10 minutes and again washed with 1 ml of 1x “BD Perm/Wash Buffer”. Cells were re-fixed
with 100 µl “BD Cytofix/Cytoperm Buffer” 5 minutes on ice, following with the 1x “BD
Perm/Wash Buffer” washing step. Subsequently, cells were resuspended in 100 µl of the DNase
working solution (300 µg/ml) and incubated at 37 °C for 1 hour. Cells were incubated with
FITC anti-BrDU antibody in 1x “BD Perm/Wash Buffer” for 20 minutes at room temperature
in the dark and then with 7-AAD solution for 20 minutes on ice in the dark. Cells were
resuspended in staining buffer (1x D-PBS with 1% FBS) and acquired on flow cytometer (BD
LSR II) using a low flow rate (<400 events/second). Finally, data was acquired using FlowJo.

18
2.4.2 Growth assay
7 500 cells per well were seeded in triplicates in a 12-well plate for 8 different time
points. Starting from day 2, wells for each condition were collected and counted on 8
consecutive days using the hemocytometer.
2.4.3 MTT assay
1 500 cells per well were seeded in triplicates in a 96-well plate for 7 different time
points. For each time point, wells with only culture medium served as a blank. The first reading
was acquired 5 hours after cells were seeded to allow adherence. This reading was defined as
time point zero and would be subtracted for all subsequent readings in order to normalize the
actual number of seeded cells. For each time point, through 7 consecutive days, with a final
concentration of 10%, MTT solution (Cell Growth Determination Kit, MTT based, Sigma
Aldrich) was aseptically added to each well and incubated for 3 hours. After incubation period,
the medium was removed and MTT solvent was added in an amount equal to original culture
volume. Fluid was pipetted up and down to dissolve the crystals and absorbance was measured
at 570 nm and 690 nm with FlexStation 3 microplate reader. For data analysis, 690 nm readings
were subtracted from 570 nm reading well by well. The results were then divided by the average
zero time point reading for each well to normalize for starting cell numbers. Finally, absorbance
values were displayed as a percentage of day zero.
2.4.4 Cell death analysis
300 000 cells per well were seeded in a 12-well plate. On the next day, cells were treated
with 1 µM staurosporine (Sigma Aldrich) or DMSO (1:1000) as a vehicle control and incubated
at 37 °C for 2.5 hours. Treated cells were either used for Western blot (PARP, Caspase 3), as
previously described, or stained with Annexin V and subsequently analyzed by flow cytometry.
Prior to Annexin V staining, cells were trypsinized, centrifuged, washed and
resuspended in Annexin V binding buffer. Cells were stained with Annexin V-APC antibody
(Biolegend) and 7-AAD according to manufacturer’s instructions and analyzed on flow
cytometer (BD LSR II), and finally FlowJo.
2.5 Statistics
For multiple testing one-way analysis of variance (ANOVA), followed by Dunnett’s
test and two-tailed t-test were performed and mean ± standard error of the mean was plotted.

19
3 RESULTS
3.1 Generation of B7-H3 knockout clones
The aim of this thesis was to analyze possible cell-autonomous roles of B7-H3 in the
mouse colorectal cancer cell line CMT-93. I used the CRISPR/Cas9 technology (Ran et al,
2013) to abolish B7-H3 expression in CMT-93 cells. First, CMT-93 cells were transfected with
either empty vector or the CRISPR plasmid containing coding sequence of gRNA targeting the
B7-H3 gene. The transfected cells were single cell sorted via flow cytometry for green
fluorescent protein (GFP) expression of the transfected plasmid, leading to 288 control clones
and 480 targeted single cell clones.
Out of all sorted control cells, 10 grew further and were analyzed via PCR as a control
for the targeted clones. For targeted cells, initially 53 clones grew further after sorting.
However, only 27 clones survived and were screened for mutations in the Cd276 (B7-H3) gene
via PCR.
Out of those 27 clones, a total of 16 clones showed aberrant fragment lengths of the
PCR products after size fractionation (Fig. 5). 11 clones showed multiple fragments including
the wild type allele, indicating heterozygosity of Cd276 mutations in these clones. Four clones
had fragments which were clearly distinguishable from the wild type clones. However, one
clone (4C11) showed no fragments at all, indicating that the introduced mutation might have
been considerably different in size than initially expected. Therefore, the PCR was repeated
with primers producing a longer (934 bp long) amplicon. In this case, a fragment was detected
(Appendix B) indicating that the introduced mutation in this specific clone was a deletion longer
than 252 base pairs. All clones which showed a clearly different (potentially homozygous) band
pattern compared to the control cells in the PCR were sequenced to analyze the amplified gene
sequences and predict a possible loss of protein expression due to frameshift mutations.
From the 5 sequenced clones, all showed a mutation in the targeted region and 3 out of
5 (4D6, 4H12, 6B6) had a mutation predicted to lead to a frameshift and, consequently, a
premature stop codon (Tab. 10). For clone 4C11, the protein size could not be predicted as the
mRNA splice site was lost due to the deletion.

20
Table 10. Overview of the clones carrying B7-H3 mutations. Length of mutation for each clone and the predicted protein size. Protein size was predicted according to the coding sequences and their respective changes via Benchling.com. All sequences can be found in Appendix C.
Clone name Mutation Predicted protein size (AA)
4C11 324 bp deletion NA
4D6 32 bp deletion 119
4E8 27 bp insertion 325
4H12 109 bp insertion 166
6B6 7 bp deletion 122
Figure 5. Mutations in the Cd276 (B7-H3) gene after transfection and single cell sort. PCR of possible mutation sites in single cell sorted CMT-93 cells after transfection with empty vector or vector containing gRNA-coding sequence to target the B7-H3 gene. Untransfected CMT-93 cells were used as a control, and water as a negative control (NC). Clones 1C11, 1D7, 2A8 and 2D3 represent individual empty vector clones whose expected band size (approx. 252 bp) is the same as the untransfected control. Potential knock-out clones are 4C11, 4D6, 4H12, 6B6 and 4E8.

21
3.2 Mutated clones are deficient in B7-H3
After discovering 4 clones with a potential loss-of-function mutation in B7-H3 (4C11,
4D6, 4H12 and 6B6), qRT-PCR and Western blots were performed to confirm that these clones
had lost B7-H3 expression. First, mRNA levels were analyzed via qRT-PCRs (Fig. 6A, 6B).
To this end, two primer sets were used. One set binds around the mutation site to confirm a
possible reduction in the mRNA levels, and the second primer pair binds farther from the
mutation site, toward the 3’-end of B7-H3 mRNA in order to ensure that a negative result is not
obtained due to a lack of primer binding. As controls, the clones 1C11, 1D7, 2A8, 2D3, which
were transfected with an empty vector, were used in all further experiments (Fig. 5).
The mutated clones showed a reduction in B7-H3 mRNA levels regardless of the primer
pair used (Fig. 6A, 6B). However, the differences in expression were only significant when
primers for the targeted site were used. To confirm these results, B7-H3 expression was
analyzed on protein level by Western blot (Fig. 6C). Since B7-H3 is heavily glycosylated,
protein samples were treated with protein-N-glycosidase F (PNGase F) to be able to analyze
B7-H3 expression as a single band. The Western blot confirmed a band corresponding to B7-
H3 at about 40 kDa which was only visible in cell lysates derived from either untransfected or
control transfected cells. Hence, the introduced mutations in the Cd276 gene led to a loss of
B7-H3 expression in all 4 mutant clones (Fig. 6C).
In order to further confirm findings from Western blot results, cells were immunofluorescently
stained for B7-H3 (Fig. 7). In general, B7-H3 protein is present at moderate levels, and located
mostly in the cytoplasm. However, a complete lack of B7-H3 protein was observed in mutant
clones with no immunofluorescence signal compared to the control samples (Fig. 7). In
conclusion, successful deletion of B7-H3 in the colorectal cancer cell line CMT-93 was
achieved via the CRISPR/Cas9 system as documented by qRT-PCR, Western blot and
immunofluorescence staining.

22
A B
C
Figure 6. B7-H3 deficiency induced in CMT-93 cells via the CRISPR/Cas9 system. (A-C) Expression of B7-H3 shown by qRT-PCR (A-B) and Western blot (C). qRT-PCR was performed with two different primer pairs either binding around the mutation site (A) or at the 3’-end of the mRNA (B). As a control, vector transfected clones were used. Multiple testing was done using one-way ANOVA, followed by two-tailed unpaired t-test. (C) Representative Western blot from cell lysates derived from CMT-93 cells either untransfected, transfected with control vector or transfected with vector inducing a knockout of B7-H3. Primary antibody: anti-B7-H3, anti-β-actin. All results shown are representative of the two independent experiments.

23
Figure 7. B7-H3 expression is lost in mutant clones. Immunofluorescence staining for B7-H3 (green) in CMT-93 cells transfected either with control vector (left) or a plasmid inducing a knock-out for B7-H3 (middle and right). Representative images are shown. DAPI is shown in blue. Scale bar represents 50 µm.
3.3 Cell death is not altered by B7-H3 deletion
After obtaining clones deficient for B7-H3, we wanted to analyze if there are any cell-
autonomous roles for B7-H3 in CRC cells. Therefore, clones deficient for B7-H3 were tested
for changes in apoptosis by staining for extracellularly exposed phosphatidylserine using
Annexin V and evaluating the levels of cleaved caspase-3 and PARP. As a control, samples
were also treated with staurosporine to induce apoptosis.
First, we tested the effect of B7-H3 on apoptosis via Annexin V staining. As seen in
Fig. 8A, upon treatment with staurosporine, the percentage of apoptotic cells increased,
indicating that the staurosporine treatment was effective. Nevertheless, regardless of the
staurosporine treatment, no difference in the percentage of apoptotic cells was noticed between
wild-type and B7-H3-deleted clones. Although a strong heterogeneity in apoptosis rates
between the different knock-out clones could be detected (Fig. 8A), this heterogeneity did not
correlate with residual B7-H3 expression (Fig. 6C).
In addition, the clones were also tested for protein levels of PARP and cleaved caspase-
3 as additional markers for apoptosis (Fig. 8B). Caspase-3 was expected at around 33 kDa,
while its cleaved form has a size of about 19 kDa. While no cleaved caspase-3 was observed in
control settings, the cleaved form of caspase-3 was detected upon staurosporine treatment,
indicating that the staurosporine treatment was effective. Nevertheless, similar amounts of
cleaved caspase-3 were detected in control compared to B7-H3-deficient cells. On the other
hand, PARP Western blots were not successful, and are, therefore, not shown.

24
3.4 Cell proliferation is not significantly affected by loss of B7-H3 expression
After cell death analysis, I aimed to analyze if B7-H3 influences cellular proliferation
in a cell-autonomous manner. To do so, levels of bromodeoxyuridine (BrDU) incorporation,
cell growth assays as well as 3-(4,5-dimethylthiazol-2-yl)-2,5-diphenyltetrazolium bromide
(MTT) assays were carried out. As seen in Figure 9, no consistent difference in cellular
proliferation was noticed in three independent analyses for proliferation between control and
Figure 8. B7-H3 deficiency does not influence apoptosis. (A) Annexin V staining by FACS. Multiple testing was done using one-way ANOVA, followed by two-tailed unpaired t-test. (B) Western blot for caspase-3 and β-actin as a loading control. Primary antibodies: anti-caspase 3, anti-β-actin. CMT-93 cells were treated either with vehicle or staurosporine (1 µM) for 2.5 hours (A-B). Vector transfected cells served as negative controls.
A
B

25
B7-H3-deficient clones. Specifically, no difference between wild-type and knockout clones was
found in cell cycle analysis (Fig. 9A). In addition, no significant variation in cell proliferation
over time (Fig. 9B) or cell metabolism in terms of mitochondrial activity tested with MTT (Fig.
9C) was found. Although some B7-H3-deficient clones showed slight differences in
proliferation rates, these alterations were not consistent among the different knockout clones
and among the different experiments carried out, so no role for B7-H3 in the regulation of cell
proliferation was observed.
26
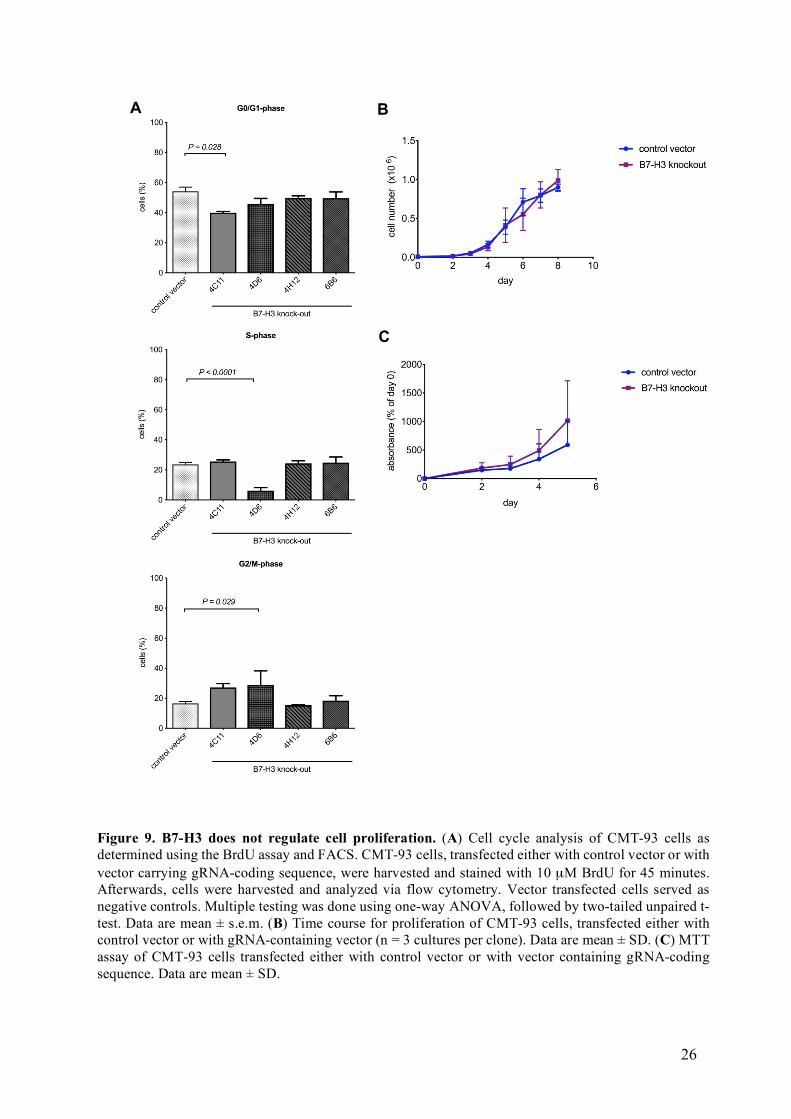
Figure 9. B7-H3 does not regulate cell proliferation. (A) Cell cycle analysis of CMT-93 cells as determined using the BrdU assay and FACS. CMT-93 cells, transfected either with control vector or with vector carrying gRNA-coding sequence, were harvested and stained with 10 µM BrdU for 45 minutes. Afterwards, cells were harvested and analyzed via flow cytometry. Vector transfected cells served as negative controls. Multiple testing was done using one-way ANOVA, followed by two-tailed unpaired t-test. Data are mean ± s.e.m. (B) Time course for proliferation of CMT-93 cells, transfected either with control vector or with gRNA-containing vector (n = 3 cultures per clone). Data are mean ± SD. (C) MTT assay of CMT-93 cells transfected either with control vector or with vector containing gRNA-coding sequence. Data are mean ± SD.
C
B A

27
4 DISCUSSION
4.1 Use of CRISPR/Cas9 system to generate B7-H3 knockout clones
The aim of this thesis was to analyze potential cell-autonomous roles of B7-H3 in a
CRC cell line. To this end, the CRISPR/Cas9 system was used to generate different knockout
clones. I was able to obtain several B7-H3 mutant clones carrying various mutations in B7-H3
that were associated with a frameshift mutation and consequently a premature stop codon.
Additionally, clone 4C11 showed a complete loss of the mRNA splice site between exon 3 and
4, which leads to a defect in mRNA splicing. When analyzing the residual expression of B7-
H3 in these mutants, they showed reduced levels of B7-H3 mRNA. However, discrepancy in
B7-H3 mRNA expression was evident upon testing with two sets of primers. Higher reduction
observed using primers amplifying the targeted site could be attributed to the proximity of the
mutated site, as the DNA integrity and stability might be disrupted due to the introduced
mutations. On the contrary, primers amplifying the 3’-end of the mRNA sequence for B7-H3
showed that the mutant mRNA is still transcribed, although at lower levels, indicating that a
small portion of all produced B7-H3 mRNA might be degraded. Nevertheless, since some
mRNA of the Cd276 gene still seemed to be transcribed, it was necessary to analyze B7-H3
protein levels in mutant clones via Western blotting and immunofluorescence staining. Western
blot analysis showed only bands at about 40 kDa in the control samples while all mutant clones
did not show any expression of B7-H3. This was confirmed by immunofluorescence, which
also showed no B7-H3 staining in mutant clones. Taken together, these results imply that all
detected mutations lead to a degradation of B7-H3 protein after mRNA translation and that the
observed loss of protein is indeed due to premature stop codons or, in case of 4C11, complete
change of mRNA composition due to the loss of the mRNA splice site between exons 3 and 4.
Therefore, in all mutant clones analyzed, a loss-of-function of B7-H3 was induced.
Via immunofluorescence staining, the intracellular localization of B7-H3 could also be
analyzed in CMT-93 cells. In several publications, B7-H3 was shown to be located on the
membrane, as well as in the cytoplasm and nucleus (Ingebrigtsen et al, 2012, 2014; Janakiram
et al, 2017). However, my data (Fig. 8) showed no nuclear localization for B7-H3 protein, but
rather cytoplasmic localization. Additionally, parallel work by Liz Matthiesen in our lab on
CMT-93 cells transiently overexpressing B7-H3 also showed that B7-H3 can be found at the
membrane, in the cytoplasm and potentially in lysosomes (data not published). Lack of nuclear
localization in CMT-93 cells might be attributed to the fact that nuclear B7-H3 was mainly

28
reported in human malignancies or in vivo CRC models, where B7-H3 could interact with other
immune cells (Ingebrigtsen et al, 2012, 2014). Furthermore, the cytoplasmic tails of mouse and
human B7-H3 have minor differences which might be responsible for different intracellular
signaling or localization (Uniprot.org 2017).
4.2 Loss of B7-H3 does not influence apoptosis or proliferation in CMT-93
We set out to analyze the potential role of B7-H3 in regulating cell apoptosis and
proliferation in a cell-intrinsic manner. In neither case, we were able to notice any consistent
effect of deletion of B7-H3.
In all cases, among wild-type as well as B7-H3 mutant clones, clone-dependent
variations in the functional analyses were observed, which was expected due to the fact that
mutants were derived from single cells from a heterogeneous CMT-93 population. As we could
only see clone-specific differences, but no consistent changes among B7-H3 mutant clones, B7-
H3 does not control cell apoptosis and proliferation in CMT-93 cells in a cell-autonomous
manner.
Recently, it has also been reported that B7-H3 does not affect apoptosis or proliferation
in bladder (T24 and 5637 cells) and hepatic (HepG2 and SMMC7721 cells) carcinoma cell lines
(Kang et al, 2015; Li et al, 2017) in a cell-intrinsic manner, similar to what we have shown in
CMT-93 cells. However, in both cases, B7-H3 was knocked-down using an siRNA/shRNA
strategy compared to the CRIPSR/Cas9 knock-out strategy used in this study, and thus only
exhibit a partial reduction in protein expression. Studies by Kang et al (2015) and Li et al
(2017) thereby showed increased cell migration, invasion and metastasis depending on the
expression of B7-H3 in bladder and hepatic carcinoma cell lines. It is therefore important to
note that I have so far not addressed whether B7-H3 regulates CRC cell migration and invasion
in a cell-autonomous manner. This could be analyzed in vitro by scratch wound healing assays
or trans-well chamber assays, but also by checking for mRNA and protein expression levels of
MMP-2 and -9, E-cadherin, N-cadherin and vimentin. Moreover, since Zhang et al (2015)
showed that silencing of B7-H3 in HCT-8 cells leads to increased oxaliplatin-induced apoptosis
in these cells, it would be interesting to see how mutants would behave in the presence of this
specific apoptosis-inducing drug, as it has a different mechanism of action than staurosporine.
These additional studies could elucidate if B7-H3 has any cell-autonomous roles in CRC
development independent of its potential function in the control of immune cell function.

29
Furthermore, factors within the tumor microenvironment such as chemokines, cytokines
or immune cells could also be introduced in an in vitro set up to analyze if the activity of tumor
B7-H3 is dependent on the presence of certain parts of the immune system. One example for
studying effects within the anti-tumor immune response would be to analyze the ability of B7-
H3 mutants to activate OT-I CD8+ T cells. These cells are isolated from transgenic OT-I mice
which carry transgenic T cell receptors designed to recognize ovalbumin residues 257-264 in
the context of H2Kb, which is a MHC Class I molecule involved in antigen presentation to the
T cells. With this, direct interactions between tumor cell-specific B7-H3 and CD8+ T cells and
thus non-cell autonomous roles of B7-H3 in the regulation of T cells could be analyzed.
4.3 Prospects
In the future, the generated mutant clones will be used in several different ways. As
mentioned, they will be first tested for other potential cell-autonomous roles of B7-H3 such as
cell migration, invasion and metastasis, as well as metabolic influences (eg. effects on glucose
metabolism). Additionally, effects of B7-H3 on tumor growth and metastatic potential will be
further defined in in vivo tumorigenicity studies using wild-type C57BL/6 mice and
recombination activating gene (Rag-)-deficient mice, which lack mature T and B cells. To this
end, control and B7-H3 deficient clones will be injected intravenously and subcutaneously into
mice which will then be analyzed for tumor formation. In these experiments, cell-autonomous
roles as well as T-cell dependent effects can be analyzed in the Rag1-/- and wild-type
background, respectively. Second, immunological roles of B7-H3 in CRC development will be
further analyzed by direct investigation of B7-H3-dependent interactions between CRC cells
and T cells. As described above, co-cultivation of the CMT-93 knockout clones with OT-I CD8+
T cells will be used to study if B7-H3 acts as a co-stimulatory or co-inhibitory factor in T cell
activation, and if it is also involved in the regulation of T cell killing of tumor cells. Finally,
and most importantly, we aim to investigate the role of B7-H3 in intestinal tumor development
using mice with conditional deletion of B7-H3 within the intestinal epithelium or the immune
compartment via the Cre/LoxP system (Le and Sauer, 2000).

30
5 CONCLUSION
Within this thesis, I was able to generate B7-H3 loss-of-function mutants using
CRISPR/Cas9 technology in the mouse CRC cell line CMT-93. I could demonstrate that these
mutants do not exhibit cell-intrinsic defects in proliferation and apoptosis as a consequence of
loss of B7-H3. The data presented in this thesis suggest that B7-H3 in CRC cells predominantly
exhibits non-cell-autonomous roles, e.g. through regulation of antitumor immunity, which will
be investigated using tumor models based on intravenous and subcutaneous injection of the
generated clones into mice.

31
6 REFERENCES
Brenner H, Kloor M, Pox CP (2014). Colorectal cancer. Lancet 383: 1490–1502. Chan DSM, Lau R, Aune D, Vieira R, Greenwood DC, Kampman E, et al (2011). Red and
processed meat and colorectal cancer incidence: Meta-analysis of prospective studies. PLoS One 6: .
Chaplin DD (2010). Overview of immune response. J Allergy Clin Immunol 125: 41. Chapoval a I, Ni J, Lau JS, Wilcox R a, Flies DB, Liu D, et al (2001). B7-H3: a costimulatory
molecule for T cell activation and IFN-gamma production. Nat Immunol 2: 269–274. Condeelis J, Pollard JW (2006). Macrophages: Obligate partners for tumor cell migration,
invasion, and metastasis. Cell 124: 263–266. Davies RJ, Miller R, Coleman N (2005). Colorectal cancer screening : prospects for molecular
stool analysis. Nat Rev Cancer 5: 199-209. Dunn GP, Old LJ, Schreiber RD (2004). The three es of cancer immunoediting. Annu Rev
Immunol 22: 329–360. Fedirko V, Tramacere I, Bagnardi V, Rota M, Scotti L, Islami F, et al (2011). Alcohol drinking
and colorectal cancer risk: An overall and dose-Response meta-analysis of published studies. Ann Oncol 22: 1958–1972.
Ferlay J, Soerjomataram I, Dikshit R, Eser S, Mathers C, Rebelo M, et al (2015). Cancer incidence and mortality worldwide : Sources , methods and major patterns in GLOBOCAN 2012. 136: E359-E385.
Formica V, Cereda V, Nardecchia A, Tesauro M, Roselli M (2014). Immune reaction and colorectal cancer: Friends or foes? World J Gastroenterol 20: 12407–12419.
Grivennikov SI, Greten FR, Karin M (2010). Immunity, inflammation, and cancer. Cell 140: 883–899.
Hashiguchi M, Kobori H, Ritprajak P, Kamimura Y, Kozono H, Azuma M (2008). Triggering receptor expressed on myeloid cell-like transcript 2 (TLT-2) is a counter-receptor for B7-H3 and enhances T cell responses. Proc Natl Acad Sci U S A 105: 10495–500.
Ingebrigtsen VA, Boye K, Nesland JM, Nesbakken A, Flatmark K, Fodstad Ø (2014). B7-H3 expression in colorectal cancer: associations with clinicopathological parameters and patient outcome. BMC Cancer 14: 1–9.
Ingebrigtsen VA, Boye K, Tekle C, Nesland JM, Flatmark K, Fodstad O (2012). B7-H3 expression in colorectal cancer: nuclear localization strongly predicts poor outcome in colon cancer. Int J Cancer 131: 2528–2536.
Janakiram M, Shah UA, Liu W, Zhao A, Schoenberg MP, Zang X (2017). The third group of the B7-CD28 immune checkpoint family: HHLA2, TMIGD2, B7x, and B7-H3. Immunol Rev 276: 26–39.
Jess T, Rungoe C, Peyrin-Biroulet L (2012). Risk of colorectal cancer in patients with ulcerative colitis: a meta-analysis of population-based cohort studies. Clin Gastroenterol Hepatol 10: 639–645.
Jiang B, Zhang T, Liu F, Sun Z, Shi H, Hua D, et al (2016). The co-stimulatory molecule B7-H3 promotes the epithelial- mesenchymal transition in colorectal cancer. Oncotarget 7: 31755-31771.

32
Jiang Y, Ben Q, Shen H, Lu W, Zhang Y, Zhu J (2011). Diabetes mellitus and incidence and mortality of colorectal cancer: A systematic review and meta-analysis of cohort studies. Eur J Epidemiol 26: 863–876.
Kang F, Wang L, Jia H, Li D, Li H, Zhang Y, et al (2015). B7-H3 promotes aggression and invasion of hepatocellular carcinoma by targeting epithelial-to-mesenchymal transition via JAK2/STAT3/Slug signaling pathway. Cancer Cell Int 15: 1–11.
Le Y, Sauer B (2000). Conditional gene knockout using cre recombinase. Methods MolBiol 136: 477–485.
Lee Y, Martin-Orozco N, Zheng P, Li J, Zhang P, Tan H, et al (2017). Inhibition of the B7-H3 immune checkpoint limits tumor growth by enhancing cytotoxic lymphocyte function. Cell Res 1: 1–12.
Lenschow DJ, Walunas TL, Jeffrey A (1996). CD28 / B7 system of T cell costimulation. Annu Rev Immunol 14: 233–58.
Li Y, Guo G, Song J, Cai Z, Yang J, Chen Z, et al (2017). B7-H3 promotes the migration and invasion of human bladder cancer cells via the PI3K/Akt/STAT3 Signaling pathway. J Cancer 8: 816–824.
Liang PS, Chen T-Y, Giovannucci E (2009). Cigarette smoking and colorectal cancer incidence and mortality: Systematic review and meta-analysis. Int J Cancer 124: 2406–2415.
Lim S, Liu H, Silva LM Da, Arora R, Liu Z, Phillips JB, et al (2016). Immunoregulatory protein B7-H3 reprograms glucose metabolism in cancer cells by ROS-mediated stabilization of HIF1a. Cancer Res 76: 2231–2242.
Liu F, Zhang T, Zou S, Jiang B, Hua D (2015). B7-H3 promotes cell migration and invasion through the Jak2/Stat3/MMP9 signaling pathway in colorectal cancer. Mol Med Rep 12: 5455–5460.
Livak KJ, Schmittgen TD (2001). Analysis of relative gene expression data using real-time quantitative PCR and the 2−ΔΔCT method. Methods 25: 402–408.
Lucas C, Barnich N, Nguyen HTT (2017). Microbiota, inflammation and colorectal cancer. Int J Mol Sci 18: 1-27.
Ma Y, Yang Y, Wang F, Zhang P, Shi C, Zou Y, et al (2013). Obesity and risk of colorectal cancer: a systematic review of prospective studies. PLoS One 8: e53916.
Mao Y, Li W, Chen K, Xie Y, Liu Q, Yao M, et al (2015). B7-H1 and B7-H3 are independent predictors of poor prognosis in patients with non-small cell lung cancer. Oncotarget 6: 3452–3461.
Marcus A, Gowen BG, Thompson TW, Iannello A, Deng W, Wang L, et al (2014). Recognition of tumors by the innate immune system and natural killer cells. Adv immunol 122: 91–128.
Ni L, Dong C (2017). New checkpoints in cancer immunotherapy. Immunol Rev 276: 52–65. Pardoll DM (2012). The blockade of immune checkpoints in cancer immunotherapy. Nat Rev
Cancer 12: 252–264. Pecorino L (2012). Molecular Biology of Cancer: Mechanisms, targets, and therapeutics.
Oxford University Press, Oxford Ran F, Hsu P, Wright J, Agarwala V (2013). Genome engineering using the CRISPR-Cas9
system. Nat Protoc 8: 2281–308.

33
Simone V De, Pallone F, Monteleone G, Stolfi C (2013). Role of TH17 cytokines in the control of colorectal cancer. Oncoimmunology 2: e26617.
Suh W-K, Gajewska BU, Okada H, Gronski M a, Bertram EM, Dawicki W, et al (2003). The B7 family member B7-H3 preferentially down-regulates T helper type 1-mediated immune responses. Nat Immunol 4: 899–906.
Suh W-K, Wang SX, Jheon a H, Moreno L, Yoshinaga SK, Ganss B, et al (2004). The immune regulatory protein B7-H3 promotes osteoblast differentiation and bone mineralization. Proc Natl Acad Sci U S A 101: 12969–12973.
Sun J, Chen LJ, Zhang GB, Jiang JT, Zhu M, Tan Y, et al (2010). Clinical significance and regulation of the costimulatory molecule B7-H3 in human colorectal carcinoma. Cancer Immunol Immunother 59: 1163–1171.
Sun J, Fu F, Gu W, Yan R, Zhang G, Shen Z, et al (2011). Origination of new immunological functions in the costimulatory molecule B7-H3: The role of exon duplication in evolution of the immune system. PLoS One 6: e25751.
Taylor D, Burt R, Williams M, Haug P, Cannon-Albright L (2010). Population-based family-history-specific risks for colorectal cancer: a constellation approach. Gastroenterology 138: 877–885.
Terzic J, Karin E, Karin M (2010). Inflammation and Colon Cancer. Gastroenterology 138: 2101–2114.
Tosolini M, Kirilovsky A, Mlecnik B, Fredriksen T, Mauger S, Bindea G, et al (2011). Clinical impact of different classes of infiltrating T cytotoxic and helper cells (Th1, Th2, Treg, Th17) in patients with colorectal cancer. Cancer Res 71: 1263–1271.
Wang L, Kang FB, Shan BE (2014). B7-H3-mediated tumor immunology: Friend or foe? Int J Cancer 134: 2764–2771.
Wang Z-S, Zhong M, Bian Y-H, Mu Y-F, Qin S-L, Yu M-H, et al (2016). MicroRNA-187 inhibits tumor growth and invasion by directly targeting CD276 in colorectal cancer. Oncotarget 7: 44266–44276.
Zhang T, Jiang B, Zou ST, Liu F, Hua D (2015). Overexpression of B7-H3 augments anti-apoptosis of colorectal cancer cells by Jak2-STAT3. World J Gastroenterol 21: 1804–1813.
INTERNET REFERENCES www.benchling.com (Jan 2017)
www.globocan.iarc.fr (Aug 2017) www.hopkinscoloncancercenter.org (Aug 2017)
www.ncbi.nlm.nih.gov/gene/102657 (Jan 2017) www.uniprot.org/uniprot/Q5ZPR3 (Oct 2017)
www.uniprot.org/uniprot/Q8VE98

34
7 APPENDICES
1. APPENDIX A: Vector map for PX458
2. APPENDIX B: Possible off-target sites for gRNA
3. APPENDIX C: Gel image for 934bp long PCR amplicon
4. APPENDIX D: Sequences and alignments of mutant clones
5. APPENDIX E: Composition of buffers

I
APPENDIX A: Vector map for PX456
PX458 (gB7-H3) 9292 bp
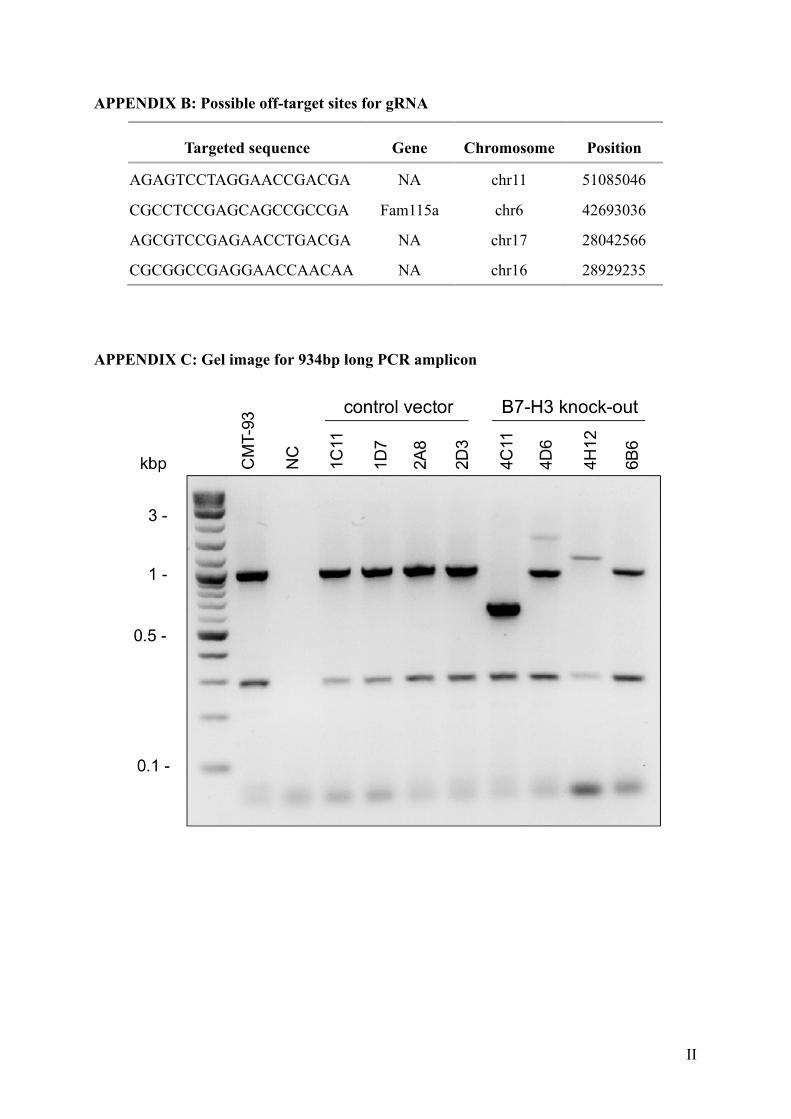
II
APPENDIX B: Possible off-target sites for gRNA
Targeted sequence Gene Chromosome Position AGAGTCCTAGGAACCGACGA NA chr11 51085046 CGCCTCCGAGCAGCCGCCGA Fam115a chr6 42693036 AGCGTCCGAGAACCTGACGA NA chr17 28042566 CGCGGCCGAGGAACCAACAA NA chr16 28929235
APPENDIX C: Gel image for 934bp long PCR amplicon
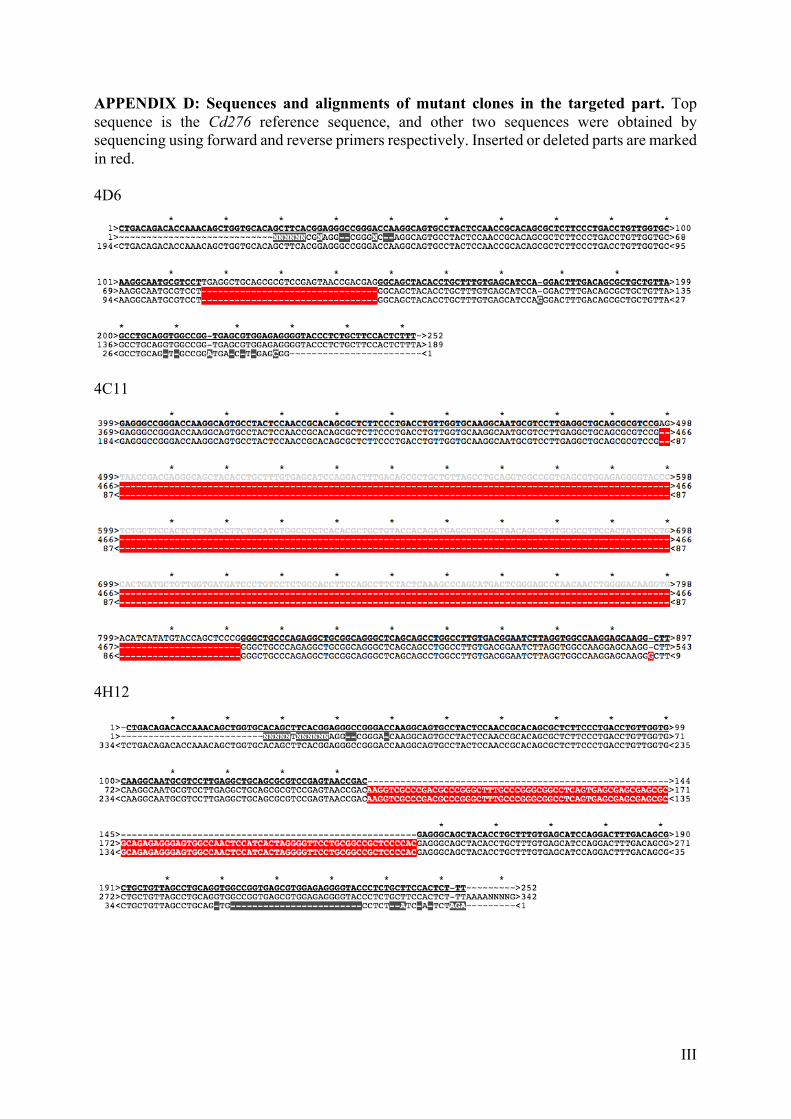
III
APPENDIX D: Sequences and alignments of mutant clones in the targeted part. Top sequence is the Cd276 reference sequence, and other two sequences were obtained by sequencing using forward and reverse primers respectively. Inserted or deleted parts are marked in red. 4D6
4C11
4H12

IV
6B6

V
APPENDIX E: Composition of Buffers
Kit/Purpose Buffer Composition
PureLink Quick Gel Extraction Kit
“Gel Solubilization Buffer L3” contains guanidinium thiocyanite
“Wash Buffer” contains 75-80% ethanol
“Elution Buffer 10 mM Tris/HCl, pH 8.5
GeneJET Plasmid Miniprep kit
“Resuspension Solution” contains 10 mg/ml RNase A
“Lysis Buffer” contains sodium hydroxide and sodium lauryl sulfate
“Neutralization Buffer” contains guanidinium chloride
“Wash Buffer” contains 75-80% ethanol
“Elution Buffer” 10 mM Tris/HCl, pH 8.5
EndoFree Plasmid Maxi Kit
“Buffer P1” (resuspension solution)
50 mM Tris-Cl, pH 8.0
10 mM EDTA
100 µg/ml RNase A
“Buffer P2” (lysis buffer) 200 mM NaOH
1% SDS (w/v)
“Buffer P3” (neutralization buffer)
3.0 M potassium acetate
pH 5.5
“Buffer ER” NA
“Buffer QBT” (equilibration buffer)
750 mM NaCl
50 mM MOPS, pH 7.0
15% isopropanol (v/v)
0.15% Triton X-100 (v/v)
“Buffer QC” (wash buffer) 1.0 M NaCl
50 mM MOPS, pH 7.0
15% isopropanol (v/v)
“Buffer QN” (elution buffer) 1.6 M NaCl
50 mM MOPS, pH 7.0
15% isopropanol (v/v)
“Buffer TE” 10 mM Tris-Cl, pH 8.0
1 mM EDTA
NucleoSpin Gel and PCR Clean-up kit
“Buffer NTI” contains guanidinium thiocyanite
“Buffer NT3” contains 75-80% ethanol
“Elution Buffer NE” 5 mM Tris/HCl, pH 8.5
PeqGold Total RNA Kit “RNA Lysis Buffer T” contains guanidinium thiocyanate 40-50%

VI
“RNA Wash Buffer I” contains ethanol 25-50%, guanidinium thiocyanate 10-25%
“RNA Wash Buffer II” NA
BrDU FlowKit “BD Cytofix/Cytoperm Buffer” contains 4.2% formaldehyde
“BD Cytoperm Permeabilization Buffer Plus”
NA
“BD Perm/Wash Buffer” NA
Restriction Digestion FastDigest Buffer NA
cDNA synthesis 10x RT Buffer NA
PCR 5x OneTaq Buffer NA
Deglycosylation PNGase Buffer 1 50 mM Na3PO4
1% SDS (w/v)
1% b-mercaptoethanol (v/v)
1x complete proteinase inhibitor
pH 7.8
PNGase Buffer 2 50 mM Na3PO4
1% NP-40 (v/v)
1x complete proteinase inhibitor
pH 7.5
Protein recovery RIPA Buffer 50 mM Tris/HCl, pH 7.4
150 mM NaCl
5 mM EDTA
1% Igepal (v/v)
0.5% sodium deoxycholat (w/v)
0.1% SDS (w/v)
Western blot 5x Laemmli with DTT 5% SDS (w/v)
50% glycerol (w/v)
625 mM Tris
500 mM DTT
Running Gel Buffer 1.5 M Tris Base
0.4% SDS (w/v)
pH 8.8
Stacking Gel Buffer 0.5 M Tris Base
0.4% SDS (w/v)
pH 6.8

VII
10x SDS Running Buffer 190 mM glycin
25 mM Tris
0.1% SDS (w/v)
Semi-dry Transfer Buffer 19 mM Tris Base
0.4% glycin (w/v)
10% methanol (v/v)
TBS-T 50 mM Tris/HCl, pH 7.6
150 mM NaCl
1% Tween 50 (v/v)
Flow cytometry FACS Buffer 1x D-PBS
10% FBS (v/v)
Annexin V staining Annexin V Binding Buffer 50 mM HEPES
700 mM NaCl
12.5 mM CaCl2
pH 7.4
CURRICULUM VITAE
I was born on July 26th, 1994, in Rijeka. I completed my high school education in my
hometown Delnice. In 2012 I enrolled in the Undergraduate programme of Molecular biology
at the Faculty of Science, University of Zagreb. I completed laboratory practice under
supervision of Assoc. Prof. Dr. Vesna Benković at the Divison of Animal Physiology. During
my final year of undergradute studies I was part of the 9th International Society for Applied
Biosciences (ISABS) Conference on Forensic and Anthropologic Genetics and Mayo Clinic
Lectures in Individualized Medicine. I graduated from the undergraduate programme by writing
a final paper titled «Host-microbiome interactions as a driver of evolution and development”
under supervision of Dr. Damjan Franjević, Ass. Prof. and obtained a title of bacc.mol.biol.
In September of 2015, I enrolled in the Graduate programme of Molecular Biology. I
was a teaching assistant in laboratory practice for Animal Physiology course led by Dr.
Benković, Assoc. Prof. Dr. Domagoj Đikić and Prof. Dr. Nada Oršolić. I completed my final
year of gradute studies at DFG-Center for Regenerative Therapies Dresden, Cluster of
Excellence, TU Dresden within the Erasmus+ student exchange programme. During this time,
I also worked on my Master's thesis in the laboratory of Prof. Dr. med. Sebastian Zeissig in the
field of mucosal and tumor immunology, under supervision of Prof. Zeissig and Dr. Kenneth
Peuker.