using weather research and forecasting (wrf) model for ...ewra.net/ew/pdf/ew_2017_59_12.pdf · the...
TRANSCRIPT

European Water 59: 85-90, 2017. © 2017 E.W. Publications
Using Weather Research and Forecasting (WRF) model for extreme precipitation forecasting in an Andean region with complex topography
G. Yáñez Morroni1*, J. Gironás1,2, M. Caneo3 and R. Delgado3 1 Departamento de Ingeniería Hidráulica y Ambiental, Pontificia Universidad Católica de Chile, Chile 2 Centro de Investigación para la Gestión Integrada de Desastres Naturales (CIGIDEN), Centro de Desarrollo Urbano Sustentable (CEDEUS) y Centro UC de Cambio Global 3 Dirección Meteorológica de Chile (DMC) * e-mail: [email protected]
Abstract: The Weather Research and Forecasting (WRF) model is broadly used for weather prediction and research due to its good performance, but atmospheric conditions simulation over complex topography is not always optimal. Consequently, WRF has an ineffectiveness resolving Chilean mountainous terrain and foothills, precisely the site where some of the main cities are located and the most extreme rainfall events take place. This work uses a mixed physic scheme to enhance initial forecasts made by Chilean Weather Agency (DMC): testing it over vertical levels, PBL (planet boundary layer), microphysics and lead time in the computational simulations. Even when the steep topography difficult the storm peak amount, and to a lesser degree, the exact storm beginning prediction, WRF do predict properly the N-hours with the biggest amount of rainfall (5 hours corresponding to Quebrada de Ramón’s time of concentration) and the temperatures during the event. Finally, a Lin et al. or WSM 6-class microphysics was chosen as the best in this event, but further testing in more storms in this region is required.
Key words: flash flood, numerical weather predictors, WRF, extreme rainfall events, Andean mountain
1. INTRODUCTION
Hydro-meteorological disasters have been a severe problem, specifically in Latin America and the Caribbean region, where ~90.000 people have died and 150 million people were injured over the last 30 years. Furthermore, this type of disaster has caused more than 120 billion dollars of economic losses (EM-DAT, 2016). The occurrence of flash floods, avalanches or extreme rainfall events is highly variable in time, and their disruptive impacts over the region increase when the events concentrate in relatively short periods of time. The Andes Mountains are a very influential geographical accident, where urbanization takes place in its foothill areas. The city of Santiago, in central Chile (Figure 1), is in the Andean front range. Here, extreme precipitation events usually cause floods. Their effects can be significant increased by the lack of urban planning and the massive alteration of the natural drainage system. Concurring high temperatures during these events increase the possibility of having significant floods as liquid precipitation takes place in areas in which snow usually occurs.
Reducing or preventing natural disaster via forecasting is one of the main goals of numerical weather predictors (NWP) models. Usually the use of NWP also considers a downscaling process through a statistical or dynamical approach. Currently, the accuracy exhibited by downscaled NWP results enables forecasting hydro-meteorological hazards. This becomes a priceless opportunity for avoiding damages in cities, and implementing preventative actions and mitigation schemes.
The objectives of this work are: i) to enhance initial WRF forecasts made by DMC over mountainous regions using a mixed physics scheme, and ii) to test it over vertical levels (PBL, planet boundary layer), microphysics and lead-time in the computational simulations. The prediction of beginning of the storm events, its peak, and the N-rainiest hours will be used to define the best microphysical scheme. Therefore, it will be used for evaluating the WRF performance over complex Andean topography.

G. Yáñez Morroni et al. 86
Figure 1. Santiago (33.5°S; 70.7°W) and Apoquindo meteorological station
2. APRIL 2016 EXTREME STORM EVENT
In April 13 – 18, 2016, Chile’s central valley was affected by an extreme rainfall event. During the storm, a precipitation of 108 mm in 24 hours was measured at the Apoquindo rain gauge, located in the Andean Front Range at an elevation of 1625 m. (Figure 1). This frontal system moved from north to south, with negative anomalies in atmospheric pressure and geopotential height at 500 hPa, and negative values of 50 m. (Figure 2a). Satellite images (not included) showed an important moisture contribution advected from lower latitudes, which incorporated more precipitable water into the system. Furthermore, a coupled subtropical and polar jet stream intensification at 250 hPa also took place (Figure 2b). The highest wind intensities (i.e. positive anomalies of 35 m/s in the wind vectors) were in the nucleus of the system over central Chile, which favoured cloudiness development (Figure 2b).
Figure 2. Composite anomaly for 500 mb geopotential height (a) and vector wind (b) during the storm event.
European Water 59 (2017) 87
All these factors led to an enhanced event, which concurred with the zero-degree isotherm or freezing level being above 3000 m. These conditions originated a large contribution of liquid precipitation at relatively high temperatures. The previous produced significant flow rates in the front range watersheds of the area. In fact, in April 16th the Santiago’s main river, Mapocho River, flooded the central part of this city, causing severe economic losses. This flood took place when the total flow capacity was reduced by a highway construction nearby the river bed at the time.
3. WRF SIMULATIONS AND PHYSICAL SCHEMES
Simulations of the event were performed using ARW-WRFv3.5, a state-of-the-art mesoscale NWP model suitable for a wide range of studies in weather simulation, prediction and forecasting. WRF uses scalar conservation and compressible non-hydrostatic Euler equations, applied over the terrain. The model follows vertical coordinates with variable grid density. WRF system and its code is maintained by the National Center for Atmospheric Research (http://www.mmm.ucar.edu /wrf/users). Four nested domains of 54, 18 and 6 km grids were implemented using a Lambert Projection with the central point located on Santiago (33.5°S; 70.7°W).
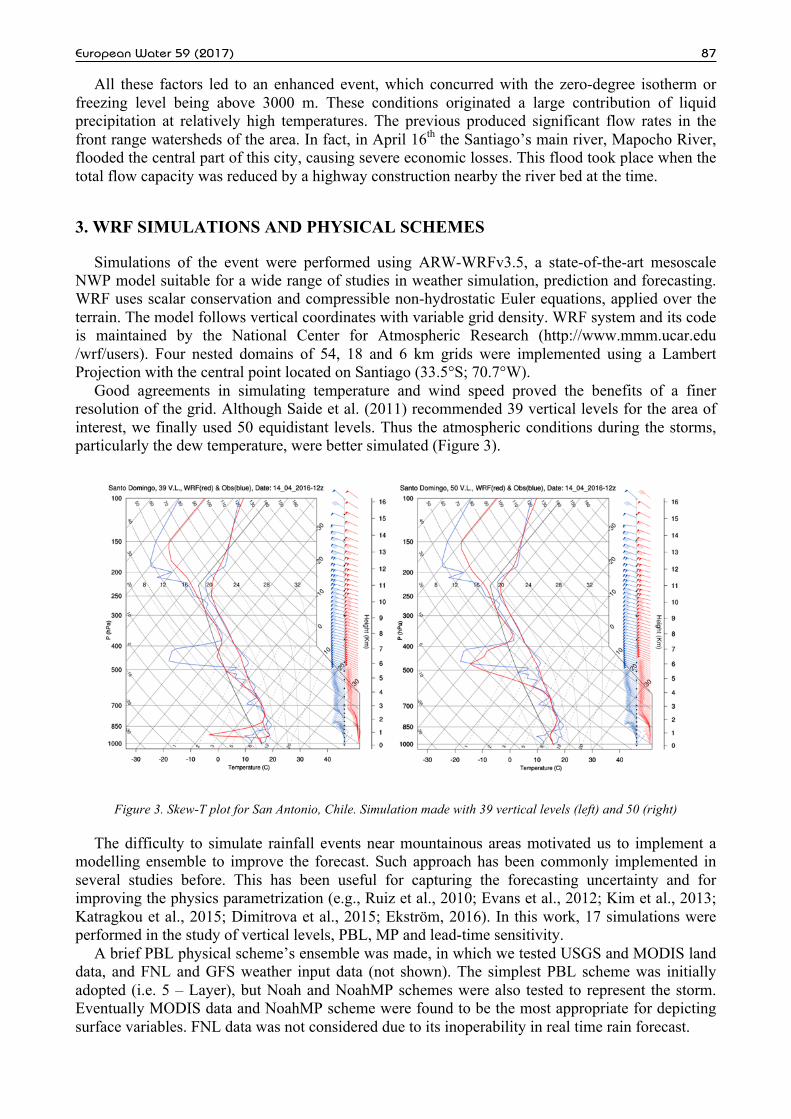
Good agreements in simulating temperature and wind speed proved the benefits of a finer resolution of the grid. Although Saide et al. (2011) recommended 39 vertical levels for the area of interest, we finally used 50 equidistant levels. Thus the atmospheric conditions during the storms, particularly the dew temperature, were better simulated (Figure 3).
Figure 3. Skew-T plot for San Antonio, Chile. Simulation made with 39 vertical levels (left) and 50 (right)
The difficulty to simulate rainfall events near mountainous areas motivated us to implement a modelling ensemble to improve the forecast. Such approach has been commonly implemented in several studies before. This has been useful for capturing the forecasting uncertainty and for improving the physics parametrization (e.g., Ruiz et al., 2010; Evans et al., 2012; Kim et al., 2013; Katragkou et al., 2015; Dimitrova et al., 2015; Ekström, 2016). In this work, 17 simulations were performed in the study of vertical levels, PBL, MP and lead-time sensitivity.
A brief PBL physical scheme’s ensemble was made, in which we tested USGS and MODIS land data, and FNL and GFS weather input data (not shown). The simplest PBL scheme was initially adopted (i.e. 5 – Layer), but Noah and NoahMP schemes were also tested to represent the storm. Eventually MODIS data and NoahMP scheme were found to be the most appropriate for depicting surface variables. FNL data was not considered due to its inoperability in real time rain forecast.
G. Yáñez Morroni et al. 88
4. MODEL EVALUATION IN MOUNTAINOUS REGION
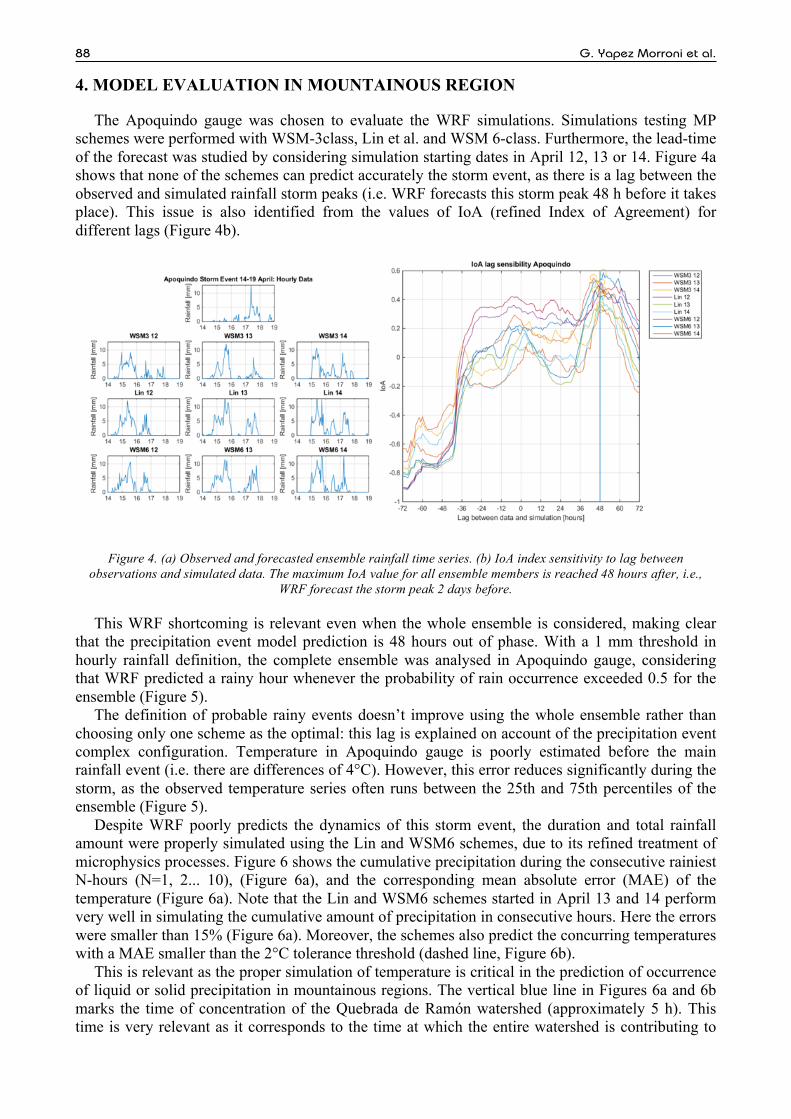
The Apoquindo gauge was chosen to evaluate the WRF simulations. Simulations testing MP schemes were performed with WSM-3class, Lin et al. and WSM 6-class. Furthermore, the lead-time of the forecast was studied by considering simulation starting dates in April 12, 13 or 14. Figure 4a shows that none of the schemes can predict accurately the storm event, as there is a lag between the observed and simulated rainfall storm peaks (i.e. WRF forecasts this storm peak 48 h before it takes place). This issue is also identified from the values of IoA (refined Index of Agreement) for different lags (Figure 4b).
Figure 4. (a) Observed and forecasted ensemble rainfall time series. (b) IoA index sensitivity to lag between observations and simulated data. The maximum IoA value for all ensemble members is reached 48 hours after, i.e.,
WRF forecast the storm peak 2 days before.
This WRF shortcoming is relevant even when the whole ensemble is considered, making clear that the precipitation event model prediction is 48 hours out of phase. With a 1 mm threshold in hourly rainfall definition, the complete ensemble was analysed in Apoquindo gauge, considering that WRF predicted a rainy hour whenever the probability of rain occurrence exceeded 0.5 for the ensemble (Figure 5).
The definition of probable rainy events doesn’t improve using the whole ensemble rather than choosing only one scheme as the optimal: this lag is explained on account of the precipitation event complex configuration. Temperature in Apoquindo gauge is poorly estimated before the main rainfall event (i.e. there are differences of 4°C). However, this error reduces significantly during the storm, as the observed temperature series often runs between the 25th and 75th percentiles of the ensemble (Figure 5).
Despite WRF poorly predicts the dynamics of this storm event, the duration and total rainfall amount were properly simulated using the Lin and WSM6 schemes, due to its refined treatment of microphysics processes. Figure 6 shows the cumulative precipitation during the consecutive rainiest N-hours (N=1, 2... 10), (Figure 6a), and the corresponding mean absolute error (MAE) of the temperature (Figure 6a). Note that the Lin and WSM6 schemes started in April 13 and 14 perform very well in simulating the cumulative amount of precipitation in consecutive hours. Here the errors were smaller than 15% (Figure 6a). Moreover, the schemes also predict the concurring temperatures with a MAE smaller than the 2°C tolerance threshold (dashed line, Figure 6b).
This is relevant as the proper simulation of temperature is critical in the prediction of occurrence of liquid or solid precipitation in mountainous regions. The vertical blue line in Figures 6a and 6b marks the time of concentration of the Quebrada de Ramón watershed (approximately 5 h). This time is very relevant as it corresponds to the time at which the entire watershed is contributing to

European Water 59 (2017) 89
the runoff. Thus, these simulations eventually would allow having good estimations of the flow discharges, which in turn facilitates the implementation of an early warning system.
Figure 5. Apoquindo’s observed rainfall and temperature time series. Red stripes indicate rain as the probability of having rain in the ensemble exceeds 0.5. Temperature time series includes 25, 50 and 75 percentiles for the ensemble
forecast
Figure 6. Observed and simulated cumulative precipitation during the consecutive rainiest N-hours (a). Corresponding mean absolute error for the simulated temperature (b). The vertical blue line corresponds to the time of concentration
(~5h) of Quebrada de Ramón watershed, while the vertical dashed line at 2°C represent tolerance threshold.

G. Yáñez Morroni et al. 90
5. CONCLUSIONS
This work presents the use of WRF to forecast extreme precipitation in an Andean region with complex topography. The model predicts the storm and its beginning with 48 hours lag in its peak. The previous was despite the microphysical scheme used, with obvious differences in rain amounts. WRF simulated successfully the cumulative precipitation for the rainiest N-hours of the storm together with the concurring temperature during these hours.
In addition, the microphysics ensemble proved that Lin et al. and WSM 6-class schemes provided more realistic amounts of rainfall, even when overestimation occurred sometimes. Let us recall that these schemes presented a refined treatment of the rain processes. More investigation is needed to assess WRF and improve its parameterization to properly represent the time development of rainfall events in highly complex reliefs. These additional researches could include more storms in the same area or additional downscaling techniques.
ACKNOWLEDGEMENTS
This research was funded by the FONDECYT 1161439, and CEDEUS/FONDAP 15110017 and 15110020 Seeds Funds. Additional economical support was provided by “Arturo Cousiño Lyon” and “Magister Nacional CONICYT” Scholarships.
REFERENCES
EM-DAT, 2016. The International Disaster Database. Centre for Research on the Epidemiology of Disasters (CRED), School of Public Health, Université Catholique de Louvain, Belgique
Ekström, M., 2016. Metrics to identify meaningful downscaling skill in WRF simulations of intense rainfall events, Environmental Modelling & Software, 79, 267-284.
Evans, J. P., Ekstrom, M., Ji, F., 2012. Evaluating the performance of a WRF physics ensemble over South-East Australia. Climate Dyn., 39, 1241–1258.
Dimitrova, R., Silver, Z., Zsedrovits, T., Hocut, C. M., Leo, L. S., Di Sabatino, S., Fernando, H. J., 2015. Assessment of Planetary Boundary-Layer Schemes in the Weather Research and Forecasting Mesoscale Model Using MATERHORN Field Data. Boundary-Layer Meteorology, 1-21.
Katragkou, E., García-Díez, M., Vautard, R., Sobolowski, S., Zanis, P., Alexandri, G., Cardoso, R. M., Colette, A., Fernandez, J., Gobiet, A., Goergen, K., Karacostas, T., Knist, S., Mayer, S., Soares, P. M. M., Pytharoulis, I., Tegoulias, I., Tsikerdekis, A., Jacob, D., 2015. Regional climate hindcast simulations within EURO-CORDEX: evaluation of a WRF multi-physics ensemble, Geosci. Model Dev., 8, 603-618, doi: 10.5194/gmd-8-603-2015.
Kim, J.-H., Shin, D.-B., Kummerow, C., 2013. Impacts of a priori databases using six WRF microphysics schemes on passive microwave rainfall retrievals. J. Atmos. Oceanic Technol., 30, 2367–2381, doi:10.1175/JTECH-D-12-00261.1.
Peña, H., 2016. Desafíos de la seguridad hídrica en América Latina y el Caribe. Comisión Económica para América Latina y el Caribe (CEPAL), LC/L.4169, Santiago de Chile
Saide, P.E., Carmichael, G.R., Spak, S.N., Gallardo, L., Osses, A.E, Mena-Carrasco, M.A., Pagowski, M., 2011. Forecasting urban PM10 and PM2.5 pollution episodes in very stable nocturnal conditions and complex terrain using WRF–Chem CO tracer model. Atmospheric Environment, 45(16), 2769-2780.
Ruiz, J. J., Saulo, C., Nogués-Paegle, J., 2010. WRF Model sensitivity to choice of parameterization over South America: Validation against surface variables. Mon. Wea. Rev., 138, 3342–3355, doi:10.1175/2010MWR3358.1.