using value chain mapping - economic development board · p 2 using value chain mapping value chain...
TRANSCRIPT

ECONOMIC DEVELOPMENT BOARD - SOUTH AUSTRALIA P 1
Using value chain mappingto build comparative advantage
www.economicdevelopmentboardsa.com.au

USING VALUE CHAIN MAPPINGP 2
Value chain maps provide a way to understand the processes and pathways to production and sale, by illustrating in a simple form, the complexities of the value chain of an industry sector or product.
USING VALUE CHAIN MAPPING

ECONOMIC DEVELOPMENT BOARD - SOUTH AUSTRALIA P 1
Contents
Contents 1
Introduction 2
Terminology 4
Why use a map? 5
What value chain maps do not address 6
How value chain mapping can inform policy design 7
The questions define the map 8
The wider use of value chain mapping 8
How to create a value chain map 9
Step 1: Determining the stages 10
Step 2: Identifying the participants 11
Step 3: Goods produced and services provided 12
Step 4: Processes and activities 14
Step 5: Support services 15
Chain map examples 16
Unconventional gas 16
Grain (focusing on wheat) 17
Higher education 18
Incorporating additional information 20
Example 1: Additional information for the cellulose fibre chain map 20
Example 2: Additional information for the grain (wheat) chain map 23
Mapping in summary 26
References 27
USING VALUE CHAIN MAPPINGP 2
Values chain maps – Developing the picture
This manual explains how to create a simplified picture of the many complex webs of relationships that form economic value chains for industry sectors, products or services.
It is based on the process used to create a series of value chain ‘maps’ for four South Australian industry sectors – cellulose fibre (forestry and forestry-related products), unconventional gas, grain (focusing on wheat) and higher education.
The following pages contain a step-by-step guide to creating value chain maps, in a consistent format, for any industry or sector. Using a uniform format and methodology makes it easier to compare sectors and distil information about critical stages of production.
Importantly, this mapping methodology can be used at any stage of the evolution of the sector. It could be new, emerging or established; large or small; simple or complex; or part of the manufacturing, resources or services industries.
A single case study in forestry, referred to ‘cellulose fibre’, has been used to illustrate the process. Maps and process ‘lessons’ for unconventional gas, grain and higher education are also shared to demonstrate some of the differences likely to be encountered when developing value chain maps for different industry sectors.
The Economic Development Board acknowledges Dr Fiona Kerr of FK Consulting and Charles Tulloch of ACIL Allen Consulting, who developed the mapping methodology and are the authors of this manual under the supervision of Prof Göran Roos.
Introduction

ECONOMIC DEVELOPMENT BOARD - SOUTH AUSTRALIA P 3

USING VALUE CHAIN MAPPINGP 4
‘The value chain describes the full range of activities which are required to bring a product or service from conception, through the different phases of production (involving a combination of physical transformation and the input of various producer services), delivery to final consumers, and final disposal after use.’ (Kaplinsky, 2002).
The terms supply chain and value chain are often used interchangeably. However, Professor Andrew Fearne, former SA Thinker in Residence and UK expert in food marketing, consumer behaviour and supply chain management, believes there is a clear difference...
’In a supply chain model, businesses focus essentially on what they do, and they push product down the chain to the end user. In a value chain model, product is pulled through the chain in response to what consumers want, and are willing to pay for.
’In supply chains, relationships are weak because businesses are pushing product with all of their might, irrespective of what the next link wants.
’In value chains, relationships are strong. Because we’re all being pulled by the consumer, we respond more readily to the consumer. We have a greater chance of survival. Because we have a greater chance of survival through that method of doing business, trust is built. And with that trust, information flows more freely. There is a race to the top. The richer the flow of information, the more likely we are to find segments where we can make more money. Where we can be more profitable, and we can stay in business for longer.’ 1
For the purposes of this manual, a clear distinction is drawn. Value chains are the focus because the ultimate aim is to add value to South Australian industry.
Participants in value chains are the multifarious businesses, individuals, groups, organisations – even government bodies or regulators – who contribute in some way to getting a product or service from its source to the end user. Sometimes the chain goes even further than that – through to the ultimate disposal of the product or its waste – involving even more participants along the way.
In economic discussion, the participants in value chains are often called actors, because they perform ‘actions’ within the chain. In this manual, the terms ‘participants’ and ‘actors’ are used to describe, essentially, the same entities or people.
Stakeholders, for the purposes of this guide, are influential groups or individuals ‘on the edge’ of the chain – that is, those who are not necessarily a part of the chain but who have a role in supporting it or have some influence upon it. A stakeholder might be a licensing authority, a government agency, or a second or third tier supplier.
The term ‘moving up the value chain’, at the business level, means using business processes and resources to produce more profitable products. For a business to be able to do this, it might need to ‘shift up’ to using higher technology-intensive manufacturing or knowledge intensive services through a continuous process of change, innovation and productivity growth. At the industry level, ‘upgrading’ or moving up the value chain means moving a sector from one stage of production to another with higher value activities and increased benefits for everyone involved. A good example is moving from simply exporting a raw product to transforming it onshore through processing or manufacture and then exporting it for greater profit. Moving up the value chain also brings flow-on benefits for workers (e.g. skills, income, job security), the community and the economy.
When value chains are healthy, there is close cooperation not only between participants but often also between private enterprise and a supportive public sector. A healthy value chain increases the participants’ capacity to identify opportunities to upgrade or innovate within a chain.
Value chain analysis takes the information provided by a value chain map to another level of detail. It goes beyond describing specific market functions and the players performing them to look at the individual and collective participants’ capabilities and motivations and, importantly, how well they are performing them. To do this requires a clear understanding of the capacity of the different participants, what drives each of them (i.e. their ‘incentives’) and the relationships between them. The foundation for such analysis is a value chain map!
Value chain analysis is not covered in this manual but the References section contains links to further reading on the subject.
1 A transcript of Prof. Fearne’s DVD that can be found at http://www.pir.sa.gov.au/_media/other/pirsa_internet/ag_and_wine/value_chains/valuechainvideos/valuechains/transcript
Terminology

ECONOMIC DEVELOPMENT BOARD - SOUTH AUSTRALIA P 5
Value chain maps provide an easily digestible way to understand the processes and pathways to production and sale by illustrating, in a simple form, the complexities of an industry sector and its value chain.
They are particularly useful for analysing and researching value chains to determine how they are performing or how they can be improved or refined. The maps align sectors and participants and produce a shared image not only of what the industry or sector does, but what it could look like.
They can also be developed collaboratively to foster a shared view by all or some of the participants. This can be critical to the capacity of the businesses involved to innovate, or for them or the sector to upgrade or move up the value chain.
The value chain mapping process:
• identifies opportunities in the chain for business and industry sectors to grow and expand
• supports participant engagement by sparking conversations about processes and activities and how to improve or upgrade the value chain; blockages and challenges associated with processes often become the ‘big-ticket’ issues that lead businesses to seek policy aid and support
• provides an ideal basis for deeper value chain analysis
• facilitates cross-sector analysis, especially where the mapping method is consistent across industries or across the State
• is iterative, because detail can be clarified and added to the map over time; this helps inform the design of intelligent policy, regulations and procurement processes based on a shared understanding of the sector
• can engender trust between value chain participants, resulting in the sharing of higher quality information; this is vital for innovation.
The visual nature of value chain maps has particular benefits:
• they are easily shared, which means that all participants have consistent information
• they accurately but simply represent often complex industry structures, promoting more probing conversations about barriers to entry, bottlenecks, value sharing and supply constraints (this additional scrutiny is value chain analysis)
• they are easy to analyse and provide a starting point for new members wanting to enter the chain, or for existing members to identify issues, challenges and areas where overall competitiveness could be improved.
The process of value chain mapping, including ongoing conversations with and between participants, can result in additional flow-on strategic effects. They include:
• supporting policy makers to better understand where value chains fit into global value networks, thus informing the development of targeted assistance and interventions
• illustrating trade network and market access issues; this could, for example, help inform a decision about whether a sector should globalise or work to establish unique home market advantages
• uncovering leverage points for value chain upgrading, paving the way for discussion and agreements on how to proceed
• identifying weaknesses or pressure points and highlighting opportunities for policy, performance measures and capacity improvement; this occurs when chain maps are updated on an ongoing basis.
Mapping is especially helpful when the participants have varying levels of information or understanding about the value chain and the context in which it operates. Because it’s visual, a map can help explain the dynamics within the chain and has the capacity to reveal:
• key participants, system boundaries, relationships and functional roles
• the flow of goods, services, payments and information along the chain
• linkage points and gaps or blockages between participants.
More advanced strategic value chain mapping can lead to value network analysis, which can be applied to more mature or globalised value chain structures. However, this type of advanced work still builds on the basic mapping process, which begins to build engagement across all sectors and business groups.
Why use a map?

USING VALUE CHAIN MAPPINGP 6
Value chain maps do not reveal or seek to include information about relationships, power dynamics and the ‘rules’ of the system.
Not surprisingly, the dynamics of power between participants are often critical to causing or relieving pressures across a given value chain. Lead participants often wield considerable influence and can therefore be the most powerful players. While the dynamics between participants might emerge through discussions with various stakeholders on the edge of the chain they are not captured in the value chain maps.
Formal and informal rules (and their enforcement) shape market outcomes and govern participation and behaviour. There are several kinds of rules, including:
• generally applicable rules, such as laws relating to contracts, property, consumer and environmental protection, weights and measures, health and safety, competition and tax
• sector-specific rules, such as banking codes, telecommunications regulations and laws relating to land use and ownership
• non-statutory regulations, such as industry codes of conduct and quality standards.
The enforcement of rules can involve: the judiciary; revenue authorities; inspection, regulation and licensing systems; company and land registries; industry regulators; local tax offices; and self-regulation mechanisms.
How rules are interpreted and applied is often shaped by social, cultural and political norms and practices, as much as by the letter of the law. Where formal rules and their application are weak, the environment tends to be governed by informal rules.
It is vital to understand the nature of the political, social and economic drivers of policy design at both state and federal levels. In many jurisdictions these drivers push policy and intervention activity towards short-term goals and ‘siloed’ activities. This reduces the capacity for government bodies to foster innovative intervention through mechanisms such as policy, regulatory changes, or procurement redesign. This, in turn, limits the ability of government to help upgrade value chains. It also impedes the alignment of the various participants and stakeholders across the state. Growing a healthy economy and society requires a long term focus.
What value chain maps do not address
USING VALUE CHAIN MAPPINGP 6

ECONOMIC DEVELOPMENT BOARD - SOUTH AUSTRALIA P 7
A principal role of policy is to build supportive processes and interventions and to facilitate access to dynamic markets in ways that encourage truly sustainable capability. Most successful interventions use existing or potential change agents, for example, successful individuals, businesses or industry leaders. Wherever possible, change agents should be local and already involved in the value chain.
It is common for economic necessity or technological change to be the catalyst for policy intervention. However, before this happens critical questions should be asked, and the answers used to drive any intervention activity. Questions might include:
• What drives the value chain upgrade?
• Who gains?
• How would the gains be spread?
• How should benefits be calculated?
• Will any participants be negatively affected in the process?
Before deciding what role to take in intervention, government agencies should consider key issues, including:
• their role and those of other external forms of regulation
• the extent of trade-off between coordination and control
• the level to which an external agency should certify and regulate businesses
• how policies affect the power relationships and dynamics of the supply chain and network.
To answer these questions properly, policy makers must have an accurate understanding of local, regional and global systems so they can recognise systemic blockers and enablers. Getting rid of these can guide the shaping of overarching policy.
This meso-level2 policy design approach aligns with the Business Council of Australia’s latest report Building Australia’s Comparative Advantages,2 which emphasises that a ‘deep, sector specific analysis’ is required before informed economy-wide reforms can be shaped to build the innovation infrastructure necessary for agility.
The mapping method outlined in this manual is ideal for this purpose, as it is designed for both sector-specific and cross-sector analysis. It can be the first step in a deeper value chain analysis process and also has the advantages of getting everyone in each sector on the same page and kick-starting the participative process of quality analysis.
How value chain mapping can inform policy design
2 meso levels fall between micro and macro levels 3 Released July 8, 2014

USING VALUE CHAIN MAPPINGP 8
Value chain mapping and analysis has been used around the world to investigate and improve industry or service sectors, or groups of businesses. The techniques are valid across many economic contexts and settings. They have proved valuable in developing countries and have been used by organisations such as the World Bank, the International Labour Office (the permanent secretariat of the International Labour Organisation) and the United Nations Industrial Development Organisation.
Links to further reading can be found in the references section.
The wider use of value chain mapping
How the map will ultimately look depends on the questions asked about the value chain. It is crucial to get those questions right before attempting to ‘zoom in’ to analyse issues or opportunities.
An assessment of the market can identify both underlying causes of under-performance and opportunities for upgrading or performance enhancement. It can also help determine whether intervention is necessary and provide a guide to the types of intervention that deserve closer investigation.
Key questions should include:
1. What are the underlying causes of a market system’s underperformance?
2. If the system is performing well, where are the opportunities to further enhance performance?
3. What are the primary obstacles to overcoming identified problems or capitalising on opportunities?
Once the map has been completed, more detailed value chain analysis is usually needed to explore the range of other functions that support and govern the core drivers of the market. In value chain analysis it is essential to go beyond the symptoms of the problem (e.g. if or when transactions are not happening) to understand the causes. This takes the process from the ‘what’ to the ‘why’.
The questions define the map

ECONOMIC DEVELOPMENT BOARD - SOUTH AUSTRALIA P 9
It is important to understand that value chain maps evolve as research and discussions evolve. The simplest way to begin is by mapping a simple flow chart and then expanding it to depict a chain, a network, or even a constellation of networks, depending on the level of analysis required.
As can be seen in the example below, the key segments of the chain map are:
• the value or supply chain stages – an overview of the broad linear chain of production
• the main ‘actors’ – the major players or participants in each stage of the value chain
• goods produced and services provided – the outcomes or services provided at each stage of the production chain
• processes and activities undertaken – the major processes and activities required to produce the goods or services
• support services across the chain – activities required across all stages of the value chain, but not produced as a direct result of the chain.
Producing a map like this takes time and considerable input from participants and appropriate stakeholders.
How to create a value chain map
SUPPORT SERVICES ACROSS THE CHAIN
Raw material suppliersData measuring technologies
Machine and equipment suppliers (sourced internationally)Monitoring and analytics (geo-informatics)
General business servicesEnergy and fuel suppliers
Breeding and forest management
VALUE/SUPPLY CHAIN STAGES
Hauling and harvesting
Sawmilling and secondary processing
Domestic retail channelsExport
CONSUMERS
Forest owners, GrowersManagers
MAIN ACTORS
HauliersHarvesters
Saw millersSecondary processors
Distributors and retailersExporters
CONSUMERS
Domestic retailParticle board & laminate (eg. robes, timber �ooring)
Fencing
Landscaping – decking and trellising
Chipboard, laminate and panelboard
Residues (woodchips, sawdust)
Export productsTimber for pallet assembly - cut to size (small volumes)
Whole logs
Woodchips
Precision mill productsStructural timber
Non-structural timber
Pallets
Landscape materials
Posts
Residual products for milling processesMulch
Potting materials
Woodwaste and barks
LogsWhole logs
HaulingLoading and transportation
HarvestingTimber harvesting
Preliminary cutting
Forestry plant varietiesNew varieties
Land management servicesEcosystem services
Weed management
Fire management
Breeding and research
GOODS PRODUCED AND SERVICES PROVIDED
CONSUMERS
Breeding & researchSilviculture
Genetic modi�cation
Nursery propagation
Domestic retailDistribution
Marketing
Sales
SawmillingReceipt of logs
Measurement
Precision cutting
Tailored production to meet speci�c needs
Market development
Moulding
Treatment
HauliersLog trucking and transport
HarvestersExtraction and on-site processing
Land managementPlanting and forest rotation
Application of fertiliser
Plantation thinning
Resource renewal
ExportDistribution to port
Shipping
Marketing
Sales
PROCESSES AND ACTIVITIES UNDERTAKEN
CONSUMERS

USING VALUE CHAIN MAPPINGP 10
Think of the value chain as an economic system organised around a particular product, such as wheat, or an industry sector, such as forestry (referred to in this manual as cellulose fibre).
The first step is to create a linear chart of the key stages in the chain, from the raw product or design phase to the product’s purchase or use by the end customer. Boxes are used to represent these stages. There is no set number of stages – they should suit the characteristics of the sector – however, between four and six is usually appropriate, and they should be kept reasonably high level and simple.
It is better to group related activities and functions at this level so the stages flow easily across the map. Because each major stage is critical for the segmentation of support tasks required later in the process, it is important to ensure they are relatively distinct at this point. It may be useful to link them at the points where participants change.
The linear chart below is based on the cellulose fibre industry in South Australia, and it demonstrates several segments of activity. It groups breeding processes with forest management, given that both groups of activities are focused on the germinating and growth of raw materials. Sawmilling and secondary processing are also grouped, given that some sawmills take responsibility for both elements, and secondary processing may be undertaken by other parties. Finally, the map distinguishes between export and domestic markets. These are positioned before consumers, given that products might be further adapted or processed prior to use.
Note that this chart does not illustrate the timescales involved, although they could be added if desired. In this example, ‘Breeding and forest management’ takes up to 30 years (to achieve plant maturity), while hauling and harvesting are high volume activities completed in short timeframes (days rather than years). The timeframes for sawmilling and secondary processing can vary, depending on the product.
To complete this element of the chain map, it may be easier to begin at the end – that is, to look at the end product and consumer market, and then ask how the products got there based on earlier stages of activity. Draw the flowchart once each of the major stages has been identified (i.e. raw materials, inputs, collection, processing and production, packaging, transport, marketing, distribution etc.).
Desktop research and drawing on available local knowledge can be useful ways to begin the process of determining activities. Information gained should then be tested, corrected and expanded as analysis progresses. It is best not to try to perfect a map before engaging with participants. Use a first draft as a tool for discussions.
The aim at this stage, as with all stages, is to provide viewers with a quick understanding of the major areas of activity within the sector of interest. The chart should be linear and clean, where possible, rather than illustrating the full complexity of various market sectors.
Step 1: Determining the stages
SUPPORT SERVICES ACROSS THE CHAIN
Raw material suppliersData measuring technologies
Machine and equipment suppliers (sourced internationally)Monitoring and analytics (geo-informatics)
General business servicesEnergy and fuel suppliers
Breeding and forest management
VALUE/SUPPLY CHAIN STAGES
Hauling and harvesting
Sawmilling and secondary processing
Domestic retail channelsExport
CONSUMERS
Forest owners, GrowersManagers
MAIN ACTORS
HauliersHarvesters
Saw millersSecondary processors
Distributors and retailersExporters
CONSUMERS
Domestic retailParticle board & laminate (eg. robes, timber �ooring)
Fencing
Landscaping – decking and trellising
Chipboard, laminate and panelboard
Residues (woodchips, sawdust)
Export productsTimber for pallet assembly - cut to size (small volumes)
Whole logs
Woodchips
Precision mill productsStructural timber
Non-structural timber
Pallets
Landscape materials
Posts
Residual products for milling processesMulch
Potting materials
Woodwaste and barks
LogsWhole logs
HaulingLoading and transportation
HarvestingTimber harvesting
Preliminary cutting
Forestry plant varietiesNew varieties
Land management servicesEcosystem services
Weed management
Fire management
Breeding and research
GOODS PRODUCED AND SERVICES PROVIDED
CONSUMERS
Breeding & researchSilviculture
Genetic modi�cation
Nursery propagation
Domestic retailDistribution
Marketing
Sales
SawmillingReceipt of logs
Measurement
Precision cutting
Tailored production to meet speci�c needs
Market development
Moulding
Treatment
HauliersLog trucking and transport
HarvestersExtraction and on-site processing
Land managementPlanting and forest rotation
Application of fertiliser
Plantation thinning
Resource renewal
ExportDistribution to port
Shipping
Marketing
Sales
PROCESSES AND ACTIVITIES UNDERTAKEN
CONSUMERS
ECONOMIC DEVELOPMENT BOARD - SOUTH AUSTRALIA P 11
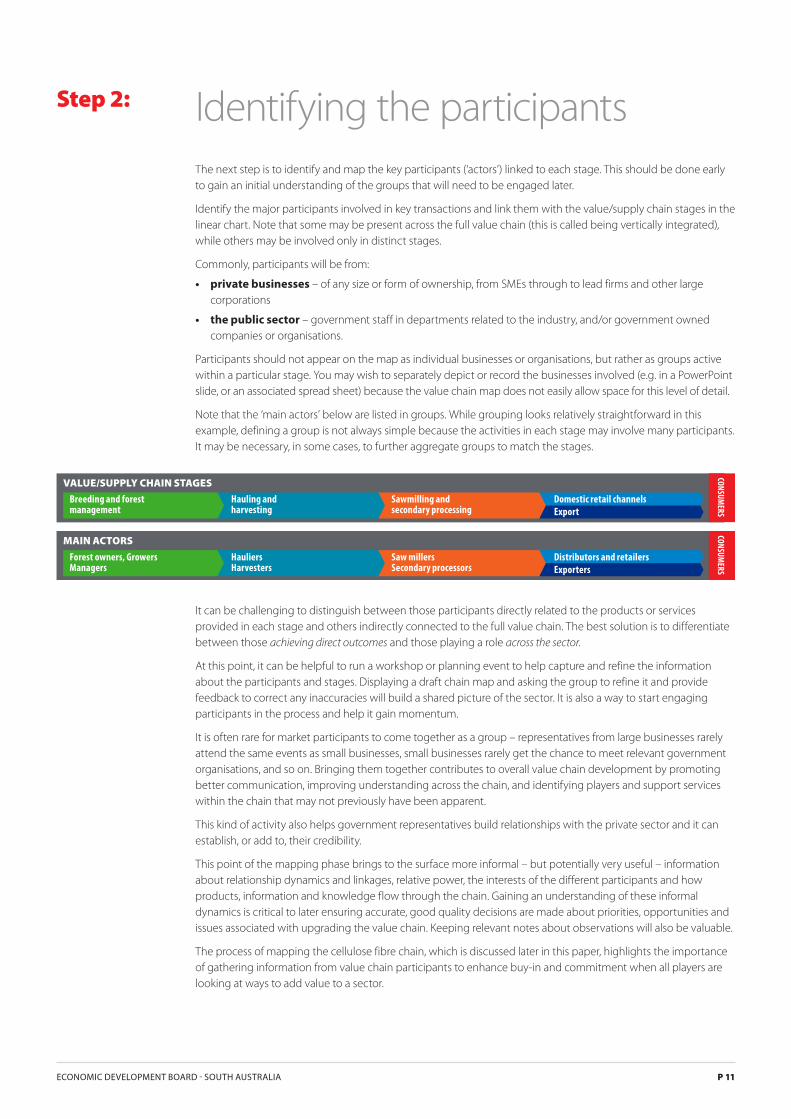
The next step is to identify and map the key participants (‘actors’) linked to each stage. This should be done early to gain an initial understanding of the groups that will need to be engaged later.
Identify the major participants involved in key transactions and link them with the value/supply chain stages in the linear chart. Note that some may be present across the full value chain (this is called being vertically integrated), while others may be involved only in distinct stages.
Commonly, participants will be from:
• private businesses – of any size or form of ownership, from SMEs through to lead firms and other large corporations
• the public sector – government staff in departments related to the industry, and/or government owned companies or organisations.
Participants should not appear on the map as individual businesses or organisations, but rather as groups active within a particular stage. You may wish to separately depict or record the businesses involved (e.g. in a PowerPoint slide, or an associated spread sheet) because the value chain map does not easily allow space for this level of detail.
Note that the ‘main actors’ below are listed in groups. While grouping looks relatively straightforward in this example, defining a group is not always simple because the activities in each stage may involve many participants. It may be necessary, in some cases, to further aggregate groups to match the stages.
It can be challenging to distinguish between those participants directly related to the products or services provided in each stage and others indirectly connected to the full value chain. The best solution is to differentiate between those achieving direct outcomes and those playing a role across the sector.
At this point, it can be helpful to run a workshop or planning event to help capture and refine the information about the participants and stages. Displaying a draft chain map and asking the group to refine it and provide feedback to correct any inaccuracies will build a shared picture of the sector. It is also a way to start engaging participants in the process and help it gain momentum.
It is often rare for market participants to come together as a group – representatives from large businesses rarely attend the same events as small businesses, small businesses rarely get the chance to meet relevant government organisations, and so on. Bringing them together contributes to overall value chain development by promoting better communication, improving understanding across the chain, and identifying players and support services within the chain that may not previously have been apparent.
This kind of activity also helps government representatives build relationships with the private sector and it can establish, or add to, their credibility.
This point of the mapping phase brings to the surface more informal – but potentially very useful – information about relationship dynamics and linkages, relative power, the interests of the different participants and how products, information and knowledge flow through the chain. Gaining an understanding of these informal dynamics is critical to later ensuring accurate, good quality decisions are made about priorities, opportunities and issues associated with upgrading the value chain. Keeping relevant notes about observations will also be valuable.
The process of mapping the cellulose fibre chain, which is discussed later in this paper, highlights the importance of gathering information from value chain participants to enhance buy-in and commitment when all players are looking at ways to add value to a sector.
Step 2: Identifying the participants
SUPPORT SERVICES ACROSS THE CHAIN
Raw material suppliersData measuring technologies
Machine and equipment suppliers (sourced internationally)Monitoring and analytics (geo-informatics)
General business servicesEnergy and fuel suppliers
Breeding and forest management
VALUE/SUPPLY CHAIN STAGES
Hauling and harvesting
Sawmilling and secondary processing
Domestic retail channelsExport
CONSUMERS
Forest owners, GrowersManagers
MAIN ACTORS
HauliersHarvesters
Saw millersSecondary processors
Distributors and retailersExporters
CONSUMERS
Domestic retailParticle board & laminate (eg. robes, timber �ooring)
Fencing
Landscaping – decking and trellising
Chipboard, laminate and panelboard
Residues (woodchips, sawdust)
Export productsTimber for pallet assembly - cut to size (small volumes)
Whole logs
Woodchips
Precision mill productsStructural timber
Non-structural timber
Pallets
Landscape materials
Posts
Residual products for milling processesMulch
Potting materials
Woodwaste and barks
LogsWhole logs
HaulingLoading and transportation
HarvestingTimber harvesting
Preliminary cutting
Forestry plant varietiesNew varieties
Land management servicesEcosystem services
Weed management
Fire management
Breeding and research
GOODS PRODUCED AND SERVICES PROVIDED
CONSUMERS
Breeding & researchSilviculture
Genetic modi�cation
Nursery propagation
Domestic retailDistribution
Marketing
Sales
SawmillingReceipt of logs
Measurement
Precision cutting
Tailored production to meet speci�c needs
Market development
Moulding
Treatment
HauliersLog trucking and transport
HarvestersExtraction and on-site processing
Land managementPlanting and forest rotation
Application of fertiliser
Plantation thinning
Resource renewal
ExportDistribution to port
Shipping
Marketing
Sales
PROCESSES AND ACTIVITIES UNDERTAKEN
CONSUMERS

USING VALUE CHAIN MAPPINGP 12
The next step is to quantify the goods produced and services provided along the chain – those that add value and enhance the product for consumers. It is important to identify exactly where value is being added, or where additional value could be added. In the case of a services sector, such as higher education, the goods and services provided may themselves form the ultimate product, that is, education.
Note that some products may be exported for further processing or distribution before being sold to consumers. In these cases, the eventual buyer may be a player in a much larger supply chain. Exported goods are not depicted on a chain map, yet are relevant for future planning because they may help to identify opportunities for tapping into international markets and generating greater value from them.
Below is a summary of goods and services in the cellulose fibre chain. It breaks down the major outputs (e.g. forestry plant varieties) and sub-components, where these exist. Note that the colour coding continues from the bands established in the earlier steps of mapping, in particular to distinguish products for domestic and export markets. In this chain, many products from sawmilling and secondary processing are ready for domestic retail (sale) and/or export.
Information about goods and services can often be found in existing publications or gleaned from relevant studies. Government stakeholders and participants also may be able to identify good information sources. Armed with relevant information to begin the mapping process, engaging with chain participants once again can help correct inaccuracies and fill gaps. It may be easier to gather information relating to goods and services and processes and activities (the next band) at the same time, given the interconnections.
Step 3: Goods produced and services provided
SUPPORT SERVICES ACROSS THE CHAIN
Raw material suppliersData measuring technologies
Machine and equipment suppliers (sourced internationally)Monitoring and analytics (geo-informatics)
General business servicesEnergy and fuel suppliers
Breeding and forest management
VALUE/SUPPLY CHAIN STAGES
Hauling and harvesting
Sawmilling and secondary processing
Domestic retail channelsExport
CONSUMERS
Forest owners, GrowersManagers
MAIN ACTORS
HauliersHarvesters
Saw millersSecondary processors
Distributors and retailersExporters
CONSUMERS
Domestic retailParticle board & laminate (eg. robes, timber �ooring)
Fencing
Landscaping – decking and trellising
Chipboard, laminate and panelboard
Residues (woodchips, sawdust)
Export productsTimber for pallet assembly - cut to size (small volumes)
Whole logs
Woodchips
Precision mill productsStructural timber
Non-structural timber
Pallets
Landscape materials
Posts
Residual products for milling processesMulch
Potting materials
Woodwaste and barks
LogsWhole logs
HaulingLoading and transportation
HarvestingTimber harvesting
Preliminary cutting
Forestry plant varietiesNew varieties
Land management servicesEcosystem services
Weed management
Fire management
Breeding and research
GOODS PRODUCED AND SERVICES PROVIDED
CONSUMERS
Breeding & researchSilviculture
Genetic modi�cation
Nursery propagation
Domestic retailDistribution
Marketing
Sales
SawmillingReceipt of logs
Measurement
Precision cutting
Tailored production to meet speci�c needs
Market development
Moulding
Treatment
HauliersLog trucking and transport
HarvestersExtraction and on-site processing
Land managementPlanting and forest rotation
Application of fertiliser
Plantation thinning
Resource renewal
ExportDistribution to port
Shipping
Marketing
Sales
PROCESSES AND ACTIVITIES UNDERTAKEN
CONSUMERS

ECONOMIC DEVELOPMENT BOARD - SOUTH AUSTRALIA P 13ECONOMIC DEVELOPMENT BOARD SOUTH AUSTRALIA P 13
Questions to be considered when engaging with value chain participants and stakeholders
• What are the final products produced by the chain?
• Who are the end consumers and where are the markets (local/regional/national/ international)?
• What are the inputs at each stage?
• Who are the participants involved in each stage?
• What are the goods and services provided and activities undertaken?
• What are the core processes in the value chain?
• Who are the participants in the processes and what do they do?
• What interests do the different participants have?
• Is there a key participant in the chain, what is their role and how does that influence the rest of the chain?
• What types of relationships and linkages exist throughout the chain?
• How do products, payments, information and knowledge flow through the chain?
Detailed information may not be included in the final map but will be useful for drafting and refining the value chain components.

USING VALUE CHAIN MAPPINGP 14
Collectively and individually, the processes and activities undertaken along the chain provide a rich mine of information. Even a raw product goes through several stages before it reaches the final customer. At each point the aim is to generate return and support the competitiveness of the broader chain. Identifying these processes and activities and their inter-relationships, in tandem with other elements of the chain map, is important for identifying how value moves along the chain. It also helps pinpoint bottlenecks or further opportunities for value creation.
Production, processing and distribution activities help to illustrate the various business activities or functions involved in producing a particular product (for example, from primary production through transformation and marketing, to final consumption or use).
The processes and activities map for cellulose fibre is shown in the fourth band of the diagram below. The colour schemes are maintained and the major processes are banded together under sub-headings for ease of analysis. Activities often link closely to the production of goods and services, as outlined in the third band.
When mapping processes and activities, it is important to separate functions and operations and present both lines in parallel. This is because, in most cases, a value chain has one functional sequence, several types of enterprises, and different ways of organising production and marketing channels. By separating functions and operators at this point, it becomes clearer later in the analysis stage whether changes needed are institutional (e.g. a closer integration between operators) or technical (e.g. new functions added).
One of the challenges of facilitating interviews or discussion sessions with value chain participants or other stakeholders is to ensure that bottlenecks, issues and fixes do not become the entire focus. When collecting information about processes and activities, it is important to begin by discussing the functional stages of the value chain to identify the participants and their roles, along with the associated processes and activities in each stage.
Step 4: Processes and activities
SUPPORT SERVICES ACROSS THE CHAIN
Raw material suppliersData measuring technologies
Machine and equipment suppliers (sourced internationally)Monitoring and analytics (geo-informatics)
General business servicesEnergy and fuel suppliers
Breeding and forest management
VALUE/SUPPLY CHAIN STAGES
Hauling and harvesting
Sawmilling and secondary processing
Domestic retail channelsExport
CONSUMERS
Forest owners, GrowersManagers
MAIN ACTORS
HauliersHarvesters
Saw millersSecondary processors
Distributors and retailersExporters
CONSUMERS
Domestic retailParticle board & laminate (eg. robes, timber �ooring)
Fencing
Landscaping – decking and trellising
Chipboard, laminate and panelboard
Residues (woodchips, sawdust)
Export productsTimber for pallet assembly - cut to size (small volumes)
Whole logs
Woodchips
Precision mill productsStructural timber
Non-structural timber
Pallets
Landscape materials
Posts
Residual products for milling processesMulch
Potting materials
Woodwaste and barks
LogsWhole logs
HaulingLoading and transportation
HarvestingTimber harvesting
Preliminary cutting
Forestry plant varietiesNew varieties
Land management servicesEcosystem services
Weed management
Fire management
Breeding and research
GOODS PRODUCED AND SERVICES PROVIDED
CONSUMERS
Breeding & researchSilviculture
Genetic modi�cation
Nursery propagation
Domestic retailDistribution
Marketing
Sales
SawmillingReceipt of logs
Measurement
Precision cutting
Tailored production to meet speci�c needs
Market development
Moulding
Treatment
HauliersLog trucking and transport
HarvestersExtraction and on-site processing
Land managementPlanting and forest rotation
Application of fertiliser
Plantation thinning
Resource renewal
ExportDistribution to port
Shipping
Marketing
Sales
PROCESSES AND ACTIVITIES UNDERTAKEN
CONSUMERS

ECONOMIC DEVELOPMENT BOARD - SOUTH AUSTRALIA P 15
Support services are those activities or services required by the sector but not produced by it. They are necessary for the chain to function effectively, but are generally not tied to one stage and are often used across multiple stages. These activities might be much larger than a straightforward domestic value chain, such as the sale of fuel, energy or vehicles. They are often globally connected goods and services activities that serve multiple similar value chains around the world.
Note how support services have been included at the bottom level of the map below.
Step 5: Support services
SUPPORT SERVICES ACROSS THE CHAIN
Raw material suppliersData measuring technologies
Machine and equipment suppliers (sourced internationally)Monitoring and analytics (geo-informatics)
General business servicesEnergy and fuel suppliers
Breeding and forest management
VALUE/SUPPLY CHAIN STAGES
Hauling and harvesting
Sawmilling and secondary processing
Domestic retail channelsExport
CONSUMERS
Forest owners, GrowersManagers
MAIN ACTORS
HauliersHarvesters
Saw millersSecondary processors
Distributors and retailersExporters
CONSUMERS
Domestic retailParticle board & laminate (eg. robes, timber �ooring)
Fencing
Landscaping – decking and trellising
Chipboard, laminate and panelboard
Residues (woodchips, sawdust)
Export productsTimber for pallet assembly - cut to size (small volumes)
Whole logs
Woodchips
Precision mill productsStructural timber
Non-structural timber
Pallets
Landscape materials
Posts
Residual products for milling processesMulch
Potting materials
Woodwaste and barks
LogsWhole logs
HaulingLoading and transportation
HarvestingTimber harvesting
Preliminary cutting
Forestry plant varietiesNew varieties
Land management servicesEcosystem services
Weed management
Fire management
Breeding and research
GOODS PRODUCED AND SERVICES PROVIDED
CONSUMERS
Breeding & researchSilviculture
Genetic modi�cation
Nursery propagation
Domestic retailDistribution
Marketing
Sales
SawmillingReceipt of logs
Measurement
Precision cutting
Tailored production to meet speci�c needs
Market development
Moulding
Treatment
HauliersLog trucking and transport
HarvestersExtraction and on-site processing
Land managementPlanting and forest rotation
Application of fertiliser
Plantation thinning
Resource renewal
ExportDistribution to port
Shipping
Marketing
Sales
PROCESSES AND ACTIVITIES UNDERTAKEN
CONSUMERS

USING VALUE CHAIN MAPPINGP 16
The mapping of value chains in 2013-14 produced four separate sector maps. They each provide insights into value chain mapping methodology.
Chain map examples
Note the major features of this map:
• it includes only three broad stages, reflecting the nature of the resources sector (exploration, production and distribution/export)
• there are more participants than can be shown on the ‘main actors’ band, so these are highlighted at a high level only
• the major areas that support the chain are outlined in the stage ‘processes and activities undertaken’; in some cases, they had yet to commence, however were included to highlight where assistance might be needed to support the development of the sector in the future
• it shows that many support services are required across this relatively complex chain.
Unconventional gas - chain map example
Unconventional gas
SUPPORT SERVICES ACROSS THE CHAIN
VALUE/SUPPLY CHAIN STAGES
CONSUMERS
CONSUMERS
MAIN ACTORS
GOODS PRODUCED AND SERVICES PROVIDED
CONSUMERS
PROCESSES AND ACTIVITIES UNDERTAKEN
CONSUMERS
Licensing, exploration and appraisal Production and processingDomestic distribution and salesExport distribution and sales
Gas explorers (often gas producers), Government regulatorsInfrastructure developers (often governments)
Gas producers, Gas processorsGovernment regulators
Domestic distributors and retailersMarketers and exporters
LicencesExploration licence (St. 1)
Statement of environmentalobjectives (St. 2)
Gas productionExploration drill samples
Gas productionAppraisal servicesActivity approval (St. 3)
Production licence
Pipeline licences
Special facilities licences
Retention licence
Primary productionNatural gas
Secondary processingSales gas
Satellite processingOn-site processing
Managing waste and non-oil resources
Site servicesCatering and camps
Transport
Water
Maintaining gas pipelinesSouth Australia
New South Wales
Queensland
Domestic gas retailPricing
Marketing
Monitoring
Gas exportShipping
Marketing
Monitoring
Infrastructure developmentAccess roads
Processing plant
Flowlines
Establish satellite processing facility
Exploration processesAerial surveys
Geological studies
Investment analysis
Licence applications
Development drilling
Seismic surveys (2d/3d)
Production drillingMud engineering
Coring
Tubing
Casing/liners
Mud logging
Fracture simulation
Guar and proppant
Wireline logging
Bottom hole assembly and pipes
Well site investigation
Rig move package
Rig crew
Drilling rigs
Drill bits
Drilling and contractors
Wellsite servicing rig
Cementing
Liquid exportsGladstone (QLD) (from mid-2014)
Port Bonython (SA) (prospective)
Darwin (NT)
Research and business servicesLegal and business servicesWaste management
Environmental investigation/monitoringEconomic and system modellingInvestment analysis
Anthropological researchGeotechnical designSite services (catering and camps)
Transport servicesEquipment servicesWater supply
Retail natural gas marketResidential and commercial 24%*
Industrial 43%*
Power generation 33%*

ECONOMIC DEVELOPMENT BOARD - SOUTH AUSTRALIA P 17
The major features of this map are that it:
• includes data about secondary processing activities, along with the proportions of product used domestically, relative to export
• has more stages than the cellulose fibre map, reflecting relatively distinct groups of actors at each stage
• includes costs (light green) and quality (orange) bands at the bottom; this is one way to flag additional information without crowding the primary chain map (‘additional’ maps are discussed in the section titled ‘Incorporating additional information’).
Grain (focusing on wheat)
Domestic useExport
Secondary processingBulk grainStorage, handling and freightFarm production
CONSUMERS
PROCESSES AND ACTIVITIES UNDERTAKEN
FarmingLand management
Seed selection and sowing
Control of weeds, pests and diseases
Irrigating and cultivating
Harvesting and loading
SUPPORT SERVICES ACROSS THE CHAIN
Farmers federations/representationInfrastructure investment and operationPrice and stock level information
Government grants and research fundingCompetition settings (e.g. ACCC access undertakings)Regulatory settings (e.g. wheat classi�cation system grain industry code of practice)
Education for growers (e.g. university)Water allocation and land management
VALUE/SUPPLY CHAIN STAGES
CONSUMERS
CONSUMERS
MAIN ACTORS
GOODS PRODUCED AND SERVICES PROVIDED
CONSUMERS
Breeding and research
Distributors and retailersPort and shipping operators
ProcessorsBulk grain handlers, Grain traders
Bulk handlers, TransportersGrain tradersFarmers and growersBreeders, Geneticists
Researchers
BreedersNew varieties
Market intelligenceUser research
ResearchGenetic research
Farm practice research
Climatic and agronomic research (frost, drought, salinity, nutrient e�ciency, disease, functionality)
BreedersNational variety trials
End-market foresightingDemand forecasting
Market analysis
Wheat grain
Port handlingIntake and receival
Grain storage
Storage to ship (weigher and belt)
Ship loader
Shipping
Secondary processingFood manufacturing and processing
Blending and segregation
Handling, storage and fumigation
Truck or rail transport
Handle, store, fumigate
Truck or rail transport
Grain quality assessment
Secondary productsMalt domestic andexport markets
Wheat �our domestic and limited export
Pasta production domestic and export
Rolled oats, bran �our domestic and limited export
Domestic distribution Retail distribution of pasta, wheat and other consumables
Retail distribution of animal feed
Port handling and exportGrain storage
Shipping
On-farm storage or transport to receival port
Research activitiesScienti�c research
Field research
Value chain costs
Maximising quality and value across the wheat ecosystem
-15%
- 85%
20kMT
100kMT
50kMT
240kMT pa
Grain (focusing on wheat) - chain map example
USING VALUE CHAIN MAPPINGP 18
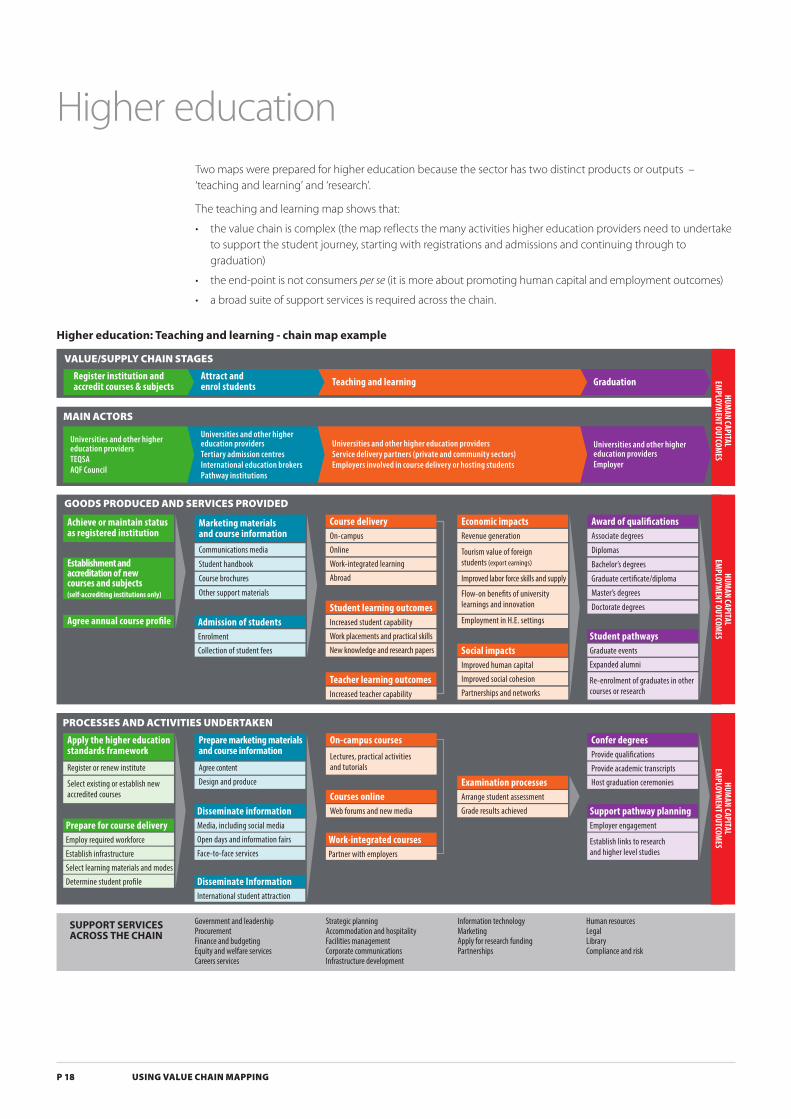
Two maps were prepared for higher education because the sector has two distinct products or outputs – ‘teaching and learning’ and ‘research’.
The teaching and learning map shows that:
• the value chain is complex (the map reflects the many activities higher education providers need to undertake to support the student journey, starting with registrations and admissions and continuing through to graduation)
• the end-point is not consumers per se (it is more about promoting human capital and employment outcomes)
• a broad suite of support services is required across the chain.
Higher education
SUPPORT SERVICES ACROSS THE CHAIN
Government and leadershipProcurementFinance and budgetingEquity and welfare servicesCareers services
Strategic planningAccommodation and hospitalityFacilities managementCorporate communicationsInfrastructure development
Information technologyMarketingApply for research fundingPartnerships
Human resourcesLegalLibraryCompliance and risk
GOODS PRODUCED AND SERVICES PROVIDED
Agree annual course pro�le
Achieve or maintain status as registered institution
Establishment and accreditation of new courses and subjects(self-accrediting institutions only)
Marketing materials and course informationCommunications media
Student handbook
Course brochures
Other support materials
Course deliveryOn-campus
Online
Work-integrated learning
Abroad
Student learning outcomesIncreased student capability
Work placements and practical skills
New knowledge and research papers
Teacher learning outcomesIncreased teacher capability
Admission of studentsEnrolment
Collection of student fees
Economic impactsRevenue generation
Tourism value of foreign students (export earnings)
Improved labor force skills and supply
Flow-on bene�ts of university learnings and innovation
Employment in H.E. settings
Award of quali�cationsAssociate degrees
Diplomas
Bachelor’s degrees
Graduate certi�cate/diploma
Master’s degrees
Doctorate degrees
HUMAN CAPITAL
EMPLOYM
ENT OUTCOMES
Social impactsImproved human capital
Improved social cohesion
Partnerships and networks
Student pathwaysGraduate events
Expanded alumni
Re-enrolment of graduates in other courses or research
Universities and other higher education providersEmployer
GraduationTeaching and learning
VALUE/SUPPLY CHAIN STAGES
HUMAN CAPITAL
EMPLOYM
ENT OUTCOMES
MAIN ACTORS
Universities and other higher education providersTertiary admission centresInternational education brokersPathway institutions
Universities and other higher education providersTEQSAAQF Council
Universities and other higher education providersService delivery partners (private and community sectors)Employers involved in course delivery or hosting students
Attract and enrol students
Register institution and accredit courses & subjects
HUMAN CAPITAL
EMPLOYM
ENT OUTCOMES
Apply the higher education standards framework
Register or renew institute
Select existing or establish newaccredited courses
Prepare for course deliveryEmploy required workforce
Establish infrastructure
Select learning materials and modes
Determine student pro�le
Prepare marketing materials and course information
Agree content
Design and produce
Disseminate informationMedia, including social media
Open days and information fairs
Face-to-face services
Disseminate InformationInternational student attraction
On-campus coursesLectures, practical activities and tutorials
Courses onlineWeb forums and new media
Work-integrated coursesPartner with employers
Examination processesArrange student assessment
Grade results achieved
Confer degreesProvide quali�cations
Provide academic transcripts
Host graduation ceremonies
Support pathway planningEmployer engagement
Establish links to research and higher level studies
PROCESSES AND ACTIVITIES UNDERTAKEN
Higher education: Teaching and learning - chain map example

ECONOMIC DEVELOPMENT BOARD - SOUTH AUSTRALIA P 19ECONOMIC DEVELOPMENT BOARD SOUTH AUSTRALIA P 19
The second map illustrates research value. It bears some similarity to the teaching and learning map, particularly in relation to the main actors and support services across the chain.
Commercialisation and knowledge transferFinalise research
SUPPORT SERVICES ACROSS THE CHAIN
Governance and leadershipProcurementsFinance and budgetingEquity and welfare servicesCareers services
Strategic planningAccommodation and hospitalityFacilities managementCorporate communicationsInfrastructure development
Information technologyMarketingApply for research fundingPartnerships
Human resourcesLegalLibraryCompliance and risk
GOODS PRODUCED AND SERVICES PROVIDED
Conduct researchResource research activities
VALUE/SUPPLY CHAIN STAGES
KNOWLEDGE
COMM
ERCIAL OUTCOMES
KNOWLEDGE
COMM
ERCIAL OUTCOMES
KNOWLEDGE
COMM
ERCIAL OUTCOMES
MAIN ACTORS
Establish research �elds
UniversitiesOther higher education providers
UniversitiesOther higher education providers
UniversitiesOther higher education providers
Institute research prioritiesResearch specialities
Fields of study
Funding securedCompetitive research grants
Commercial funding
Philanthropic donations or scholarships
Cross-subsidisations from teaching and learning
Research program resourcedHigher degree research students attracted
Supervisors established
Research partners agreed
Research activitiesExperimental development
Applied research
Strategic basic research
Pure basic research
Research quali�cationsDoctorates
Master’s research degrees
Institutional standingAdditional research funding
Improved institute standing
Improved skills of researchers
Knowledge generation and sharing
Commercial outcomesInvention disclosures
Patents
Plant breeder rights
Commercialisation partnerships
Product adaptations
Human capital outcomesEntrepreneurship andcommercialisation skills
Establish research policiesEstablish �elds of research expertise
Determine goals and priorities
Agree research quali�cations
Attract support for researchAttract students and others to research
Apply for research funding
Attract philanthropic support
Establish partnerships and collaborations
Conduct and manage researchSupervise researchers
Support research sta�
Work with research partners
Review and assessPeer review process
Assessment
Review research performance and impact
PublishPrepare journal submissions and other manuscripts
Share �ndings through other media and forums
Gauge research impactExcellence in research ratings
Number of citations
Research consultancy values
Student completions of higher degree by research
Licences, options and assignments
Material transfer agreements with corporations
UniversitiesOther higher education providersPrivate sector
Universities and other higher education providersResearch partners
PROCESSES AND ACTIVITIES UNDERTAKEN
Higher education: Research - chain map example

USING VALUE CHAIN MAPPINGP 20
Having prepared the basic value chain map, a deeper focus will help reveal what creates value in the chain. The drivers of value relate to quality and quantity, and both are important to understand.
Qualitative drivers include the dynamics of relationships and power and communication along the chain and across the value network.
Quantitative drivers are elements such as the number of participants, volumes of produce or the market share of particular segments in the chain.
Examining these will clarify both blockages and opportunities in the chain. Considering options for removing or taking advantage of them will help to prioritise support activities. Adding figures and weightings to the original map can help when looking at barriers and opportunities for upgrading, or for weighting potential support, intervention and policy activities.
Additional information might be based on qualitative discussions about opportunities and risks at each stage of the chain, or it might be based on quantitative information, such as the presence of pricing information or volumes.
It can be useful to create maps that present a picture of the desired or possible future states of the value chain. These can then be considered alongside the original, allowing users to ‘zoom in’ on relevant details. In the four case studies for the EDB, additional maps were developed to show:
• key actors involved in the chain, their inter-relationships and roles
• the flow of goods, services, payments and information along the chain
• linkage points and potential gaps or blockages between value chain participants.
The following examples show how additional maps were developed to support the original cellulose fibre and grain (wheat) value chain maps. They show how chain maps can be enriched to make analysing them easier and more productive.
Incorporating additional information
The cellulose fibre sector in South Australia was part of an intense value chain study conducted before the mapping process began in November 2013. A good deal of information was therefore available and consideration had already been given to identifying options to upgrade the value chain to generate additional revenue.
Participants in the sector were collaborating well and productive relationships had been formed between government and business. The sector had a champion at senior level in the South Australian Government, EDB member and Chair of the Advanced Manufacturing Council, Professor Göran Roos. Professor Roos gave the engagement process a high level of credibility and this promoted quality interaction between the government, the cellulose fibre sector and stakeholders.
Example 1: Additional information for the cellulose fibre chain map

ECONOMIC DEVELOPMENT BOARD - SOUTH AUSTRALIA P 21
A great deal of current and dynamic literature, tailored to the South Australian context, was on hand. It was clear that the chain map could be augmented with a deeper picture of the sector and more information about options for upgrading the value chain. Discussions with both government and industry helped significantly.
The first additional information map focused on possible futures for the sector, building on information prepared during the two years of value analysis. It illustrated several different options, from developing more precise methods of completing existing tasks, through to very different uses for forestry products.
This information was then linked to the chain map and became a clear illustration of how the industry could look in the future. This was useful not only for discussion with the sector participants and stakeholders but also for future value chain analysis.
Domestic retail channelsExport
Sawmilling and secondary process Hauling and harvesting
VALUE/SUPPLY CHAIN STAGES
CONSUMER DEM
AND
Breeding and forest management
Land managementSilviculture
Breeding and genetics
Raw material suppliers
Land management and resource renewal services
HauliersLog trucks and transport
HarvestersExtraction and on-site processing equipment
Sawmills
ADDITIONAL NEEDS FOR ADVANCED VALUE CHAIN DEVELOPMENT
Planning and investmentResearch & development
Workforce education (technical and higher education)Technology upgrades
1. Traditional sawmills for precision products
Construction and building industry
Houses and built environment
Value added building materialsCLT
Glulam
Oriented strand board
Advanced building
materials lens
Domestic energy
Residual productsBiofuel
Biodiesel
Energy lens
Retail uses
Packaging and printing
Residual productsPulp and paper
Cellulose
Chemicals
Chemical lens
Health
Food industry
Packaging industry
Advanced biomass-based process industry
Advanced pulp and paper
New chemicals from biomass extracts
Molecular lens
Built infrastructure
Transport
Other industries
Advance biomass-based process industry
Regenerated fibres
Nanocellulose
Structural composites
Atomic lens
2. Specialised sawmills for high-end value added products
3. Diversified advanced sawmills for tailored uses
DEVE
LOPM
ENTA
L AN
D OP
ERAT
IONA
L CO
MPL
EXIT
YMass lens: Increasing the e�ciency of production, modernising equipment, improving business strategies, yet focusing on traditional end products
Low value addRisk in high cost environment
Advanced building materials lens: Production processes for higher value wood-based materials - Cross Laminated Timber (CLT), Glued Laminated Timber (Glulam), Oriented Strand Board (OSB)
Medium value addConsumer demand and cost queries
Energy lens: Maximising value of wood wastes for energy and fuel productionthrough biore�neries and sidestreams
Capturing additional value through residues
Chemical lens: Developing advanced chemical products for the pulp, paper and packaging sectors
Medium value addProduction facilities required
Molecular lens: Second/third generation biore�neries that could produce speci�c recyclable chemicals and may, for example, displace the need for plastics (bioplastics)
High value addTechnological innovation need
Atomic lens: The manipulation of nanoscale properties of wood �bres to open new possibilities, such as nanocellulose and di�erent kinds of materials
Highest value addAdvanced technological innovation need

USING VALUE CHAIN MAPPINGP 22
A summary of the various uses for cellulose fibre was also prepared to show where South Australia was playing a role and where new opportunities lay. ‘Current’ activities were grouped with circles to indicate the limited use of the state’s forest resources. This highlighted the extent of the opportunities not being recognised or leveraged and helped push the boundaries of thinking about the sector.
Finally, based on a desktop analysis and discussions with sector representatives, the following list of challenges and opportunities was compiled.
Findings - cellulose fibre Additional value could be generated from South Australia’s forestry resources through involvement in production of higher value activities.
• the cellulose fibre value chain has historically focused on production for domestic construction purposes, with excess, low grade and additional raw materials largely exported for further processing and use abroad
• the industry faces increasing pressure to maintain its competitiveness in both domestic and international markets, with recent efforts largely directed towards cost reduction
• the industry is further exploring precision tools for both harvesting and sawmilling to maximise resource value and to reduce wastage, thereby maximising product values
• more significant shifts are only beginning to be explored
• failure to realise higher values from the cellulose fibre incurs an opportunity cost
- foregone revenues for producers and sawmillers
- lack of involvement in domestic and global markets in which Australia may have advantages; this may result in a continued reliance on imports of higher-value products that Australia could make
- reduction in total export values
- continued industry exposure and profitability risks in the sector, given competition in the global market for lower-value cellulose fibre products
- limited long-term educational and human capital benefits associated with continued involvement in low-complexity production processes and markets
• the recent VTT4 studies supported industry and government to identify further value chain opportunities, but pathways to their achievement remain largely unclear.
Outcomes achieved Because the mapping processes for cellulose fibre drew on existing information and expertise, further deep engagement with industry (for data collection or validation purposes) was not required.
The findings highlighted the additional value that could be generated from forestry resources through higher value activities.
MECHANICAL PULP & PAPER MILL
Minerals
Biofuel
CO2 captureChemicals
Electricity
Sawdust
Forest
Chemicals
Power
Steam
District heating
Paper products
Fibre based products
High value products
Natural chemicals
Waste �bres
Opportunities currently captured in South Australia Gasi�er/Boiler
Biomass
Forest residuals
4 Footnote: See References

ECONOMIC DEVELOPMENT BOARD - SOUTH AUSTRALIA P 23
Domestic useExport
Secondary processingBulk grainStorage, handling and freightFarm production
CONSUMERS
PROCESSES AND ACTIVITIES UNDERTAKEN
FarmingLand management
Seed selection and sowing
Control of weeds, pests and diseases
Irrigating and cultivating
Harvesting and loading
SUPPORT SERVICES ACROSS THE CHAIN
Farmers federations/representationInfrastructure investment and operationPrice and stock level information
Government grants and research fundingCompetition settings (e.g. ACCC access undertakings)Regulatory settings (e.g. wheat classi�cation system grain industry code of practice
Education for growers (e.g. university)Water allocation and land management
VALUE/SUPPLY CHAIN STAGES
CONSUMERS
CONSUMERS
MAIN ACTORS
GOODS PRODUCED AND SERVICES PROVIDED
CONSUMERS
Breeding and research
Distributors and retailersPort and shipping operators
ProcessorsBulk grain handlers, Grain traders
Bulk handlers, TransportersGrain tradersFarmers and growersBreeders, Geneticists
Researchers
BreedersNew varieties
Market intelligenceUser research
ResearchGenetic research
Farm practice research
Climatic and agronomic research (frost, drought, salinity, nutrient e�ciency, disease, functionality)
BreedersNational variety trials
End-market foresightingDemand forecasting
Market analysis
Wheat grain
Port handlingIntake and receival
Grain storage
Storage to ship (weigher and belt)
Ship loader
Shipping
Secondary processingFood manufacturing and processing
Blending and segregation
Handling, storage and fumigation
Truck or rail transport
Handle, store, fumigate
Truck or rail transport
Grain quality assessment
Secondary productsMalt domestic andexport markets
Wheat �our domestic and limited export
Pasta production domestic and export
Rolled oats, bran �our domestic and limited export
Domestic distribution Retail distribution of pasta, wheat and other consumables
Retail distribution of animal feed
Port handling and exportGrain storage
Shipping
On-farm storage or transport to receival port
Research activitiesScienti�c research
Field research
Value chain costs
Maximising quality and value across the wheat ecosystem
-15%
- 85%
20kMT
100kMT
50kMT
240kMT pa
Because of the history and size of the grain sector in South Australia, a great deal of literature is available. The original map aimed to provide a simple presentation of the general flow of products, processes and activities across the value chain. Government staff and industry participants found that being able to ‘see the whole sector’ on a single page gave them valuable perspective.
So much information was gathered that it became a challenge to determine how to incorporate it all. After further discussion with participants and stakeholders, it was decided to focus on particular areas of information by incorporating data on additional linked maps.
Two supporting maps were prepared – one in light green and one in orange. The titles of those maps were then added to the original, using colour banding, to indicate that more information was available elsewhere. The bands are shown below, bounded by the red-dotted border.
Example 2: Additional information for the grain (wheat) chain map

USING VALUE CHAIN MAPPINGP 24
Farm production Storage, handling and freight Port handling and export
International grain price
Breeding and Research
Value chain cost analysis for export markets
• End-point royalties paid to breeders (�at rate based on varieties used)• There are long lag times between initial investment and adoption of innovations (up to 20 years)• As a result, may be a lack of incentives for private sector investment
• Farmers returns in�uenced by decisions on: - grain types and fertilisation - storage destinations and durations - contract or spot prices - sale to bulk handlers or grain traders - use of on-farm technologies• Grains Research and Development Corporation levy is payable on farmer incomes• S.A. based levies (e.g. SAGIT) also payable
• Fee payable to bulk handlers (eg Export Select service fromreceival to port)• Vitarra has introduced a surcharge for deliveries to Tier 2 receival (less e�cient) to in�uence supply chain decisions• Alternative storage and transport may be available via grain traders who purchase shipping slots for export• In some cases grain traders contains wheat to thip via alternate ports, including interstate, to alternate markets• Application of qaulity tests at receival impact on fees earned by farmers for their product• Handling and export charges applied including dust, shrinkage, recieval fees, freight, storage, out turn and vessel loading• Farmers returns in�uenced by decisions on:
• Wheat export charges• Import levies• Shipping costs (variable by destination)• International grain price is in�uenced by supply, which is in turn in�uenced by climatic and temporal factors (e.g. southern hemisphere summer)
End-point royalties Farm gate price Bulk handling and port charges
-1%
-0.5% -1%
-30%
Farm gate price
-3 to 10%
Farm gate price reductions Bulk handling and port charges Shipping costs by distance
State based levies
R&D levy
-$25-$3
Indonesia Japan
-$19
China
-0.1-0.25%
-0.5-0.7%
Dust Shrinkage Freight fees
Receivalfees
Monthlystorage
fees
Out turncharge
Vesselloading
-60 to 66%
-4c per km -$11 -$1.10 -$2.60 -$13.20
Costs (US$/tonne)
shipping costs ex WA
The ‘value chain costs’ green band drew on quantitative information contained in a draft paper by the Australian Export Grains Innovation Centre (AEGIC)5 about the cost of Australia’s bulk grain export supply chains. It demonstrates the flow of value across the chain. Note that the stages from the original chain map were used with one exception – the AEGIC report that focused on export prices and domestic markets was not included. Breakout boxes below the diagram provide further detail that explains the prices.
5 Footnote: See References

ECONOMIC DEVELOPMENT BOARD - SOUTH AUSTRALIA P 25
Bulk grain
Secondary processing
Export
Domestic use
Domestic use
Farm production Storage, handling and freightBreeding and Research
DIVERSIFIED DOMESTIC AND INTERNATIONAL M
ARKETS
Three major breeding companies• Intergrain• Australian Grain Technologies (AGT)• Longreach Plant Breeders
Specialist company (small)• HRZ Wheats
Research and development• GRDC• CSIRO• Universities• States and Territory Governments
Family farms• Trusts• Partnerships
Companies
Multinational farms• Large scale
Bulk handlers• Cooperative Grain Handling CGH (90-95% of WA)• GrainCorp (75% of East Coast)• Viterra (80% of SA)
Main actors in the South Australian grain market
Smaller bulk handlers Carghill (NSW, Vic, SA)Emerald (Vic)
Grain tradersUp to 25 trading companies
ExportPort handlingTransport
Transport
Receival
Secondary processing
Receival
ExportContainerised wheatto alternate ports
• Wheat contamination through unsanitary handling and chemical use• Incorrect assessment at receival or loading• Lack of feedback mechanisms for buyers• Limited competition and cost transparency within ports
• Limited added value in favour of bulk export• Lack of economy of scale for processing onshore rather than o�shore• Majority of existing processing undertaken on the East Coast• Lack of grower awareness of high-value add potential• Cost of establishing infrasructure for value added food processing
• Incorrect declaration of varieties• Poor management of receival standards• Poor storage conditions• Introduction of contaminants• Poor categorisation, segregation, or blending• Added costs to transport to segregation facilities• Ine�cient logistics infrastructure, particularly rail
• Crop contamination through pests, disease, chemicals or foreign matter• Cross contamination between farms• Variability of climatic conditions• Soil treatment and management• Ine�cient on-farm infrastructure• Use of genetically modi�ed crops• Focus on yield over quality
• Lack of resources and investment for new variety research• Lack of incentives for private sector investment• Insu�cient breeder returns• Restricted communication of breeder research �ndings• Lag time to commercialise new varieties (up to 12 years)
• Market information to buyers• Regulation of exporters• Multi-residue screening• Trade-back investigations following poor customer feedback• Competition for export between grain traders and bulk handlers• Diversity of export marketing and sale
• Deregulation has promoted diversi�ed product lines and products for export, which may encourage secondary processing in the longer term
• Receival Code of Practice for storage facilities• Storage hygiene standards (regular checks, air�ow, aeration) and infrastructure• Storage and Handling Agreements (between growers and storage operators)• Wheat classi�cation systems
• Growers skills and grain variety selection• Grower management capabilities• E�ective soil treatment and management• On-farm technology, including for harvesting• On-farm storage availability• Quality assurance processes• Transportation standards to receival points
• Short and long-term data about end-user preferences, including functional and regulatory requirements• Availability of wide choice of varieties suited to climatic conditions, linked to end-price information and demand forecasts
DRIVERS OF HIGH QUALITY AND VALUEW
HEAT ECOSYSTEMRISKS TO HIGH QUALITY AND VALUE
Farm production Storage, handlingand freight
Bulk grain
Secondary processing
Export
Domestic useBreeding and Research
The red band in the map below drew on qualitative information from a review of literature about the drivers of opportunities and risks involved with increasing the quality of South Australian wheat. The stages from the original map were again used, this time to indicate where improvements could be made.
A further breakout chart was included to provide a deeper picture of the role of participants across the chain. A diagram like this could be developed for any sector.
One negative aspect of mapping such a large sector is the limited detail that can be included to illustrate the breadth of customers, their preferences and the full variety of diversified product streams. While these were captured at a high level in this example, it was difficult to delve deeper into the different customer segments and their needs. Nonetheless, the chain maps provided a good basis for discussion with participants and stakeholders.

USING VALUE CHAIN MAPPINGP 26
Mapping the value chains of four industry sectors important to South Australia proved particularly valuable:
• a new design for chain mapping evolved and it subsequently formed the basis of this manual
• the map creators were able to test and demonstrate the benefits of inviting participants to be part of the process; the results were more accurate mapping and the formation of valuable collaborative relationships
• a common approach, or methodology for mapping can now be used across government and different industry sectors; there are obvious benefits in being able to compare and align different maps.
Participants and stakeholders found the maps useful and provided the following feedback:
• the high-level chain maps produced provide an ideal basis for deeper value chain analysis; in particular, the maps will facilitate engagement with sector participants around processes and activities to improve or upgrade value chains
• maps are of greater benefit when a consistent method is used across different sectors; it reduces rework in the longer term and helps different entities coordinate their own mapping capabilities
• the maps are popular with public and private sector participants and stakeholders because they aid business planning and development activities
• the mapping process works effectively across different industry sectors.
Chain mapping has other benefits, too:
• it helps identify weak links in the chain so they can be addressed
• maps unpick the flow of knowledge and resources, helping to make all businesses in the chain more productive and profitable
• the participation process improves links and relationships between businesses; this leads to the identification of issues and bottlenecks and ways to address them
• opportunities for new or alternative chain actors can be identified, for example, by linking local firms to global value chains, or linking the entire chain to new, additional lead firms.
Once the value chain processes and activities are identified through chain mapping, discussions among decision makers can turn to the key areas of support required, and to improvements within and across sectors. These can include:
• upgrading strategies – improving the value created by a chain
• improving business models – promoting improved ways of doing business
• promoting inclusive trading relationships – supporting cooperation
• supporting product value propositions – promoting high-value ideas.
Finally, to reiterate, maps are particularly useful for analysing and researching value chains to determine how they are performing or how they can be improved or refined. Maps make analysing the value chain so much easier, not only because they are a visual depiction of what is going on but because of what the mapping process reveals in terms of strengths, weaknesses, participant capability, relationships and so much more.
Mapping in summary

ECONOMIC DEVELOPMENT BOARD - SOUTH AUSTRALIA P 27
Australian Export Grains Innovation Centre (2014) The cost of Australia’s bulk grain export supply chains http://www.aegic.org.au/programs/supply-chain.aspx
Business Council of Australia (2014) Building Australia’s Comparative Advantages. http://www.bca.com.au/publications/building-australias-comparative-advantages
Department for Manufacturing, Innovation, Trade, Resources and Energy (2012) Manufacturing Works, Adelaide http://www.statedevelopment.sa.gov.au/upload/manufacturing/781_manufacturing_strategy_full_version(1).pdf?t=1421629852256
Department for Manufacturing, Innovation, Trade, Resources and Energy (2012) Roadmap for Unconventional Gas Projects in South Australia, Adelaide. http://www.petroleum.dmitre.sa.gov.au/SA_Unconventional_Gas_roadmap
Gray, E, Oss-Emer, M & Davidson, A (2013): Looking beyond the farm gate - Closer vertical coordination along value chains as a means of improving farm performance. Science and economic insights, issue 1. data.daff.gov.au
Herr, ML and Muzira, TJ (2009): Value chain development for decent work: a guide for development practitioners, government and private sector initiatives. International Labour Office
Kaplinsky, R. and M. Morris (2002): Handbook for value chain research, IDRC. http://www.ids.ac.uk/ids/global/pdfs/VchNov01.pdf
Kerr, F (2014): Mapping the Value in Value Chains: Executive Summary. EDB
Kerr, F & Tulloch, C (2014): Application of Value Chain Mapping Methodologies: Cellulose Fibre, Unconventional Gas, Grain, Higher education. EDB presentation
Lundy, M et al (2012). LINK methodology: A participatory guide to business models that link smallholders to markets, Cali,CO: Centro Internacional de Agricultura Tropical (CIAT Publication No. 380), ISBN 978-958-694-114-3 (PDF)
Morris, M (2001): Creating Value-chain Cooperation. IDS Bulletin Vol 32 no 3
Nang’ole EM, Mithöfer D and Franzel S (2011): Review of guidelines and manuals for value chain analysis for agricultural and forest products. ICRAF Occasional Paper No.17.Nairobi: World Agroforestry Centre
Stamm, A and Drachenfels, C (2011): ILO Value Chain Development: Approaches and activities by seven UN agencies and opportunities for interagency cooperation. International Labour Office, Geneva, 2011.
Stewart, G and Chakraborty, A (2010). Service Identification through Value Chain Analysis and Prioritization. Proceedings of the sixteenth Americas Conference on Information Systems, Lima, Peru. August 12-15. eprints.qut.edu.au
Subramanian, U. (2007). Moving Towards Competitiveness: a value chain approach. agris.fao.org
Ahlqvist T, Vanderhoek N, Dufva M, Kettle J, Valovirta V, Kivimaa A, & Loikkanen T. (2013) South Australian Cellulosic Value Chain Technology Roadmap. Stage 1. Assessment of the present state and future potential of forest industry in Mt Gambier region, South Australia. VTT Customer Report. Public. VTT-CR-02233-13.
Ahlqvist T, Kettle J, Hytönen E, Niemelä K, Kivimaa A, Vanderhoek N, Dufva M, Mäkinen T, Kurkela E & Valovirta V. (2013) Stage 2. Future options for the cellulosic fibre value chain in the Green Triangle, South Australia: strategic technology roadmaps, business cases and policy recommendations. VTT Customer Report. Public. VTT-CR-04761-13
Weijermars, R (2010): Value chain analysis of the natural gas industry - Lessons from the US regulatory success and opportunities for Europe. Journal of Natural Gas Science and Engineering 2 (2010) 86-104
See additional resources at:
Primary Industries and Regions South Australia, http://www.pir.sa.gov.au/valuechains
The World Bank, http://www.worldbank.org
The International Labour Organisation, http://www.ilo.org
United Nations Industrial Development Organization, www.unido.org
References
USING VALUE CHAIN MAPPINGP 28
www.economicdevelopmentboardsa.com.au
ContactECONOMIC DEVELOPMENT BOARD
The Department of State Development Level 4, 11 Waymouth Street Adelaide, South Australia 5000
T: +61 8 8226 3821
Published January 2015.
No responsibility for any loss or damage caused by reliance on any of the information or advice provided by or on behalf of the state of South Australia, or for any loss or damage arising from acts or omissions made, is accepted by the state of South Australia, their officers, servants or agents. Produced by the Department of State Development © January 2015. Content correct at time of printing.