using the stallings observation system to investigate … · using the stallings observation system...
TRANSCRIPT

1
Using the Stallings Observation System to Investigate
Time on Task in Four Countries
Jane A. Stallings
Stephanie L. Knight
Texas A&M University
David Markham
This paper presents the history of the Stallings Observation System (SOS) and
describes the adaptation of the SOS instrument, training for its use in international settings,
and results from four countries of the World Bank International Time on Task (ITOT)
project. The ITOT project had three major goals: 1) to discover how instructional time is
used at different levels in certain countries, particularly in rural and low income areas; 2) to
identify obstacles to optimal use of instructional time; and 3) to encourage governments to
take the necessary measures to provide students with optimal time for learning (Abadzi,
Millot, & Prouty, 2004). In order to address ITOT at the classroom level, a pilot study in
Tunisia was conducted that targeted four related objectives: 1) adaptation of the Stallings
Snapshot observation instrument for use in project classrooms; 2) design and
implementation of training for observers; 3) determination of reliability and validity of
observation procedures; and 4) generation of a sample profile of classrooms in a Tunisian
elementary school. This paper summarizes the training and findings from the initial pilot
study of time usage at the classroom level conducted in Tunisia in January, 2004 and the
training and results from subsequent ITOT studies in four countries: Tunisia, Morocco,
Ghana, and Brazil. More specifically, sections of the paper provide an overview of the
research on effective use of instructional time using the Stallings instrument, description of
the adaptation of the Stallings Snapshot observation instrument for use in the project, a
summary of the training and procedures developed for the pilot study and implemented in
four countries, and the results and conclusions from the observational studies in four
countries.
Pub
lic D
iscl
osur
e A
utho
rized
Pub
lic D
iscl
osur
e A
utho
rized
Pub
lic D
iscl
osur
e A
utho
rized
Pub
lic D
iscl
osur
e A
utho
rized
Pub
lic D
iscl
osur
e A
utho
rized
Pub
lic D
iscl
osur
e A
utho
rized
Pub
lic D
iscl
osur
e A
utho
rized
Pub
lic D
iscl
osur
e A
utho
rized

2
Effective Use of Instructional Time
The use of direct observation in classrooms over the past thirty years has resulted in
the accumulation of an impressive body of information about the nature of effective
teaching (Brophy & Good, 1986; Good & Brophy, 2000). Results of studies in the United
States indicate that the way teachers use time and employ academic activities in
classrooms impacts student achievement (Good & Brophy, 2000). In fact, students’
opportunity to learn related to time on task is often referred to as the most important
predictor of student achievement (Berliner & Biddle, 1995).
Research and Evaluation Using the SOS
The Stallings Observation System (SOS) was initially developed to measure the
level of teachers' implementation of twelve early childhood and elementary school Head
Start and Follow Through models, and was modified for use in secondary classrooms in
1977. The system was developed to evaluate a broad array of educational programs. The
challenge was to evaluate the total content of classrooms: materials, activities, grouping
arrangements, use of classroom aides, interaction patterns among teachers and students,
and the affective tone of the classroom. Since its development, the SOS has been used in
all grades from kindergarten through twelfth grade, in nearly all subject areas, in all types
of school districts (including urban, suburban, and rural districts) and in all parts of the
United States. In addition, the snapshot has been translated into Mandarin and used in
studies in China.
As a result of studies using the SOS, benchmarks for effective use of time in
classrooms have been established (Stallings, 1986). In previous studies, most teachers
distributed their time such that they monitored students doing written work at their seats
for 50% of the time, did organizational activities for 38% of the time, and used active
instruction only 12% of the time (See Figure 2). On the other hand, effective teachers
whose students showed gains on various standardized achievement tests distributed their
time so that 50% or more class time was spent in active instruction, 35% in active
monitoring, and 15% or less in organizing and managing. In these effective teachers’
classrooms the students were engaged 94% or more of the time. They were only off task
3% of the time (See Figure 1). The norms developed for effective teaching, although they

3
may differ somewhat by content area and grade level, provide a comparison for
considering teacher behavior in a variety of classroom settings.
The SOS also has been used as a guide to improve preservice and inservice
teachers' in-class instruction. The Department of Education through the National Diffusion
Network granted the staff development program based on the SOS “Exemplary Status as a
Program That Works” and funded the evaluation and training program. The SOS was used
as an evaluation tool for that program in eleven states in over 600 classrooms. Recently,
the program received an endowment to enable use and expansion of the staff development
model in urban settings. Current research indicates improved instruction for both
preservice and inservice teachers involved in the professional development (Knight, 2003).
Stallings Observation System
The Stallings Observation System has two independent observation instruments,
the Snapshot and The Five Minute Interaction, which typically are used together during an
observation. However, since only the Snapshot was used for this study, only that
component will be described in this report.
Initial reliability was established following seven days of training with 63 observers
through paired observations and criterion videotape methods to determine the extent of
observer agreement with each other and with an expert (Stallings & Giesen, 1977).
Approximately two weeks after the training, when observers had begun observing in actual
classrooms, they were asked again to code a criterion videotape. Reliability was
established as 70% or greater for each of the codes. Interrater reliability was determined
for each study described in this paper.
Validity originally was established through consultation with content and
classroom experts and by doing cross-validity checks between the Snapshot and the FMI.
For example, the proportion of time teachers engage in academic instruction reported in
snapshot data should be similar to the proportion of time teachers engage in academic
interactions as reported in the five-minute interaction data.

4
Snapshot
The Snapshot (SS) provides information based on a time sample of the entire class
period regarding materials, activities, and grouping and records the environment and the
participants in the classroom as if they were being photographed at one instant. Prior to
conducting the snapshot observation, the observer completes the Classroom Identification
section that records general information about the class, including grade level, subject,
number of students separated into male and female groups, number of teachers and aides,
and the class duration. During the observation, the observer keeps written logs on the back
of the snapshot form to record information that cannot be coded by the other sections of
the instrument. Log information typically includes information about content taught or
unusual circumstances that occurred during a coding interval.
The SS records every person in the classroom in the activity in which they are
engaged and shows with whom they are engaged. The SS is coded at five equal intervals
during the class period when the FMI is used, but is typically coded ten times at equal
intervals when used alone (see e.g., Knight & Boudah, 2003). The observer places
students and adults on a grid going clockwise around the room. Essentially, the Snapshot
provides objective frequencies of occurrence of nine activities in which the teacher may be
engaged, any of seven materials being used, and with whom the teacher is working. The
Snapshot also indicates the percent of time in which children are engaged in various
activities as well as the percent of children who are off task.
In previous studies, each classroom was observed on at least two consecutive days.
Using the computer format, one stroke on the Snapshot describes (1) the teacher's activity,
(2) the materials used, and (3) with whom the teacher is working. Percentages of
engagement in activities are generated. The data are summarized into three composite
variables for teacher activity including monitoring seatwork, providing interactive
instruction, and organizing/managing. One composite variable, student off-task, depicts
student activity. In addition, a percentage of time the teacher spends with one student,
small groups, and large groups is also provided. The stability of the data are reported in
Stallings and Kaskowitz (1974).
Adaptation of the Snapshot for World Bank Study. Several adaptations of the SS
were made for use in the World Bank study and piloted in Tunisian classrooms. Based on

5
videotapes of classrooms in other countries to be included in the study (e.g., French Guinee
and Brazil), a category called Copying was added to the list of activities depicted on the
grid. This addition required that Reading Orally and Reading Silently be collapsed into
one category labeled “Reading”. In addition, descriptions of existing categories were
modified to depict situations captured by the videotapes. For example, the use of slates
common in these settings was included with the traditional “Paper and Pencil” materials
category. Another modification included use of only one other “Adult” category in
addition to Teacher and Independent rather than the two categories presented in the U.S.
version since aides or other adults in the classroom were not reported frequently in
participating country classrooms. Furthermore, the Snapshot forms, coding manual, and
data analysis program were translated into French for use in French-speaking countries
such as Tunisia. Appendix A contains the modified Snapshot grid used in this study.
Tunisia Training Description
Training in the modified Classroom Snapshot was conducted over a five-day period
in Tunis in January, 2004, for 29 participants. Participants were all Inspectors from the
various regions throughout the country. Inspectors have the responsibility of evaluation
and professional development of teachers in schools in their areas and therefore have an
indepth knowledge of teaching and teachers in Tunisian classrooms. Their task was to
determine a classroom sampling plan in conjunction with the national Ministry of
Education, train additional observers throughout the country in the SOS if needed, and
conduct observations in classrooms selected for the sample in their own regions. This
trainer-of- trainers model with subsequent large-scale data collection was used in each of
the countries in the ITOT project.
The training sessions were conducted in English by two certified SOS trainers, Dr.
Jane Stallings (developer of the SOS) and Dr. Stephanie Knight (Director of LTICS, the
staff development program using the SOS), and simultaneously translated into French by
two Tunisian translators. Three primary types of activities were used in the training. The
first type of activity (Day 1) involved presentation and discussion of the operational
definitions of the variables contained in the SS - nine categories of activities, seven

6
categories of materials, and four types of groupings. This phase also provided a
description of the procedures followed for coding of the snapshot.
The second type of activity (Day 2) involved the coding of written vignettes
provided by trainers and/or written by participants themselves depicting classroom
situations. Participants first coded vignettes individually using snapshot grids and then
discussed their codes in small groups of five or six members. After discussing and
resolving differences, groups presented their vignettes and snapshot codes for large-group
discussion with the trainers and other participants.
The final type of activity consisted of a series of actual classroom observations by
groups of participants using the snapshot (Days 3 and 4). Initially, groups of four or five
observers coded the same classroom and then compared and discussed codes in a
debriefing session with trainers. Then, pairs of participants observed in classrooms and
subsequently determined their interobserver reliability for each variable in the snapshot.
Calculation of interobserver reliability in this case was not used to determine observer
quality, but rather to provide additional feedback to observers about their performance
using the instrument. The determination of interobserver reliability sensitized observers to
types of errors and differences in interpretation of variables and enabled trainers to focus
instruction on particular variables and/or specific participants.
Interobserver Reliability. Reliability was obtained 1) with experts through
comparison of participant codes with a series of expert-coded vignettes and 2) with other
observers through paired observations in Tunisian classes. The written test of reliability
was administered on the fourth day of training and consisted of six vignettes representing a
range of common snapshot codes. Participant scores ranged from 73% to 100% agreement
with an average of 82% agreement with the expert coding. Participants who scored lower
than 85% (10 participants) received additional training and practice and then were asked to
complete another written test of reliability coded by experts. All participants, with the
exception of one woman who had been absent one day of the training due to a death in the
family, attained the required 85% agreement.
On the fifth day of training, pairs of participants who had attained adequate
interobserver reliability on the written test observed in Tunisian classrooms to determine
interobserver reliability in the field. Codes were compared for the composite variables of

7
Monitoring, Interactive Instruction, Organization/Management, and Student Off-Task
Behaviors. Interobserver reliability for the four variables ranged from 95% to 99% with an
average of 97% agreement.
Tunisia Pilot Study
To determine the utility of the instrument for use in the World Bank ITOT Study
and to provide information about optimal observation procedures, a pilot study was
conducted in one Tunisian school following the training session. Pairs of observers
collected observation data in 13 classrooms in one upper elementary urban school
consisting of grades 4-6. Each pair observed an entire 50 minute lesson in one classroom.
The data from the observer with the highest expert agreement in each pair was used to
provide a profile of time on task for that school. In addition, data from the first 25 minutes
of observations was compared with data from the last 25 minutes of observation to
determine if observations for the national Tunisian study of use of classroom time could be
shortened to 25 minutes without misrepresenting classroom teacher and student behaviors.
Results of the school profile can be seen in Figures 1 and 2. The comparison of individual
classes indicated that the SOS could be used to differentiate the teacher and student
behaviors across classes.
Comparison of the first and second halves of the classes are depicted in Figures 3
and 4. As might be expected, differences in activities were observed for the two halves of
the class period. For this reason, trainers recommended observing an entire instructional
period.
ITOT Results for Tunisia, Morocco, Ghana, and Brazil
Following the same format, described in the Tunisian Pilot Study and using the
French translations, the observation training was provided to 26 supervisors of teachers
representing school districts across Morocco. Mohammed Sassi, Minister of Education
Research, who was trained in the Tunisian project, assisted Dr. Stallings throughout the
training. All of the participants were men. The men, although somewhat reluctant in the
beginning, eventually were writing classroom vignettes for Moroccan classrooms,
checking the codes in small groups and working hard to get the homework right.

8
Observing in the schools was the most beneficial for both participants and trainers,
providing many opportunities to learn the rules for coding. Observers checked their
interobserver reliability with me. By the end of the week, all of the Moroccan observers
exceeded the 93% level of reliability.
Ghana, in spite of having limited financial resources, was well organized. When
we arrived they had all of the training materials printed, the training room arranged, and
the requested transparencies. In emergent countries, we find it best to use transparencies
rather than Power Point because the supervisors returning to their local sites are not likely
to have sophisticated equipment. Dorothy Kanado, who attended the training in
Morocco, assisted me. Twenty five supervisors, representing all of the districts attended
the five day session. On the first day they organized themselves choosing a convener, a
time keeper, and a Chaplin. They kept each other on time and on task. At the end of the
day, they reviewed what they had learned, enhancing the work of the trainer. They all
passed with scores above the 95th percentile. Unlike participants in other countries, their
primary concern was how they would be able to observe classrooms in their far flung
districts, often by foot or bicycle, and keep their observation booklets dry.
For Brazil, the materials were translated into Portuguese and delivered with the
assistance of an extraordinary translator. For six hours a day he translated each comment
or question I posed and not missing a beat, switched to English to give me their
response. Thirty-three student teachers were enrolled for training. Because of a holiday,
called unexpectedly, we had to adjust our daily schedule and fit the five day schedule of
activities into four days. In Brazil there is a great holiday spirit. While they have lots of
fun, it is in conflict with the notion of using school time effectively. Several times the
teachers were late or absent in classrooms where the observers were assigned to practice
observations. Three observers did not pass the criterion tests. I worked with them
individually, but the concept of looking and coding a slice of time eluded them.
In the four countries, Dr. Markham trained their technical staff to process and
analyze the data, including entering the raw data. After transmission of the data to the
United States, Dr. Markham performed the detailed analyses. These analyses included
calculating the means, medians, and ranges of each instructional activity for the teachers

9
and students. Time off task was calculated for students and teachers and relationships
between selected variables were calculated.
Characteristics of the Data
Although we recommended that data be collected in grades two and four during
reading or mathematics, each country decided the parameters of their sample. Data were
collected in second and fourth grades in Tunisia, Ghana and Brazil. Characteristics of the
data collected in the four countries are displayed in Table 1.
Tunisia collected four periods of observations, 40 Snapshots, for each of 150
teachers at three grade levels. They were observed for 50 minutes most often in the same
class on two different days. In Morocco 194 teachers have two observations, 20
Snapshots, per teacher, but the second observation was frequently not in the same
subject. In Ghana 410 teachers were observed. Each teacher was observed in one class
period of 30 minutes. Because many schools serve one group of children in the AM and
another group in the PM, the class periods are limited to 30 minutes. Most of the
classrooms serve more than one grade i.e. first and second, third through fifth, and sixth.
Brazil data is based on 549 classrooms with one observation, ten Snapshots, per teacher.
Thirty percent, 67 teachers have fewer than 9 snapshots. This suggests that teachers were
out of the room part of the class period. In a quick examination, we did not find a pattern
of missing data by district or school. This needs further study of observers’ booklets to
understand why fewer than ten observations were recorded.
The subject areas observed varied considerably depending on what each country
valued. Religion was observed in all four countries, see Tables 1a and 1b.
Data Analyses
The variables are organized in three major teacher variables (see Table 2).
Studies of effective classrooms in the United States indicate that 50% or more of the
time is spent in Active Instruction. However, the percent of time spent in the four
activities within Active Instruction varies from class to class. Passive Instruction
includes the teacher monitoring the total classroom as the students do seatwork or copy
from the chalkboard. Teachers in effective classrooms were found to be engaged in these
10
activities 35% or less of the time. Organizing and Managing (O/M) includes the teacher
making assignments, collecting or passing materials, disciplining students, grading
papers/working alone. In effective classrooms management activities were kept to 15%
or less. Consistently we found that teachers with high rates of working alone, had more
student off task behavior. Effective classrooms were defined by student performance on
standardized achievement tests. Data from each country are presented in the following
sections.
Tunisia. Data from Tunisia is presented in Table 3 found in Appendix A, pages
8-11. The data are surprisingly consistent across grade levels. Overall, 60% of the class
time is spent in active instruction. This instructional time is distributed across Reading,
Instruct/explain, discussion, and Drill/practice. Note: only oral Drill and Practice is
coded. Practicing math facts alone is coded as seatwork. This array of activities provides
students with many opportunities to interact during the lesson.
Passive instruction accounts for 25% of the time. In this activity teachers
actively monitor the students as they do seatwork assignments or copy from the chalk
board.
Organization/management accounts for a low 13 % of class time. The teachers
seldom work alone, a mere 1%.
The student off Task is 10% at all grade levels. The highest of these variables is
uninvolved, 6%. Socializing is a low 3% and being disciplined 1%. The average class
size is 26.
Tunisia’s profile indicates 10% more time spent on active instruction than the
criteria established in the United States. It is interesting to note that Tunisia has a literacy
rate of 95%. Their average class size is 26 with a range of 11 to 40. Compulsory school
attendance is strictly enforced for boys and girls. Parents are fined if their children do not
attend school. The reorganization of the schools has improved the education for all
students in Tunisia.
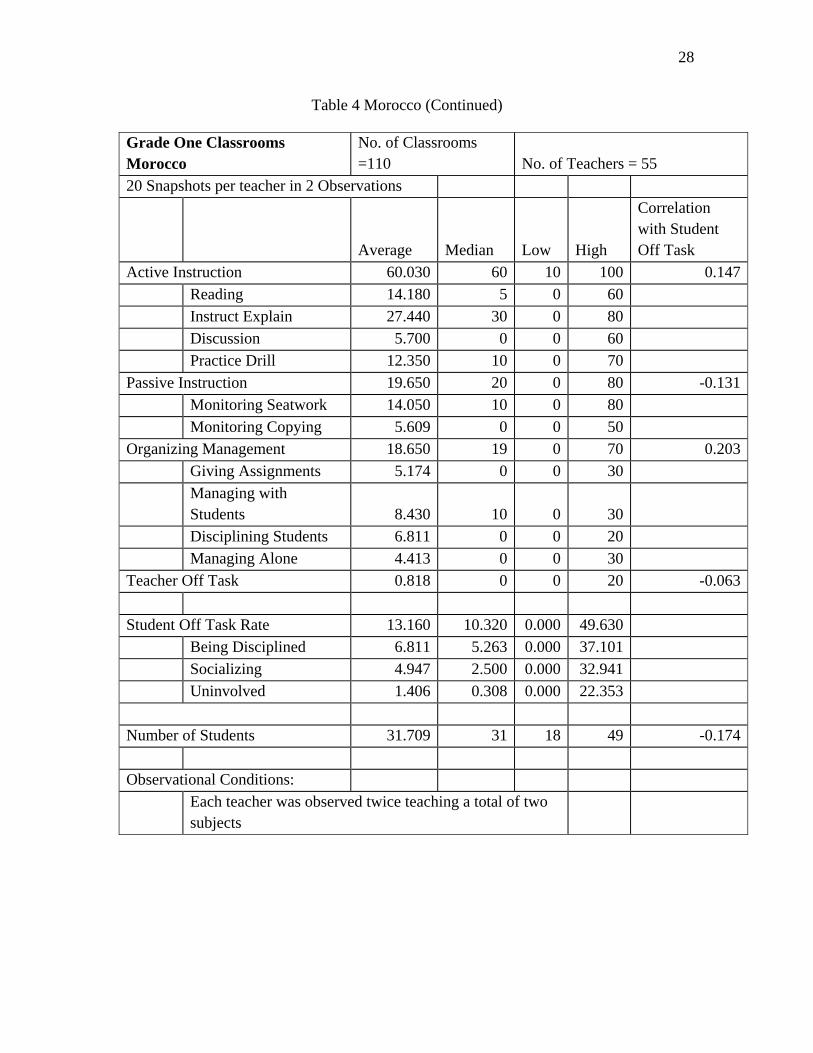
Morocco. The averages for all classrooms depicted in the Moroccan data are
similar to those for Tunisia. Active Instruction is 60% with a good distribution of
activities occurring (e.g. reading, explaining, discussion and drill and practice, see Table
4 found in Appendix A, pages 12-15.) The percent of time spent in Passive Instruction is

11
19%, indicating that students spend little time doing seatwork or copying from the
chalkboard. The average occurrence of Active and Passive instructional activities is
consistent across grade levels. There are a few outliers of 0 or 100, but overall the data
reflect a teacher training and supervision program is in effect.
The Organizing/Management variable is 19% which is 4% higher than
recommended by our criteria. Most of the time spent in O/M is Teacher managing with
Students, 9%. This is primarily standing in line, passing and collecting papers, taking the
roll, getting the show on the road. Teacher working alone is a low 4%.
The overall Off Task rate is 9%. Compared to the fourth and sixth grades that
have 8% Off Task, the first grades have a higher rate of 13%. First grades also a higher
rate of Teacher Disciplining 7%. This is not surprising given young children have to
learn the routine classroom procedures of listening/speaking and sitting quietly. Average
class size is 31 with a range from 18 to 55.
Ghana. Active instruction, overall, was coded 60% of the time as it was Tunisia
and Morocco (see Table 5 found in Appendix A, pages 16-19). Interestingly, within that
mega-variable, Class Discussion equaled or surpassed the Instruct/explain variable in all
grade levels. This indicates a more interactive type of instruction with questions and
answers.
Passive instruction was 10%, the lowest this analyst has seen in any data set.
Ghana has a significant problem in having enough books for each student. In some
classrooms two or three students must share one book. Because there are few books, or
paper and pencils necessary for seatwork, the teachers may rely more upon class
discussions.
The Organize/management variable overall averaged 26% and ranged from 24%
at the sixth grade level to the 30% in the combination grades third to fifth, far above the
criteria goal of 15%. The 30 minute periods most likely take a higher percent of
management time to get started and stopped than do 50 minute periods. Within this
mega-variable, Teacher Alone was recorded 15% or more of the time. Teacher Alone
means that the teacher is not monitoring the students and is grading papers or may be out
of the room.

12
The overall student off task rate is very high (21%). The teacher Disciplining
variable is an average of 1.3% indicating that the misbehavior is going unchecked. As in
other previous studies in the United States, here high Off Task behavior is positively
related to high Organizing/Management. These analyses also suggest that in classrooms
where more Active Instruction is provided, less Off Task behavior occurs.
The overall average number of students in classrooms is 26. The range is from
a low of 2 students to 82 in one first/second grade classroom.
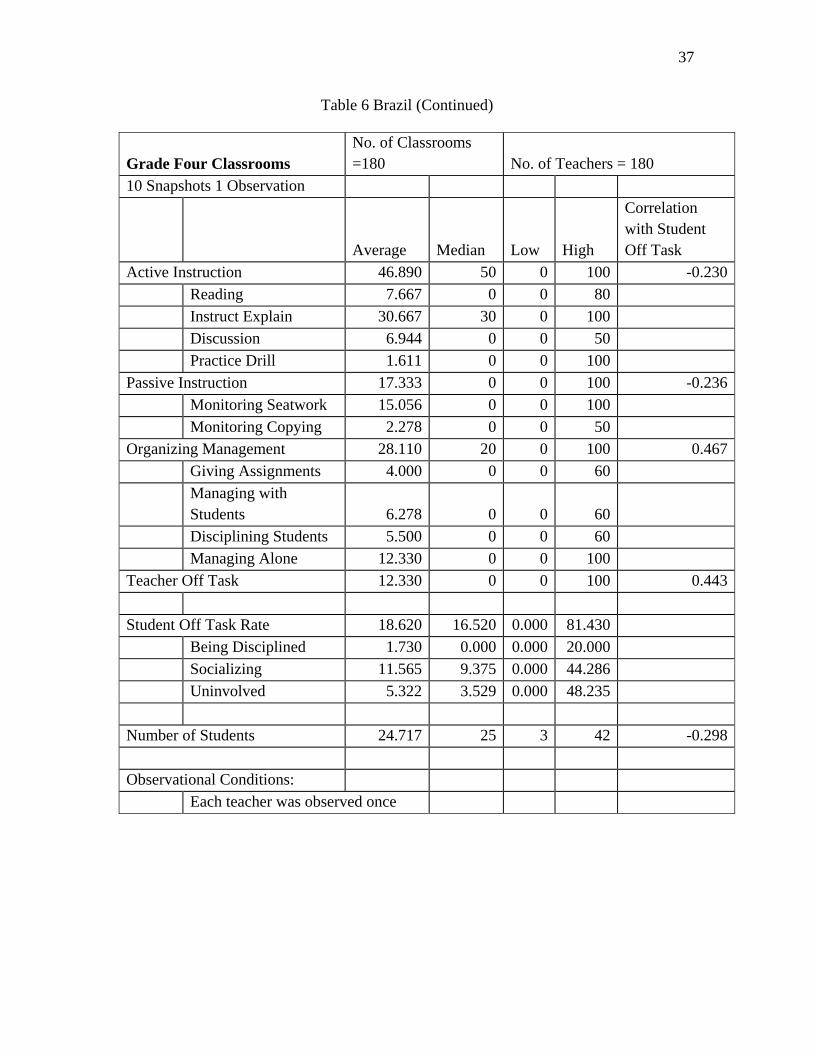
Brazil:
Active Instruction was coded 51% for second, forth, and eighth grade levels.
While this is lower than the other three countries examined, it does meet the 50%
criterion established in the United States. The Brazil data are shown on Table 6 found in
Appendix A, pages 20-23. These data indicate that the teacher instructing and explaining
variable accounts for nearly two thirds of Active Instruction, meaning the teachers are
lecturing most of the time and offering very little discussion, or drill and practice.
The overall average for Passive Instruction is 19%. In this variable the teacher
monitors the classroom while the students do seatwork, this ranges from 17% in second
grade to 24% in eighth grade As in Ghana, many of the rural schools do not have books
or pencil and paper for all of the students, thus the low average of time students spend
doing seatwork activities.
Overall classroom Management/Organization is 28%. Teacher management alone
variable is 12%. This means the teacher is grading papers or out of the room. In some
schools where we practiced observation in Brazil the teachers were late to class or left the
classroom during the observation, some did not arrive and there was not a substitute
teacher available. Since we did not have a code for out of classroom, this behavior was
coded as Teacher Alone. Some teachers may not have been present to control the
classroom behavior. Within grade levels, the off task rate ranges from 23% in second
grade to 18% in the eighth grade. In all grades the highest off task variable is socializing,
12%, whereas students’ being disciplined is a low 2%. For the most part, the Off Task
behavior is going unchecked by the teachers.
13
The overall average class size is 25 with a range from 3 to 65. Samples from
small country one room schools are included here and explain small class sizes of 3 at
grade two, 5 at grade four, and 9 at grade eight.
Summary
Classrooms in the four countries are remarkably similar. As we observed and
worked in each country with the teacher supervisors and classroom teachers, we found
the Snapshot categories were capable of recording each classroom activity that occurred,
except the teacher leaving the classroom. To accommodate a concern of our World Bank
sponsor, we modified the instrument to record Copying and eliminate Silent reading as
one of the classroom activities. Copying has occurred with much lower frequency than
expected and is a small component of Passive Instruction.
We could not control the subjects that were observed. Religion is taught and was
observed in all four countries within the category of Other coded on the cover sheet.
Nevertheless, in spite of the varied activities, class sizes, length of periods, the
instructional processes of Making Assignments, Providing Interactive Instruction,
Seatwork, and Class Management tasks occur in all classrooms to some degree. All
student sometimes Socialize, are day dreaming or Uninvolved, and receive Discipline
from the teacher. The teacher being missing…out of the classroom is one behavior for
which we were not prepared. It is against the law in the United States to leave a
classroom unattended. To our surprise, this occurred in Ghana and Brazil. We instructed
the observers to code it as Teacher Alone. We are in the process of adding Teacher Out
of the Room as a variable on the Snapshot.
Another surprise was the low percent of student time spent in Passive Instruction,
seatwork as reported for Ghana 10% and Brazil 19%. These are countries where it is not
unusual for two or three students to share books, where students are often without paper
and pencils that must be purchased, and where few instructional materials are available
for teachers. As the data indicates the teachers were often working alone or out of the
room 12% in Brazil and 15% in Ghana. In such situations it is not surprising to find their
students were Off Task much of the class time; 20% in Brazil and 21% in Ghana.

14
Overall, the Snapshot provides data that indicate the percent of time teachers and
students spend in the 15 activities. The relationship trends are consistent, if not
statistically significant: Active Instruction is negatively related to Time Off Task and a
high rate of Classroom Management is positively related to student Time Off Task.
In October 2005, we trained 28 district supervisors in Brazil to use their
observation data in their teacher training program. The trainees were enthusiastic and
learned the meaning of the codes and how to increase active instruction and accomplish
classroom management activities efficiently. They expect to deliver the training program
this spring to a sample of teachers they supervise, and next year they will observe to see
if classroom time is used more efficiently.
Given the ranges of activities occurrence in classrooms (zero to 100%) it is
important to identify those teachers where good instructional use of time is occurring and
those where too much time is being spent on getting the show on the road (organizing and
managing above 15%). Staff development is needed that focuses on using time
effectively to save those Golden minutes. To change teacher behavior, administrators
must be aware and committed to the effective use of school and classroom time.
*This study was funded by the World Bank and we are grateful for the opportunity to
observe and study classrooms in this arena of emerging nations. Please note the
conclusions drawn in this paper are those of the researchers and not necessarily those of
the World Bank.

15
References
Berliner, D., & Biddle, B. (1995). Tempus educare. In P. Peterson & H. Walberg
(eds.), Research on teaching: Concepts, findings , and implications (pp. 769-818).
Berkeley, CA: McCutchan.
Brophy, J., & Good, T. L. (1986). Teacher behavior and student achievement. In
M. C. Wittrock (Ed.), Handbook for research on teaching (pp. 328-375). New York:
Macmillan.
Good, T., & Brophy, J. (2000). Looking in classrooms (8th ed.). New York:
Longman.
Knight, S. (In Press). Impact of the Learning to Teach in Inner City Schools
Program on Teacher and Student Outcomes. Journal of Social Policy and Analysis.
Knight, S., & Boudah, D. (2003). The Impact of Teacher Participation in
Collaborative Teacher Research on Secondary Students’ Classroom Behaviors and
Engagement. In D.Wiseman,& S. Knight, S., The Impact of School-University
Collaboration on K-12 Student Outcomes. Arlington, VA: American Association of
Colleges of Teacher Education.
Stallings, J. & Giesen, P. (1977). The Study of Reliability in Observational Data.
Phi Delta Kappa, Occasional Paper 19.
Stallings, J. A. (1986). Effective use of time in secondary reading programs. In
J. Hoffman (Ed.), Effective teaching of reading: Research and practice (pp. 85-106).
Newark, Delaware: International Reading Association.
Stallings, J. & Kaskowitz, D. (1974). Follow Through Classroom Observation
Evaluation, 1972-73. Menlo Park, CA: SRI, International.

16
Figure 1
Tunisian Pilot Study Teacher Use of Time
34%
45%
11%
10%
Monitoring
Interactive Instruction
Classroom Management
Working Alone

17
Figure 2
Tunisian Pilot Study Student Use of Time
84%
6%0% 5% 5%
Active Learning
Social Interaction
Discipline
Uninvolved
Management

18
First Half of Class Time
Teacher Making Assignments Teacher monitoring Written Assignments/ Seatwork
Teacher Copying Teacher conducting Instruction/ Demonstration
Teacher with Discussion Teacher supervising Practice Drill
Teacher leading Kinesthetic Teacher observing Projects
Teacher engaged in Social Interaction Student Uninvolved
Teacher Disciplining Student Teacher Engaged in Classroom Management
Teacher engaged in Reading

19
Second Half of Class Time
Teacher Making Assignments Teacher monitoring Written Assignments/ Seatwork
Teacher Copying Teacher conducting Instruction/ Demonstration
Teacher with Discussion Teacher supervising Practice Drill
Teacher leading Kinesthetic Teacher observing Projects
Teacher engaged in Social Interaction Student Uninvolved
Teacher Disciplining Student Teacher Engaged in Classroom Management
Teacher engaged in Reading

20
Table 1a
Country Number of
Districts Number of
SchoolsNumber of Teachers
Number of Observations
Grade Levels
Length of
Period
Tunisia 6 24 150 300 1,2,4 50 Morocco 15 197 394 1,4,6 50 Ghana 23 54 407 407 1,2,3,4,5,6 30 Brazil 49 180 539 539 2,4,8 50
Table 1b
Country Subjects Observed
Tunisia Reading, Language Arts, Math, Science, Social Studies, Other
Morocco Reading, Math, Science, Other
Ghana Math, English Grammar, Ghanaian Grammar, Science, Environmental Studies, Religion
Brazil Portuguese, Math, Science, Geography, Religion
Table 2
Major Variable Components US Criteria Active Instruction 50% or more Reading
Instruct Explain
Discussion
Practice Drill
Passive Instruction 35% or less Seatwork
Copying Organizing Management 15% or less Teacher and Student Managing
Disciplining
Making Assignments
Teacher Managing Alone

21
Off Task
Teacher Socializing 0%
Students 6% or less Uninvolved
Disciplined
Socializing
Appendix A
Observational Data
Table 3 Tunisia
Overall
No. of Classrooms =300 observed twice for 600 observations No. of Teachers = 150*
Average Median Low High
Correlation with Student Off Task
Active Instruction 59.622 60 15 100 -0.170
Reading 14.512 15 0 53
Instruct Explain 27.773 25 0 65
Discussion 6.100 5 0 35
Practice Drill 11.237 10 0 80
Passive Instruction 25.260 25 0 65 0.000
Monitoring Seatwork 22.707 20 0 60
Monitoring Copying 2.553 0 0 20
Organizing Management 10.739 10 0 40 Giving Assignments 1.933 5 0 30 0.110
Managing with Students 2.367 0 0 15
Disciplining Students 3.100 0 0 25
Managing Alone 1.000 0 0 25
Teacher Off Task 1.033 0 0 35 0.219
Student Off Task Rate 9.871 8.698 0.000 48.161
Being Disciplined 1.002 0.000 0.000 15.000

22
Socializing 2.611 1.563 0.000 25.000 Uninvolved 6.270 5.214 0.000 35.977
Number of Students 25.907 26 11 40 -0.141
Observational Conditions:
*Each teacher was observed on two days of two different subject areas for a total of four observations (40 observations per teacher).

23
Table 3 Tunisa (Continued) Grade One Classrooms Tunisia
No. of Classrooms =102 No. of Teachers = 51*
20 Snapshots 2 Observations
Average Median Low High
Correlation with Student Off Task
Active Instruction 60.150 60 20 85 -0.247
Reading 14.120 10 0 40
Instruct Explain 27.840 25 0 65
Discussion 4.755 0 0 25
Practice Drill 13.430 10 0 80
Passive Instruction 24.710 25 0 50 0.143
Monitoring Seatwork 21.620 20 0 50
Monitoring Copying 3.088 0 0 20 Organizing Management 10.784 15 0 35 0.131
Giving Assignments 7.304 5 0 30
Managing with Students 2.353 0 0 15
Disciplining Students 3.235 0 0 15
Managing Alone 1.127 0 0 15
Teacher Off Task 1.324 0 0 10 0.284
Student Off Task Rate 9.499 8.650 0.000 36.410
Being Disciplined 1.183 0.000 0.000 15.000
Socializing 2.631 1.658 0.000 25.000
Uninvolved 5.685 4.333 0.000 20.000
Number of Students 25.108 25 11 35 -0.114
Observational Conditions:
*Each teacher was observed on two days of two different subject areas for a total of four observations (40 observations per teacher).

24
Table 3 Tunisa (Continued)
Grade Two Classrooms TunsiaNo. of Classrooms =100 No. of Teachers = 50*
20 Snapshots 2 Observations
Average Median Low High
Correlation with Student Off Task
Active Instruction 60.030 60 15 90 -0.201
Reading 14.001 15 0 40
Instruct Explain 29.000 30 0 65
Discussion 7.020 5 0 35
Practice Drill 10.010 10 0 80
Passive Instruction 24.110 25 0 60 0.062
Monitoring Seatwork 21.980 20 0 60 Monitoring Copying 2.131 0 0 15
Organizing Management 10.867 10 0 30 0.060
Giving Assignments 8.240 5 0 25
Managing with Students 1.566 0 0 15
Disciplining Students 3.434 0 0 25
Managing Alone 1.061 0 0 25
Teacher Off Task 1.350 0 0 0 0.2096
Student Off Task Rate 10.337 8.276 0.000 48.161
Being Disciplined 1.147 0.000 0.000 10.200
Socializing 2.765 1.282 0.000 15.672
Uninvolved 6.426 5.000 0.000 35.977
Number of Students 25.758 26 14 40 -0.359
Observational Conditions:
*Each teacher was observed on two days of two different subject areas for a total of four observations (40 observations per teacher).

25
Table 3 Tunisa (Concluded)
Grade Four Classrooms No. of Classrooms =98 No. of Teachers = 49*
20 Snapshots 2 Observations
Average Median Low High
Correlation with Student Off Task
Active Instruction 58.670 60 30 100 -0.051
Reading 15.431 15 0 55
Instruct Explain 26.480 25 0 60
Discussion 6.566 5 0 30
Practice Drill 10.202 10 0 45
Passive Instruction 26.980 25 0 65 -0.193
Monitoring Seatwork 24.560 25 0 60 Monitoring Copying 2.424 0 0 20
Organizing Management 10.564 10 0 35 0.143
Giving Assignments 7.887 5 0 25
Managing with Students 1.869 0 0 15
Disciplining Students 2.626 0 0 15
Managing Alone 0.808 0 0 15
Teacher Off Task 0.408 0 0 5 0.089
Student Off Task Rate 9.789 9.375 0.000 35.343
Being Disciplined 0.671 0.000 0.000 5.372
Socializing 2.400 1.667 0.000 18.711
Uninvolved 6.718 5.769 0.000 23.854
Number of Students 28.162 27 20 40 0.072
Observational Conditions:
*Each teacher was observed on two days of two different subject areas for a total of four observations (40 observations per teacher).

26
Table 4 Morocco
Overall No. of Classrooms =394 No. of Teachers = 197
20 Snapshots per teacher in 2 Observations
Average Median Low High
Correlation with Student Off Task
Active Instruction 59.610 60 10 100 0.102
Reading 15.371 10 0 100 Instruct Explain 25.713 20 0 100
Discussion 6.440 0 0 70
Practice Drill 12.086 10 0 70
Passive Instruction 19.635 20 0 80 -0.064
Monitoring Seatwork 14.695 10 0 80
Monitoring Copying 4.939 0 0 50
Organizing Management 19.318 20 0 70 0.076
Giving Assignments 6.131 0 0 70
Managing with Students 8.581 10 0 40
Disciplining Students 0.406 0 0 20
Managing Alone 4.200 0 0 50
Teacher Off Task 1.110 0 0 30 0.042
Student Off Task Rate 9.255 6.452 0.000 49.630
Being Disciplined 4.320 0.000 0.000 37.101
Socializing 3.967 1.923 0.000 32.941
Uninvolved 0.967 0.000 0.000 22.353
Number of Students 30.624 30 18 55 -0.112
Observational Conditions:
Each teacher was observed twice teaching a total of two subjects
27
28
Table 4 Morocco (Continued)
Grade One Classrooms Morocco
No. of Classrooms =110 No. of Teachers = 55
20 Snapshots per teacher in 2 Observations
Average Median Low High
Correlation with Student Off Task
Active Instruction 60.030 60 10 100 0.147
Reading 14.180 5 0 60
Instruct Explain 27.440 30 0 80
Discussion 5.700 0 0 60
Practice Drill 12.350 10 0 70
Passive Instruction 19.650 20 0 80 -0.131
Monitoring Seatwork 14.050 10 0 80
Monitoring Copying 5.609 0 0 50 Organizing Management 18.650 19 0 70 0.203
Giving Assignments 5.174 0 0 30
Managing with Students 8.430 10 0 30
Disciplining Students 6.811 0 0 20
Managing Alone 4.413 0 0 30
Teacher Off Task 0.818 0 0 20 -0.063
Student Off Task Rate 13.160 10.320 0.000 49.630
Being Disciplined 6.811 5.263 0.000 37.101
Socializing 4.947 2.500 0.000 32.941
Uninvolved 1.406 0.308 0.000 22.353
Number of Students 31.709 31 18 49 -0.174
Observational Conditions:
Each teacher was observed twice teaching a total of two subjects

29
Table 4 Morocco (Continued)
Grade Four Classrooms Morocco
No. of Classrooms =150 No. of Teachers = 75
20 Snapshots per teacher in 2 Observations
Average Median Low High
Correlation with Student Off Task
Active Instruction 59.140 60 10 100 0.001
Reading 14.410 10 0 100
Instruct Explain 24.500 20 0 100
Discussion 6.800 0 0 60
Practice Drill 13.160 10 0 60
Passive Instruction 22.310 20 0 70 -0.389
Monitoring Seatwork 16.850 10 0 70
Monitoring Copying 5.460 0 0 50 Organizing Management 18.500 20 0 60 0.075
Giving Assignments 6.333 0 0 40
Managing with Students 8.242 10 0 30
Disciplining Students 0.333 0 0 10
Managing Alone 3.588 0 0 30
Teacher Off Task 1.461 0 0 30 0.001
Student Off Task Rate 7.802 5.742 0.000 31.053
Being Disciplined 3.474 1.640 0.000 22.069
Socializing 3.316 1.539 0.000 27.368
Uninvolved 1.012 0.000 0.000 17.742
Number of Students 31.767 31 19 55 -0.070
Observational Conditions:
Each teacher was observed twice teaching a total of two subjects

30
Table 4 Morocco (Concluded)
Grade Six Classrooms Morocco No. of Classrooms =134 No. of Teachers = 67
20 Snapshots per teacher in 2 Observations
Average Median Low High
Correlation with Student Off Task
Active Instruction 61.210 60 10 100 0.171
Reading 17.420 10 0 90
Instruct Explain 25.660 20 0 100
Discussion 6.642 0 0 70
Practice Drill 10.660 0 0 50
Passive Instruction 16.620 10 0 60 -0.154
Monitoring Seatwork 12.810 10 0 50
Monitoring Copying 3.806 0 0 50 Organizing Management 20.770 20 0 70 0.075
Giving Assignments 6.689 0 0 70
Managing with Students 9.084 10 0 40
Disciplining Students 0.299 0 0 10
Managing Alone 4.701 0 0 50
Teacher Off Task 0.970 0 0 30 0.170
Student Off Task Rate 7.673 4.580 0.000 36.129
Being Disciplined 3.224 1.250 0.000 34.500
Socializing 3.892 1.923 0.000 30.833
Uninvolved 0.558 0.000 0.000 6.579
Number of Students 28.455 28 18 42 -0.210
Observational Conditions:
Each teacher was observed twice teaching a total of two subjects

31
Table 5 Ghana
Overall No. of Classrooms = 407 No. of Teachers = 407
10 Snapshots 1 Observation
Average Median Low High
Correlation with Student Off Task
Active Instruction 59.270 60 0 100 -0.407
Reading 8.673 0 0 100
Instruct Explain 20.010 20 0 100
Discussion 24.120 20 0 100
Practice Drill 6.470 0 0 90
Passive Instruction 10.076 0 0 100 -0.147
Monitoring Seatwork 7.342 0 0 90 Monitoring Copying 2.735 0 0 70
Organizing Management 25.930 20 0 90 0.295
Giving Assignments 2.416 0 0 50
Managing with Students 5.111 0 0 40
Disciplining Students 3.366 0 0 40
Managing Alone 15.037 10 0 80
Teacher Off Task 1.572 0 0 100 0.332
Student Off Task Rate 21.092 16.667 0.000 100.000
Being Disciplined 1.334 0.000 0.000 23.529
Socializing 9.343 5.000 0.000 100.000
Uninvolved 10.415 7.238 0.000 23.529
Number of Students 26.113 24 2 82 -0.009
Observational Conditions:
Each teacher was observed once

32
Table 5 Ghana (Continued)
Grade One-Two Classrooms No. of Classrooms = 195 No. of Teachers = 195
10 Snapshots 1 Observation
Average Median Low High
Correlation with Student Off Task
Active Instruction 58.530 60 0 100 -0.361
Reading 10.720 0 0 90
Instruct Explain 19.580 20 0 100
Discussion 19.200 10 0 90
Practice Drill 9.030 0 0 90
Passive Instruction 10.170 0 0 70 -0.170
Monitoring Seatwork 7.697 0 0 60
Monitoring Copying 2.477 0 0 40 Organizing Management 25.940 10 0 80 0.297
Giving Assignments 2.274 0 0 50
Managing with Students 5.077 0 0 40
Disciplining Students 4.051 0 0 40
Managing Alone 14.540 10 0 80
Teacher Off Task 1.590 0 0 100 0.342
Student Off Task Rate 23.970 20.560 0.000 100.000
Being Disciplined 1.645 0.000 0.000 21.163
Socializing 10.771 6.667 0.000 100.000
Uninvolved 11.554 8.500 0.000 64.286
Number of Students 28.328 26 3 82 -0.010
Observational Conditions:
Each teacher was observed once

33
Table 5 Ghana (Continued) Grade Three - Five Classrooms
No. of Classrooms = 45 No. of Teachers = 45
10 Snapshots 1 Observation
Average Median Low High
Correlation with Student Off Task
Active Instruction 54.194 60 30 100 -0.340
Reading 8.065 15 0 45
Instruct Explain 18.710 25 0 60
Discussion 22.903 5 0 30
Practice Drill 3.871 10 0 55
Passive Instruction 6.774 25 0 55 -0.191
Monitoring Seatwork 4.194 20 0 50
Monitoring Copying 2.581 0 0 15 Organizing Management 30.220 30 0 100 -0.074
Giving Assignments 3.560 0 0 30
Managing with Students 7.330 0 0 40
Disciplining Students 4.670 0 0 30
Managing Alone 14.670 10 0 80
Teacher Off Task 1.935 0.000 0 0 0.116
Student Off Task Rate 23.870 19.250 0.000 16.875
Being Disciplined 2.167 0.000 0.000 16.875
Socializing 8.540 4.570 0.000 60.000
Uninvolved 13.160 9.520 0.000 51.760
Number of Students 19.690 19 5 48 0.098
Observational Conditions:
Each teacher was observed once

34
Table 5 Ghana (Concluded)
Grade Six Classrooms No. of Classrooms = 167 No. of Teachers = 167
10 Snapshots 1 Observation
Average Median Low High
Correlation with Student Off Task
Active Instruction 62.900 60 0 100 0.037
Reading 6.950 0 0 80
Instruct Explain 21.260 20 0 100
Discussion 30.310 30 0 100
Practice Drill 4.385 0 0 50
Passive Instruction 9.530 0 0 90 -0.003
Monitoring Seatwork 6.530 0 0 90
Monitoring Copying 2.994 0 0 70 Organizing Management 23.380 20 0 80 -0.055
Giving Assignments 2.275 0 0 30
Managing with Students 4.551 0 0 40
Disciplining Students 2.216 0 0 30
Managing Alone 14.340 10 0 80
Teacher Off Task 1.497 0 0 100 0.007
Student Off Task Rate 21.450 17.330 0.000 100.000
Being Disciplined 1.146 0.000 0.000 23.529
Socializing 9.658 6.250 0.000 83.333
Uninvolved 10.645 6.471 0.000 57.692
Number of Students 25.257 23 2 61 -0.050
Observational Conditions:
Each teacher was observed once

35
Table 6 Brazil
Overall No. of Classrooms =539 No. of Teachers = 539
10 Snapshots 1 Observation
Average Median Low High
Correlation with Student Off Task
Active Instruction 46.270 50 0 100 -0.182
Reading 6.642 0 0 80
Instruct Explain 31.967 30 0 100
Discussion 6.234 0 0 80
Practice Drill 1.429 0 0 100
Passive Instruction 19.332 10 0 100 0.226
Monitoring Seatwork 16.308 0 0 100
Monitoring Copying 3.024 0 0 70 Organizing Management 27.980 20 0 100 0.487
Giving Assignments 3.766 0 0 60
Managing with Students 6.252 0 0 60
Disciplining Students 5.881 0 0 60
Managing Alone 12.078 0 0 100
Teacher Off Task 1.095 10 0 100 0.464
Student Off Task Rate 19.640 16.875 0.000 93.571
Being Disciplined 1.981 0.000 0.000 32.174
Socializing 12.267 10.000 0.000 62.273
Uninvolved 5.392 3.750 0.000 52.609
Number of Students 25.154 24 3 65 -0.253
Observational Conditions:
Each teacher was observed once

36
Table 6 Brazil (Continued)
Grade Two Classrooms No. of Classrooms =179 No. of Teachers = 179
10 Snapshots 1 Observation
Average Median Low High
Correlation with Student Off Task
Active Instruction 44.580 50 0 100 -0.241
Reading 8.101 0 0 60
Instruct Explain 28.883 30 0 100
Discussion 5.587 0 0 50
Practice Drill 2.011 0 0 60
Passive Instruction 16.983 10 0 100 -0.140
Monitoring Seatwork 14.525 0 0 100
Monitoring Copying 2.458 0 0 70 Organizing Management 31.170 30 0 100 0.488
Giving Assignments 3.408 0 0 30
Managing with Students 7.207 0 0 60
Disciplining Students 6.760 0 0 40
Managing Alone 13.800 0 0 80
Teacher Off Task 1.397 0 0 94 0.441
Student Off Task Rate 22.580 20.290 0.000 93.570
Being Disciplined 2.409 0.000 0.000 32.174
Socializing 13.850 12.857 0.000 56.522
Uninvolved 6.324 4.783 0.000 52.609
Number of Students 21.626 21 5 40 -0.168
Observational Conditions:
Each teacher was observed once
37
Table 6 Brazil (Continued)
Grade Four Classrooms No. of Classrooms =180 No. of Teachers = 180
10 Snapshots 1 Observation
Average Median Low High
Correlation with Student Off Task
Active Instruction 46.890 50 0 100 -0.230
Reading 7.667 0 0 80
Instruct Explain 30.667 30 0 100
Discussion 6.944 0 0 50
Practice Drill 1.611 0 0 100
Passive Instruction 17.333 0 0 100 -0.236
Monitoring Seatwork 15.056 0 0 100
Monitoring Copying 2.278 0 0 50 Organizing Management 28.110 20 0 100 0.467
Giving Assignments 4.000 0 0 60
Managing with Students 6.278 0 0 60
Disciplining Students 5.500 0 0 60
Managing Alone 12.330 0 0 100
Teacher Off Task 12.330 0 0 100 0.443
Student Off Task Rate 18.620 16.520 0.000 81.430
Being Disciplined 1.730 0.000 0.000 20.000
Socializing 11.565 9.375 0.000 44.286
Uninvolved 5.322 3.529 0.000 48.235
Number of Students 24.717 25 3 42 -0.298
Observational Conditions:
Each teacher was observed once

38
Table 6 Brazil (Concluded)
Grade Eight Classrooms No. of Classrooms =180 No. of Teachers = 180
10 Snapshots 1 Observation
Average Median Low High
Correlation with Student Off Task
Active Instruction 47.330 50 0 100 -0.058
Reading 4.167 0 0 60
Instruct Explain 36.333 30 0 100
Discussion 6.167 0 0 80
Practice Drill 0.667 0 0 50
Passive Instruction 23.667 20 0 100 -0.272
Monitoring Seatwork 19.333 10 0 100
Monitoring Copying 4.333 0 0 50 Organizing Management 24.670 20 0 100 0.488
Giving Assignments 3.889 0 0 50
Managing with Students 5.278 0 0 60
Disciplining Students 5.389 0 0 50
Managing Alone 10.110 0 0 100
Teacher Off Task 5.110 0 0 20 0.503
Student Off Task Rate 17.809 15.000 0.000 78.889
Being Disciplined 1.807 0.000 0.000 20.000
Socializing 11.395 9.281 0.000 62.273
Uninvolved 4.534 3.192 0.000 41.053
Number of Students 29.100 27 9 65 -0.226
Observational Conditions:
Each teacher was observed once