using the köppen classification to quantify climate...
TRANSCRIPT

Contents lists available at SciVerse ScienceDirect
Environmental Development
Environmental Development 6 (2013) 69–79
2211-46http://d
n CorrE-m
journal homepage: www.elsevier.com/locate/envdev
Using the Köppen classification to quantifyclimate variation and change: An example for1901–2010
Deliang Chen n, Hans Weiteng ChenDepartment of Earth Sciences, University of Gothenburg, Sweden
a r t i c l e i n f o
Article history:Received 23 December 2012Accepted 19 March 2013
Keywords:Köppen climate classificationClimate variabilityClimate changeSpatially stable climate regionsDry climatePolar climate
45/$ - see front matter Crown Copyright &x.doi.org/10.1016/j.envdev.2013.03.007
esponding author. Tel.: +46 317864813; faail address: [email protected] (D. Chen).
a b s t r a c t
The Köppen climate classification was developed based on theempirical relationship between climate and vegetation. This type ofclimate classification scheme provides an efficient way to describeclimatic conditions defined by multiple variables and their seasonal-ities with a single metric. Compared with a single variable approach,the Köppen classification can add a new dimension to the descriptionof climate variation. Further, it is generally accepted that the climaticcombinations identified with the Köppen classification are ecologicallyrelevant. The classification has therefore been widely used to mapgeographic distribution of long term mean climate and associatedecosystem conditions. Over the recent years, there has also been anincreasing interest in using the classification to identify changes inclimate and potential changes in vegetation over time. These successfulapplications point to the potential of using the Köppen classification asa diagnostic tool to monitor changes in the climatic condition overvarious time scales. This work used a global temperature andprecipitation observation dataset to reveal variations and changes ofclimate over the period 1901–2010, demonstrating the power of theKöppen classification in describing not only climate change, but alsoclimate variability on various temporal scales. It is concluded that themost significant change over 1901–2010 is a distinct areal increase ofthe dry climate (B) accompanied by a significant areal decrease of thepolar climate (E) since the 1980s. The areas of spatially stable climateregions for interannual and interdecadal variations are also identified,which have practical and theoretical implications.Crown Copyright & 2013 Published by Elsevier B.V. All rights reserved.
2013 Published by Elsevier B.V. All rights reserved.
x: +46 317861986.

D. Chen, H.W. Chen / Environmental Development 6 (2013) 69–7970
1. Introduction
Due to various factors limiting the distribution and abundance of organisms on Earth, each speciesand ecological community have a limited distribution. One of the most critical and variabledeterminants of the distribution of Earth's major ecosystem types is climate, which provides a sourceof energy and water (Zhou and Wang, 2000). Box (1981) suggests that general macroclimaticconditions influencing plant energy and water budgets are much more important than any otherfactors in determining the general ecological structure.
Climate is often defined as a comprehensive statistical description of weather over a sufficientlylong period of time (usually 30 years) and varies at a wide range of temporal scales. Climate isdetermined by external forcings (e.g. solar radiation) and internal dynamics in the climate system (e.g.atmospheric and oceanic circulations and earth surface–atmosphere interactions).
In terms of the internal dynamics, there are atmospheric modes of circulation that have time scalesof up to about two years (e.g. the quasi-biennial oscillation). We also have coupled ocean-atmosphericmodes that have time scales from weeks to several decades (e.g. the El-Niño phenomenon which has atime-scale of about four years). These modes altogether can produce climate variations at various timescales, in addition to the long term changes which are often associated with different long term forcings.
For vegetation and ecosystems, climate can be considered general patterns of temperature,precipitation, humidity, wind, and radiation that characterize a region. But most climate classificationschemes only use near-surface air temperature and precipitation as the two major variables indescribing energy and water balance (e.g. Thorthwaite, 1948), mainly due to the limited accessibilityof climate data.
Based on empirical observations, Köppen (1900) established a climate classification system whichuses monthly temperature and precipitation to define boundaries of different climate types aroundthe world. Since its inception, this system has been further developed (e.g. Köppen and Geiger, 1930;Stern et al., 2000) and widely used by geographers and climatologists around the world. Thepopularity of the system lies in its power in linking climate and natural vegetation (Bailey, 2009), andin its simplicity (Wilcock, 1968). Although there have been many efforts from German scientists tofind alternative ways to classify the climate, the Köppen system remains one of the most widely usedclimate classification systems (e.g. Domroes, 2003).
Most applications of the Köppen system are concerned with mapping the geographic distributionof the world's climate or vegetation with the help of a long term climate dataset. Depending on thedata used, the mappings may have different details and qualities for such a stationary description ofthe world's climate. Recently, Kottek et al. (2006) provided a well documented and easily accessibleupdate of the world climate classification map using gridded climate data during 1951–2000. Taking astation-based approach in terms of the input climate data, Peel et al. (2007) presented another updateof the Köppen climate classification scheme by using long-term station records of monthlyprecipitation and temperature from the Global Historical Climatology Network version 2 (GHCN2)dataset (Peterson and Vose, 1997). This update only gives long term averaged climate distributionsover the whole period covered by the GHCN2 dataset.
Although most stations in the GHCN2 dataset have data that cover a period much longer than 30years, some stations have data much shorter than 30 years. Peel et al. (2007) used all stations with atleast 30 years data in their analysis, which means that the climate types in different parts of the worldmay represent different climates over different time periods. This is especially true for transitionalzones between two different climate types.
Climate change can cause changes in the spatial extent of a climate type and plant community (e.g.
Elmendorf, 2012). This kind of changes may also be reflected by changes in the areas occupied by the
Köppen climate types (Wang and Overland, 2004). As an example, Diaz and Eischeid (2007) compared
areas of the climate type “alpine tundra” over the 1901–1930 period with that of 1987–2006 for the
mountainous western United States. They found that this type has a dramatic decline (∼73%),indicating the regional warming and its possible effect on the ecosystem.
Owing to the fixed and objective set of predefined rules, the Köppen system can be easily appliedin places where the necessary climate information is available. Because of the objectivity, the system
D. Chen, H.W. Chen / Environmental Development 6 (2013) 69–79 71
has been increasingly used to compare climate model simulations with observations (Guetter andKutzbach, 1990), to examine climate changes in observations (Fraedrich et al., 2001) and in modelsimulations (Guetter and Kutzbach, 1990; De Castro et al., 2007), and to visualize the projected futureclimatic changes (e.g. Gnanadesikan and Stouffer, 2006; Gao and Giorgi, 2008; Rubel and Kottek,2010).
In describing climate change, a single variable (e.g. temperature) approach is often used. A goodexample is the well-known global mean temperature over the period covered by the instrumentalrecords or by past climate reconstructions. The Köppen climate classification scheme provides aframework in which climate is characterized by a number of distinct seasonal temperature andprecipitation regimes depending on the combination of seasonal temperature and precipitation.As such, it offers an effective way to provide an easily-assimilated depiction of climate. Therefore, thesystem provides us with an integrated way to monitor climate variations on a variety of temporalscales including short term variations.
As climate changes, it is expected that climate types around the boundary between two differenttypes may shift from one regime to another. By examining historic changes using instrumental dataand future changes using climate model simulations, a number of studies have confirmed that climatechanges are indeed associated with shifts between climate types.
Kim et al. (2008) detected a climatic shift toward a warmer and dryer condition in the arid climatein North China from the decades 1951–1970 to the recent decades 1981–2000. Diaz and Eischeid(2007) discovered a reduction in the areal extent of the Köppen “alpine tundra” type for themountainous western United States. Kalvova et al. (2003) examined changes in climate types inobservations and simulations on the global level. They found that under a number of global warmingscenarios, all global climate model projections of future climate around 2050 show that the areasoccupied by groups A and B would be larger than the current climate, and the areas for other majorclimate groups would become smaller. These results are in line with those from Lohmann et al. (1993).It should be kept in mind that all mentioned studies look at changes in the Köppen climate types onthe typical climate time scale, which on average is about 30 years.
Although the Köppen scheme was designed to reveal averaged climate (typically over 30 years) inrelation to corresponding vegetation types on Earth, it may also be useful in describing shorter climatevariability if the link between climate and vegetation is not a primary concern. Vegetation changewould involve a long term adaptation process and short term variation in climate may be irrelevantfor vegetation change. However, a recent study of Wang and Overland (2004) shows that the variationof the climate types on the interannual scale corresponds well with the changes of the vegetationstatus in the Arctic observed by satellite. This confirms the impact of short term climate variation onvegetation and indicates usefulness of using the short term variation of the Köppen types fordescribing climate variability and its impact on vegetation in a given region.
While the usefulness of the Köppen classification in describing mean climate conditions (around30 years and longer) has been widely recognized, the possibility to use the method to characterizeclimate variability on shorter time scales needs to be explored. This study attempts to demonstratethe use of the Köppen classification in describing climate change (30 years) and variability (year-to-year and decade-to-decade). As an example, a global long-term instrumental dataset is used to revealchanges and variations of the Köppen climate types on the global scale.
We will describe the data and methods in Section 2. The results are shown and discussed in Section 3,which will be followed by Section 4 with some conclusions.
2. Data and methods
2.1. Temperature and precipitation data
This study used a global gridded dataset with monthly mean temperature and precipitation,covering 1901–2010, which was produced and documented by Kenji Matsuura and Cort J. Willmott fromDepartment of Geography, University of Delaware. The data and associated documentations can befound at http://climate.geog.udel.edu/�climate/html_pages/Global2011/. Station data were compiled

D. Chen, H.W. Chen / Environmental Development 6 (2013) 69–7972
from different sources, including Global Historical Climatology Network version 2 (GHCN2) (Petersonand Vose, 1997) and the Global Surface Summary of Day (GSOD), and interpolated onto a 0.5�0.51latitude/longitude grid system as described in Willmott and Matsuura (1995).
Peel et al. (2007) show the geographic locations of the stations in GHCN2 (their Figs. 1–3),revealing that the geographic coverage of the stations vary with time and that there are many moretemperature stations than precipitation stations. In terms of the percentage of precipitation andtemperature stations with a value for a given month, 1900–1970 saw a strong increasing trend(30–90% for both temperature and precipitation stations), while there is a sizable decreasing trend
180° W 135° W 90° W 45° W 0° 45° E 90° E 135° E 180° E
90° S
45° S
0°
45° N
90° N
Af Am As Aw BWh BWk BSh BSk Csa Csb Csc Cwa Cwb Cwc Cfa Cfb Cfc Dsa Dsb Dsc Dsd Dwa Dwb Dwc Dwd Dfa Dfb Dfc Dfd ET EF
180° W 135° W 90° W 45° W 0° 45° E 90° E 135° E 180° E
90° S
45° S
0°
45° N
90° N
A B C D E
Fig. 1. Spatial distribution of the Köppen climate types for the period between 1901 and 2010: (a) with all sub-types included,(b) only the five major groups. The main characteristics of the climate types are described in Table 1.

180° W 135° W 90° W 45° W 0° 45° E 90° E 135° E 180° E
90° S
45° S
0°
45° N
90° N
A B C D E
180° W 135° W 90° W 45° W 0° 45° E 90° E 135° E 180° E
90° S
45° S
0°
45° N
90° N
A B C D E
180° W 135° W 90° W 45° W 0° 45° E 90° E 135° E 180° E
90° S
45° S
0°
45° N
90° N
A B C D E
Fig. 2. Spatially instable (black) and stable major Köppen climate types on three time scales: (a) interannual, (b) interdecadal,(c) 30 year.
D. Chen, H.W. Chen / Environmental Development 6 (2013) 69–79 73

1920 1930 1940 1950 1960 1970 1980 1990−4
−3
−2
−1
0
1
2
3
4
Year (centered)
Rel
ativ
e ar
ea c
hang
e (%
)
ABCDE
Fig. 3. Temporal changes in the relative areas (area for 30 year windows minus the long term mean during 1901–2010, dividedby the long termmean) of the five major Köppen groups. The 30 year window is moved forward with an interval of 10 years andthe years showing the data indicates the middle of the 30 year window, e.g. 1995¼1981–2010.
Table 1Main characteristic of the Köppen climate major groups and sub-types.
Major group Sub-types
A: Tropical Tropical rain forest: AfTropical monsoon: AmTropical wet and dry savanna: Aw (Sometimes As is used in place of Aw if the dryseason occurs during the time of higher sun and longer days)
B: Dry Desert (arid): BWh, BWkSteppe (semi-arid): BSh, BSk
C: Mild temperate Mediterranean: Csa, Csb, CscHumid subtropical: Cfa, CwaOceanic: Cfb, Cfc, Cwb, Cwc
D: Snow Humid: Dfa, Dwa, Dfb, Dwb, Dsa, DsbSubarctic: Dfc, Dwc, Dfd, Dwd, Dsc, Dsd
E: Polar Tundra: ETIce cap: EF
D. Chen, H.W. Chen / Environmental Development 6 (2013) 69–7974
starting from around 1970. Generally speaking, Europe, North America, Japan and eastern Australiahave good spatial and temporal coverage, while Africa, the polar regions and some tropical regionshave sparse station density and relatively short records.
To our knowledge, this dataset is the longest instrumental records that have been subject to theKöppen climate classification on the global scale.
2.2. Köppen climate classification over different periods of time
The Köppen climate classification consists of five major groups and a number of sub-types undereach major group, as listed in Table 1. While all the major groups except B are determined bytemperature only, all the sub-types except the two sub-types under E are decided based on thecombined criteria relating to seasonal temperature and precipitation. Therefore, the classificationscheme as a whole represents different climate regimes of various temperature and precipitationcombinations.
The tropical climate A is characterized by the lowest mean monthly air temperature being equal toor higher than 18 1C, while the four sub-types are decided based on the annual and seasonal meanprecipitation. The dry climate B is determined by the annual mean precipitation and temperature, aswell as the annual cycle of precipitation. Different sub-types distinguish between arid (desert) and

D. Chen, H.W. Chen / Environmental Development 6 (2013) 69–79 75
semi-arid areas and further seasonal difference in precipitation conditions. The mild temperate Crepresents the climate with the lowest monthly mean temperature between −3 1C and +18 1C, whilethe different seasonal precipitations give rise to the four sub-types. The snow climate D has the lowestmonthly mean temperature equal or lower than −3 1C, whereas the sub-types are decided based on theseasonal precipitation. Finally the polar climate E has the highest monthly mean temperature equal orlower than +10 1C, and the two sub-types further divide the major group into two temperatureconditions.
Here we mainly focus on the five major groups to demonstrate the application of the Köppenclassification as a tool to describe climate variation and change. The same method can be applied to allsub-types. A total of 31 sub-types are represented in the Köppen classification used in this study. SeeKottek et al. (2006) for details about the various criteria for each type.
The Köppen climatic types were obtained by applying the classification rules described in Kotteket al. (2006) to each grid cell of the 1 year, 10 year, and 30 year monthly mean precipitation andtemperature. For the 30 year scale, an overlapping in time is allowed. We look at changes of all theclimate types, with a focus on the major five groups, with a sliding window of 30 years. Every time wemove 10 years ahead, which means that the mean climate information used between two adjacent 30year periods has a 20 year overlapping period.
3. Results and discussions
First of all, the average monthly temperature and precipitation for 1901–2010 at all grid points onthe Earth are subject to the Köppen classification scheme and the results are shown in Fig. 1. Fig. 1ashows all 31 types which correspond well with the map of Rubel and Kottek (2010) who provided awelcomed update of the world climate classification map using gridded climate data during 1901–2002. The overall agreement between the two maps indicates that the dataset used in this study has agood quality, which gives us some confidence in the results to be analyzed below.
Since this study focuses on variations of the five major groups, the geographical distribution of themajor groups is first given in Fig. 1b. It is estimated that the five major groups A, B, C, D, E cover 19.4%,28.4%, 14.6%, 22.1%, and 15.5% of the total land area on Earth, respectively. This can be compared with19.4%, 29.1%, 14.7%, 21.6%, and 15.2% of the total land area covered by respective climate types A, B, C,D, E presented by Rubel and Kottek (2010) for the mean climate over 1976–2000. This comparisonagain shows that the dataset used in this study is comparable with the independent dataset used byRubel and Kottek (2010).
If the climate type or major group for a region remains the same, the region may be consideredstable in terms of the climate characterized by the climate type or group. Fig. 2 shows the stable andvariable climate regions on interannual, interdecadal, and climate time scales. We classified climatetypes for all grid points using annual, decadal, and 30 year running means of the climate data. If a gridpoint is always classified as a climate type under the same major group, it is shown in the same way asin Fig. 1b. Otherwise this grid point is taken as having varying climates on a given time scale since itcontains more than one climate type over the time period considered. This provides a means toidentify areas with stable climate types. If an experimental site to monitor environmental changesunder a typical climate type is needed, these stable areas should be preferred. On the hand, the areaswith shifting climate types are places where factors affecting the climate may have changed theirstrength, which provides indications for the dynamics behind the variation. Understanding thedynamics of these variations is one of the key tasks in climate research since the variation would haveimplications for the ecosystem changes.
Table 2 summarizes the fractions of the stable areas on interannual, interdecadal, and 30 year timescales. As shown by Fig. 2a, on the interannual scale there is a large variability, which results in largetransition areas for the major climate groups. Obviously, there are some regional differences, and lowlatitudes generally have larger stability than middle and high latitudes, as expected. Type D occupies alarge portion of the land area in the middle and high latitudes in the northern hemisphere andexperiences the largest relative temporal change in its area. Yoshino and Kazuko (1981) examined theyear-to-year variations of the Köppen types in eastern Asia and successfully linked these variations

Table 2Portion of spatially stable major Köppen climate types on different time scales.
Major group Time scales
Interannual (%) Interdecadal (%) 30-year (%)
A 45.5 89.0 94.2B 45.1 85.2 91.8C 35.3 77.4 87.3D 30.0 83.3 91.0E 78.2 92.8 96.2
D. Chen, H.W. Chen / Environmental Development 6 (2013) 69–7976
with the upper air streams such as the subtropical jet stream. He also discusses the impact of thesevariations on the agricultural production in the region.
The corresponding stable areas under interdecadal variations are much larger, as can be seen inFig. 2b. Again, more instable regions occur in middle and high latitudes. Relatively speaking, group Cnow takes the top position in terms of the area variability. Variations at interannual and interdecadaltime scales usually consider variability of climate. When we move to the 30 year time scale, therelatively small transition zones reflect changes in climate. At that time scale, the fractions of thestable climate types become large than those at other time scales. As pointed out by De Castro et al.(2007), regions with shifting climate types may impose a risk on the local ecosystem. Since certainsets of plants and animals are likely associated with environmental types such as the Köppen climatetypes, identification of spatially stable climates should be useful in the conservation of theseassociated plants and animals (Baker et al., 2010).
The identified unstable regions represent transition zones which deserve some special attention.As pointed out by Stern et al. (2000), Köppen's rigid boundary criteria often leads to largediscrepancies between climatic subdivisions and features of the natural landscape. In the nature, thedivision between two climate types can hardly be a sharp cut. Thus, the transition zone should betaken separately from the two distinct climate types. It can be considered a fuzzy division betweenthe two.
The identified changes of the Köppen types on climatic time scale may be used as a means todisplay changes in the global climate. A way to do this is to look at area changes in the major climategroups at the 30 year scale. Here we calculated the changes in the areas covered by the five majorgroups over nine intervals of the 30 year window. Fig. 4 shows the changes in terms of the fraction ofthe area in relation to the 1901–2010 long term mean.
As has been pointed out earlier, all major groups except B are decided based on temperature only.Thus changes associated with A, C, D, and E reflect changes in the temperatures. Out of the five majorgroups, A has the smallest relative change, while B and E show the largest changes over the wholeperiod of time. It is well known that the high latitudes, especially the polar regions, have much higherwarming than lower latitudes under the influence of the global warming, and the tropical regionsexperience very small changes (Solomon et al., 2007), which can explain the small and big changes inA and E respectively.
The area of type B shows an overall increasing trend while for type E there is a decreasing trendwhich is similar to that of group C over a large portion of the whole period. Several studies haveexamined the changes of the Köppen types over the last decades, which revealed a polewardmovement of the Köppen climate zones (e.g. Wang and Overland, 2004), in accordance with theglobal warming. Using a global climate model with changed vegetation types in the arctic region,Jeong et al. (2012) recently showed that the changed vegetation in the northern high latitudes cantrigger a positive feedback in the climate system. This positive feedback, in addition to the well-known ice-albedo feedback, may have contributed to the observed polar amplification effect.
The expansion of type B is most remarkable, since the area covered by B is the largest and the dryclimate represented by B has a significant impact on ecosystems and humans. This type of climate ischaracterized by the fact that precipitation is less than potential evapotranspiration. Thus, decreasedprecipitation in combination with increased temperature (evapotranspiration) may be the cause for
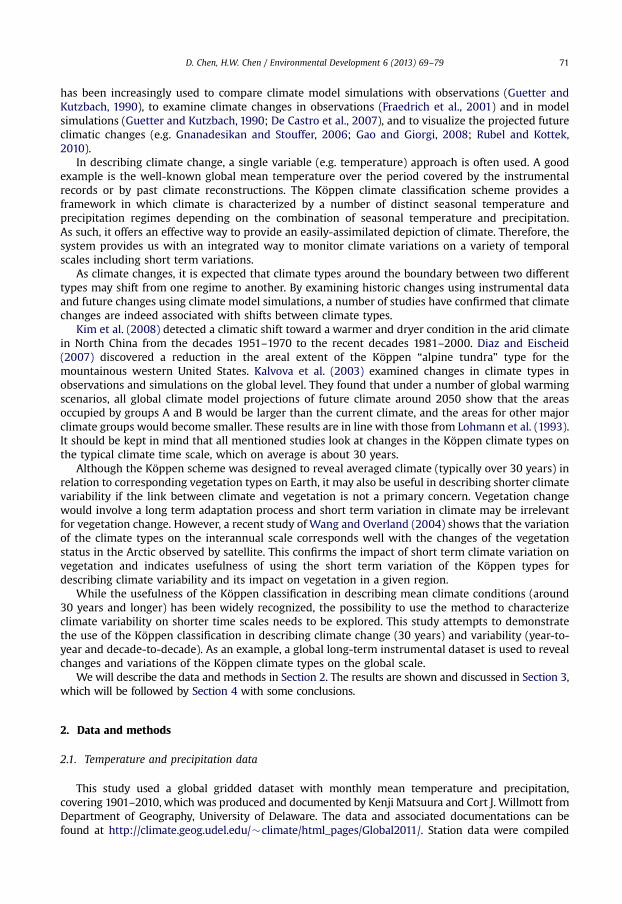
Fig. 4. Same as Fig. 3, but for all Köppen sub-types: (a) sub-types under A, (b) sub-types under B, (c) sub-types under C, (d) sub-types under D, (e) sub-types under E.
D. Chen, H.W. Chen / Environmental Development 6 (2013) 69–79 77
the expansion of type B whose poleward boundary is associated with the extension of the Hadleycirculation in the tropics. Several previous studies show that during the past few decades (startingfrom 1979) the tropical belt has expanded (e.g. Seidel et al., 2008). Whether the changes in group Bare associated with this expansion remains to be studied.
It would be interesting to determine the contribution of each of the sub-types in the total changesshown in Fig. 3. Therefore, we show in Fig. 4 the changes of all the sub-types in the same way as forthe major groups. For sub-types under A, the type As stands out as the most variable type. For the dryclimate, the identified increase for group B appears to be mainly caused by the increased in BWh,although other three types also have an overall increasing trend over the last few decades. For group Ctypes Cfc and Csc turn out to be the two most variable types which often have opposite directions intheir changes. As a result, the total change in group C is small. Dwd dominates the changes in group Dand all other types show relatively small changes compared with those of Dwd. However, the sub-types in group D generally have larger changes than those in other groups. There is almost no changein ET (tundra), whereas EF (ice cap) shows a dramatic change with a two stage decrease that causedthe overall decreasing trend for group E. Changes in EF is most likely a manifestation of the enhancedwarming in the arctic region under the global warming trend.
The intention of this work is to demonstrate the use of the Köppen system to depict climate variationand changes on the global scale. Although a detailed analysis of the reasons behind the identifiedchanges in the climate types is beyond the scope of this study, the analysis can give us useful informationabout regional climate variability/change and its potential impact on vegetation and should beperformed in future studies. This is especially true if such an analysis is done on the regional basis.
D. Chen, H.W. Chen / Environmental Development 6 (2013) 69–7978
4. Conclusions
The Köppen climate classification makes a useful link between climate and vegetation and provides asimple framework within which climate variability and climate can be described in an integrated way.Unlike the single variable approach, this description may be directly linked with consequences for thereal world and provide additional information about the changes in the global climate system (e.g. thebiosphere), which makes it an effective tool to monitor climate variations on various temporal scales.
By using a global gridded temperature and precipitation data over the period of 1901–2010, wereached the following conclusions:
�
Over the whole period (1901–2010), the mean climate distributions have a comparable pattern andportion with previous estimates. The five major groups A, B, C, D, E take up 19.4%, 28.4%, 14.6%,22.1%, and 15.5% of the total land area on Earth respectively. Since the relative changes of the areascovered by the five major groups are all small on the 30 year time scale, the agreement indicatesthat the climate dataset used overall is of comparable quality with those used in other studies.�
On the interannual, interdecadal, and 30 year time scales, the climate type for a given grid mayshift from one type to another and the spatial stability decreases towards shorter time scales.While the spatially stable climate regions identified are useful for conservation and other purposes,the instable regions mark the transition zones which deserve special attention since they may haveimplications for ecosystems and dynamics of the climate system.�
On the 30 year time scale, the dominating changes in the climate types over the whole period arethat the arid regions occupied by group B (mainly type BWh) have expanded and the regionsdominated by arctic climate (EF) have shrunk along with the global warming and regionalprecipitation changes.Acknowledgment
We thank an anonymous reviewer for very useful comments that allowed us to significantlyimprove the paper.
References
Bailey, R.G., 2009. Ecosystem Geography: From Ecoregions to Sites. Springer, New York.Baker, B., Diaz, H., Hargrove, W., Hoffman, F., 2010. Use of the Köppen–Trewartha climate classification to evaluate
climatic refugia in statistically derived ecoregions for the People's Republic of China. Climatic Change 98,113–131, http://dx.doi.org/10.1007/s10584-009-9622-2.
Box, E.O., 1981. Predicting physiognomic vegetation types with climate variables. Vegetatio 45, 27–39.De Castro, M., Gallardo, C., Jylha, K., Tuomenvirta, H., 2007. The use of a climate-type classification for assessing climate
change effects in Europe from an ensemble of nine regional climate models. Climate Change 81 (Suppl. 1),329–341, http://dx.doi.org/10.1007/s10584-006-9224-1.
Diaz, H.F., Eischeid, J.K., 2007. Disappearing “alpine tundra” Köppen climatic type in the western United States. GeophysicalResearch Letters 34, L18707, http://dx.doi.org/10.1029/2007GL031253.
Domroes, M., 2003. Climatological characteristics of the tropics in China: climate classification schemes between Germanscientists and Huang Bingwei. Journal of Geographical Sciences 13 (3), 271–285.
Elmendorf, S.C., Henry, G.H.R., Hollister, R.D., Björk, R.G., Boulanger-Lapointe, N., Cooper, E.J., Cornelissen, J.H.C., Day, T.A., Dorrepaal, E.,Elumeeva, T.G., Gill, M., Gould, W.A., Harte, J., Hik, D.S., Hofgaard, A., Johnson, D.R., Johnstone, J.F., Jónsdóttir, I.S., Jorgenson, J.C.,Klanderud, K., Klein, J.A., Koh, S., Kudo, G., Lara, M., Lévesque, E., Magnússon, B., May, J.L., Mercado-Dı´az, J.A., Michelsen, A.,Molau, U., Myers-Smith, I.H., Oberbauer, S.F., Onipchenko, V.G., Rixen, C., Schmidt, N.M., Shaver, G.R., Spasojevic, M.J.,Þórhallsdóttir, Þ.E., Tolvanen, A., Troxler, T., Tweedie, C.E., Villareal, S., Wahren, C.-H., Walker, X., Webber, P.J., Welker, J.M.,Wipf, S., 2012. Plot-scale evidence of tundra vegetation change and links to recent summer warming. Nature Climate Change 2(6), 453–457.
Fraedrich, K., Gerstengarbe, F.-W., Werner, P.C., 2001. Climate shifts during the last century. Climatic Change 50, 405–417.Gao, X., Giorgi, F., 2008. Increased aridity in the Mediterranean region under greenhouse gas forcing estimated from high
resolution simulations with a regional climate model. Global and Planetary Change 62, 195–209.Gnanadesikan, A., Stouffer, R.J., 2006. Diagnosing atmosphere-ocean general circulation model errors relevant to
the terrestrial biosphere using the Köppen climate classification. Geophysical Research Letters 33, L22701, http://dx.doi.org/10.1029/2006GL028098.
Guetter, P.J., Kutzbach, J.E., 1990. A modified Köppen classification applied to model simulations of glacial and interglacialclimates. Climatic Change 16 (2), 193–215.
D. Chen, H.W. Chen / Environmental Development 6 (2013) 69–79 79
Solomon, S, Qin, D., Manning, M., Chen, Z., Marquis, M., Averyt, K., Tignor, M., Miller, H.L., 2007. IPCC, 2007: Climate Change2007: The Physical Science Basis. Contribution of Working Group I to the Fourth Assessment Report of theIntergovernmental Panel on Climate Change. Cambridge University Press, Cambridge, United Kingdom and New York,NY, USA.
Jeong, J.-H., Kug, J.-S., Kim, B.-M., Min, S.-K., Linderholm, H.W., Ho, C.-H., Rayner, D., Chen, D., Jun, S.-Y., 2012. Greening inthe circumpolar high-latitude may amplify warming in the growing season. Climate Dynamics 38,1421–1431, http://dx.doi.org/10.1007/s00382-011-1142-x.
Kalvova, J., Halenka, T., Bezpalcova, K., Nemesova, I., 2003. Köppen climate types in observed and simulated climates. StudiaGeophysica et Geodaetica 47, 185–202.
Kim, H.-J., Wang, B., Ding, Q., Chung, I.-U., 2008. Changes in arid climate over North China detected by the Köppen climateclassification. Journal of Meteorological Society of Japan 86 (6), 981–990.
Köppen, W., 1900. Versuch einer Klassifikation der Klimate, vorzugsweise nach ihren Beziehungen zur Pflanzenwelt.Geographische Zeitschrift 6, 657–679.
Köppen, W., Geiger, R., 1930. Handbuch der Klimatologie. Gebrueder Borntraeger, Berlin.Kottek, M., Grieser, J., Beck, C., Rudolf, B., Rubel, F., 2006. World Map of the Köppen–Geiger climate classification updated.
Meteorologische Zeitschrift 15 (3), 259–263.Lohmann, R., Sausen, R., Bengtsson, L., Cubasch, U., Perlwitz, J., Roeckner, E., 1993. The Köppen climate classification as a
diagnostic tool for general circulation models. Climate Research 3, 177–193.Peel, M.C., Finlayson, B.L., McMahon, T.A., 2007. Updated world map of the Köppen–Geiger climate classification. Hydrology and
Earth System Sciences 11, 1633–1644, http://dx.doi.org/10.5194/hess-11-1633-2007.Peterson, T.C., Vose, R.S., 1997. An overview of the Global Historical Climatology Network temperature database. Bulletin of the
American Meteorological Society 78 (12), 2837–2849.Rubel, F., Kottek, M., 2010. Observed and projected climate shifts 1901–2100 depicted by world maps of the Köppen–Geiger
climate classification. Meteorologische Zeitschrift 19, 135–141, http://dx.doi.org/10.1127/0941-2948/2010/0430.Seidel, D.J., Fu, Q., Randel, W.J., Reichler, T.J., 2008. Widening of the tropical belt in a changing climate. Nature Geoscience 1,
21–24.Stern, H, de Hoedt, G., Ernst, J., 2000. Objective classification of Australian climates. Australian Meteological Magazine 49,
87–96.Thorthwaite, C.W., 1948. An approach toward a rational classification of climate. Geographical Review 38, 55–94.Wang, M., Overland, J.E., 2004. Detecting Arctic climate change using Köppen climate classification. Climate Change 67, 43–62.Wilcock, A.A., 1968. Köppen after fifty years. Annals of the Association of American Geographers 58 (1), 12–28.Willmott, C.J., Matsuura, K., 1995. Smart interpolation of annually averaged air temperature in the United States. Journal of
Applied Meteorology 34 (12), 2577–2586.Yoshino, M.M., Kazuko, U., 1981. Regionality of climatic change in East Asia. Geo Journal 5 (2), 123–132.Zhou, G., Wang, Y., 2000. Global change and climate-vegetation classification. Chinese Science Bulletin 45 (7), 577–585.