using the bloomberg professional system for finance classes · using the bloomberg professional...
TRANSCRIPT

Using the Bloomberg Professional System for Finance Classes
Thomas S. Coe
Quinnipiac University
In recent years, business schools have made sizeable investments in technology that provide students with instruction and experience in collecting , processing and communicating information as well as other skills that are transferable to
the workplace upon graduation. A growing number of schools already have invested orare considering an investment in the Bloomberg Professional System as a tool for students in various fìnance classes. This subscription service , provided by Bloomberg L.P., provides a wealth of information that can be illustrated formany topics covered in undergraduate and graduate courses. This paper identifies potential applications for illustrating the fìnancial data available
through a Bloomberg subscription and presents the potential benefìts to a university for investing in Bloomberg compared to traditional reference materials that have been part of many university library holdings.
INTRODUCTION
Financial education has continuously blended theory and practice and has derived
much of its popularity with business students by bringing financial data into the classroom. The use of financial data has developed from the sifting of annual reports of publicly-traded corporations to the ability to track tick-by-tick trading in real time. Keeping abreast of the various resources of financial data has become both a time- consuming as well as a resource-consuming hurdle for instructors, school libraries and administrators. More recently, schools have made sizeable investments in teaching centers, computer labs, and financial information centers (the "trading rooms") for students to witness the dynamic forces at work in various markets.
An irony shown between teaching and research is that while many professors themselves utilize databases in their research, there is little application of those same databases in the classroom (Clinebell and Clinebell, 1995). Since many schools do subscribe to many databases, extending the use to classroom applications would be a way to spread out the costs and more easily justify the continued investment in these resources.
48 Journal of Financial Education
WHAT IS BLOOMBERG?
Bloomberg is the popular subscription-based data service that provides a vast array of financial, economic and general information to users. Bloomberg LLP originally offered this service to the investment community and has expanded the service to individuals and academic institutions. In addition to the breadth of data that the service
provides, the easy access to this data is also an attraction for many users. The service mimics the services of cable TV providers, providing access through a portal (the subscriber's television) that, while fixed in its location, offers easy accessibility to content that the subscriber can choose.
Bloomberg in fact, does provide its information services to the various media. There
is Bloomberg Radio, Bloomberg TV and Bloomberg.com. These basic services draw data from the same sources and provide news and some analysis to a wider audience than that of the subscriber base. The expanded resources that are available to subscribers is the
expanded access to Bloomberg Professional Systems.
RELATED STUDIES
Much of the literature stems from the use of technology and computer applications in teaching. Since there formerly were relatively few databases that could be incorporated into classroom illustrations and applications, there has been little research into the use of such databases. In addition, while many instructors have their own favorite websites, based on their own individual research interests or through casual browsing, many students are unaware of the vast number of sites as well as the alternatives to searching for sites to find specific information.
Clinebell and Clinebell (1995) used information generated by a survey of 241 schools and found a varied use of databases. Investment classes had the highest usage (32.4%) of databases, while Institutions classes had the least (5.4%). Their survey also found, not surprisingly, that larger schools showed a greater use of databases. St. Pierre (1996) looks
at the benefits of the Bridge Information System, which, like Bloomberg, is a proprietary system that bundles information from different contributors. Smith (1996) shows an
illustration of online access to EDGAR and presents a format that instructors can apply different internet resources that offer flexibility in teaching.
CLASSROOM APPLICATIONS
St. Pierre (1996) provides some examples of the uses of Bridge in classroom applications. Following her design, some general illustrations are shown here.
Spring 2007 49

Figure 1. Figure 1 Ratios Illustration
(Used with permission of Bloomberg LP)
Financial Management
Students in undergraduate and graduate financial management classes are shown the management of corporations and the use of ratios in determining the success, or lack of, in management's ability to operate businesses. Bloomberg, as do many resources, provides the financial statements to allow students to learn fundamental analysis. Like other resources, Bloomberg provides quick snapshots of various ratios. Figure 1 illustrates these ratios for a company. These can be viewed for The Home Depot by typing the command "HD <EQUITY> DES <GO>". In addition, Bloomberg has additional descriptive characteristics and incorporates materials from third party contributors, such as Hoover's, to efficiently provide more details of a company's operations, history, and management.
Another application for using a firm's financial information is in approximating the cost of capital from the use of debt and equity. Bloomberg illustrates a calculation for the
50 Journal of Financial Education
Page P065 Equity DES Hit 1 <GÜ> for more detailed financial analysis (FA).
RATIOS Page 3 /10 HD US HOME DEPOT INC
FY END JAN 2007 * = Trailing 12 month - = Last Quarter Q4:2007 ISSUE DATA PER SHňRE DATA CASH FLOU ANALYSIS
Price USD 38,22 Pr ice/Cashf lou #P/E 13.36 ^Trailing 12m EPS 2.86 Price/FCF *Div Yld 2.35 2 Dividends/share .68 Cashflou/net ine -Price/Book 3.04 -Book value/share 12.56 Payout ratio 24.0755 ««Price/Sales .86 Sales/share 44.22 Csh gen/Csh req *EV/T12 EBITDA 7.86 Cash Flou/Basic sh Dvd coverage 4.16 -Market cap. 78002. lOh-Shares out 2040.87 Cash-oper/sales -Enterprise Value89049. 10H FCF/share
GR0UTH POTENTIAL PROFITABILITY STRUCTURE Dil EPS CO YrChg 2.842 EBITDA 11435. 00h -Current ratio 1.39 Cap Yr change 18. 385C EBIT 9673. 001* -Quick ratio .30 BVPS Yr change -.872 Operating margin 10.652-Debt to assets 22.312 R & D to sales Pretax margin 10.252-T debt/Com eqty 46.5955 Retention rate 75. 93JC Return on assets 11.912 A/R turnover 32.33 Sales Yr change 11.442 Return on Com Eqty 22.182 Inv. turnover 5.04 Employee Yr chan Return on cap. 17.742 Gross margin 32.792 Asset Yr change 17.4921 Asset turnover
Currency: US DOLLAR Australia 61 2 9777 8600 Brazil 5511 3048 4500 Europe 44 20 7330 7500 Germany 49 69 920410 Hong Kong 852 2977 6000 Japan 81 3 3201 8900 Singapore 65 6212 1000 U.S. 1 212 318 2000 Copyright 2007 Bloomberg LP.
H 187- 1067-1 25-Mar - 2007 15 43 03

Figuře 2. WACC Calculator Illustration
Used with permission of Bloomberg LP)
Weighted Average Cost of Capital using both; drawing upon either current period data or user-inputted values. Figure 2 shows the WACC for Home Depot. The command for this is "HD<EQUITY> WACC <GO>".
Investments
Students in various investments-related courses are shown the types, characteristics and uses of debt and equity securities. While much information is available for publicly traded common stock from alternative outlets, less information is provided towards the
respective debt and preferred issues a company may have outstanding. Bloomberg provides a great deal of descriptive as well as pricing data for these other instruments that
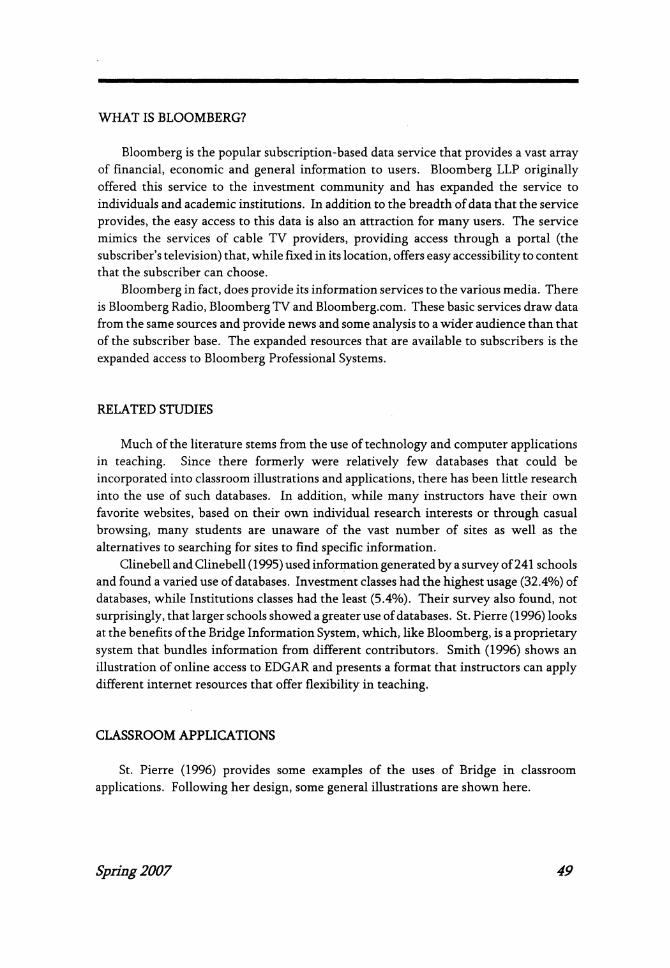
offer details for students to learn more of how these are valued. Figure 3, found by the command "HD <CORP> GP <GO>" shows the price history for Home Depot's 5 3/8% note that matured in April 2006. In addition to graphic illustrations, actual prices are
provided in tabular form (function HP) for accuracy as well as copying or exporting to a spreadsheet. The descriptive characteristics of the preferred "B" issue for Six Flags, Inc.
Spring 2007 51
<HELP> for explanation, <MENU> for similar functions. P065 Equity UACC Enter KG0> for detai Is
I UE I GHTÉÜ AVERAGE COST OF CAPI TAL ^
WEIGHTED AVERAGE COST OF CAPITAL CAPITAL STRUCTURE
1) Equity 2) Debt 3)Pref. Eqty Market Cap 75,771 .08 1 Weight 90.28 % 9 72% 0.00% ST Debt 1,486.00 Cost 10.93% 3.33% 0.00% |LTDebt 6,671.00 Weight X Cost 9.87% 0.32% 0.00% Pref. Eqty 0.00
jotai 83,928.08 WACC 10.19% Millions of USD
4) Net Op Profit 10,1 19.00 12
5) Cash Op. Taxes 4,462.84 10 NOPAT 5,656. 1 6 8 -■ | p- ;vV ' 6) Total Inv Cap 50,732.00 * . 11 Capital Charge 5,169.95 . 1||
Eco. Val Added 486.21 „} H
% ROIC EVA Spread 0 2000 4000 6000 R0IC 1115% Millions of USD EVA Spread 0.96%
Australia 61 2 9777 8600 Brazil 5511 3048 4500 Europe 44 20 7330 7500 GěřŤ!^ňy^9^^20Tr0 Hong Kong 852 2977 6000 Japan 81 3 3201 8900 Singapore 65 6212 1000 U.S. 1 212 318 2000 Copyright 2007 Bloomberg L.P.
H 187- 1067-1 25-Mar - 2007 15 = 45 = 03
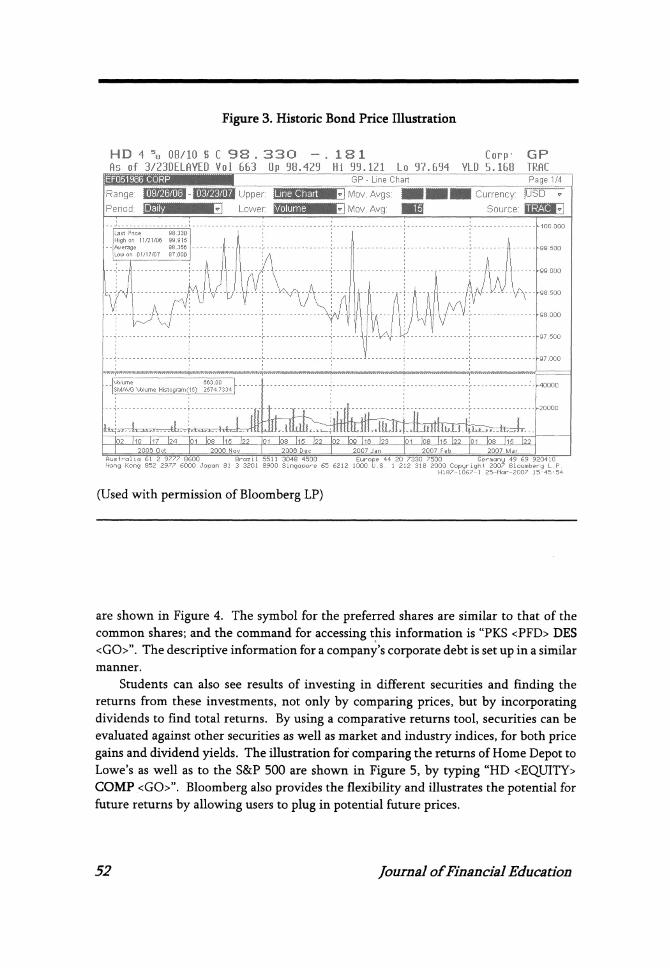
Figure 3. Historie Bond Price Illustration
(Used with permission of Bloomberg LP)
are shown in Figure 4. The symbol for the preferred shares are similar to that of the
common shares; and the command for accessing this information is "PKS <PFD> DES <GO>". The descriptive information for a company's corporate debt is set up in a similar manner.
Students can also see results of investing in different securities and finding the returns from these investments, not only by comparing prices, but by incorporating dividends to find total returns. By using a comparative returns tool, securities can be evaluated against other securities as well as market and industry indices, for both price
gains and dividend yields. The illustration for comparing the returns of Home Depot to Lowe's as well as to the S&P 500 are shown in Figure 5, by typing "HD <EQUITY> COMP <GO>". Bloomberg also provides the flexibility and illustrates the potential for future returns by allowing users to plug in potential future prices.
52 Journal of Financial Education

Figure 4. Preferred Stock Description Illustration
(Used with permission of Bloomberg LP)
Figure 5. Stock Comparison Description
Spring 2007 53
DES P065 Pfd DES
PREFERRED SECURITY DISPLAY Page 1/ 1 SIX FLAGS INC (SIX ) 7.2500X 8/15/09 Series [EXCH] CONVERTIBLE INFORMATION IDENTIFIERS 1) Additional Sec Info CONV TO 1.1990 SHARES EXCH SYM SIX B 2) Convertible Info. SIX (US ) $6.08 ( ) ISIN US83001P5052 3) Corporate Actions CONVERTIBLE UNTIL 8/14/09 IUSIP 83001P505 4) Cds Spreads/RED Info PARITY 7.29 PREMIUM 220.85 RATINGS 5) Rat i ngs CUMULATIVE Moody's Caa2 6) Custom Notes Name SIX FLAGS INC B&P CCC- *- 7) Identifiers
Market of Issue Pubi i c
SECURITY INFORMATION Country US Currency
DTv 7 }a X Fixed ìmt Issued/Outstanding 11) Involved Parties 3UARTLY
Jorkout Series 11,500,000.00 SHR 13) Pricing Sources CONVERTIBLE
1st Settle Date 1/23/01 25.00/ 25.00 15) Related Securities Div Pay Date 2/15/07 Par Amount 25.00 16) Issuer Ueb Page Ex-Div Date 1/30/07 BOOK RUNNER/EXCHANGE Cale Typ ( 57)XTYPE PRFD LEH 65) Old DES HAVE PROSPECTUS PTC
PRX/SHR=I20.85. PREM=20X. PIERS (PFD INCOME EQTY REDEEMABLE SHRS). DEP SHR REP 1/100 SHR PFD. MAND CVR IF CM STK 0LST 120X OF CVR PRX FROM 2/15/04. POISON PUT. Australia 61 2 9 777 8600 Brazil 5511 3048 4500 Europe 44 20 7330 7500 Germany 49 69 920410 Hong Kong 852 2977 6000 Japan 81 3 3201 8900 Singapore 65 6212 1000 U.S. 1 212 318 2000 Copyright 2007 Bloomberg LP.
H 187- 1067-1 25-Mar-2007 15 47 19
DES PO 65 Pfd DES
PREFERRED SECURITY DISPLAY Page 1/ 1 SIX FLAGS INC (SIX ) 7.2500X 8/15/09 Series [EXCH] CÛNVERTIÈLË INFORMATION
CONV TO 1.1990 SHARES [XCH SYM SIX B 2) Convertible Info. SIX (US ) S6.08 ( ) ISIN US83001P5052 3) Corporate Actions CONVERTIBLE UNTIL 8/14/09 IUSIP 83001P505 4) Cds Spreads/RED Info PARITY 7.29 PREMIUM 220.85 TĀTlNGS 5) Ratings CUMULATIVE loody's Caa2 6) Custom Notes Name SIX FLAGS INC S&P CCC- *- 7) Identifiers Market of Issue Public ritch CCC- 8) Fees/Restrictions
ŽÉÚJŘITY ÍNfÚRMÓTlÚÑ Composi te CCC- Country US Currency USD "ISSUE SIZE
DTv 7 *4 X Fixed ìmt Issued/Outstanding 11) Involved Parties 3UARTLY 30/360
Jorkout Seri es 11,500,000.00 SHR 13) Pricing Sources ¡CONVERTIBLE
1st Settle Date 1/23/01 25.00/ 25.00 15) Related Securities Div Pay Date 2/15/07 Par Amount 25.00 1G) Issuer Ueb Page Ex-Div Date 1/30/07 BOOK RUNNER/EXCHANGE Cale Typ ( 57)XTYPE PRFD LEH 65) Old DES HAVE PROSPECTUS PTC
PRX/SHR=$20 . 85. PREM=20X. PIERS (PFP INCOME EQTY REPEEMABLE SHRS). PEP SHR REP 1/100 SHR PFP. MANP CVR IF CM STK @LST 120X OF CVR PRX FROM 2/15/04. POISON PUT. Australia 61 2 9777 8600 Brazil 5511 3048 4500 Europe 44 20 7330 7500 Germany 49 69 920410 Hong Kong 852 2977 6000 Japan 81 3 3201 8900 Singapore 65 6212 1000 U.S. 1 212 318 2000 Copyright 2007 Bloomberg L P.
H 187- 1067-1 25-Mar - 2007 15 = 47 >19

Figure 6. International Stock Markets Illustration
(Used with permission of Bloomberg LP)
International Finance
International finance classes offer the study of different global markets and the
investment and financing alternatives. Bloomberg provides descriptive details and pricing for thousands of international securities and markets that is very difficult to find
elsewhere. Since the pricing data feeds into Bloomberg in real time, it is easy to see the activity of the markets by watching the prices change. Figure 6 shows the main menu for accessing the various global stock markets as well as the respective indices that participate in those markets. The command to access this menu is "<COMDTY> WEI <GO>".
Learning the different foreign currencies and the exchange rates between currencies
is another popular aspect of international finance. With Bloomberg, almost all currencies
can be examined and the exchange rates and cross-currency rates can be illustrated effectively. The dynamics and the power of having near-time access to market information is highlighted by the changes in exchange rates during a trading day. Figure
7 shows a cross-currency table set up for the major currencies ("<CURNCY> FXC <GO>").
54 Journal of Financial Education
UE I N166 Govt UE I Hit # <G0> to select security Uorld Equity Indices
Base Currency^HDS Ticker:[¡) Last Trade Information
ID Americas 22) News Value Net Chg X Chg Time X Ytd X YtdCur 4) DŪU JONES INDUS. AVG 12461.14 +13.62 +.11 16:03 r7Ü2 =764" 5) S&P 500 INDEX 1434.56 -.48 -.03 16:05 +1.15 +.52 6) NASDAQ COMPOSITE INDEX 2451.74 -4.18 -.17 16:05 +1.51 +.88 7) S&P/TSX COMPOSITE INDEX 13141.59 -13.96 -.1116:05 +1.81 +1.81 8) MEXICO BOLSA INDEX 28270.95 +51.40 +.18 15:45 +6.89 +4.27 9) BRňZIL BOVESPA STOCK IPX Ņ5442.10 -188.76 -.41 16:05 +2.18 +5.25
2) Europe/Africa/Middle East 23) Neus 10) DJ STOXX 50 € PR 13726.62 +68.77 +1.88 13:22 1 +7ÜÖ +T729" 11) ETSE 100 INDEX 6318.00 +61.20 +.98 12:36 +1.56 +1.33 12) CAC 40 INDEX 5598.37 +96.19 +1.75 13:10 +1.02 +1.52 13) DAX INDEX 6856.96 +144.90 +2.16 15:29 +3.94 +4.45 14) IBEX 35 INDEX 14490.10 +179.60 +1.26 12:38 +2.43 +2.93 15) S&P/MIB INDEX 41547.00 +828.00 +2.03 12:35 +.27 +.77 16) AMSTERDAM EXCHANGES INDX 509.01 +8.12 +1.62 13:07 +2.76 +3.27 17) OMX STOCKHOLM 30 INDEX 1223.57 +18.90 +1.57 12:44 +6.65 +3.97
IB) SUISS MARKET INDEX 3D Asia/Pacific 24) Neus 119) NIKKEI 22$
20) HANG SENG INDEX 19690.25+173.84 +.89 4:01 -1.37 -2.36 21) S&P/ASX 200 INDEX 5955.70 +93.80 +1.60 3/22 +5.04 +6.82 Australia 61 2 9777 8600 Brazil 5511 3048 4500 Europe 44 20 7330 7500 Germany 49 69 920410 Hong Kong 852 2977 6000 Japan 81 3 3201 8900 Singapore 65 6212 1000 U.S. 1 212 318 2000 Copyright 2007 Bloomberg LP.
G385-70-1 22-Mar-2007 16 05 48

Figure 7. Exchange Rates Illustration
<HELP> for explanation, <MENU> for similar functions. P065 Curncy F XC
16:05 Sun 3/25
KEY CROSS CURRENCY RATES
USD EUR JPY GBP CHF CfiD ňUD NZD HKD NOK SEK SEK 6.9950 9.2938 5.9289 13.717 5.7376 6.0265-5.6341 4.9752 .89545 1.1443 .... MOK 6.1127 8.1216 5.1811 11.987 5,0139 5.2663 4.9234 4.3476 .78250
HKD 7.8117 10.379 6.6212 15.319 6.4075 6.7302 6.2919 5.5561 .... 1.2780 1.1168 MZD 1.4060 1.8680 1.1917 2.7571 1.1532 1.2113 1.1324
3UD 1.2415 1.6496 1.0523 2.4347 1.0184 1.0696
ZňD 1.1607 1.5422 .98381 2.2761 .95206
INF 1.2192 1.6198 1.0334 2.3908 .... 1.0504 .98196 .86712 .15607 .19945 .17429 jBP .50994 . 67754 . 43223
JPY 117.98 156.75 .... 231.36 96.772 101.65 95.027 83.913 15.103 19.301 16.866 EUR .75264
JSD .... 1.3207 .84760 1.9610 .82024 .86155 .00545 .71125 .12001 .16360 .14296 (xlOO)
ami Enter IM, 211 etc. for forward rates | EURO 0 Default Currencies Hit -1, -2. . . <Page> for previous days Q Shou all
monitoring enabled: decrease increase no change BLOOMBERG Composite Australia 61 2 9777 8600 Brazil 5511 3048 4500 Europe 44 20 7330 7500 Germany 49 69 920410 Hong Kong 852 29 77 6000 Japan 81 3 3201 8900 Singapore 65 6212 lOOO U.S. 1 212 318 2000 Copyright 2007 Bloomberg L.P.
H 187- 1067-1 25-Ma» - 2007 16 = 05*33
(Used with permission of Bloomberg LP)
Students can compare U.S. -traded ADRs with the original issues (or equivalent issues) in other markets. This provides a useful illustration of the interaction of markets
as well as learning more of price parity.
Derivatives
More finance departments are offering specific courses in derivatives, and the access
to more information is available. There are several internet sites that provide information
for options and futures quotes, but Bloomberg extends the descriptive as well as the informative elements of these instruments and provides historic prices and graphs (including expired contracts). In addition, Bloomberg includes calculators, including the Black-Scholes Option Pricing Model. Figure 8 depicts a partial Options Monitor for Home Depot, showing the various strike prices and expiration dates for both calls and
puts. This can be found by typing "HD <EQUITY> OMON <GO>". Each specific option contract has its unique symbol, and can be separately accessed for historic prices and trading volume. Similar to options, futures contracts can be identified and tracked. The
access to the various commodities can be found by the command "<COMDTYxGO>".
Spring 2007 55

Figure 8. Options Monitor Illustration
HD US t SC 38 . 22 -.11 N -x- SHO Equity OMON ňs of Mar23 DELAYED Vol 11,566,757 Op 38.35 N Hi 38.17 N Lo 38.07 N
T.mpHL.L« J Ed» .1 Contud Month* I S.-H, LM -»"MIEWIÎ
Option Monitor: HOME DEPOT INC Center HHE9ES Number of Strikes QU ~Qr~ fpom Center Exchange
(Composite )
I Ticker |Strike| Bid | fisk | Last | Vol ume J Open! Ticker |Strike| Bid | ňsk | Last |Volume|Clpen| HD 21 fìPR 07 (Contract Size: 100) HD 21 fìPR 07 (Contract Size: 100)
D HD+DFI 30.001 8.301 8.401 8.90 y| i8)HD+PF| 30.001 .051 .04 y I 2) HD+DZ 32.50 5.80 6.00 6.00 y
3) HD+DG 35.00 3.40 3.50 3.60 y
4) HD+DU 37.50 1.30 1.35 1.34 y
5) HD+DH 40.00
e) HD+DV 42.50
7) HD+DI 45.00
8) HD+DS 47.50
ft) HD+DJ 50.00
io)HD+DK 55.00
")HD+DL| 60.001
HP 19 MfìY 07 (Contract Size: 100) HP 19 MAY 07 (Contract Size: 1QQ)
12)HD+EE| 25. 00113.40113. 50112. 70 yl 20)HP+QE| 25.001 .051 .05 yl 13)HPtEY"27".5Q 10.90 11.00 11.00 y
10HD+EF "āoT.OO 8.40 8.60 7.90 y
i«)HD+EZ "32.50 6.00 6.10 6.20 y 30
'6)HD+EG ~35".00 3.70 3.80 3.90 y
Australia 61 2 9777 8600 Brazil 5511 3048 4500 Europe 44 20 7330 7500 Germany 49 69 920 IO Hong Kong 852 2977 6000 Japan 81 3 3201 8900 Singapore 65 6212 ÌOOO U.S. 1 212 318 2000 Copyright 2007 Bloomberg LP.
H 187- 1067-1 25-Mar-2007 16=06 09
(Used with permission of Bloomberg LP)
Figure 9 furthers this illustration by highlighting the various types of metals futures contracts ("<COMDTY> METL <GO>"). Again, the vast array of data available through Bloomberg is highlighted here. Each of these metals contracts has its own unique symbol. Each can be examined for its own price history as well as finding any options contracts written on each futures contract.
Banking
Students in banking classes utilize financial statement information and conduct ratio
analysis both to determine the management of banking institutions as well as potential and existing loan accounts. In addition to having economic data available, Bloomberg provides current interest rates and illustrates alternative yield curves to apply to interest
rate models. The Yield Curve on any specific day is illustrated in Figure 10, and can be accessed by typing "<GOVT > YCRV <GO>". Bloomberg includes credit risk models, such as a calculator that determines the Altman "Z" Score for companies. The "Z" Score, found
in Figure 11 for the Ford Motor Company, is illustrated by typing "F <EQUITY> AZS <GO>". The calculation is time-specific (the data for the most recent quarter is shown)
56 Journal of Financial Education
Figure 9. Commodities Illustration
Comdty METL P065 Comdty METL
M e -ta 1 Markets Ticker
1) Precious Metals Symbol Value Change % Change Time 14) Gold Spot
5) COMEX Gold Active Month jCJ? 657.30 -6.90 -1.04% 03/23 6) Silver Spot 3ILV 13.16 -.30 -2.23 % 03/23 ?) COMEX Silver fictive Month Sir? 13.23 -.25 -1.88% 03/23 8) Platinum Spot 3LAT 1227.00 -9.00 -.73/! 03/23 9) NYMEX Platinum fictive Month 3LJ7 1233.40 -7.60 -.61/. 03/23 10) Palladium Spot 3ALL 353.00 -2.50 70X 03/23 11) NYMEX Palladium fictive Month PAM7 359,50 1.75 .49% 03/23 2) Base Metals 12) LME 3 month Aluminum High Grade LMAHDS03 2763.00 -17.00 -.SIX 03/23 13) LME 3 Month Copper .MCADS03 6720.00 .00 .00% 03/23 14) LME 3 Month Lead .MPBDS03 1900.00 -25.00 -1.30% 03/23 15) LME 3 Month Zinc J1ZSDS03 3155.00 -45.00 -1.41X 03/23 16) COMEX Copper HGK7 306.90 -.40 -.13% 03/23 17) Shanghai Copper
3) Metal Bulletin Steel Prices
118) Chinese Hot Rolled Coil MBSTCHHR 350(5 HJÖ .00% 10/19 | 19) U.S. Hot Rolled Coil
Australia 61 2 9777 8600 Brazil 5511 3048 4500 Europe 44 20 7330 7500 Germany 49 69 920410 Hong Kong 852 2977 6000 Japan 81 3 3201 8900 Singapore 65 6212 lOOO U.S. 1 212 318 2000 Copyright 2007 Bloomberg LP.
H 187- 1067-1 25-Mai - 2007 16 = 06 = 36
(Used with permission of Bloomberg LP)
and draws from the same variables that were used in the original model. In addition,
Bloomberg provides a "Financial Health" grade that gives an additional measure of risk by combining both the Altman "Z" with the company's average rating on its debt.
SUBSTITUTION FOR EXISTING LIBRARY RESOURCES
University libraries have made substantial investments of monetary and space resources with subscriptions to financial resources in both print and online access. An obvious challenge to a school of any size to adopting Bloomberg as a primary source of financial data wotild be the cost of the subscriptions for other materials. However, as Pettijohn (1996) states, 'navigating the Internet with a Web browser generally is much easier than scanning library indexes or hunting through stacks for articles. . The ease of accessing data from a PC or laptop to information is an attractive alternative for many students and instructors.
With establishing a dedicated finance lab, a School of Business takes on some of the characteristics of a library, namely, by providing the use of the resources to those who
Spring 2007 57

Figure 10. Yield Curve
Figure 11. Altman's "Z" Score
58 Journal of Financial Education
Govt VCRV P065 Govt YCRV 1 <Go> to vi eu curves. 2 <Go> to save template.
YIELD CURVE ANALYSIS
Templates J Function Defaults ¡ New Template SEARCH CURVE ID CURVE NAME DATE
¡Q Curves by Region r-*-, a _ US Dollar Swaps (30/360, S/A) OH IÍMKHbHM [+p37 & a _ Eurozone IÍMKHbHM
S- Asia Pacific lOmij USD Treasury Composite [+}-Central 11111 ļjļļjjļļjjjjļjjjjļ ļ+j-Eastern Europe
m-North America ļ Expand graph 1 1 Save Template ļ r+T-Western Eurooe
Fl Curves by Curve Type ¡1 !!!!!!! !
f+ļ-Governmerrt /Benchmark Curves frV ; ; ;
F>Swap & Swap Spreads ¡ j ¡ ' i Jt' ' i i i M-Corporate/Credit Curves
1+J-Money Market Curves ! ! i i ! 'Í i ¡ i y/¡ : T " - Ì [^Municipal Curves j j j ¡ ¡ V ¡ ¡X; ' j ' j
í+1 Custom Created Curves ¡ '• • ! ¡ '/*' ; ; ' ¡ ; II I i » i I I I i i i »
1-1 II
1 D- 7D
Australia 61 2 977 7 8600 Brazil 5511 3048 4500 Europe 44 20 7330 7500 Germany 49 69 920410 Hong Kong 852 2977 6000 Japan 81 3 3201 8900 Singapore 65 6212 1000 U.S. 1 212 318 2000 Copyright 2007 Bloomberg LP.
H 187- 1067-1 2 5- Mat - 2007 16 = 07 53
<HELP> for explanation, <MENU> for similar functions. P065 Equity AZS
ALTMAN'S Z-SCORE MODEL
F US
Total Assets ll^£!3IB99 Uorking Capital Retained Earnings
Financial Health Assessment and Outlook
Reference Date 12/2006 Calculate: 0 Credit Rating B ñltman's Zscore 0.34
Health Grade F
Australia 61 2 9777 8600 Brazil 5511 3048 4500 Europe 44 20 7330 7500 Germany 49 69 920410 Hong Kong 852 2977 6000 Japan 81 3 3201 8900 Singapore 65 6212 1000 U.S. 1 212 318 2000 Copyright 2007 Bloomberg L.P.
H 187- 1067-0 25-Mai - 2007 17 = 28-15

support and maintain the cost of such resources and to restrict, appropriately, the access
and use of resources to others. By agreement, the use of the "open" and "closed" Bloomberg systems both allows and restricts access to those who directly benefit from and support the use of Bloomberg in classes and limits access to those that may use Bloomberg for separate purposes.
The monthly subscription for the Bloomberg Professional System is $675. There is an additional charge for equipment rental, which is $100 per month. This would make the annual cost of subscribing $9,300. This university subscription for academic use is half of the regular desktop rate charged to commercial customers.
The annual subscriptions1 to some of the widely utilized publications, and their format, are as follows:
Subscription Prices of Finance-related Library References
International
International
Standard & Poor's Net Advantage Online $13,219 Standard & Poor's Research Insight Online $16,964 Bloomberg Professional (Academic)
COMPARISON TO INTERNET RESOURCES
A major source of competition for the use of Bloomberg is the access to online resources through the Internet. Morris (1998) provides illustrative subscription prices for a variety of Internet-based quote systems. With the exception of Bridge, most of the
services do not provide more than current quotes and charts. For the purpose of many classroom illustrations, historic data would be more suitable.
Internet portals, such as AOL and Yahoo! provide news, quotes, and charts, and also provide some historical quotes for U.S. equities and for some indices. With some providers, the historical quotes can be easily downloaded and exported into spreadsheets. The major drawback to the many free resources is that the information provided is the lack of historical data, beyond charts, and the breadth of information available through
Spring 2007 59
one site. Another drawback is the simple fact that the data is found at different web sites.
Internet-based finance sites provide much in the way of descriptions of the various types of securities available. Through subscriptions, clients can access further data, both historical as well as real-time that corresponds to their respective needs.
APPLYING BLOOMBERG TO RESEARCH PROJECTS
Bloomberg provides two means of accessing data. The first, more familiar version
is the "open" system. The open system is password-protected and provides limited flexibility in downloading data for further use. Typically, the only means to use data through this version is to transcribe manually or to copy the contents from the screen onto another application, typically Excel. This limits the amount of data that can be put to use and creates the potential for input errors.
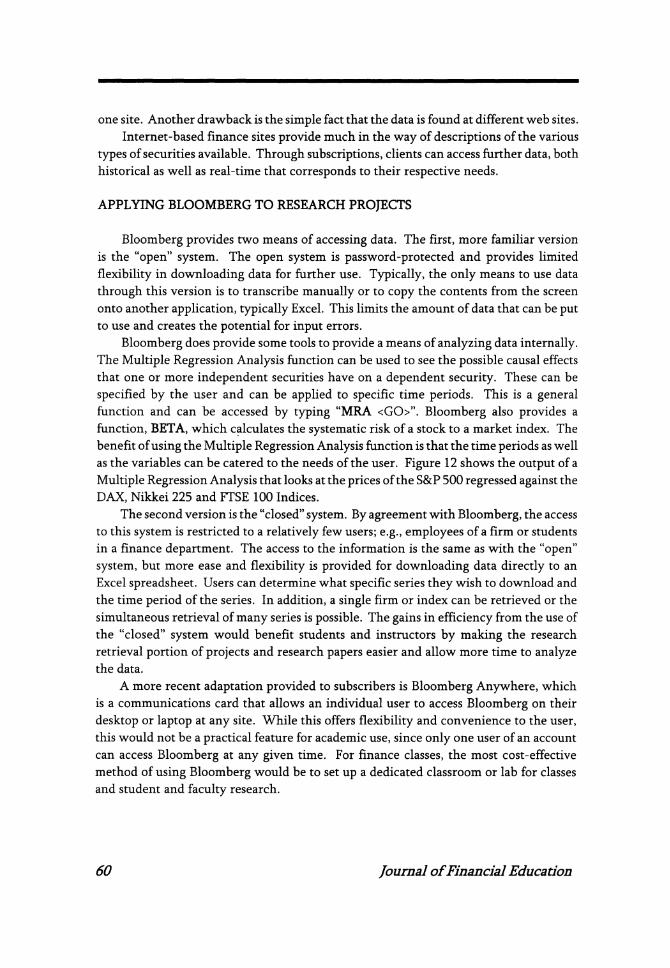
Bloomberg does provide some tools to provide a means of analyzing data internally. The Multiple Regression Analysis function can be used to see the possible causal effects that one or more independent securities have on a dependent security. These can be specified by the user and can be applied to specific time periods. This is a general function and can be accessed by typing "MRA <GO>". Bloomberg also provides a function, BETA, which calculates the systematic risk of a stock to a market index. The benefit of using the Multiple Regression Analysis function is that the time periods as well
as the variables can be catered to the needs of the user. Figure 12 shows the output of a Multiple Regression Analysis that looks at the prices of the S&P 500 regressed against the DAX, Nikkei 225 and FTSE 100 Indices.
The second version is the "closed" system. By agreement with Bloomberg, the access to this system is restricted to a relatively few users; e.g., employees of a firm or students
in a finance department. The access to the information is the same as with the "open"
system, but more ease and flexibility is provided for downloading data directly to an Excel spreadsheet. Users can determine what specific series they wish to download and the time period of the series. In addition, a single firm or index can be retrieved or the simultaneous retrieval of many series is possible. The gains in efficiency from the use of
the "closed" system would benefit students and instructors by making the research retrieval portion of projects and research papers easier and allow more time to analyze the data.
A more recent adaptation provided to subscribers is Bloomberg Anywhere, which is a communications card that allows an individual user to access Bloomberg on their desktop or laptop at any site. While this offers flexibility and convenience to the user, this would not be a practical feature for academic use, since only one user of an account can access Bloomberg at any given time. For finance classes, the most cost-effective method of using Bloomberg would be to set up a dedicated classroom or lab for classes and student and faculty research.
60 Journal of Financial Education

Figure 12. Multiple Regression Analysis
<HELP> for explanation. P065 Equity MRA <PAGE> for historical data, <MENU> to Update Matrix. MULTIPLE Name : MAJOR STOCK INÛEX Page lof 7 1 REGRESSION ANALYSIS Set # 1 ?ANGE tMM tü iMM
PERIOD m (D-U-M-Q-Y)
Equat i on SPX = 555. Ô52 + Û.1Û6 x DAX + -Ú.OÔ0 x NKY + Ô.Ô48 x ÜKX
[Statistics arid Results 1
Standard Error 11.43057
5 Squared 0.87633 Observations 130
Correlati on
Variable Currency Coefficient Standard Error t-Test a = Constant 555.0524 67.95867 8.16750 Xl= DAX - DAX INDEX EUR 0.10552 0.00887 11.89124 X2= NKY -- NIKKEI 225 JPY -0.00823 0.00313 -2.63285 X3= UKX -- FTSE 100 INGBP 0.04838 0.01695 2.85457
Y = SPX - S&P 500 INDUSD
Australia 61 2 9777 8600 Brazil 5511 3048 4500 Europe 44 20 7330 7500 Germany 49 69 920410 Hong Kong 852 2977 6000 Japan 81 3 3201 8900 Singapore 65 6212 lOOO U.S. 1 212 318 2000 Copyright 2007 Bloomberg LP.
H187-1067-1 25 -Mai - 2007 16-2347
(Used with permission of Bloomberg LP)
SUMMARY
Business schools constantly seek to provide an academic setting that will make the transition from the classroom to the workplace as easy as possible. Technology has been and will continue to be used in classrooms. This continuous investment will enhance the
ability to analyze data and communicate the results of that analysis. In addition, investment needs to be made with the data resources that can be used in the classroom.
This paper has shown some of the applications that the Bloomberg Professional System provides to many finance classes. By having classes use the same resources that professionals use in their daily tasks, there is increased currency in the education that
finance classes offer to students. Despite the perception of having a high cost, Bloomberg
proves to be a more cost-effective and convenient alternative to library resources. Schools that have Bloomberg can continue to provide a variety of finance data and also release scarce financial resources for other uses.
ENDNOTE
1 These subscription prices represent the 2005 prices of continued subscriptions. Depending on the features agreed upon within the subscription, the prices to institutions
may vary.
Spring 2007 61

REFERENCES
Clinebell, J.M. and S.K. Clinebell. "Computer Utilization in Finance Courses," Financial
Practice and Education, 5 (Spring/Summer 1995), 132-142. Morris, C. "Internet-based Real-time Quote Systems, Web Developers Journal ,
http://www.webdvelopersjournal.com/software/quote_systems_comparison.html, November 28, 1998.
Pettijohn, J.B. "A Guide to Locating Financial Information on the Internet," Financial Practice and Education , 6 (Fall/Winter 1996), 102-110.
St. Pierre, E.F. "Using Bridge Information Systems in the Classroom," Journal of Financial Education, 22 (Fall 1996), 79-83.
Smith, S.D. "Using EDGAR on the Internet to Teach Finance and Business Courses," Journal of Financial Education, 22 (Fall 1996), 76-78.
Appendix: Summary of Bloomberg Function Commands used in these Illustrations
Description of Company, "Symbol" <EQUITY> DES <GO> 1 showing Current Period Ratios shown on page 3 out of 10 Weighted Average Cost of Capital "Symbol" <EQUITY> WACC < GO > 2 Calculator
Graph of a specific Bond Price History
Characteristics of a Preferred Stock Issue
Stock Returns Compared to Other "Symbol" <EQUITY> COMP <GO> 5 Securities or Indices
Illustration of Different International <COMDTY> WEI <GO> 6
Stock Indices
Key Cross Currency Rates
Stock Option Monitor
Table of Various Commodities
Current Period Yield Curve
Altaian's "Z"
Multiple Regression Analysis
Note: "Symbol" represents the specific company/index/asset or unique security name that
is used for information. Unique names are required for individual corporate bond issues
or futures contracts since these are tracked by their coupon and maturity dates. Similarly,
option contracts are specified by whether they are calls or puts, as well as their strike price and expiration date. The respective security key, depicting the yellow keys on the Bloomberg keyboard, are shown, as an example, as <EQUITY> (for common stock information); and the specific function is shown in BOLD. Most of these functions are commonly applied across the different securities provided. The function list The function list for each security can be found by the "Symbol" <SECURITY> <GO> command.
62 Journal of Financial Education