using spot-landsat images for mapping, inventory and monitoring of reefs - serge andréfouët -...
TRANSCRIPT
Using SPOT-LANDSAT images for mapping, inventory and monitoring
of reefs
- Serge Andréfouët -
Remote Sensing/ Biological Oceanography University of South Florida, St Petersburg, USA
Laboratoire de Géosciences Marines et TélédétectionUniversité Française du Pacifique, Tahiti

Lagoon
Anaa Atoll (French Polynesia)SPOT XS-3,2,1
OceanRim
5 km
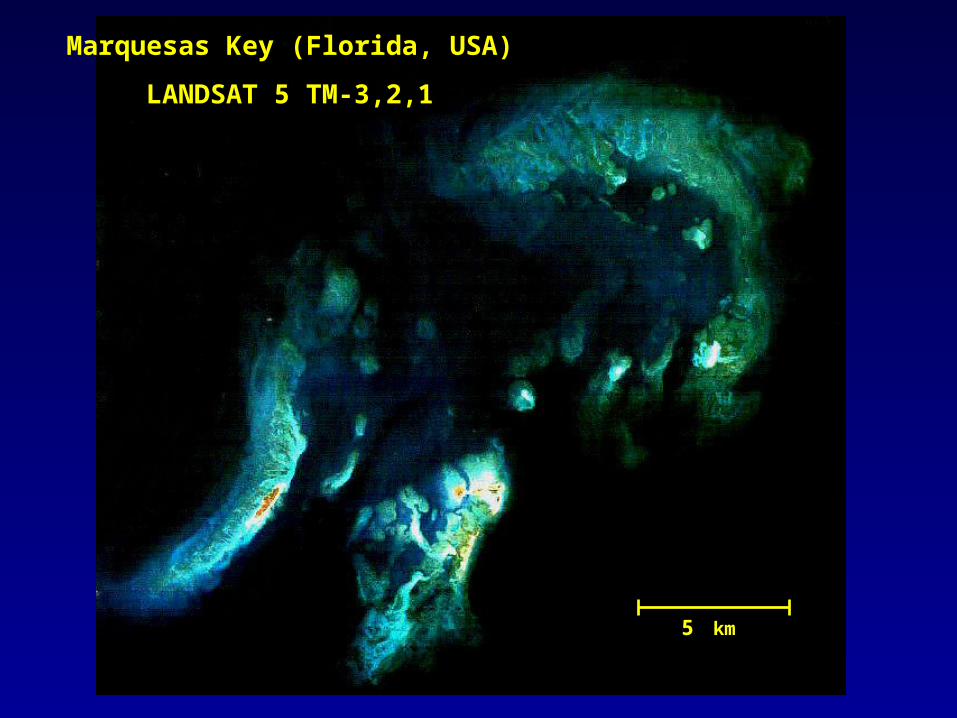
Marquesas Key (Florida, USA)
LANDSAT 5 TM-3,2,1
5 km

20/30 meters
20/3
0 m
eter
s

20/30 meters
20/3
0 m
eter
s
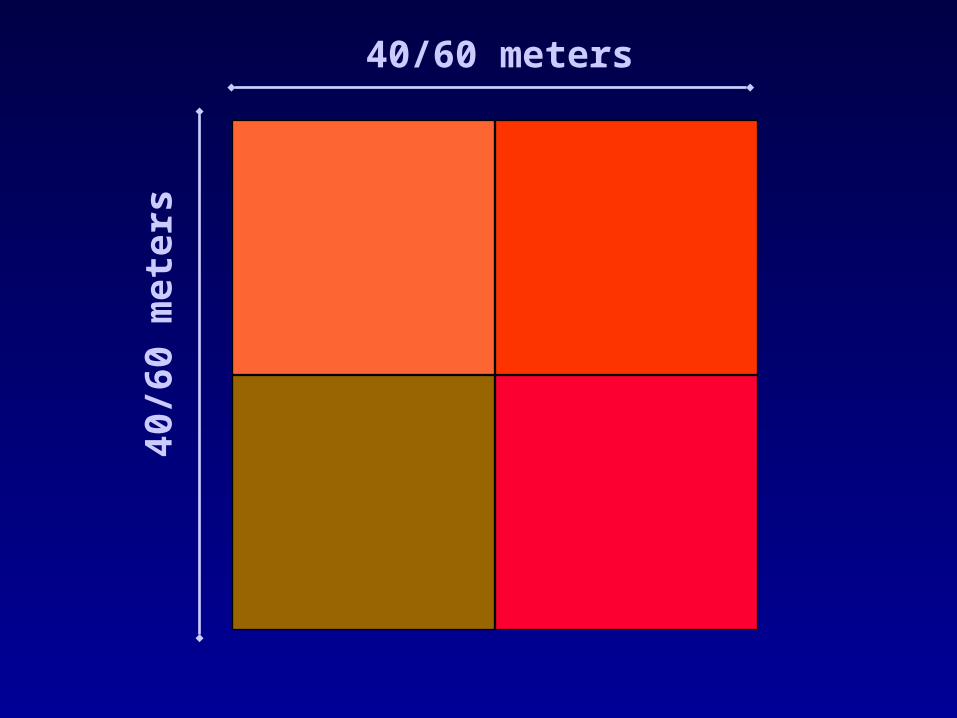
40/60 meters
40/6
0 m
eter
s

300 meters
300
met
ers

1500 meters
1500
met
ers
Lagoon
Ocean
AtollLagoon
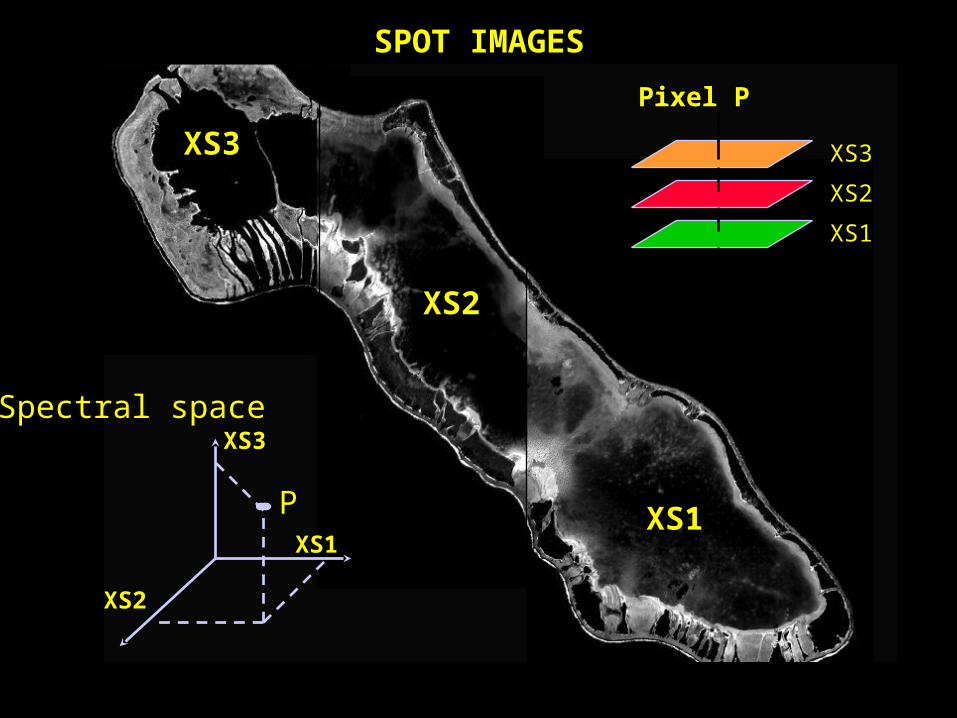
XS3
XS1
XS2
XS3
XS2
XS1
SPOT IMAGES
XS3
XS2
XS1
Pixel P
P
Spectral space

Remotely sensed information
• LwXSi= LwXSb + LwXSw (+ Lwa)
SPOT: XS1, XS2
LANDSAT: TM1, TM2, TM3
• LwXSb related to the “bottom” features
• LwXSw related to the water column features

Spectral discrimination of organismsLwb
0
0.05
0.1
0.15
0.2
0.25
0.3
0.35
0.4
0.45
400 450 500 550 600 650 700Longueur d'onde (nm)
Ref
lect
ance
Living Porites sp.
Coral rubble with turf
Coral rubble with endoliths
Living Montipora sp.
Algal turf
Beer Can

Spectral discrimination
0
0.1
0.2
0.3
0.4
0.5
0.6
0.7
0.8
0.9
1
400 450 500 550 600 650 700 (nm)
Ref
lect
ance
Sensitivity TM1 Sensitivity XS2Sensitivity XS1
Spectral discrimination
0
0.2
0.4
0.6
0.8
1
1.2
400 450 500 550 600 650 700 (nm)
Ref
lect
ance
SPOT XS1 sensitivity SPOT XS2 sensitivity
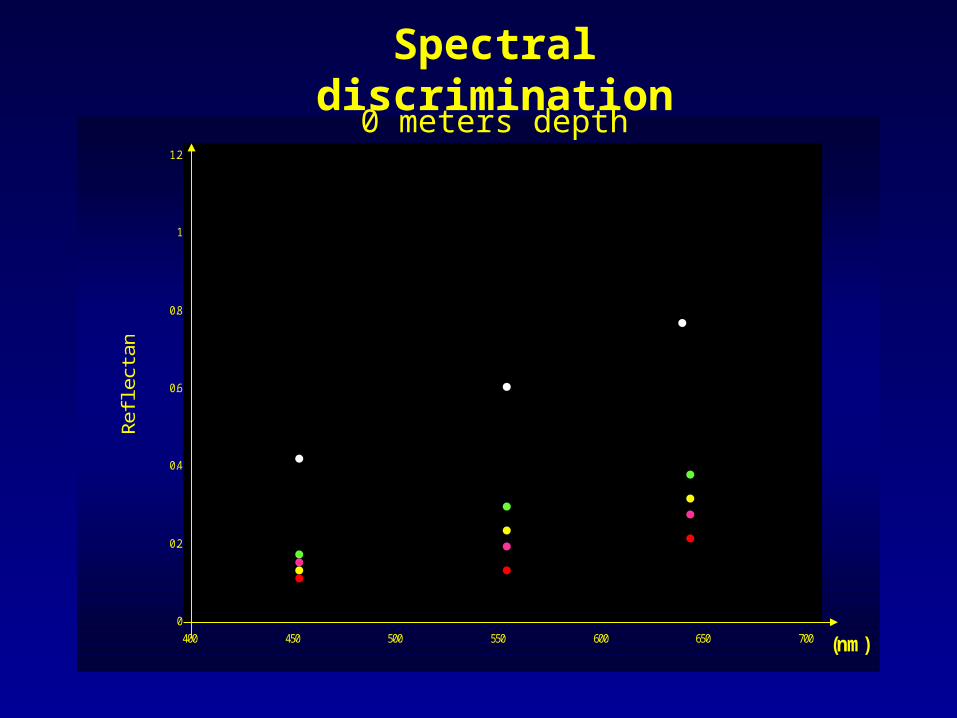
0 meters depth

0
0.2
0.4
0.6
0.8
1
1.2
400 450 500 550 600 650 700 (nm)
Ref
lect
ance
SPOT XS1 sensitivity SPOT XS2 sensitivity
Under-water Spectral discrimination
5 meters depth

0
0.2
0.4
0.6
0.8
1
1.2
400 450 500 550 600 650 700 (nm)
Ref
lect
ance
SPOT XS1 sensitivity SPOT XS2 sensitivity
Under-water Spectral discrimination
20 meters depth

Minimum Discernable Unit (MDU)
Size_MDU = PixelSize.(1+2.ErrorLocation)
if ErrorLocation= 1 pixel (pretty good!!)
SPOT MDU= 60 m x 60 m
LANDSAT MDU = 90 m x 90 m

Minimum Discernable Unit (MDU)
CASI image:
PixelSize= 1 meter
2 x 2 m : not enough
4 x 4 m : ok for training

Minimum Discernable Unit (MDU)
MDU= 3 x 3 m MDU= 60 x 60 m

Remotely sensed information
• Lwi= Lwb + Lww (+ Lwa)
• 2 or 3 known measurements: XS1 and XS2
TM1, TM2 and TM3
• 2 unknown variables Lwb and Lww

Haraiki atoll (French Polynesia)
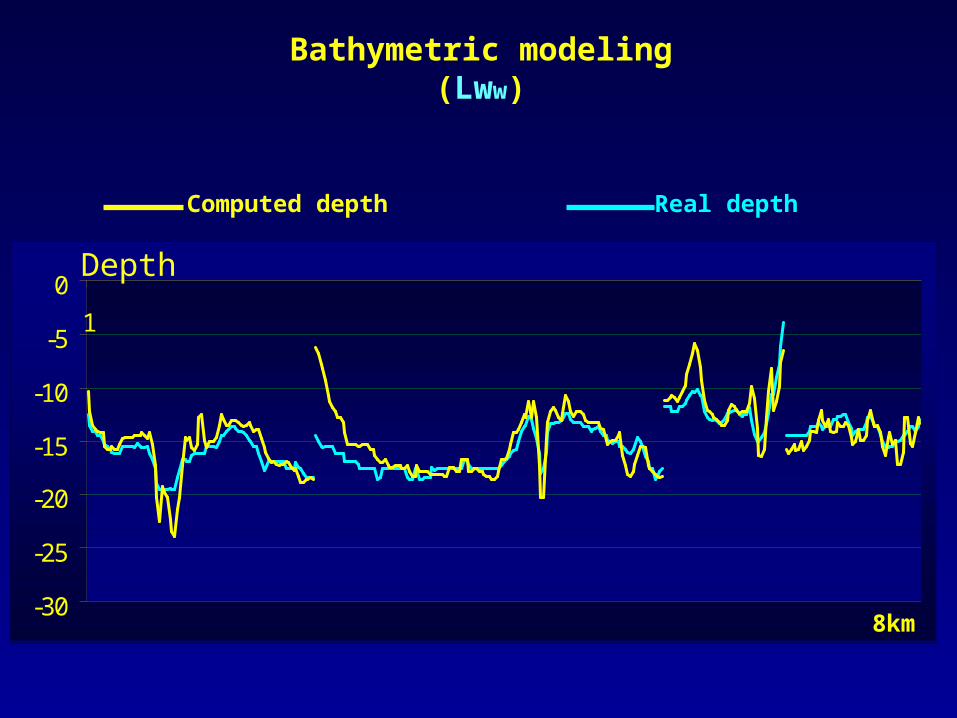
Bathymetric modeling(Lww)
Computed depth Real depth
-30
-25
-20
-15
-10
-5
0
1
Depth
8km

Image of the bottom Scale
“Radiance” scale
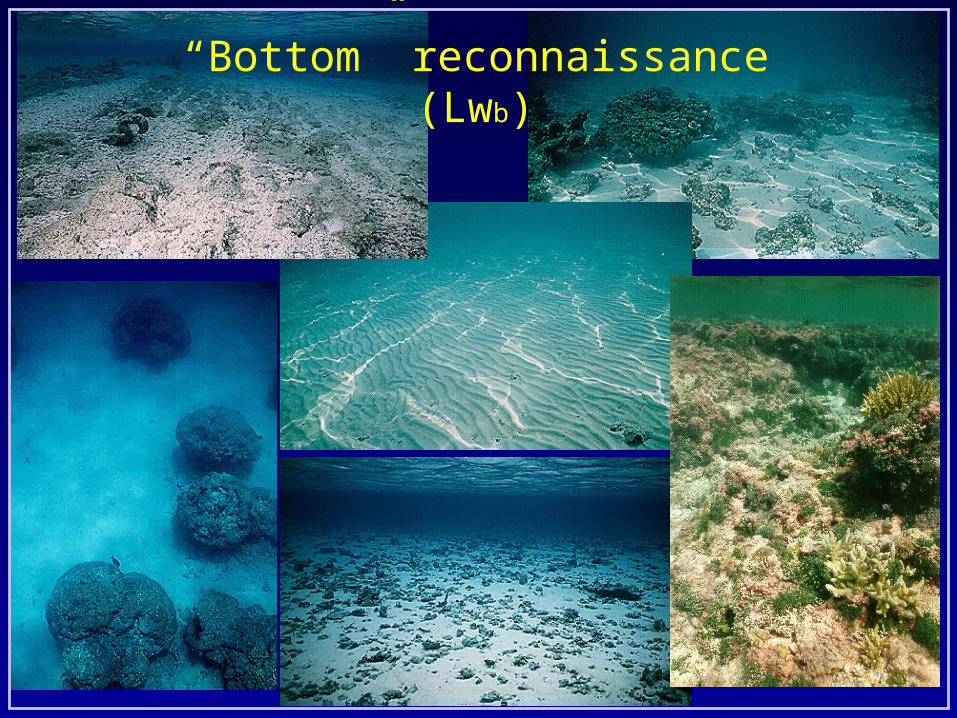
“Bottom” reconnaissance(Lwb)


Architecture (forms and dimensions)
Source: Veron (1986)
Massive
Columnar
Free-living
Foliaceous
Encrusting
Branching
Laminar

Hierarchical clustering of the stations
Similarity
field stations
Pure SandSand/Rubble with Isolated-Patches
Reef
Soft Bottom Hard bottom
Dead Living
Pure Rubble
Living coral

What type of habitat can you map with SPOTwith a good accuracy (70%) ?
Depth < 7-8 metersDefinition: coarse
Minimum Discernable Unit= 60 meters x metersBoundary analyses
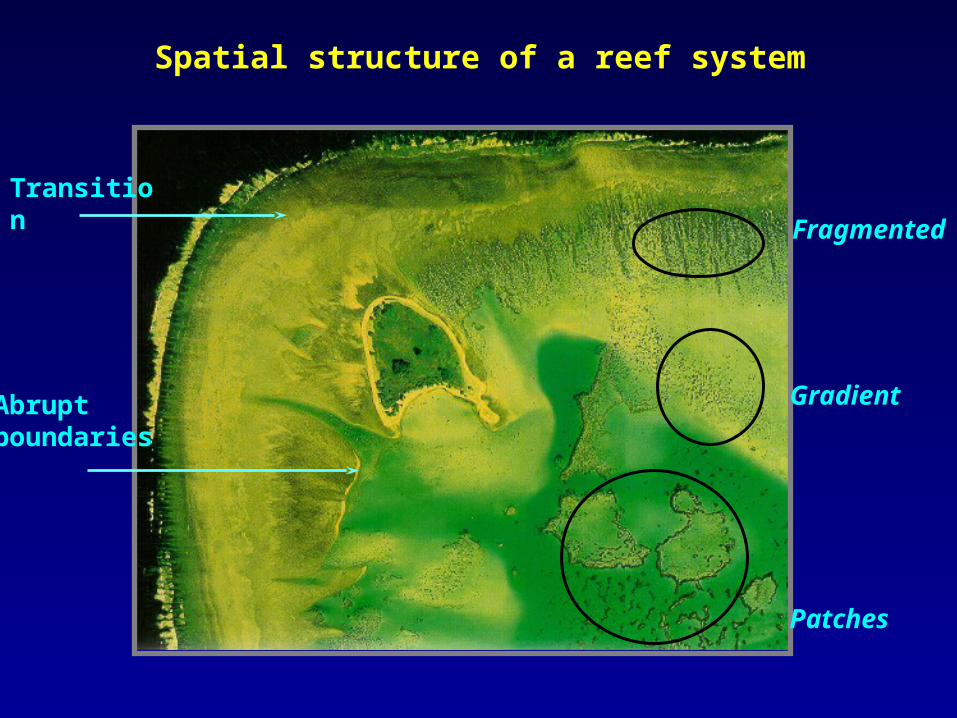
Transition
Abruptboundaries
Gradient
Patches
Fragmented
Spatial structure of a reef system

• A reef is a complex object, but any part of the reef has a membership degrees in each of the classes
• This membership belongs to [0...1]
• Mapping of membership degrees: fuzzy classification
Is this membership degree useful?
• Mapping
• Habitats boundary analyses
• Acanthaster planci outbreaks

Tiahura
Ocean
Land

Land
Land
Land
Motu
Motu
Motu
Ocean
Ocean
Ocean
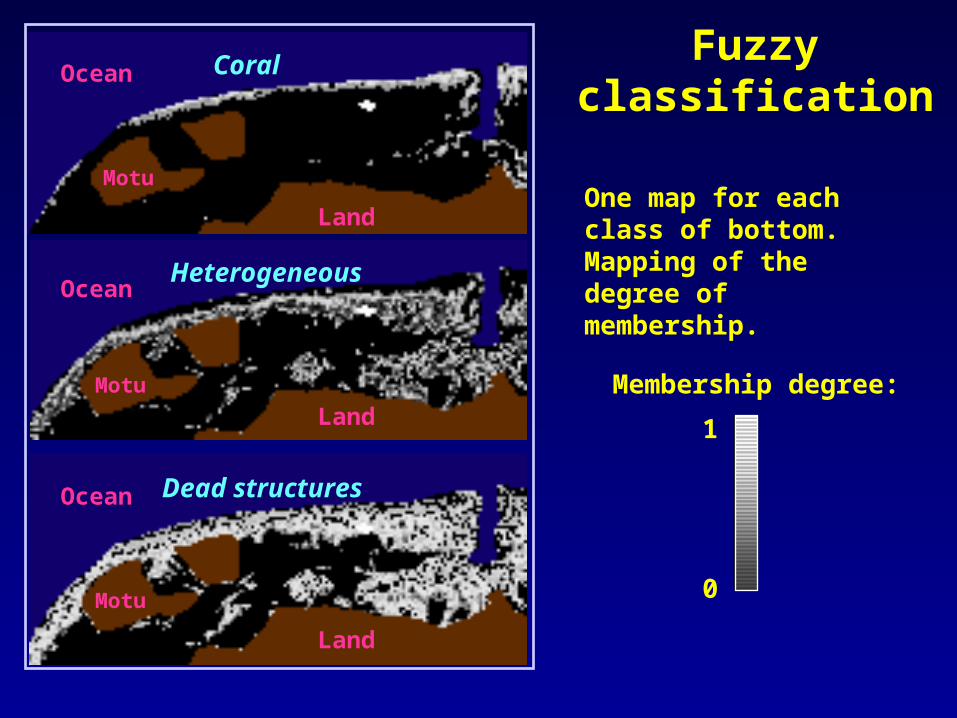
Fuzzyclassification
One map for each class of bottom.Mapping of the degree of membership.
Coral
Heterogeneous
Dead structures
1
0
Membership degree:

Tiahura
Ocean
Land

Land
Land
Land
Motu
Motu
Motu
Ocean
Ocean
Ocean
Fuzzyclassification
One map for each class of bottom.Mapping of the degree of membership.
Coral
Heterogeneous
Dead structures
1
0
Membership degree:

Tiahura
Ocean
Land
Land
Land
Land
Motu
Motu
Motu
Ocean
Ocean
Ocean
Fuzzyclassification
One map for each class of bottom.Mapping of the degree of membership.
Coral
Heterogeneous
Dead structures
1
0
Membership degree:
Is this membership degree useful?
• Mapping
• Habitats boundary analyses
• Acanthaster planci outbreaks
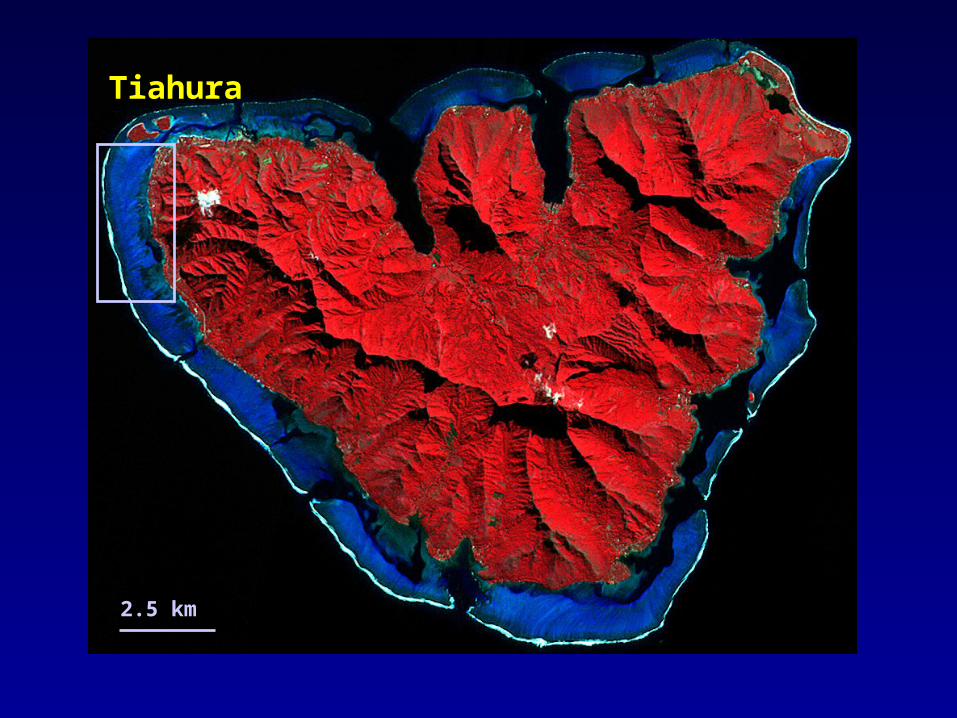
Tiahura
2.5 km

Coral
Isolated Patches
Sand
Transitions between bottom types
Lan
d
1
0
Possibility measurement
Lan
d
Lan
d
Lan
d

Is this membership degree useful?
• Mapping
• Habitats boundary analyses
• Monitoring and sampling designs (Acanthaster planci outbreaks)

Location of A. planci infestations in the 80’s (Faure, 1989)
Land
Ocean

0
0.2
0.4
0.6
0.8
1
1.2
400 450 500 550 600 650 700 (nm)
Ref
lect
ance
SPOT XS1 sensitivity SPOT XS2 sensitivity
0 meters depth
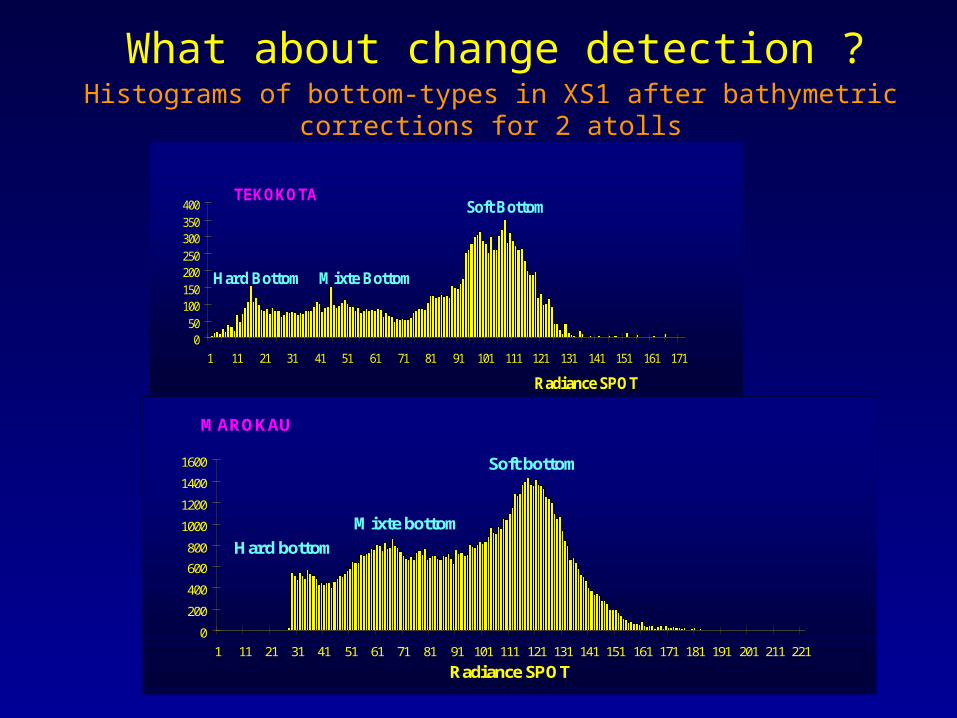
What about change detection ?
What about change detection ?
TEKOKOTA
050
100150
200250
300350
400
1 11 21 31 41 51 61 71 81 91 101 111 121 131 141 151 161 171
Radiance SPOT
Soft Bottom
Hard Bottom Mixte Bottom
MAROKAU
0
200
400
600
800
1000
1200
1400
1600
1 11 21 31 41 51 61 71 81 91 101 111 121 131 141 151 161 171 181 191 201 211 221
Radiance SPOT
Soft bottom
Mixte bottom
Hard bottom
Histograms of bottom-types in XS1 after bathymetric corrections for 2 atolls

What about change detection ?
Problems in calibration and correction of the images: not enough accurate
Benthos:
• Shifts in living communities : ??????• Change in sediment cover (hurricanes) : ok

Work in the field
Moorea: 20 transects (60m x~1km) for training and control, 6 days, 2 investigators (Yannick Chancerelle, CRIOBE, Moorea),Semi-quantitative (5%, 15%, 25%, >50%) rapid assessment for 4 variables
Atolls: 20 transects, 2 days, 2 investigators
Caveat: Only assessment of the coarse level of habitat without
hierarchical sampling (if not, time x 10) !!!
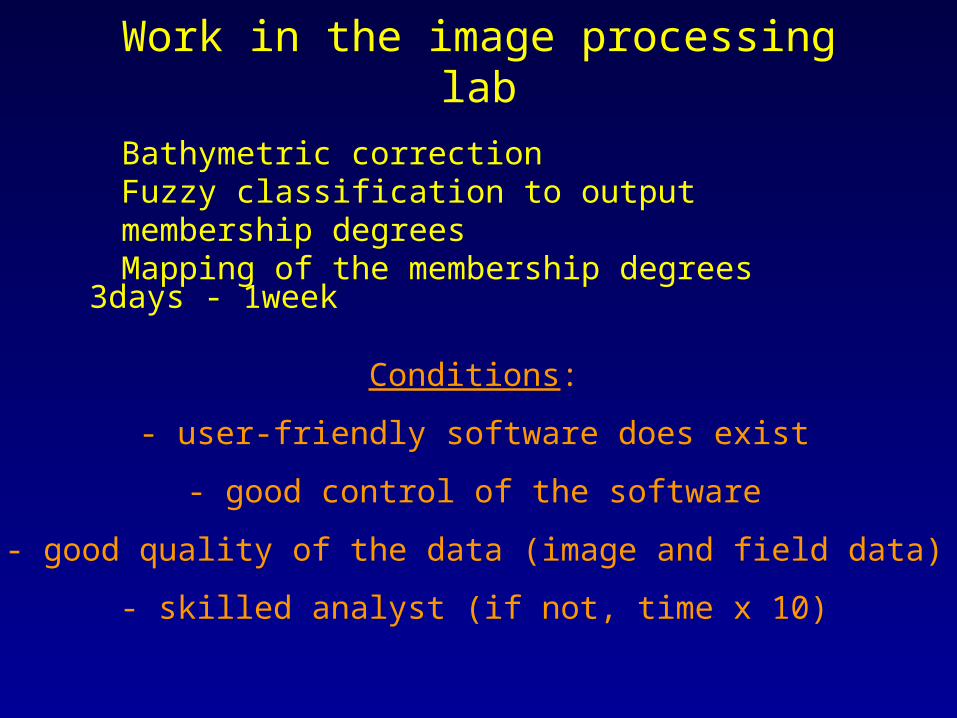
Work in the image processing lab
Bathymetric correctionFuzzy classification to output membership degreesMapping of the membership degrees
3days - 1week
Conditions:
- user-friendly software does exist
- good control of the software
- good quality of the data (image and field data)
- skilled analyst (if not, time x 10)

Water parameters
Few direct observations. Potentially interesting for atoll lagoons
(phytoplanctonic biomass or suspended matter)
Many indirect observations (the water body is not the target)
rivers run-off, pollution, boundary characterization and residence time

Spatial structure of a reef system and fluxes
Reka-Reka Tepoto Sud Tekokota
Boundary conditions controls: Nutrients limitations Residence time of lagoon waters Recruitment Community structure

Atoll rims typology
aperture 33 %
Wave Exposure Hydrodynamic aperture
South
aperture > 70 %
Structure
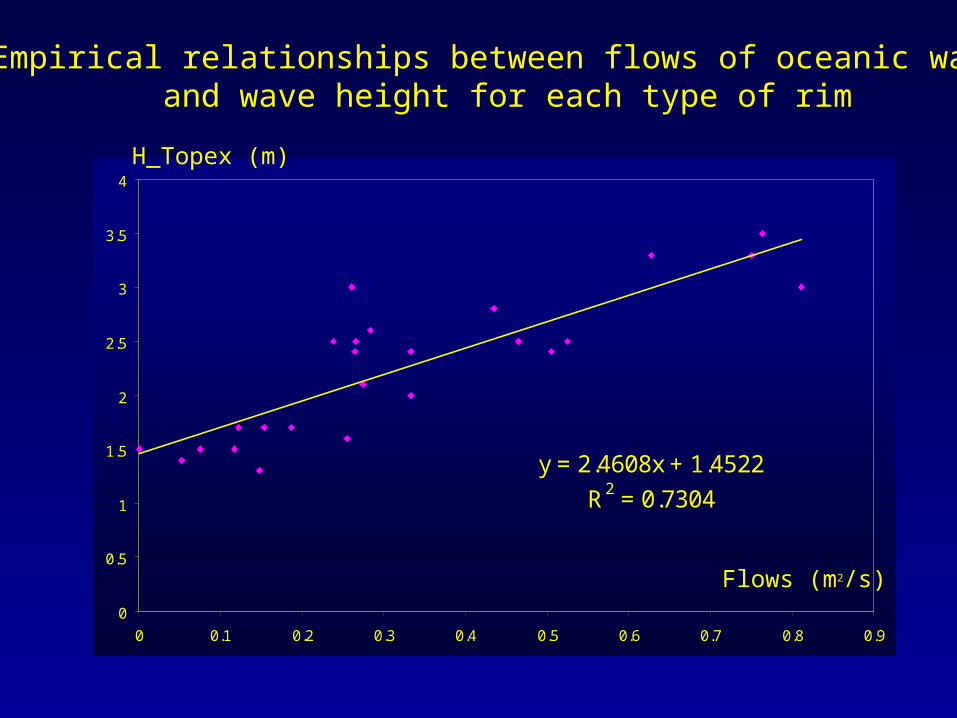
y = 2.4608x + 1.4522
R2 = 0.7304
0
0.5
1
1.5
2
2.5
3
3.5
4
0 0.1 0.2 0.3 0.4 0.5 0.6 0.7 0.8 0.9
H_Topex (m)
Flows (m2/s)
Empirical relationships between flows of oceanic waterand wave height for each type of rim

0
50
100
150
200
250
300
350
400
1.5 2 2.5 3 3.5 4
ARUTUAResidence time (days)
H_Topex (m)
0
100
200
300
400
500
600
1.5 2 2.5 3 3.5 4
Marokau
Residence time in atoll lagoons

Distribution of coral reefsEstimated 255.000 km2
(Spalding & Grenfell, 1997)
Global scale

Similarity
field stations
Pure SandSand/Rubble with Isolated-Patches
Reef
Soft Bottom Hard bottom
Dead Living
Pure Rubble
Living coral

Global Coverage: NASA plans to collect ~200 LANDSAT 7 images per day
worldwide:Long-Term Acquisition Plan
(LTAP)

Present coverage of reefs by LTAP
Expected: one cloud-free image per year

Present coverage of prioritized reefs by LTAP(research activities)
Expected: 4-6 cloud-free images per year

Global coverage
Estimation of global distribution of reefs, • without ground-truth, • 2 classes (soft and hard-bottom), • 80% accuracy
A basis for extension of monitoring worldwide, • 6 classes (gradient of soft and hard-bottom), • with ground-truth, • 70% accuracy• Interface with monitoring organizations is required to get training data for image processing

Conclusions
Using SPOT-LANDSAT images for mapping, inventory and monitoring of reefs?
Pragmatic point of view
Mapping: Yes: - Coarse habitats with ground truth
Bathymetric and atmospheric corrections required - Soft/hard bottoms without ground-truth and corrections
- Boundary analyses
Inventory: Yes % of soft/hard bottoms: global scale (LTAP):
% of coarse habitats: reef-scale

ConclusionsUsing SPOT-LANDSAT images
for mapping, inventory and monitoring of reefs?
Monitoring: Not directlyChange detection generally not possibleCoarse-habitats level not generally a relevant parameterWater quality generally not directly available
But provide: Geophysical parameters (exposure, bathymetry, residence time, geomorphology) Habitat mapping to stratify monitoring and establish new sites Generalize species indicator at reef scale
Timing: once or variable (catastrophic event)