using skin conductance in judgment and decision making
TRANSCRIPT

SKIN CONDUCTANCE 1
Using skin conductance in judgment and decision making research
Bernd Figner
Columbia University
Ryan O. Murphy
ETH Zurich
Columbia University
Please cite as Figner, B., & Murphy, R. O. (in press). Using skin conductance in judgment and decision making research. In M. Schulte-Mecklenbeck, A. Kuehberger, & R. Ranyard (Eds.), A handbook of process tracing methods for decision research. New York, NY: Psychology Press. Please do not distribute without permission by the authors.

SKIN CONDUCTANCE 2
Introduction
The skin has electric properties that change on the relatively short time scale of seconds and
are closely related to psychological processes. These characteristics of skin, known for more than
100 years, have been widely used in research. Changes in electrodermal activity (EDA) and skin
conductance are related to changes in eccrine sweating which are, in turn, related to activity in
the sympathetic branch of the autonomic nervous system (ANS). Accordingly, EDA measures
have been used to study psychological processes related to sympathetic arousal. For example,
skin conductance has become an important tool in studying affective processes because the ANS
plays a significant role in emotion and motivation. While increasingly direct methods of
assessing neural activity have been developed recently (e.g., fMRI and PET), skin conductance is
still often used as a proxy for neural and brain activity because it is relatively cheap and can be
measured unobtrusively and reliably.
It is important to note that skin conductance is a multifaceted phenomenon and does not reflect
a single psychological process. Thus, EDA and skin conductance have been used in a wide array
of research, serving as indicators of such processes as attention, habituation, arousal, and
cognitive effort in many different subdomains of psychology and related disciplines. In judgment
and decision making (JDM) research, skin conductance is often used as an indicator of affective
processes and emotional arousal. Therefore the renewed interest in skin conductance in JDM is
most likely related to the renaissance of affect and emotion in JDM in general, as part of what has
been termed the emotions revolution (Weber & Johnson, 2009).
Skin conductance is well suited as a process-tracing method. It can be measured virtually
continuously and relatively unobtrusively. Further it provides information about—and perhaps
even influences (Bechara, Damasio, Tranel, & Damasio, 2005; but see Dunn, Dalgleish, &

SKIN CONDUCTANCE 3
Lawrence, 2006)—otherwise hidden processes that reflect the ways in which people make
decisions and form judgments. It follows that skin conductance is a viable method in process-
tracing studies as it can serve, for example, as an indicator of the involvement of affective and
emotional processes in choice and judgment. However, there are several peculiarities about the
nature of skin conductance that one has to be familiar with and take into account in order to use it
successfully. Accordingly, the main goal of this chapter is to give an introduction to the use of
skin conductance in JDM research with a strong focus on providing concrete and hands-on advice
for the researchers who are unfamiliar with this physiological medium but are interested in using
it.
In this chapter, we focus on the type of EDA measurement and indicator most commonly used
in JDM research—the skin conductance response (SCR). Concentrating primarily on tangible
advice regarding the practical steps involved in using skin conductance, we give only a brief
overview of the physiological background of EDA and then delve into more concrete issues. Our
discussion of practical concerns starts with a description of the needed equipment, the setup of
the skin conductance acquisition, and electrode placement, followed by considerations regarding
task and study design, and ends with explanations of approaches for the preprocessing and
statistical analysis of the skin conductance data. We will give most attention to more traditional
and standard ways of study design and data analysis. However, we want also to briefly outline
more recent ideas for novel experimental design and data analysis approaches that are being
developed in our own and other laboratories. More detailed information about virtually all
aspects of EDA and its physiological background can be found in the excellent volume by
Boucsein (1992; see further recommended literature at the end of this chapter).

SKIN CONDUCTANCE 4
Electrodermal Activity and Skin Conductance: Terminology and Background
Different terms have been used in the literature to refer to aspects of electrodermal activity and
skin conductance, sometimes interchangeably, and therefore some clarification is in order. In
1967, the Society of Psychophysiological Research (Brown, 1967; see also Boucsein, 1992)
published a proposal for a standardized terminology that has been widely accepted. The term
electrodermal activity (EDA) was introduced by Johnson and Lubin (1966) and refers most
generally to all (passive and active) electrical phenomena in the skin, while skin conductance is
one form of EDA. Specifically, the term skin conductance refers to how well the skin conducts
electricity when an external direct current of constant voltage is applied. Skin conductance is
measured in microsiemens (µS).1 Other measures of EDA are distinguished based on technical
aspects of the assessment: EDA recordings that do not use an external current are called
endosomatic, while recordings that do use an external current (such as skin conductance) are
called exosomatic. Exosomatic techniques are further distinguished by whether a direct current
(DC) or an alternative current (AC) is used. DC measurement that keeps the voltage constant is
called skin conductance, as it reflects how well the skin conducts a current. DC measurement that
keeps the current constant is called skin resistance, as it reflects the electrical resistance of the
skin. For the case of AC, keeping effective voltage constant results in the measure of skin
admittance, while keeping effective current constant results in skin impedance.2
As previously mentioned, skin conductance is the most commonly used measure in JDM and
thus we focus on it. Skin conductance can be divided into tonic and phasic phenomena. The main
1 Particularly in older literature —and sometimes on hardware used to measure skin conductance—, the outdated unit micromho (µ℧) can still be found. Mho is derived from spelling ohm backwards. This unit should not be used anymore as it has been replaced by the unit siemens (S) in the International System of Units. 2 The older term galvanic skin reaction or galvanic skin reflex (GSR) can still be found in the literature. It should be avoided as it is technically incorrect and it is not always clear to what aspect of EDA it refers (Boucsein, 1992).

SKIN CONDUCTANCE 5
differences between these phenomena are related to their time scale and their relationship to the
evoking stimuli.
Figure 1 shows a raw skin conductance signal from one participant in a risky decision making
experiment using the "hot" Columbia Card Task (CCT; Figner, Mackinlay, Wilkening, & Weber,
2009).3 The first 6 minutes of the session were used for administrative tasks, instructions, and
practice trials. Then, starting at minute 6.2 and ending at minute 16.2 (see the area between the
left and right vertical gray lines in Figure 1), the participant made risky choices in the computer-
based hot CCT which gives the participant real-time feedback regarding the outcomes of their
choices. From minute 16.5 on, the participant filled out a questionnaire. In these 20 minutes of
skin conductance data, one can see an overall and relatively slow drifting of the signal on which
there are short (i.e., over the span of a few seconds) modulations in skin conductance (seen as
sharp peaks in Figure 1).
Figure 1. Raw skin conductance signal from one participant over the course of an
experiment using the hot version of the Columbia Card Task (see Figner et al., 2009).
3 The CCT is a dynamic risky decision-making task that assesses levels of risk taking and information use. Two
different versions of CCT exist—a relatively affect-charged hot version and a more deliberative cold version (Figner et al., 2009). In both versions, participants turn over cards from a deck, which consists of a known number of gain and loss cards. Gain and loss amounts and probability to win or lose vary between trials to assess their influence on participants' risk taking.

SKIN CONDUCTANCE 6
The longer-term manifestations are tonic, seen in the relatively low overall level in the
"Instructions" and the "Questionnaire" phases versus the relatively elevated level during the
"Risky choices" phase. The most common measure of this aspect of the data is the skin
conductance level (SCL). This measure describes the overall conductivity of the skin over longer
time intervals, typically ranging from tens of seconds to tens of minutes.
Within (and largely independent of) these different SCL levels, many sharp peaks in skin
conductance can be seen. These short modulations in the signal are phasic phenomena and each
peak represents an individual skin conductance response (SCR). An SCR is a discrete and short
fluctuation in skin conductance that lasts several seconds and usually follows a characteristic
pattern of an initial, relatively steep rise, a short peak, and then a relatively slower return to
baseline (see Figure 2). SCRs reflect the higher-frequency variability of the signal that is
modulated on top of the slower changes in SCL.
Figure 2. Raw unfiltered skin conductance signal, showing components of an SCR that can
be used to quantitatively characterize SCRs. A stimulus marker corresponding to the participant
turning over a loss card is also shown as part of the time course.

SKIN CONDUCTANCE 7
SCL is typically operationalized by taking the average of several discrete measurement points
distributed across the time window of interest (Boucsein, 1992). These measurement points
should not be taken during an SCR (as this would lead to an overestimation of SCL),
complicating automated approaches to quantify SCL.4 In contrast to the SCRs, it is assumed that
the SCL is not directly related to stimuli, but indicative of a more general level of arousal.
Accordingly, since not all observable SCRs are directly related to an observable stimulus, a
second, though less common, measure of tonic skin conductance has been suggested—the
frequency of so-called non-specific (also called spontaneous) SCRs per time unit (usually per
minute; typically, 1-3 per minute of these non-specific SCRs are observed during rest, Dawson,
Schell, & Filion, 2007). As pragmatic criterion whether an SCR is specific (i.e., related to a
stimulus) or non-specific, Boucsein (1992) suggests that SCRs that start more than 5 sec after the
end of a stimulus should be categorized as non-specific. However, in many studies, the
distinction between specific and non-specific SCRs can be problematic, as can be seen, for
example, in the anticipatory SCRs that are crucial for the somatic marker hypothesis (SMH,
Bechara et al., 2005; see more details further below). Anticipatory SCRs are assumed to reflect
affective evaluation processes of different choice options. However, they cannot necessarily be
attributed to a concrete stimulus, as they appear before the choice and are related to internal
rather than externally observable stimuli.
We focus on SCR, the main indicator of phasic changes, because it is more commonly used in
JDM research and typically will be better suited for process-tracing studies due to its relatedness
to specific events and because it can be operationalized across shorter time intervals than SCL
4 More simply, a measure of the central tendency, e.g., the mean or median, over the whole time interval of interest could be taken. However, this is likely to lead to an overestimation of the true SCL, as such a measure includes the data points forming the SCRs.

SKIN CONDUCTANCE 8
(for a recent study using both SCL and SCR, see Nagai, Critchley, Featherstone, Trimble, &
Dolan, 2004). SCRs have been quantified using various characteristics and measures (see Figure
2 and Boucsein, 1992, p. 135). The onset latency (lat.) is the time between the onset of the
stimulus and the start of an SCR, typically 1 to 3 seconds. The rise time (ris.t.) is the time
between the onset of the SCR and its peak amplitude, typically also 1 to 3 seconds. The
amplitude (amp.) is the difference between the conductivity at the onset (the baseline) and the
peak. The recovery half time (rec.t/2) is also sometimes used but is highly correlated with rise
time and therefore somewhat redundant (Venables & Christie, 1980). Frequency (freq.) of SCRs
per time unit is another measure to quantify skin conductance responses. We will focus on the
measures most commonly used in JDM research, which are amplitude (particularly in older
research) as well as the more recent indicator area bounded by a curve (see Figure 6 and
explanations further below), which is better suited for automated data analysis and captures both
the amplitude and temporal characteristics of an SCR, and therefore is likely to be a more valid
indicator than either aspect alone.5
Physiological and Psychological Processes
Changes in skin conductance are related to the activity of eccrine sweat glands, innervated by
sympathetic nerves. Changes in skin conductance reflect secretion of sweat from these glands. As
sweat is an electrolyte solution, the more the skin’s sweat ducts and pores are filled with sweat,
the more conductive the skin becomes. The sympathetic branch of the ANS controls eccrine
sweating, thus skin conductance reflects the arousal of the sympathetic ANS which accompanies
various psychological processes. The mechanisms and pathways involved in the central nervous
5 This measure has been suggested to index quantity of affect by Traxel (1957; see also Boucsein, 1992; Naqvi & Bechara, 2006). Sometimes it is also referred to as area under the curve, which can be misleading as the measure includes areas both under and above the SCR curve.

SKIN CONDUCTANCE 9
control of eccrine sweating are relatively complex (Boucsein, 1992; Critchley, 2002) and a recent
fMRI study suggested that SCL and SCR are related to activity in different brain areas (Nagai et
al., 2004).6
While the central origins of the ANS are within the hypothalamus and the brainstem, other
parts of the brain such as the amygdala, the hippocampus, the basal ganglia, and the prefrontal
cortex, have been found to be involved in the control of eccrine sweating. These “higher” areas
are part of the limbic and paralimbic networks, which are crucially involved in affective
processes. Thus it is not surprising that skin conductance is often used as an indicator of
emotional arousal and other affective processes. Interestingly, it has been shown that these higher
brain areas are not necessary for reflex SCRs to non-emotional stimuli such as deep breaths and
orienting stimuli such as a loud noise, but they are necessary for SCRs in response to stimuli that
have acquired emotional value through experience, e.g. in classical conditioning (Naqvi &
Bechara, 2006; Tranel & Damasio, 1989, 1994).
Typically, skin conductance is measured from the volar7 surfaces of the fingers or the palms of
the hand. For example, two electrodes are attached to the index and middle finger of the non-
dominant hand (thus allowing the participants to use their dominant hand to handle a computer
mouse, fill out a questionnaire, etc.) and a small constant voltage is applied. The current is
imperceptible to the participant. Differences in skin conductivity are revealed by the amount of
current that passes between the electrodes. As an alternative to measurement on the palms of the
hands, skin conductance can also be recorded from the soles and inner sides of the feet; this
method is called plantar skin conductance, in contrast to palmar skin conductance recorded from
6 This study investigated neural activity during biofeedback and relaxation tasks. They found that neural activity within the ventromedial prefrontal cortex and the orbitofrontal cortex was related to SCL while activity in the lateral prefrontal cortex, thalamus, hypothalamus, insular cortex, and visual cortex was related to SCR. 7 Volar refers to the underside of hands and feet, i.e., the palm of the hand and the sole of the foot (including the underside of fingers and toes).

SKIN CONDUCTANCE 10
the inner surface of the hands. Plantar skin conductance is used, for example, when the
participant needs both hands for the experiment or sometimes in fMRI studies when the
electrodes or their leads might interfere with the scanner environment. The palms of hands and
soles of the feet are best suited for measuring skin conductance as they are easily accessible and
also have a high density of eccrine sweat glands. Importantly, eccrine sweating on the volar
surfaces is different from other locations, as it has been suggested that sweating in these skin
parts is strongly related to mental processes (emotional sweating, e.g., in response to both
positive and negative events as well as for anticipated and experienced outcomes; Boucsein,
1992), rather than thermoregulation.
In the psychological literature, EDA measures have been used in both normal and clinical
populations as indicators of a wide range of underlying psychological processes, such as
orienting responses (e.g., Uno & Grings, 1965; Williams et al., 2000), habituation (e.g., Sokolov,
1963), classical and operant conditioning (e.g., Delgado, Gillis, & Phelps, 2008; Grings &
Dawson, 1973), and as indicators of information processing and cognitive effort (e.g., Dawson,
Filion, & Schell, 1989; Nikula, 1991). In JDM research and related work, it appears that SCR is
most often used as an indicator of affective processes and in the following section we will present
some of the more recent work, including our own. Here, it is important to note what can and
cannot be assessed with skin conductance. It is well established that SCR covaries with the
arousal dimension of affect, indexing its intensity. In contrast to this quantitative aspect, the
qualitative aspects of affect, such as its valence (positive/negative, approach/avoidance) or which
emotion is present (e.g., fear vs. anger vs. joy vs. disgust, etc.) are not reflected in EDA and have
to be inferred from other sources. Often these qualitative aspects of affect, e.g., whether an
affective response is negative or positive, might be clear and do not need additional measures, for

SKIN CONDUCTANCE 11
example, when the participant experiences a gain versus a loss. In more ambiguous situations, or
if finer-grained distinctions are of interest, it would be necessary to assess these qualitative
aspects either via the use of other physiological measures (e.g., electromyogram of facial muscles
involved in smiling or frowning responses; Cacioppo, Berntson, Larsen, Poehlmann, & Ito, 2000;
Rainville, Bechara, Naqvi, & Damasio, 2006) or—perhaps more reliable but less unobtrusive—a
self-report measure such as an affect valence rating scale.
The studies by the Iowa group were pioneering in their use of skin conductance to investigate
questions related to decision making. Damasio, Bechara and colleagues have used SCR measures
as tracers for otherwise unobservable implicit processes, both with healthy and brain-lesioned
participants. Research with the Iowa Gambling Task (IGT, Bechara, Damasio, Damasio, &
Anderson, 1994; Bechara, Damasio, Damasio, & Lee, 1999) has shown that participants not only
exhibit SCRs to the outcomes of their choices (gains versus losses, reflecting experienced utility)
but, over the course of repeated trials, healthy participants also develop anticipatory SCRs,
assumed to index emotional arousal before and while they make their choice (reflecting
anticipated and decision utility). These anticipatory SCRs were predictive of whether the
participant would make an advantageous versus a disadvantageous choice. According to the SMH
(Bechara et al., 2005), these anticipatory SCRs develop before participants have an explicit
knowledge of the advantageousness of the different choice options and thus have been suggested
to guide and influence the participants' choice behavior. The SMH is the object of a lively debate
and, together with the IGT, keeps inspiring research in healthy normals as well as developmental
and clinical populations, typically measuring anticipatory and outcome-related SCRs (e.g.
Jenkinson, Baker, Edelstyn, & Ellis, 2008; Luman, Oosterlaan, Knol, & Sergeant, 2008; Crone,
Somsen, van Beek, & van der Molen, 2004; Crone & van der Molen, 2007; Hinson, Whitney,

SKIN CONDUCTANCE 12
Holben, & Wirick, 2006; Wagar & Dixon, 2006; for a recent review see Dunn et al., 2006). In
summary, work by the Iowa group has demonstrated how SCRs can be used as a process
indicator of affective processes before, during, and after making decisions that would otherwise
be difficult to observe in an equally unobtrusive manner.
Recently, Reid and Gonzalez-Vallejo (2009) used SCR in an innovative way as an indicator of
affective processes, improving the predictive validity of choice models and showing how
symbolic and affective information can be combined in such models. In two of their experiments,
they used the magnitude of SCRs during the presentation of choice-relevant information to derive
for each participant the weight of the influence of symbolic versus affective information on their
preferences. They found that adding such physiologically derived emotional weights improved
the predictive power of their models, giving evidence that symbolic-cognitive and emotional
information can be combined using a weighted proportional difference rule. In a different
experiment reported in the same paper, they assessed amplitude of SCRs during the sequential
presentation of risky choice options of equal expected value.8 They found that the emotional
weight derived from the relative magnitude of SCRs was predictive of participants' preferences.
In our own research, we use measures of skin conductance in combination with the CCT (e.g.,
Figner et al., 2009) as well as with a task involving morally challenging and dilemma-like
decisions (Krosch, Figner, & Weber, submitted). By using SCR, we were able to show that our
two versions of the CCT—the affect-charged hot and the deliberative cold—indeed differed in
the involvement of affective processes, explaining their differential developmental patterns in
risk taking across childhood, adolescence, and adulthood. In the study on morally challenging
choices, we found that increased affective arousal indexed by SCR during the dilemma-like
8 As SCR indexes only the magnitude but not the valence of affective arousal, they assessed the affective valence with a self-report measure, the self-assessment manikin (Bradley & Lang, 1994).

SKIN CONDUCTANCE 13
choices predicted participants' reported decision difficulty as well as their projected future worry
about their decision.
Hands On
In this part of the chapter, we intend to describe the steps necessary to do research with skin
conductance. We will provide descriptions of equipment, laboratory setup, task structure, and
data analyses techniques and discuss considerations important when planning and doing research
with skin conductance measures.
Equipment
There are several commercially available systems to measure skin conductance. In our
laboratory, we use a Biopac system, consisting of the base module (MP150) in combination with
the modules for skin conductance (GSR100C) and cardiovascular activity (PPG100C). A desktop
or laptop computer is needed to run the AcqKnowledge software that comes with the Biopac
system. The AcqKnowledge software is used to set up the acquisition parameters, allows for real-
time monitoring of the measurements, records the data to a hard drive, and can be used for data
filtering and analysis. A second, separate desktop or laptop computer is typically used to
administer the computer-controlled experimental task.
Parameters and Filters
In our laboratory, we set up the acquisition parameters as follows: On the Biopac hardware,
amplification is set to 5 µSiemens/V, the low-pass filter is set to 1 Hz, and no hardware high-pass
filters are activated (i.e., the switches are set to DC). Figure 3 shows a screenshot of the

SKIN CONDUCTANCE 14
AcqKnowledge software processing 6 channels of data. Channel A represents raw cardiovascular
activity (with channel F being heart rate, estimated beats per minute, derived from the signal of
channel A). Channel B records and displays the raw skin conductance signal, i.e., no filtering is
applied. This channel is similar to traditional skin conductance measurements and reflects both
slow tonic and fast phasic changes (i.e., SCL and SCR). A second skin conductance channel is set
up in AcqKnowledge to record the skin conductance signal, but this time with a software-based
0.5 Hz high-pass filter applied (shown on channel E). The high-pass filter effectively removes the
tonic component of the raw skin conductance signal and shows only phasic changes, in effect
isolating SCRs. Notice the strong phasic change on the right part of the figure—this corresponds
to the participant turning over a loss card in the CCT and realizing a loss of money. Other ways
to isolate the phasic changes and reduce or eliminate the slow drift present in the SCL signal are
by using a difference function (see Naqvi & Bechara, 2006) or by computing a derivative of the
raw signal (Nagai et al., 2004). Finally, channels C and D in our setup correspond to task markers
in our experimental tasks.
Sampling Rate
When data storage capacity of several hundreds megabytes is not a problem, we suggest that
the sampling rate should be no lower than 100-200 Hz.9 While such high sampling rates are not
imperative to veridically represent a relatively slow signal like skin conductance, more complex
analysis approaches and smoothing procedures can benefit from higher sampling rates. Since
sampling rates can easily be set as high as 1 or 2 kHz without running into problems of
9 While lower sampling rates are still sometimes used in the literature (e.g., 20 Hz in Fung et al., 2005) and are often sufficient for many types of analysis, the computing speed of regular computers today and the relatively low cost of data storage media allow use of much higher sampling rates than was common several years ago.

SKIN CONDUCTANCE 15
computing resources or data recording speeds in modern computers, we usually sample at 1
kHz.10
Figure 3. Screen shot of the AcqKnowledge software. Six channels of data are recorded and
displayed here (see explanations in the main text).
Electrodes
Two main types of electrodes are available to be used for skin conductance measurement.
Reusable electrodes must be cleaned after each use and are used in combination with an electrode
gel for EDA use. The use of disposable electrodes is becoming more common, as they are pre-
gelled and do not require preparation or cleaning and disinfection after each use. This is
particularly practical when doing research outside of the laboratory, (e.g., at a school or
workplace).
10 In the more recent JDM literature, sampling rates appear to be most commonly in the range between 100 Hz and 2 kHz.
SKIN CONDUCTANCE 16
After participants provide informed consent, we first attach the electrodes to give the electrode
gel enough time to soak into the skin and thereby result in a good and stable electrical
connection. The electrodes are placed on the non-dominant hand, so the participants can still
write or handle a computer. Before attaching the electrodes, we first clean the locations of
electrode placement with small disposable alcohol pads as we observed that, if a participant
applied hand cream shortly before coming to the laboratory or has otherwise very oily skin, the
oil can prevent the electrodes from sticking to the skin11 as well as prevent the electrolyte gel
from establishing an electrical connection, which might result in a poor skin conductance signal.
However there are various and contradicting recommendations in the literature regarding
pretreatment, such as no pretreatment at all, only water, water and soap, or alcohol (e.g., Naqvi &
Bechara, 2006; Venables & Christie, 1980; Walschburger, 1976, as cited in Boucsein, 1992).
Independent of which pretreatment is chosen, it is important to use the same procedure within an
experiment.
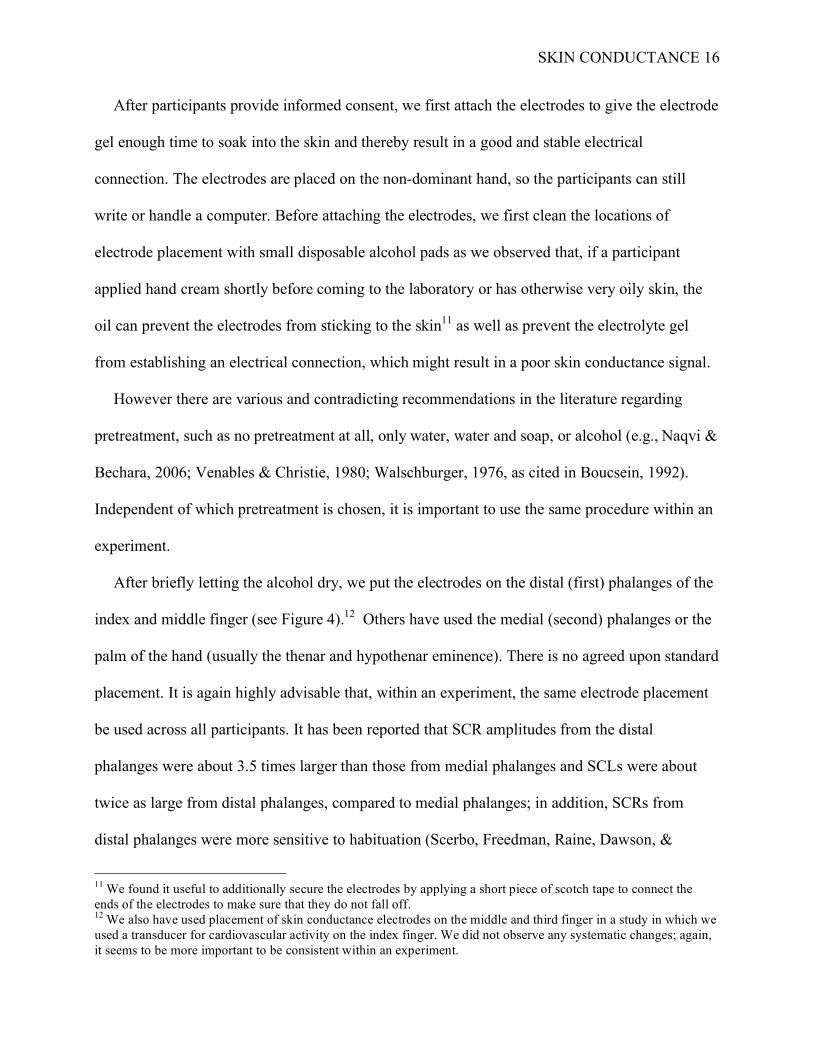
After briefly letting the alcohol dry, we put the electrodes on the distal (first) phalanges of the
index and middle finger (see Figure 4).12 Others have used the medial (second) phalanges or the
palm of the hand (usually the thenar and hypothenar eminence). There is no agreed upon standard
placement. It is again highly advisable that, within an experiment, the same electrode placement
be used across all participants. It has been reported that SCR amplitudes from the distal
phalanges were about 3.5 times larger than those from medial phalanges and SCLs were about
twice as large from distal phalanges, compared to medial phalanges; in addition, SCRs from
distal phalanges were more sensitive to habituation (Scerbo, Freedman, Raine, Dawson, &
11 We found it useful to additionally secure the electrodes by applying a short piece of scotch tape to connect the ends of the electrodes to make sure that they do not fall off. 12 We also have used placement of skin conductance electrodes on the middle and third finger in a study in which we used a transducer for cardiovascular activity on the index finger. We did not observe any systematic changes; again, it seems to be more important to be consistent within an experiment.

SKIN CONDUCTANCE 17
Venables, 1992; as cited in Boucsein, 1992). Some have argued that placement on the distal
phalanges might increase the chances of movement artifacts, compared to the medial phalanges
(Venables & Christie, 1980). Independent of actual electrode location, the experimenter should
make sure that the participant can comfortably rest their hand either in their lap or on the desk
using a pillow or a blanket to support the arm and hand to avoid signal artifacts, which may arise
from movement of the hand to which the electrodes are attached. Finally, as temperature and
humidity can influence skin conductance (Boucsein, 1992), we record the temperature and
humidity at the start and end of each participant's session (to potentially use as covariates in later
analyses) using an inexpensive combined hygrometer/thermometer.
Figure 4. Electrode setup and terminology for common electrode placement locations
Event Markers

SKIN CONDUCTANCE 18
To enable a meaningful analysis of the skin conductance data and to be able to relate the
stimuli and the participant's behavioral responses to the skin conductance signal, the
physiological data recording, the stimulus display, and the participant's behavior all have to be
synchronized somehow, preferably by recording these events on a common timeline.
AcqKnowledge and Biopac allow for a direct interface with various commercial task-
administration software packages (such as Direct RT, E-Prime, MediaLab, Presentation) so that
task markers are recorded along with the physiological data. In our own studies, we opted for a
customized solution that gives us maximal flexibility in the software we use to program
experimental tasks. For example, our CCT is programmed using Microsoft's Visual Basic and
plays custom-made sound files every time a participant makes a decision or a new round starts.
These sound signals are not audible to the participant but are fed directly from the analog sound
output of the stimulus computer into the analog inputs of the Biopac base module. The event
markers are visible in Figure 3 as channels C and D.13
Experimental Procedure
The electrodes should be attached at least 5 minutes prior to recording the physiological data
to ensure that a good and stable electrical connection is achieved. We check whether everything
is working by having the participant take a couple of deep sharp breaths, as this reliably results in
very clear SCRs.14 If there are no clear SCRs observed, it is possible that the gel needs more time
to soak into the skin. Therefore, we would continue giving instructions and check a second time
immediately before the critical part of the study is to begin. One could use the recording up to
13 Additional information is available upon request. 14 Participants are typically curious about what we are recording with the electrodes. Therefore, we show them the AcqKnowledge monitor at this time. Afterwards, we make sure that the participant cannot see the monitor since it might distract them. The experimenter also avoids watching the monitor as this might make participants feel overly scrutinized.

SKIN CONDUCTANCE 19
this point as a baseline. However, because the electrical connection might not yet have reached a
steady state, it is more advisable to have a (second) baseline period towards the end of the
experiment, e.g., while participants fill out some questionnaires. Naqvi and Bechara (2006)
recommend the recording of—in addition to a resting baseline—an active baseline (the responses
to a series of quick, sharp, deep breaths), which can be used to exclude non-responders or as
covariates to account for individual differences in SCR magnitude.
Before the critical part of the experiment starts, we again check whether the skin conductance
is recorded properly, having the participant take a deep breath. Usually by this point in the
procedure, data is being properly recorded. If not, one can try to remove the electrodes, clean the
skin again and start over. If participants have very cold hands, this can also reduce electrodermal
activity (Boucsein, 1992).15 If the second try fails again, it is likely that this participant is a non-
responder16 and the experimenter has to decide whether it is worth collecting the data (most
probably resulting only in a meaningful behavioral but not a meaningful physiological data set)
or abort participation.
Experimental Design and Task Structure
As described above, skin conductance is a relatively slow signal. Not only does it change in
the range of seconds but it is also time-lagged, i.e., between the occurrence of a stimulus and the
resulting SCR, there is a latency of about 0.5 to 5 seconds (most often, the latency of SCRs is
between 1 and 2 seconds; Boucsein, 1992). This makes the signal similar to the blood
oxygenation level dependent (BOLD) response in fMRI research, which is also slow and time-
15 In general, we and others (e.g., Venables & Christie, 1980) have found that higher room temperatures might work better than low room temperatures. 16 About 5 to 10% or even up to 25% of the population have been found to be non-responders (Dawson et al., 2007), with some clinical groups exhibiting even higher rates of non-responders (e.g., in schizophrenia; Boucsein, 1992).

SKIN CONDUCTANCE 20
lagged. While there are several differences between SCR and BOLD, similar considerations have
to be taken into account when planning the study and the task. For example, a one-shot design,
i.e., one single SCR measurement per participant per experimental condition, might result in data
too noisy to lead to any significant effects. In addition to other factors, the number of repetitions
needed depends crucially on the stimuli (namely how reliably they trigger SCRs and how strong
those SCRs are). Strongly aversive stimuli, such as an electrical shock in a conditioning
experiment or a loss of a substantial amount of money in a risky choice task, can be expected to
more reliably trigger strong SCRs compared to more subtle stimuli. To address the time-lag
problem, SCR studies often use relatively long interstimulus intervals (ISI) of 6 to 12 seconds or
more between trials to make sure skin conductance has returned to baseline before a new trial
starts (e.g., Bechara, Tranel, Damasio, & Damasio, 1996; Reid & Gonzalez-Vallejo, 2009). While
this is a clean design practice that leads to data that are simple to analyze, such a design can have
disadvantages, depending on one's goals for the study.
For example, if one wants to distinguish between the processes before, during, and after a
decision (i.e., anticipated, decision, and experienced utility), such a long ISI would have to be
inserted between each of these phases. In combination with the need for repeated measurements
and perhaps a factorial within-subject design, this can result in very long experiments. Because
the resulting task would consist mainly of waiting periods, the experiment might be excessively
boring for participants. More importantly, even in shorter tasks, such long and repeated ISIs can
change the very decision processes that one plans to study.
Researchers in fMRI studies came up with different ways to optimize their task designs, in
response to such challenges, which can be applied to skin conductance studies (for basics in
fMRI research see Huettel, Song, & McCarthy, 2004). In blocked designs, longer periods of a
SKIN CONDUCTANCE 21
specific task are counted as one period of interest (block), assuming that during the block
relatively constant processes are engaged. We used this approach in Figner et al. (2009) to
compare SCRs during a longer time period across the hot and the cold CCT, and to a baseline
measure. Here, the whole risky choice phase of the (hot or cold) CCT counted as one block.
Sufficient for our manipulation check purpose (that the hot CCT involved stronger affective
processes than the cold CCT), we used a simple between-subject design in which each participant
had only one block of interest, plus a baseline measure. More elaborate designs can be used to
increase statistical power, e.g., with the blocks forming the conditions of interest administered
repeatedly, within-subject, and in random or counterbalanced order with blocks of rest between
them.17
However, in many studies, investigating shorter time intervals (such as single trials) might be
more appropriate. For such questions where the unit of analysis has to be shorter, we are
confronted again with the problems regarding the slowness and time lag of the skin conductance
signal. Potential improvements from such designs can be found again in fMRI paradigms. While
designs looking at relatively short time periods are generally called event-related designs (as the
physiological data are analyzed with respect to single events, not blocks containing multiple
events), so-called rapid event-related designs are most interesting for our purpose. This chapter
allows us to outline only briefly ideas on how such analysis can be applied to SCR data (see
Alexander et al., 2005; Lim et al., 1997 for related approaches). Importantly, such designs are
based on the assumption that repeated and overlapping physiological responses add up in linear
fashion (in our case several SCRs; in fMRI, several BOLD responses).18 If this assumption holds,
17 This might be a viable design, for example, to investigate emotional arousal during different forms of information acquisition in a decision-making task. 18 For BOLD in fMRI this is well investigated and it has been shown that linearity holds reasonably well for responses that are spread apart by more than 50 ms (Burock, Buckner, Woldorff, Rosen, & Dale, 1998). To the best
SKIN CONDUCTANCE 22
separate events of interest do not have to be divided by long ISIs. Instead, responses can be
allowed to overlap, as they can be deconvoluted statistically with regression approaches. In such
an analysis, the dependent variable would be the continuous SCR data. Several independent
regressors can be built for different types of events of interest, such as, in the CCT, a regressor
coding each time the participant turns over a loss card; a second regressor codes each instant of
turning over a gain card, a third regressor represents the decision to end a trial voluntarily, etc.
Some regressors may have only two different values (0 and 1), coding whether the event is
present or not. Other regressors can be parametrically varied (e.g., coding the different loss
magnitudes). As in fMRI analysis, these regressors are simple delta (i.e., stick) functions, being 0
for all time points without the event of interest and being a value greater than 0 for the events.
Before they are used in the following GLM analysis, the delta functions are convoluted with a
"canonical" SCR that can be taken from, for example, an averaged SCR. Just as in fMRI analysis,
the estimated weights and error indicators of the regressors from the individual-level analysis can
then be transferred to the group analysis.
Importantly, the intervals between events do not need to be long but they should be jittered
(i.e., of unequal length). This can be achieved by programming randomly jittered ISIs as part of
the computer task, or by using the self-pacing of the participants (for use in fMRI, see Maccotta,
Zacks, & Buckner, 2001; Moritz, Carew, McMillan, & Meyerand, 2005), an approach that we
adopted in our CCT studies. We are currently working on such an analysis approach to be used
with skin conductance data (see also Alexander et al., 2005; Lim et al., 1997). Such an approach
has the potential to be very useful and statistically powerful in more natural task designs that
cannot be realized pragmatically with long ISIs. Naturally, this might be particularly interesting
of our knowledge, linearity for overlapping SCRs has not been systematically investigated yet. However, there is evidence supporting the additivity of multiple SCRs (see Freedman et al., 1994; Lim et al., 1997; Lykken & Venables, 1971).

SKIN CONDUCTANCE 23
for process-tracing studies. However, for the remainder of the chapter, we will focus on the
traditional analysis method, assuming sufficiently long ISIs.
Data Management and Analysis
The data that result from skin conductance measurement are substantial. Assuming a sampling
rate of 1 kHz, one participant taking part in a 20 minute experiment yields over 1 million (20
minutes × 60 seconds × 1000 observations per second = 1,200,000) numbers corresponding to the
conductivity of their skin over time. This ordered vector of numbers is from just one channel and
forms the raw signal that can be processed and analyzed on its own or in conjunction with other
variables recorded along the same time course on different channels.19 We use MATLAB for the
analysis, as it is a powerful and flexible software package, capable of dealing with large data sets
(some possible alternatives are R or Octave). The proprietary AcqKnowledge files (.acq) can be
exported into a generic tab delimited format compatible with MATLAB (.mat) where each row
corresponds to one of the samples and each column corresponds to a separate channel.20
Preprocessing. We first verify that the data were recorded properly during the experimental
session by generating and examining plots of each of the channels over time. For example, the
raw skin conductance signal should yield a plot that looks something like Figure 1. Examining
the plots of each channel can reveal serious problems with a dataset that would invalidate later
results from the experimental session, e.g., if an electrode fell off a person’s finger during the
19 Depending on the sampling rate and the duration of the experiment, the data files can be quite large (usually between 50 MB and 100 MB per participant). 20 There are also free MATLAB functions that allow the direct import of .acq files, available at MATLAB Central.

SKIN CONDUCTANCE 24
experiment. For the remainder of the analysis, we focus on the high-pass filtered SCR data
channel (Channel E in Figure 3).
As high-frequency noise is likely to be present in the skin conductance signal, steps are often
used to eliminate this source of error variance. For example, in our laboratory the Biopac picks
up electromagnetic disturbances (from sources such as the overhead florescent lights) and hence
records a persistent low amplitude 60 Hz sub-signal. Such noise can be eliminated by
administering a low-pass filter or a smoothing function (for our data collected with a sampling
rate of 1 kHz, we use a simple moving average across 500 ms). By treating the raw signal with
both a high-pass filter (thus removing tonic changes and slow drifts), and then a low-pass filter
(to remove high-frequency noise), the result is a band-pass filtered signal.21 This signal is the
basis of subsequent analyses as it isolates the phasic SCRs that are of interest to us in our
research. In Figure 5, we show the effects of high-pass and low-pass filters on a raw skin
conductance signal.
In addition to processing the skin conductance signals, the task marker channels are processed.
The channels are smoothed with the same moving average function to mitigate noise, and then a
peak detect function is run on the channels. The result is a series of several binary markers that
tell us when in the time course the participant performed a particular action or there was a
particular event or outcome in the task. These markers are used to isolate portions of the SCR
signal that are of particular interest (i.e., to define the measurement windows, see below).
21 Alternatively, a low-pass filter with a cutoff of 2 Hz can be applied, leading to the identical result of removing high-frequency noise without altering the shape of the curve. As sympathetic neural activity operates at low frequencies (below 0.15 Hz; Nagai et al., 2004), even relatively low-frequency low-pass filters do not remove substantial information.

SKIN CONDUCTANCE 25
Figure 5. The effects of filters on signal data: Top panel, raw skin conductance signal,
reflecting both SCL and SCR (equivalent to channel B in Figure 3). Middle panel, filtered signal
after application of a 0.5 Hz high-pass filter (equivalent to channel E in Figure 3). The slow drift
in the signal (representing the SCL) has been removed such that the filtered signal reflects only
phasic changes, i.e., SCRs (note the difference in the slope of the straight gray line in the top
panel compared to the middle and bottom panels). Bottom panel, signal after application of 2 Hz
low-pass filter to remove high-frequency noise present in the data (see insets zooming in on a
small time window of about 200 milliseconds), the general shape of the signal remains
unchanged by the third step but eliminates unwanted noise in the data. The last step is done after
data collection, during data preprocessing, by applying a moving average smoothing function.

SKIN CONDUCTANCE 26
Main analysis. There are a variety of different ways to quantify SCRs and score the response
as a single number. Traditionally, the most common indicator (using the unfiltered raw skin
conductance signal) has been the SCR magnitude, reflecting the peak amplitude of the SCR.22 In
order to quantify these, a latency onset window has to be defined. A typical criterion is that the
onset of an SCR has to be between 1 and 3 seconds after stimulus onset.23 Then, the peak
amplitude of this SCR is quantified by computing the difference between skin conductivity
before the SCR onset and the skin conductivity at the peak of the SCR (Boucsein, 1992).
A more recent indicator, which lends itself more readily to automated analysis, is the area
bounded by the SCR curve. Here, instead of an onset latency window, a window of interest is
defined (the measurement window; see Figure 6). The measurement window has to be long
enough to capture most of the SCR-related fluctuations but short enough to avoid catching
variance related to non-specific SCRs or SCRs to following stimuli. In general, longer ISIs allow
longer measurement windows. Assuming sufficiently long ISIs, a common window of interest
might start 1 second after stimulus onset and end 6 seconds after stimulus onset, making sure that
most of the SCR-related activity will be captured in the 5 seconds of interest. In the next step, the
SCR-related variance in the data is quantified within this measurement window.
22 Sometimes magnitude and amplitude measures are distinguished, with the former measure including SCRs with 0 amplitude and the latter counting only cases in which an actual SCR was observed (i.e., excluding instances where no discernable SCR occurred in the time window). 23 SCRs with an onset time outside this onset latency window would be counted as non-specific. Only the onset of the SCR has to lie within this window, usually there is no criterion when the SCR has to be finished as SCR recovery time can be very long.

SKIN CONDUCTANCE 27
Figure 6. Raw (top) and filtered skin conductance signal (bottom), showing quantification of
SCR within a time of interest window (measurement window) as the area bounded by the filtered
SCR signal and the abscissa.
There are different approaches for this quantification. Naqvi and Bechara (2006), for example,
use the area defined by the SCR curve and a sloped line delineated by the intersection of the
measurement window and the SCR curve. We use the area bounded between the SCR curve and
the abscissa within the window of interest (see Figure 6). As our filtering of the raw skin
conductance signal has the effect that the resulting SCR data are centered around 0, the area
bounded by the curve can be simply calculated by summing up the absolute values that lie within
the time window.24 Usually, the area bounded by the curve measure is standardized per time unit
24 Usually, the two methods will lead to very similar results. However, it appears that our method provides a more consistent index of the SCR compared to the previous approach, as it is less sensitive to variations in the defined location of the time window: If either the start or the end of the measurement window falls onto an SCR, our

SKIN CONDUCTANCE 28
(typically per second) by dividing it by the length of the time window of interest in seconds such
that the resulting measurement is in µS/sec.
The determination of the size of the measurement window is obviously somewhat arbitrary,
specifically regarding the endpoint (the starting point cannot vary that much because it has to be
between the stimulus onset and the SCR onset). We find it useful to plot the SCRs in relation to
the stimulus onset: One plot represents each SCR by an individual curve in the same graph and
one plots shows only one curve, representing the average of all SCRs. These graphs are helpful in
defining a sensible measurement window. Obviously, the time window of interest has to be the
same for all participants and conditions within an experiment for this type of analysis, as results
might otherwise be difficult to interpret.
Data transformations. It is worth checking the distribution of the data. Particularly, SCR
magnitude has been found to be skewed, which may be addressed with either a log or square root
transformation. Also, it may be useful to standardize the SCR data within each participant
because the magnitude of skin conductance data can vary between participants not only due to
psychological but also due to physiological causes, such as the thickness of the corneum, and
standardization can eliminate or reduce the influence of the latter source of variance (Boucsein,
1992; Dawson et al., 2007). Dawson et al. (2007) discuss advantages and disadvantages of
different standardization approaches. Many researchers, however, do not use participant-wise
standardization, instead choosing to use the unstandardized measures in their ensuing statistical
analysis.
Conclusions and Recommended Reading approach leads to a more reliable SCR quantification due to not relying on a sloped bounding line but using the abscissa instead.

SKIN CONDUCTANCE 29
There are several advantages and disadvantages to be taken into account when considering
using EDA measures in JDM research. The advantages are that skin conductance is a
comparatively robust physiological measure that can be measured relatively cheaply, easily, and
unobtrusively. It yields a continuous measure that is related to activity in the sympathetic branch
of the ANS. Accordingly, it does not reflect one single process, which can be seen either as an
advantage or a disadvantage. Irrespective of this, skin conductance measurement requires that the
setup of the experiment and/or additional measures such as self-reports constrain the possible
interpretations of the changes in skin conductance by constraining the psychological processes it
is reflecting. A clear disadvantage of skin conductance is the slowness and time lag of its signal,
typically requiring long ISIs. Newer analysis approaches, however, promise to help mitigate this
issue.
We have provided only a very brief overview of the physiological background and the various
ways to measure different components of EDA besides SCRs. This information and much else
about EDA can be found in the excellent and thorough volume by Boucsein (1992). Other
recommended chapters have been written by Dawson, Schell, and Filion (2007) and Venables
and Christie (1980). Naqvi and Bechara (2006) published a chapter on EDA related to the IGT
and the SMH. If the reader is specifically interested in the neural substrates involved in EDA, we
recommend the work by Critchley, Dolan and colleagues (an overview can be found in Critchley,
2002) and the work by the Iowa group, e.g., on the role of ventromedial cortex (e.g., Bechara et
al., 1996 and Bechara, Damasio, Tranel, & Damasio, 1997). For more novel analysis approaches
using short ISIs, we suggest consulting the most recent literature (also in fMRI) as this is an area
of rapid development (Alexander et al., 2005; De Clercq, Verschuere, De Vlieger, & Crombez,
2006; Lim et al., 1997).

SKIN CONDUCTANCE 30
Author Note
Bernd Figner, Center for the Decision Sciences and Department of Psychology, Columbia
University.
Ryan O. Murphy, the ETH Zurich (Decision Theory and Behavioral Game Theory); and the
Center for the Decision Sciences, Columbia University. Murphy can be reached by email at
This research was supported by grants from the Swiss National Science Foundation (PA001 –
115327 and PBZH1 – 110268) and a grant by the US National Science Foundation (SES –
0720932), awarded to the first author; and a grant by the US National Science Foundation (SES-
0637151), awarded to the second author.
Correspondence concerning this article should be addressed to Bernd Figner, Center for the
Decision Sciences and Department of Psychology, Columbia University, 406 Schermerhorn Hall,
Mail Code 5501, 1190 Amsterdam Avenue, NY 10027, USA. Electronic mail may be sent to
Acknowledgments
Thanks to Amy Krosch for her assistance with experiment administration, data organization and
analysis, and to Amy Krosch and Annie Ma for their help with manuscript preparation.

SKIN CONDUCTANCE 31
References
Alexander, D. M., Trengove, C., Johnston, P., Cooper, T., August, J. P., & Gordon, E. (2005). Separating individual skin conductance responses in a short interstimulus-interval paradigm. Journal of Neuroscience Methods, 146, 116-123.
Bechara, A., Damasio, A. R., Damasio, H., & Anderson, S. W. (1994). Insensitivity to future consequences following damage to human prefrontal cortex. Cognition, 50, 7-15.
Bechara, A., Damasio, H., Damasio, A. R., & Lee, G. P. (1999). Different contributions of the human amygdala and ventromedial prefrontal cortex to decision-making. Journal of Neuroscience, 19, 5473-5481.
Bechara, A., Damasio, H., Tranel, D., & Damasio, A. R. (1997). Deciding advantageously before knowing the advantageous strategy. Science, 275, 1293-1295.
Bechara, A., Damasio, H., Tranel, D., & Damasio, A. R. (2005). The Iowa Gambling Task and the somatic marker hypothesis: Some questions and answers. Trends in Cognitive Sciences, 9, 159-162.
Bechara, A., Tranel, D., Damasio, H., & Damasio, A. R. (1996). Failure to respond autonomically to anticipated future outcomes following damage to prefrontal cortex. Cerebral Cortex, 6, 215-225.
Boucsein, W. (1992). Electrodermal activity. New York: Plenum Press. Bradley, M., & Lang, P. (1994). Measuring emotion: The self-assessment manikin and the
semantic differential. Journal of Behavior Therapy and Experimental Psychiatry, 25, 45-55.
Brown, C. C. (1967). A proposed standard nomenclature for psychophysiologic measures. Psychophysiology, 4, 260-264.
Burock, M. A., Buckner, R. L., Woldorff, M. G., Rosen, B. R., & Dale, A. M. (1998). Randomized event-related experimental designs allow for extremely rapid presentation rates using functional MRI. Neuroreport, 9, 3735-3739.
Cacioppo, J. T., Berntson, G. G., Larsen, J. T., Poehlmann, K. M., & Ito, T. A. (2000). The psychophysiology of emotion. In M. Lewis & J. M. Haviland-Jones (Eds.), The handbook of emotion (2 ed., pp. 173 – 191). New York: Guilford Press.
Critchley, H. D. (2002). Electrodermal responses: What happens in the brain. Neuroscientist, 8, 132-142.
Crone, E. A., Somsen, R. J., van Beek, B., & van der Molen, M. W. (2004). Heart rate and skin conductance analysis of antecendents and consequences of decision making. Psychophysiology, 41, 531-540.
Crone, E. A., & van der Molen, M. W. (2007). Development of decision making in school-aged children and adolescents: Evidence from heart rate and skin conductance analysis. Child Development, 78, 1288-1301.
Dawson, M. E., Filion, D. L., & Schell, A. M. (1989). Is elicitation of the autonomic orienting response associated with allocation of processing resources? Psychophysiology, 26, 560-572.
Dawson, M. E., Schell, A. M., & Filion, D. L. (2007). The electrodermal system. In J. T. Cacioppo, L. G. Tassinary & G. G. Berntson (Eds.), Handbook of psychophysiology (3rd ed., pp. 159-181). Cambridge, UK: Cambridge University Press.

SKIN CONDUCTANCE 32
De Clercq, A., Verschuere, B., De Vlieger, P., & Crombez, G. (2006). Psychophysiological Analysis (PSPHA): A modular script-based program for analyzing psychophysiological data. Behavior Research Methods, 38, 504-510.
Delgado, M. R., Gillis, M. M., & Phelps, E. A. (2008). Regulating the expectation of reward via cognitive strategies. Nature Neuroscience, 11, 880-881.
Dunn, B. D., Dalgleish, T., & Lawrence, A. D. (2006). The somatic marker hypothesis: a critical evaluation. Neuroscience and Biobehavioral Reviews, 30, 239-271.
Figner, B., Mackinlay, R. J., Wilkening, F., & Weber, E. U. (2009). Affective and deliberative processes in risky choice: Age differences in risk taking in the Columbia Card Task. Journal of Experimental Psychology: Learning, Memory, and Cognition, 35, 709-730.
Freedman, L. W., Scerbo, A. S., Dawson, M. E., Raine, A., McClure, W. O., & Venables, P. H. (1994). The relationship of sweat gland count to electrodermal activity. Psychophysiology, 31, 196-200.
Fung, M. T., Raine, A., Loeber, R., Lynam, D. R., Steinhauer, S. R., Venables, P. H., et al. (2005). Reduced electrodermal activity in psychopathy-prone adolescents. Journal of Abnormal Psychology, 114, 187-196.
Grings, W. W., & Dawson, M. E. (1973). Complex variables in conditioning. In W. Prokasy & D. C. Raskin (Eds.), Electrodermal activity in psychological research (pp. 203-254). New York: Academic Press.
Hinson, J. M., Whitney, P., Holben, H., & Wirick, A. (2006). Affective biasing of choices in gambling task decision making. Cognitive, Affective and Behavioral Neuroscience, 6, 190-200.
Huettel, S. A., Song, A. W., & McCarthy, G. (2004). Functional magnetic resonance imaging. Sunderland, MA: Sinauer.
Jenkinson, P. M., Baker, S. R., Edelstyn, N. M.-J., & Ellis, S. J. (2008). Does autonomic arousal dstinguish good and bad decisions? Healthy individuals’ skin conductance reactivity during the Iowa gambling task. Journal of Psychophysiology, 22, 141-149.
Johnson, L. C., & Lubin, A. (1966). Spontaneous electrodermal activity during waking and sleeping. Psychophysiology, 3, 8-17.
Krosch, A. R., Figner, B., & Weber, E. U. (submitted). Choice processes and their consequences in morally conflicting military decisions.
Lim, C. L., Rennie, C., Barry, R. J., Bahramali, H., Lazzaro, I., Manor, B., et al. (1997). Decomposing skin conductance into tonic and phasic components. International Journal of Psychophysiology, 25, 97-109.
Luman, M., Oosterlaan, J., Knol, D. L., & Sergeant, J. A. (2008). Decision-making in ADHD: Sensitive to frequency but blind to the magnitude of penalty? Journal of Child Psychology and Psychiatry, 49, 712-722.
Lykken, D. T., & Venables, P. H. (1971). Direct measurement of skin conductance: A proposal for standardization. Psychophysiology, 8, 656-672.
Maccotta, L., Zacks, J. M., & Buckner, R. L. (2001). Rapid self-paced event-related functional MRI: Feasibility and implications of stimulus-versus response-locked timing. Neuroimage, 14, 1105-1121.
Moritz, C. H., Carew, J. D., McMillan, A. B., & Meyerand, M. E. (2005). Independent component analysis applied to self-paced functional MR imaging paradigms. Neuroimage, 25, 181-192.

SKIN CONDUCTANCE 33
Nagai, Y., Critchley, H. D., Featherstone, E., Trimble, M. R., & Dolan, R. J. (2004). Activity in ventromedial prefrontal cortex covaries with sympathetic skin conductance level: a physiological account of a "default mode" of brain function. Neuroimage, 22, 243-251.
Naqvi, N. H., & Bechara, A. (2006). Skin conductance: A psychophysiological approach to the study of decision making. In C. Senior, T. Russell & M. S. Gazzaniga (Eds.), Methods in mind: The MIT Press.
Nikula, R. (1991). Psychological correlates of nonspecific skin conductance responses. Psychophysiology, 28, 86-90.
Rainville, P., Bechara, A., Naqvi, N., & Damasio, A. R. (2006). Basic emotions are associated with distinct patterns of cardiorespiratory activity. International Journal of Psychophysiology, 61, 5-18.
Reid, A. A., & Gonzalez-Vallejo, C. (2009). Emotion as a tradeable quantity. Journal of Behavioral Decision Making, 22, 62-90.
Scerbo, A. S., Freedman, L. W., Raine, A., Dawson, M. E., & Venables, P. H. (1992). A major effect of recording site on measurement of electrodermal activity. Psychophysiology, 29, 241-246.
Sokolov, E. N. (1963). Perception and the conditioned reflex. Oxford: Pergamon Press. Tranel, D., & Damasio, H. (1989). Intact electrodermal skin-conductance responses after bilateral
amygdala damage. Neuropsychologia, 27, 381-390. Tranel, D., & Damasio, H. (1994). Neuroanatomical correlates of electrodermal skin-conductance
responses. Psychophysiology, 31, 427-438. Traxel, W. (1957). Ueber das Zeitmass der psychogalvanischen Reaktion. Zeitschrift fuer
Psychologie, 161, 282-291. Uno, T., & Grings, W. W. (1965). Autonomic components of orienting behavior.
Psychophysiology, 1, 311-321. Venables, P. H., & Christie, M. J. (1980). Electrodermal activity. In I. Martin & P. H. Venables
(Eds.), Techniques in psychophysiology (pp. 3-67). Chichester, UK: John Wiley & Sons. Wagar, B. M., & Dixon, M. (2006). Affective guidance in the Iowa gambling task. Cognitive,
Affective and Behavioral Neuroscience, 6, 277-290. Walschburger, P. (1976). Zur Beschreibung von Aktivierungsprozessen: Eine Methodenstudie zur
psychophysiologischen Diagnostik. Unpublished Doctoral DissertatWion, Albert-Ludwig-Universitaet, Freiburg, Germany.
Weber, E. U., & Johnson, E. J. (2009). Mindful judgment and decision-making. Annual Review of Psychology, 60, 53-85.
Williams, L. M., Brammer, M. J., Skerrett, D., Lagopolous, J., Rennie, C., Kozek, K., et al. (2000). The neural correlates of orienting: An integration of fMRI and skin conductance orienting. Neuroreport, 11, 3011-3015.