using simulation modelling as a policy option in coping ... · using simulation modelling as a...
TRANSCRIPT
Using simulation modelling as a policy option in coping with
agrometeorological risks and uncertainties
Simone Orlandini, Luca Martinelli, Anna Dalla Marta
Department of Agronomy and Land Management University of Florence
E-mail: [email protected]
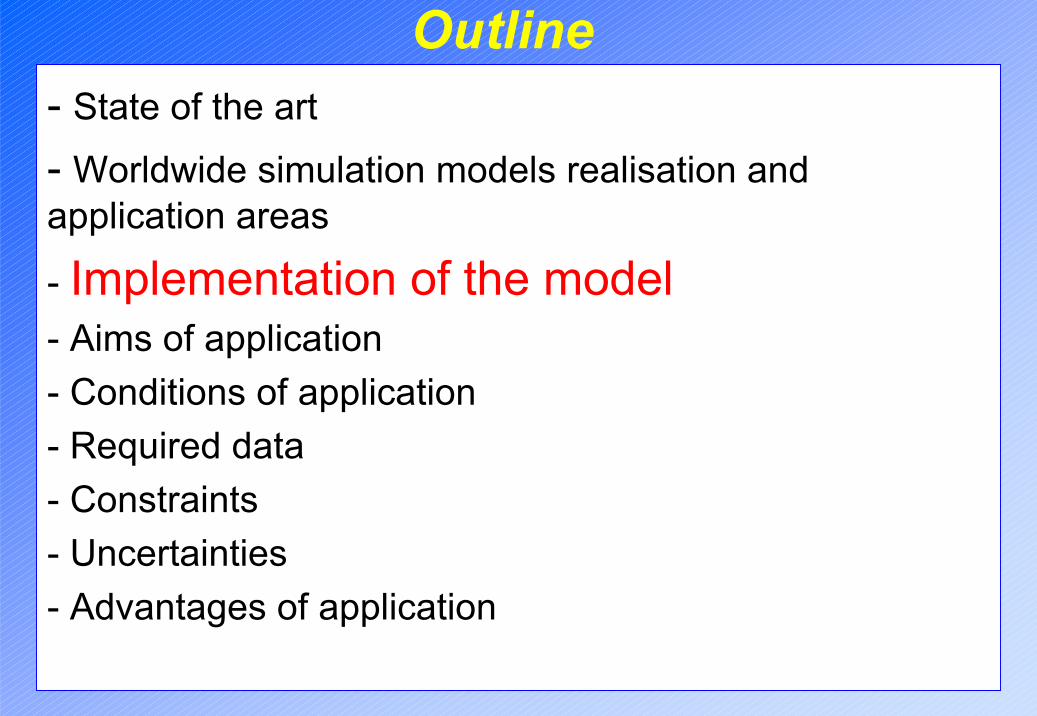
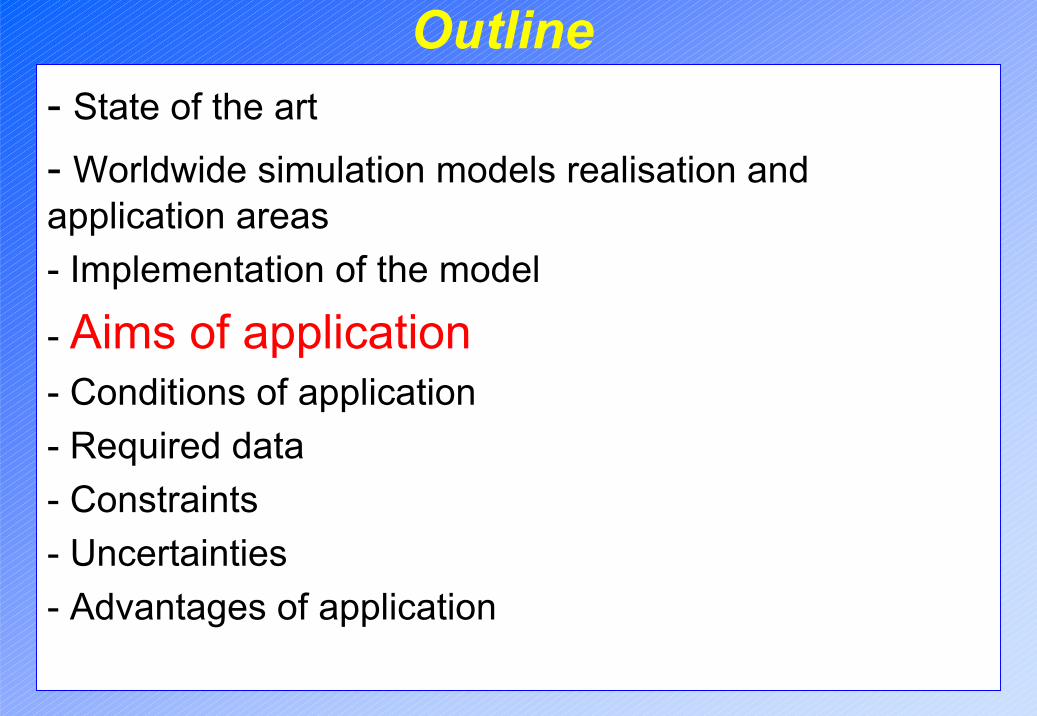
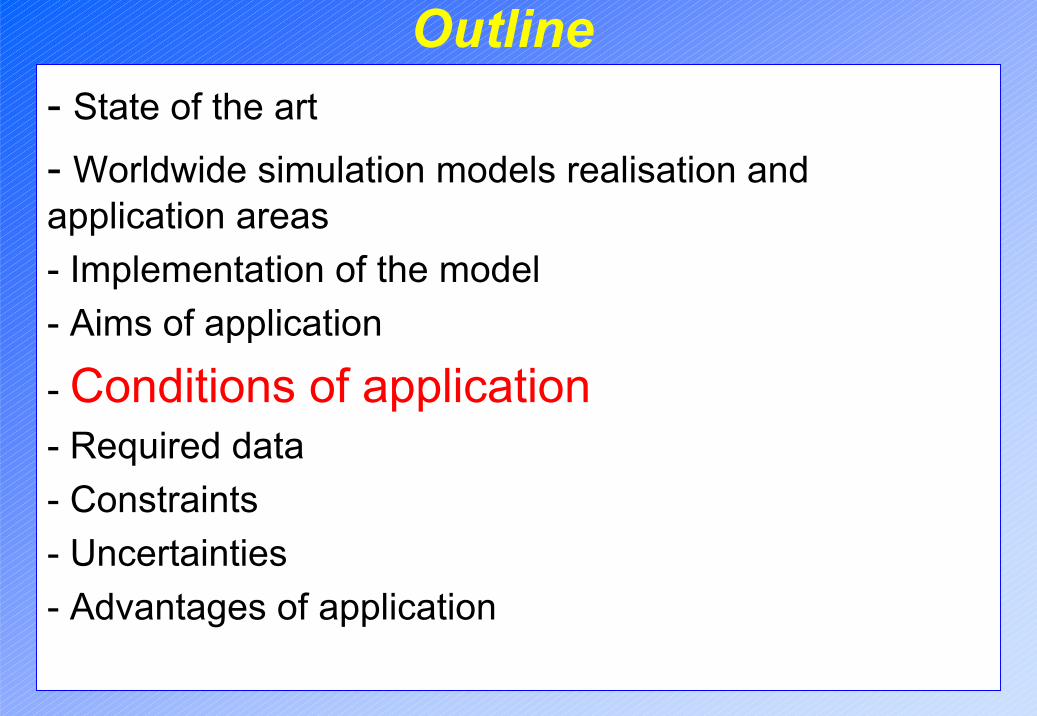
Outline- State of the art- Worldwide simulation models realisation and application areas- Implementation of the model - Aims of application - Conditions of application- Required data- Constraints- Uncertainties- Advantages of application
Outline- State of the art- Worldwide simulation models realisation and application areas- Implementation of the model - Aims of application - Conditions of application- Required data- Constraints- Uncertainties- Advantages of application
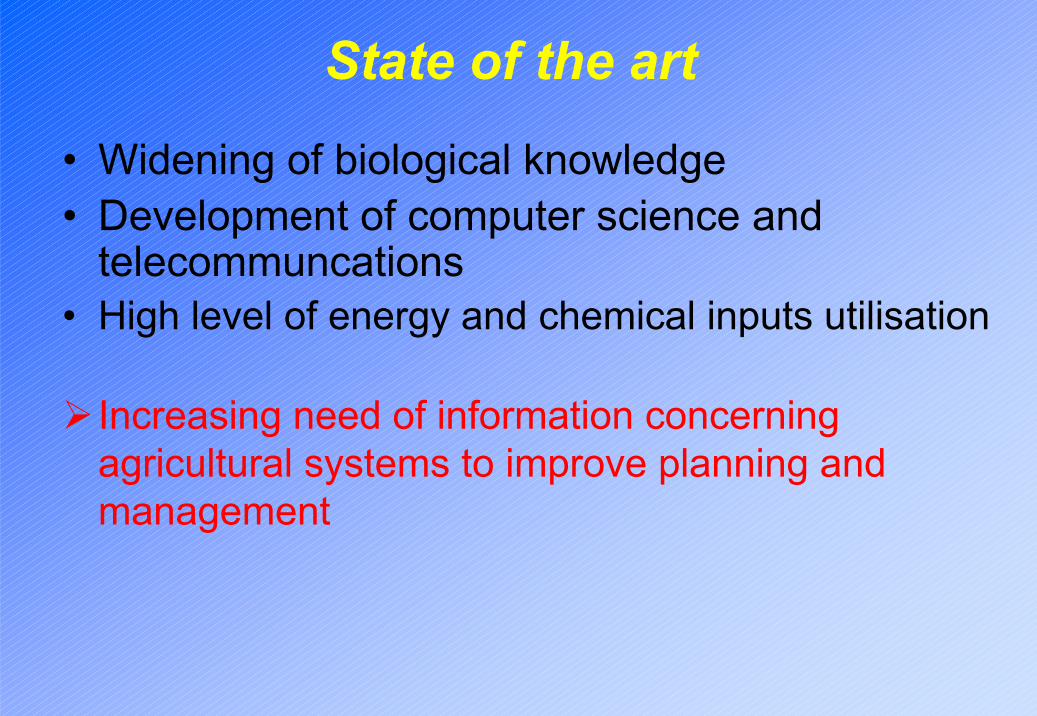
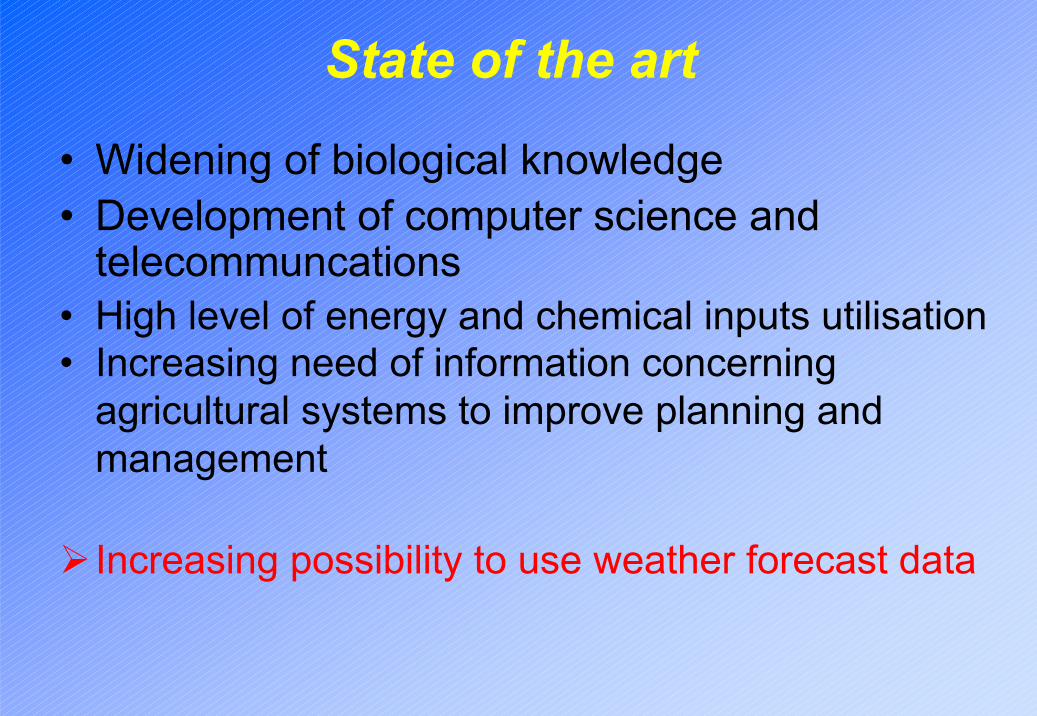
State of the artThere is an increasing need and possibility ofmodel development and application to rationalisecrop and land management.Several points are basic for this situation:– Widening of biological knowledge
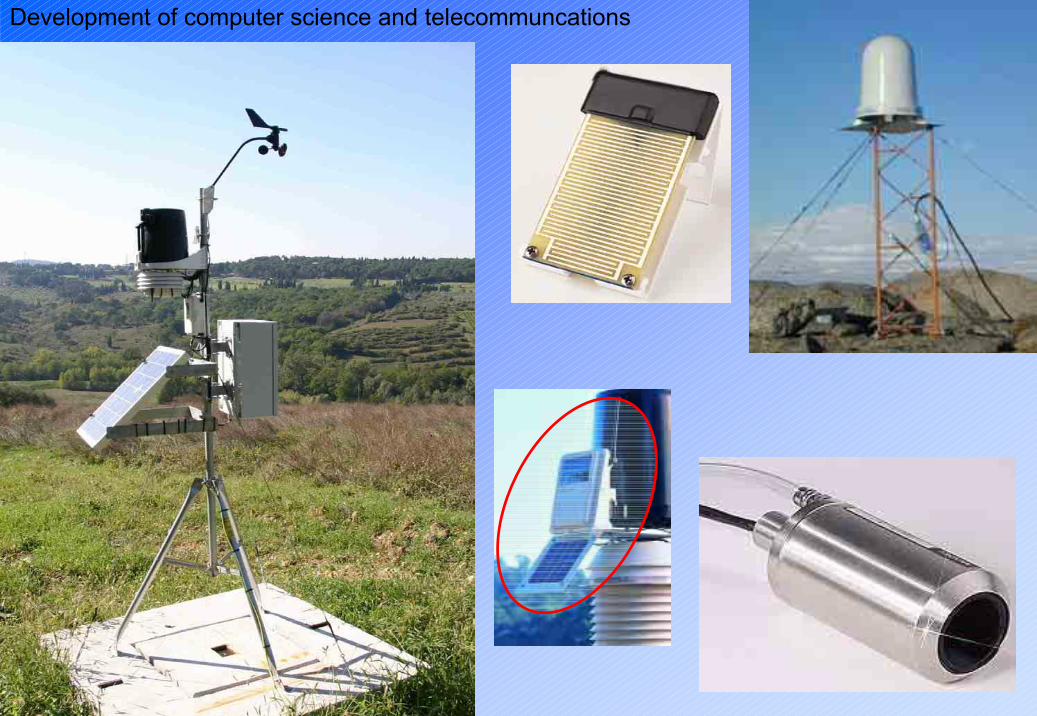
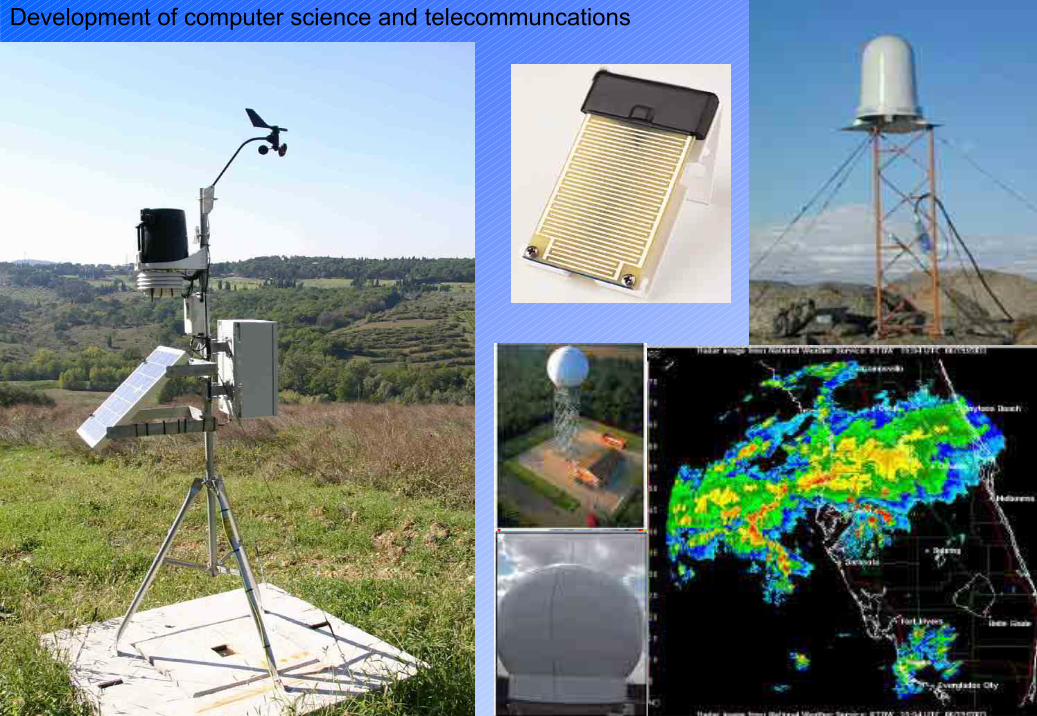
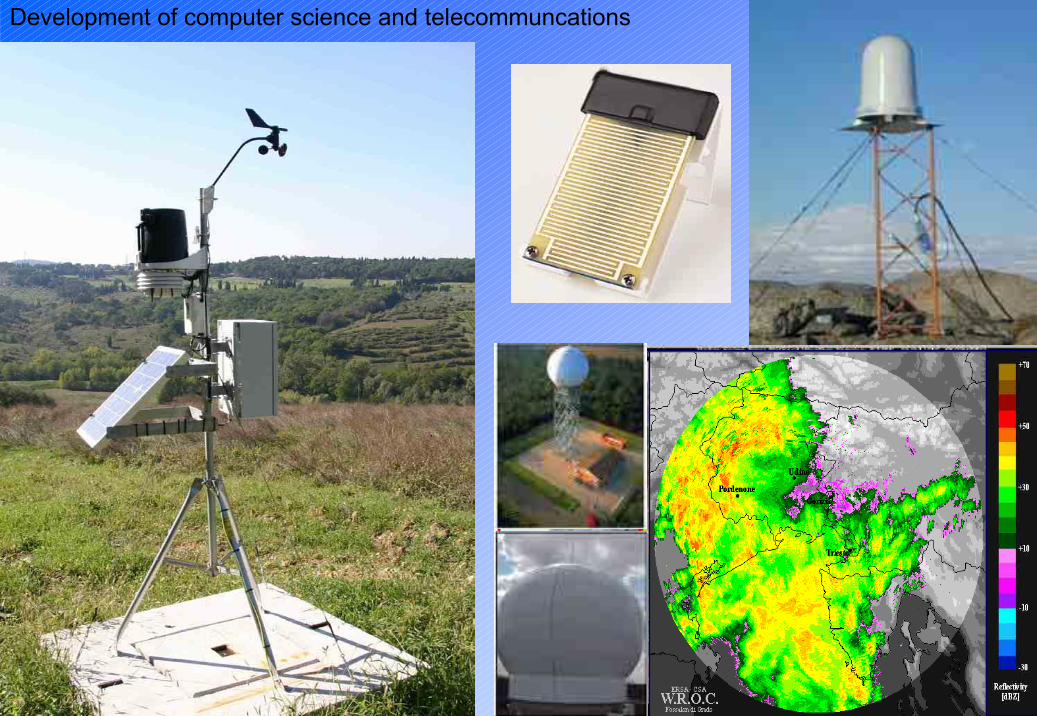
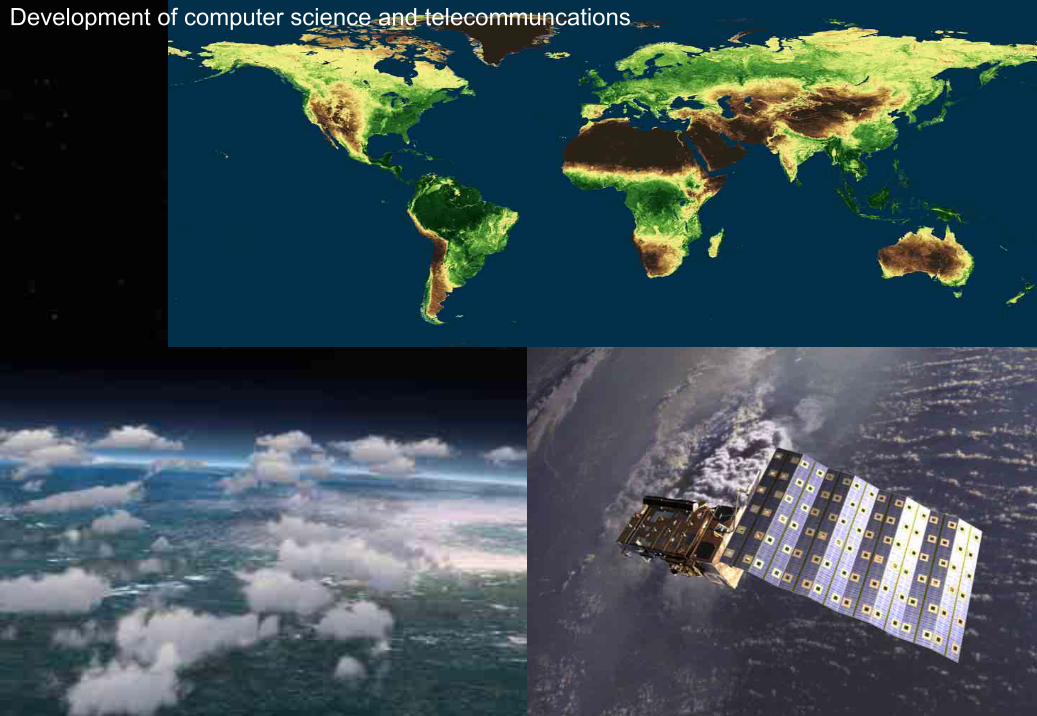
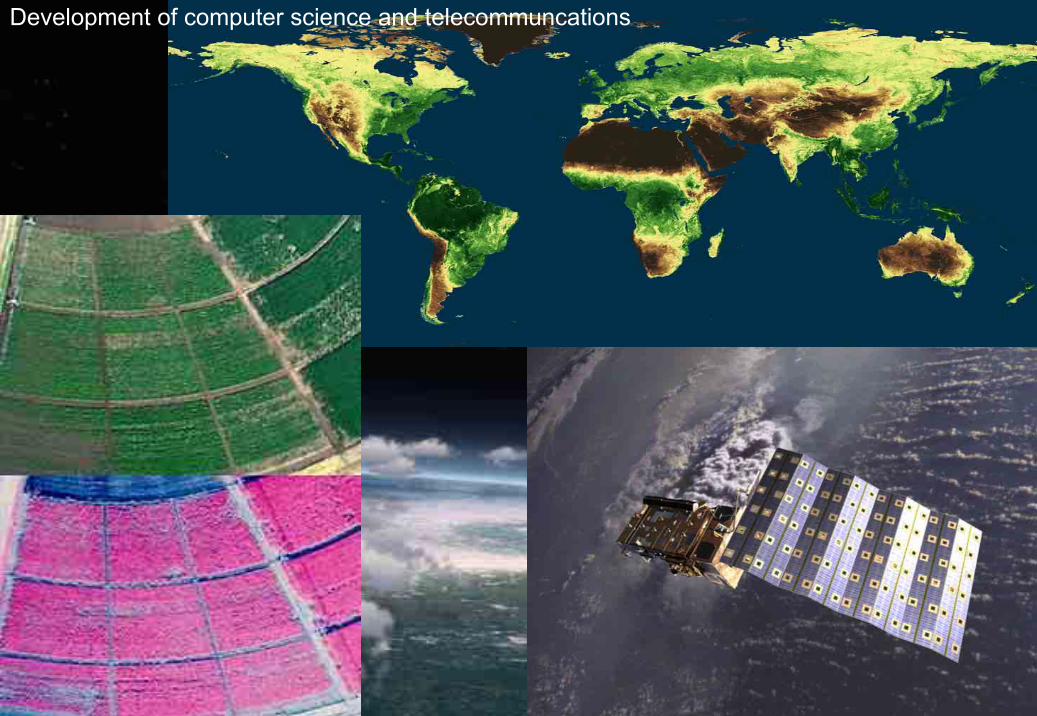
– Development of computer science and telecommunications
– High level of energy and chemical inputs utilisation
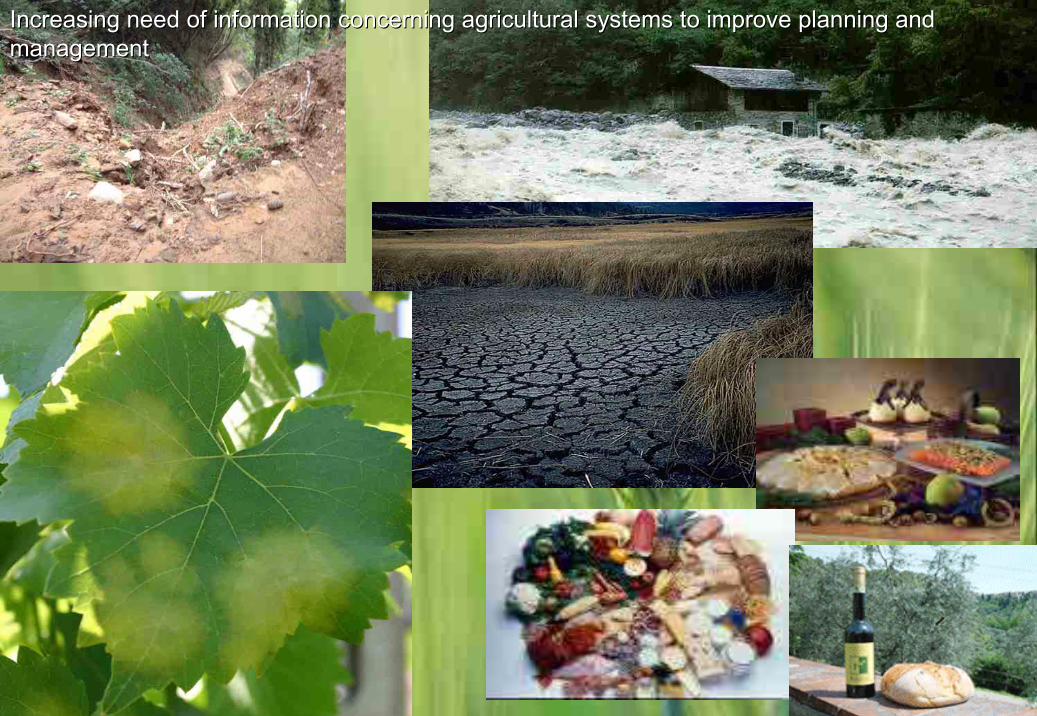
– Increasing need of information concerning agricultural systems to improve planning and management
– Increasing possibility to use weather forecast data
State of the art
Widening of biological knowledge
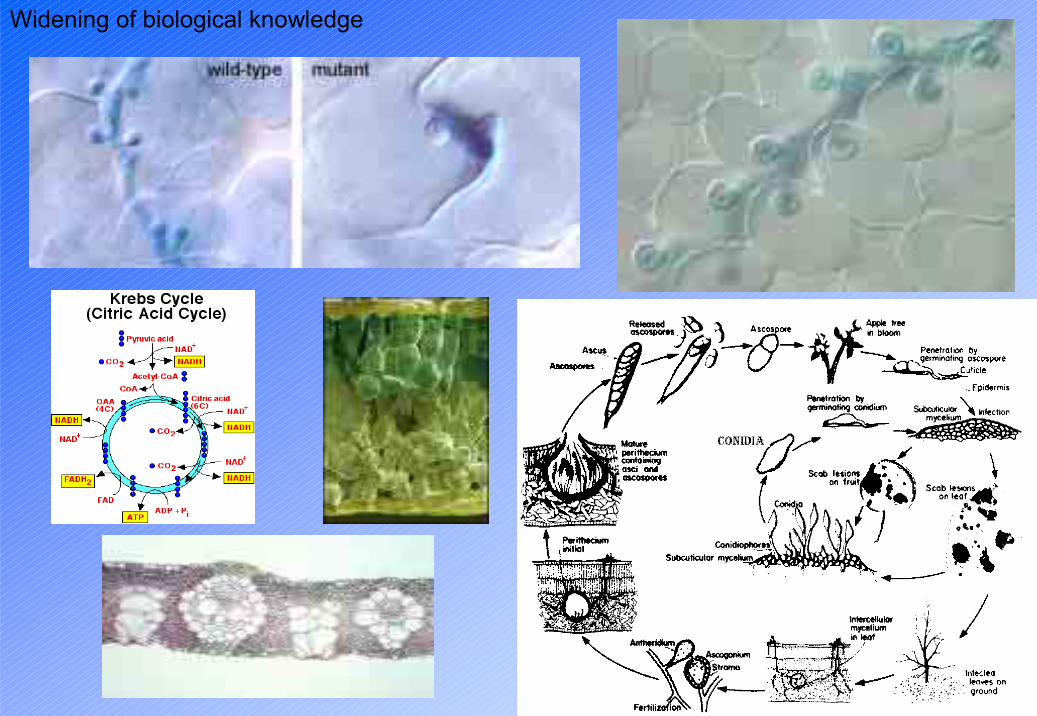
Widening of biological knowledge
State of the art
• Widening of biological knowledge
Development of computer science and telecommunications
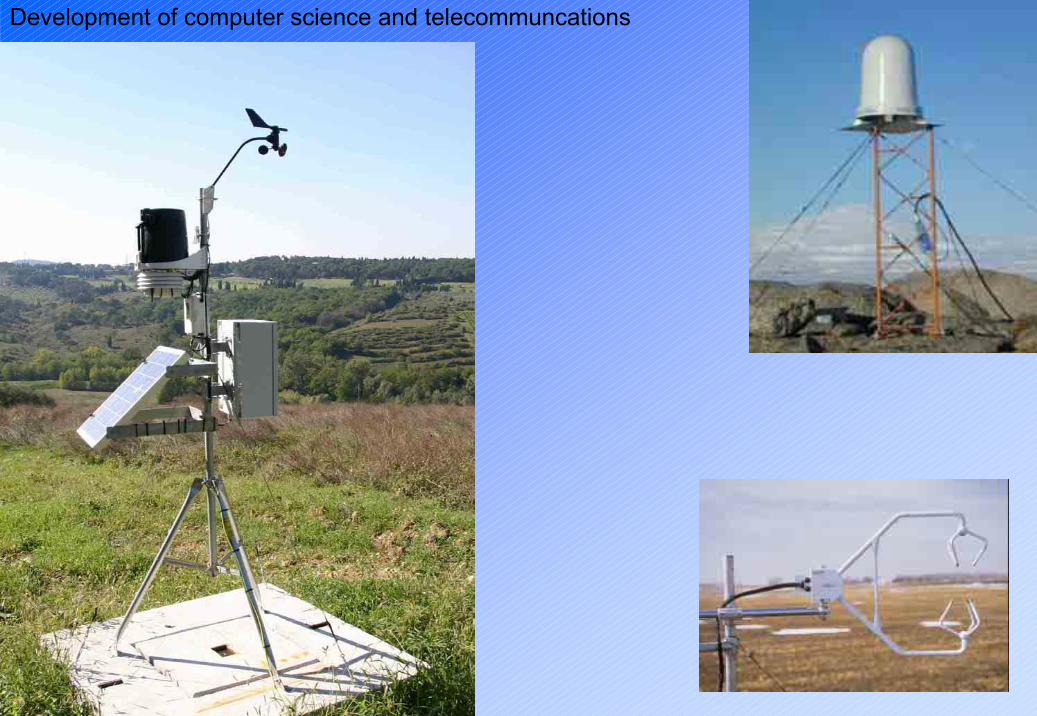
Development of computer science and telecommuncations
Development of computer science and telecommuncations
Development of computer science and telecommuncations
Development of computer science and telecommuncations

Development of computer science and telecommuncations
Development of computer science and telecommuncations
Development of computer science and telecommuncations
State of the art
• Widening of biological knowledge• Development of computer science and
telecommunications
High level of energy and chemical inputs utilisation
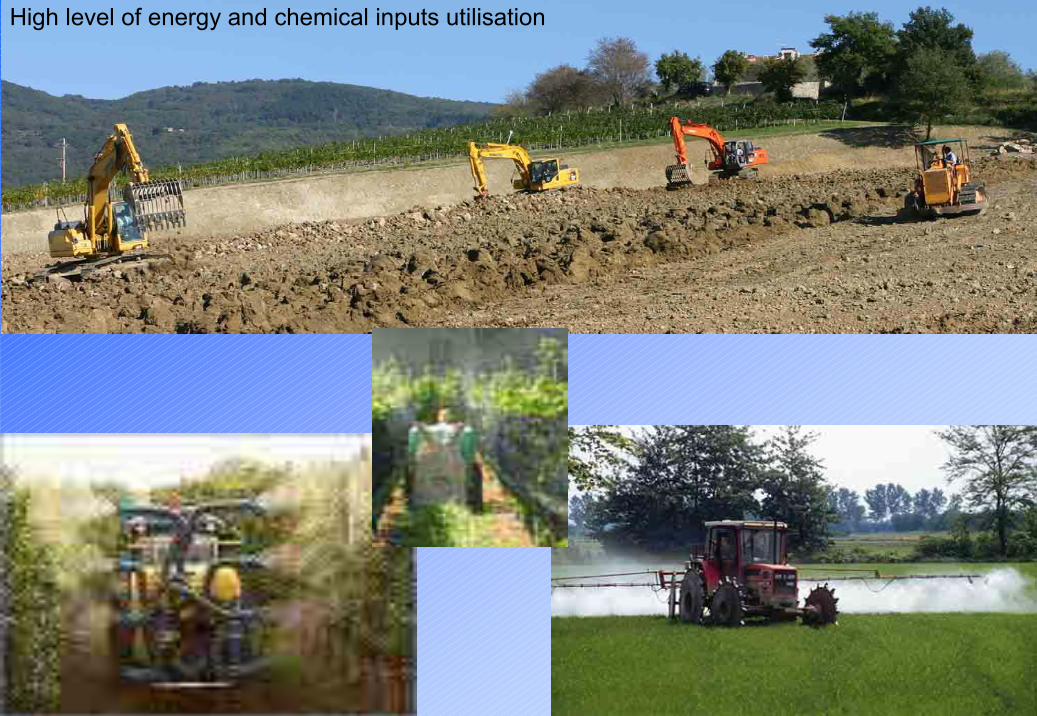
High level of energy and chemical inputs utilisation
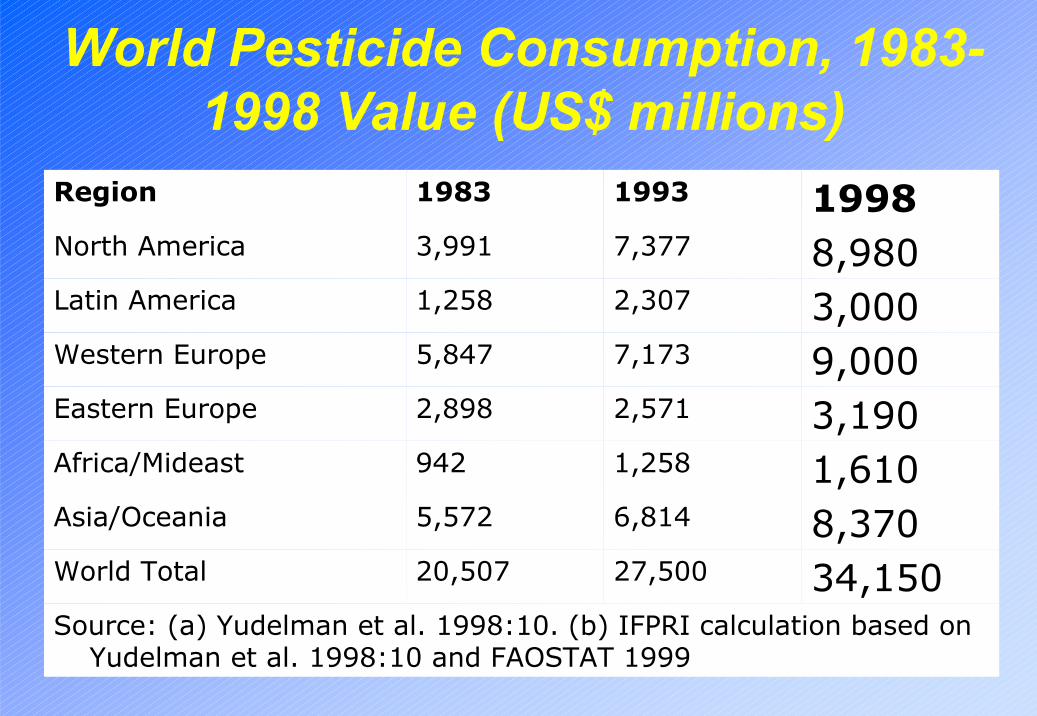
World Pesticide Consumption, 1983-1998 Value (US$ millions)
Source: (a) Yudelman et al. 1998:10. (b) IFPRI calculation based on Yudelman et al. 1998:10 and FAOSTAT 1999
34,15027,50020,507World Total
8,370 6,8145,572Asia/Oceania
1,6101,258942Africa/Mideast
3,190 2,5712,898Eastern Europe
9,0007,1735,847Western Europe
3,000 2,3071,258Latin America
8,980 7,3773,991North America
199819931983Region
State of the art
• Widening of biological knowledge• Development of computer science and
telecommuncations• High level of energy and chemical inputs utilisation
Increasing need of information concerning agricultural systems to improve planning and management
Increasing need of information concerning agricultural systems tIncreasing need of information concerning agricultural systems to improve planning and o improve planning and managementmanagement
State of the art
• Widening of biological knowledge• Development of computer science and
telecommuncations• High level of energy and chemical inputs utilisation• Increasing need of information concerning
agricultural systems to improve planning and management
Increasing possibility to use weather forecast data
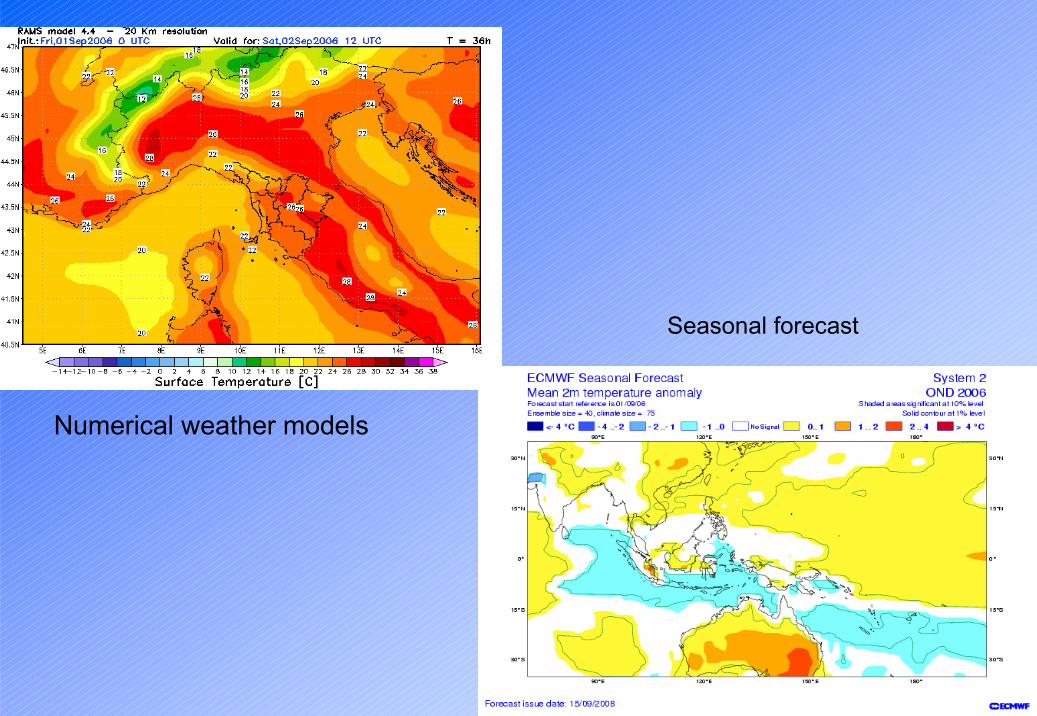
Numerical weather models
Seasonal forecast
Outline- State of the art
- Worldwide simulation models realisation and application areas- Implementation of the model - Aims of application - Conditions of application- Required data- Constraints- Uncertainties- Advantages of application
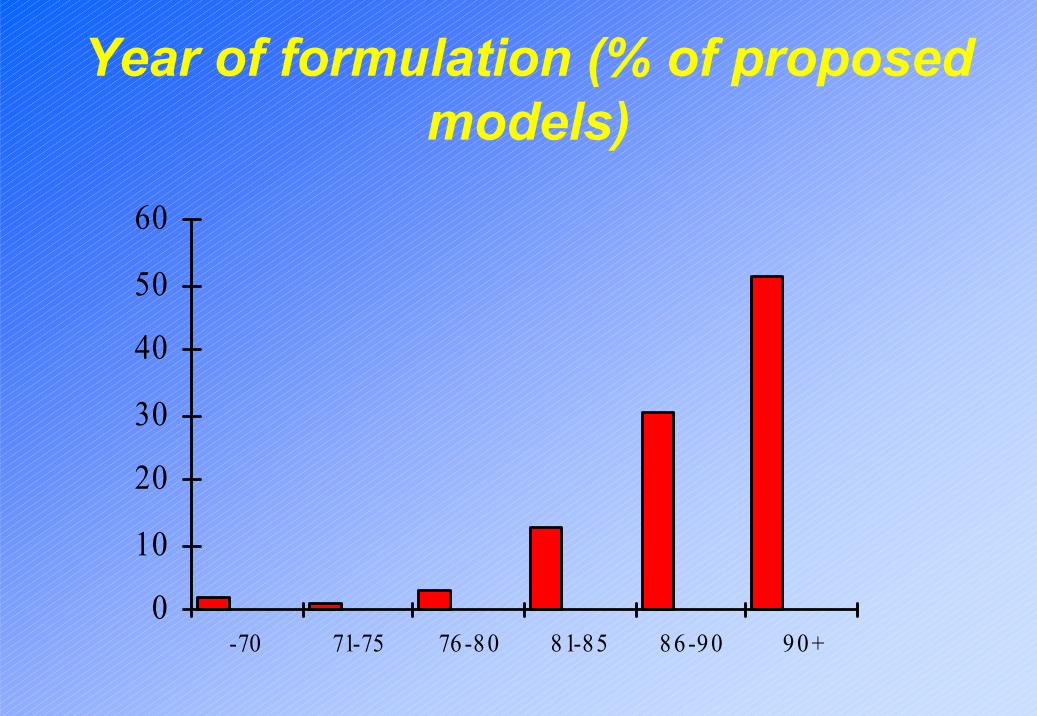
Year of formulation (% of proposed models)
0
10
20
30
40
50
60
-70 71-75 76 -8 0 8 1-85 8 6-9 0 9 0 +
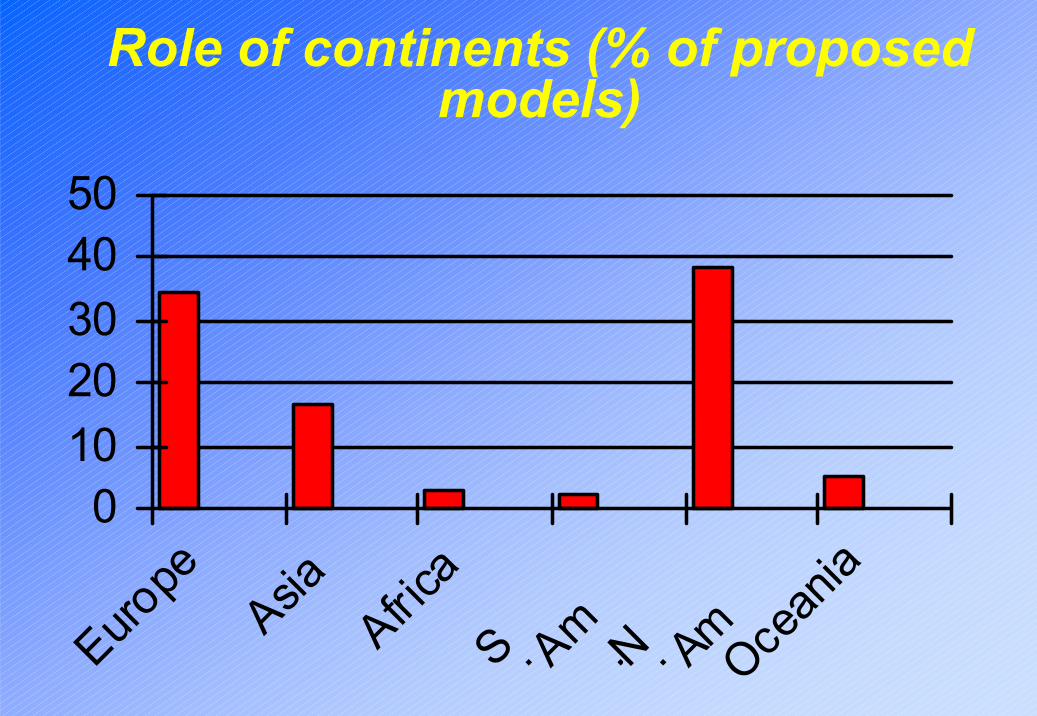
Role of continents (% of proposed models)
01020304050
Europe
AsiaAfric
aS . Am .N . Am .Oce
ania
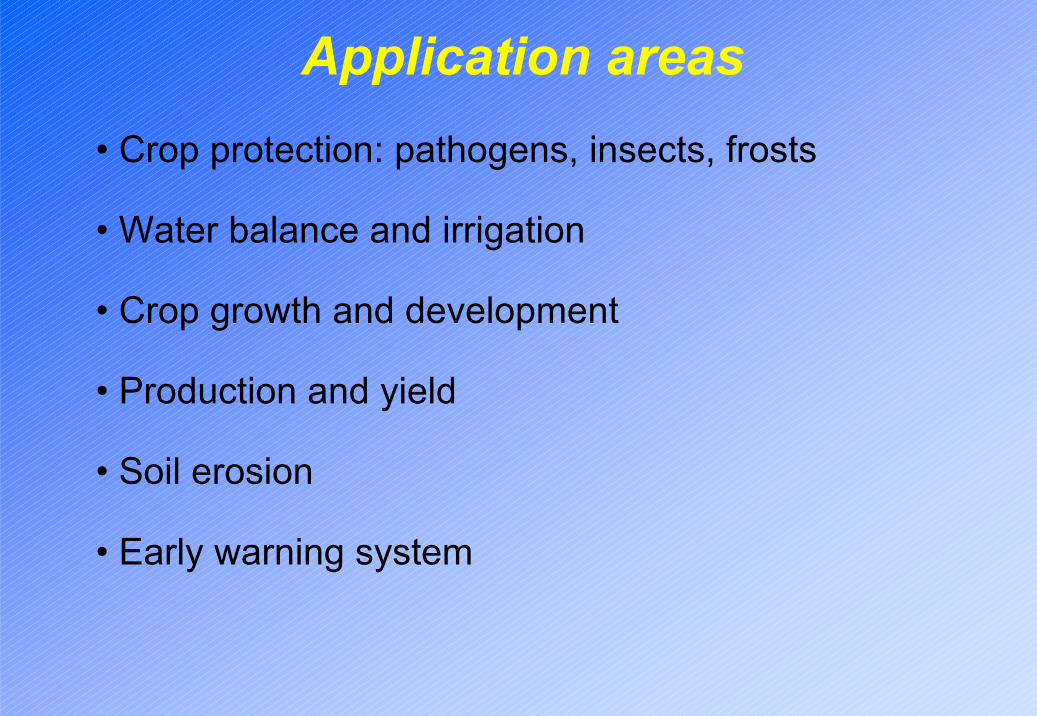
Application areas• Crop protection: pathogens, insects, frosts
• Water balance and irrigation
• Crop growth and development
• Production and yield
• Soil erosion
• Early warning system
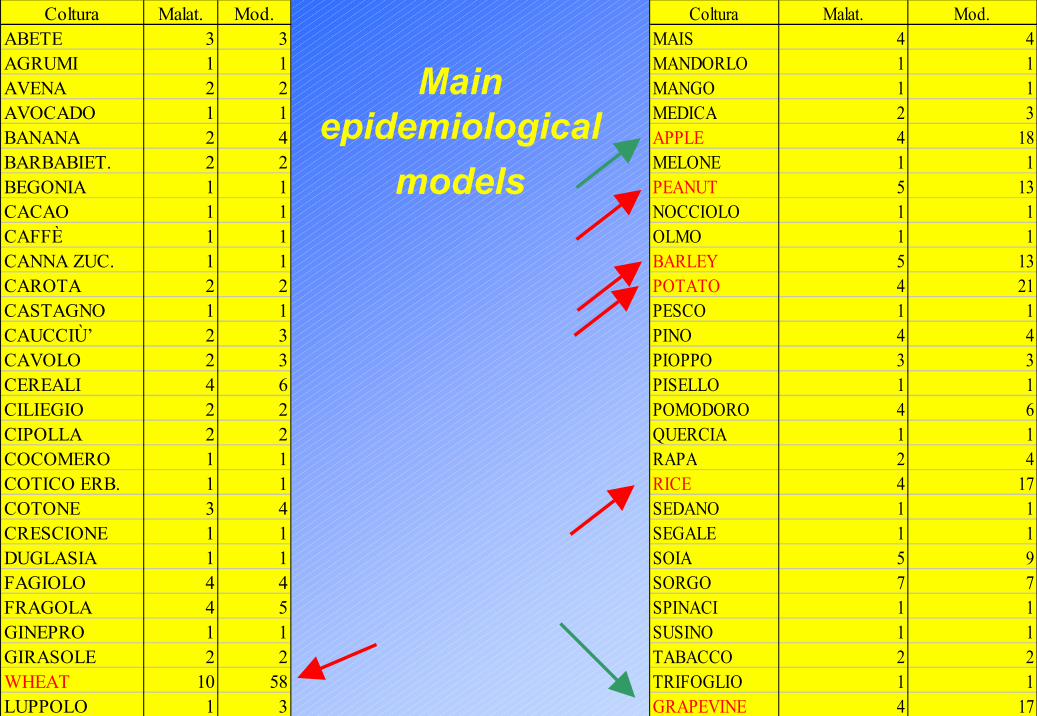
Main epidemiological
models
Coltura Malat. Mod.ABETE 3 3AGRUMI 1 1AVENA 2 2AVOCADO 1 1BANANA 2 4BARBABIET. 2 2BEGONIA 1 1CACAO 1 1CAFFÈ 1 1CANNA ZUC. 1 1CAROTA 2 2CASTAGNO 1 1CAUCCIÙ’ 2 3CAVOLO 2 3CEREALI 4 6CILIEGIO 2 2CIPOLLA 2 2COCOMERO 1 1COTICO ERB. 1 1COTONE 3 4CRESCIONE 1 1DUGLASIA 1 1FAGIOLO 4 4FRAGOLA 4 5GINEPRO 1 1GIRASOLE 2 2WHEAT 10 58LUPPOLO 1 3
Coltura Malat. Mod.MAIS 4 4MANDORLO 1 1MANGO 1 1MEDICA 2 3APPLE 4 18MELONE 1 1PEANUT 5 13NOCCIOLO 1 1OLMO 1 1BARLEY 5 13POTATO 4 21PESCO 1 1PINO 4 4PIOPPO 3 3PISELLO 1 1POMODORO 4 6QUERCIA 1 1RAPA 2 4RICE 4 17SEDANO 1 1SEGALE 1 1SOIA 5 9SORGO 7 7SPINACI 1 1SUSINO 1 1TABACCO 2 2TRIFOGLIO 1 1GRAPEVINE 4 17
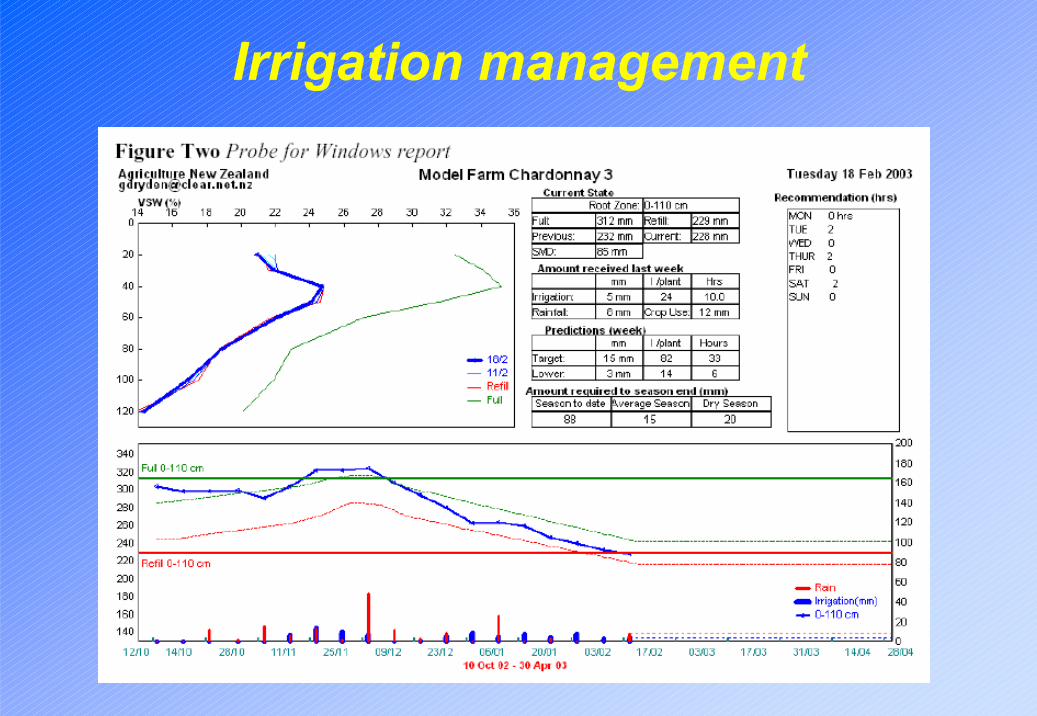
Irrigation management
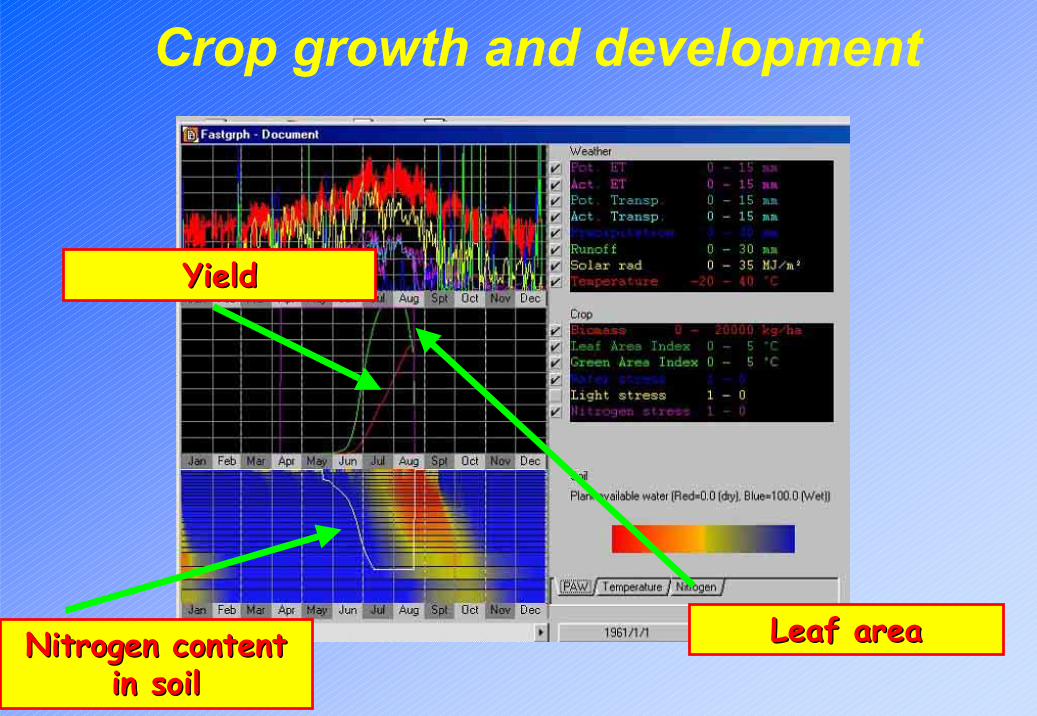
Crop growth and development
YieldYield
Leaf areaLeaf areaNitrogen content Nitrogen content in soilin soil
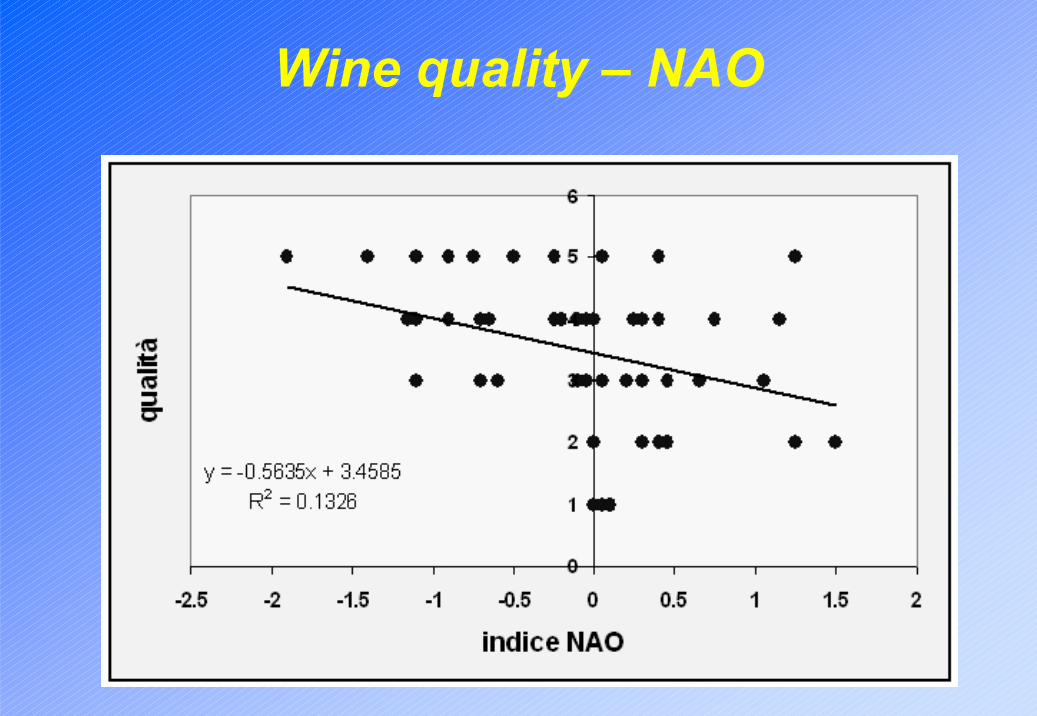
Wine quality – NAO
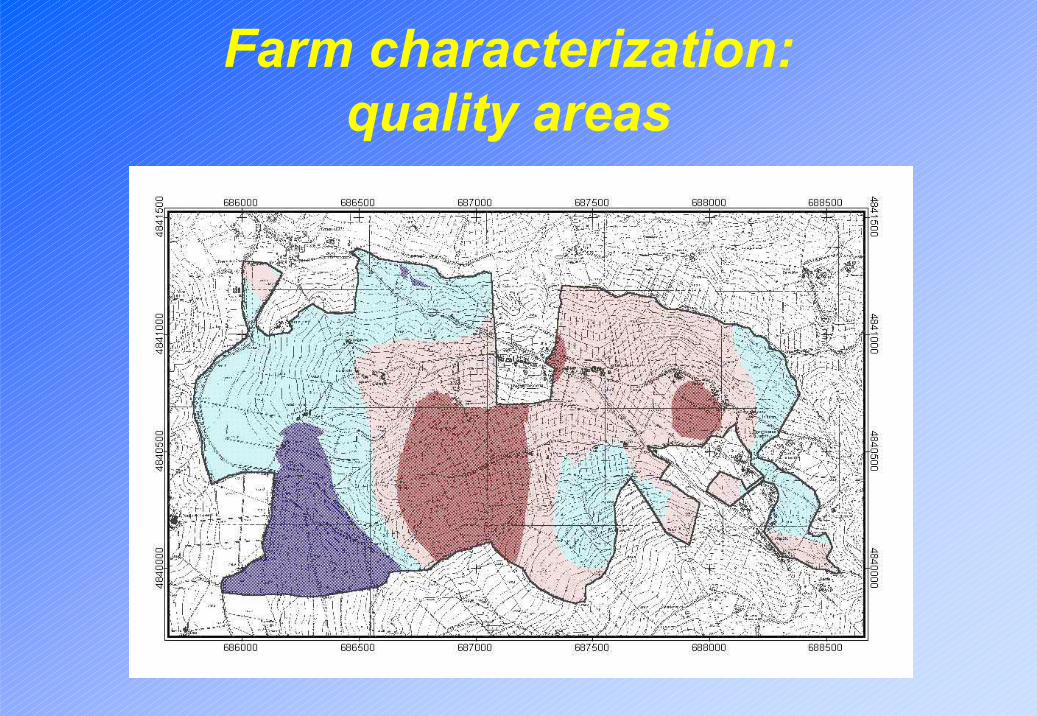
Farm characterization: quality areas
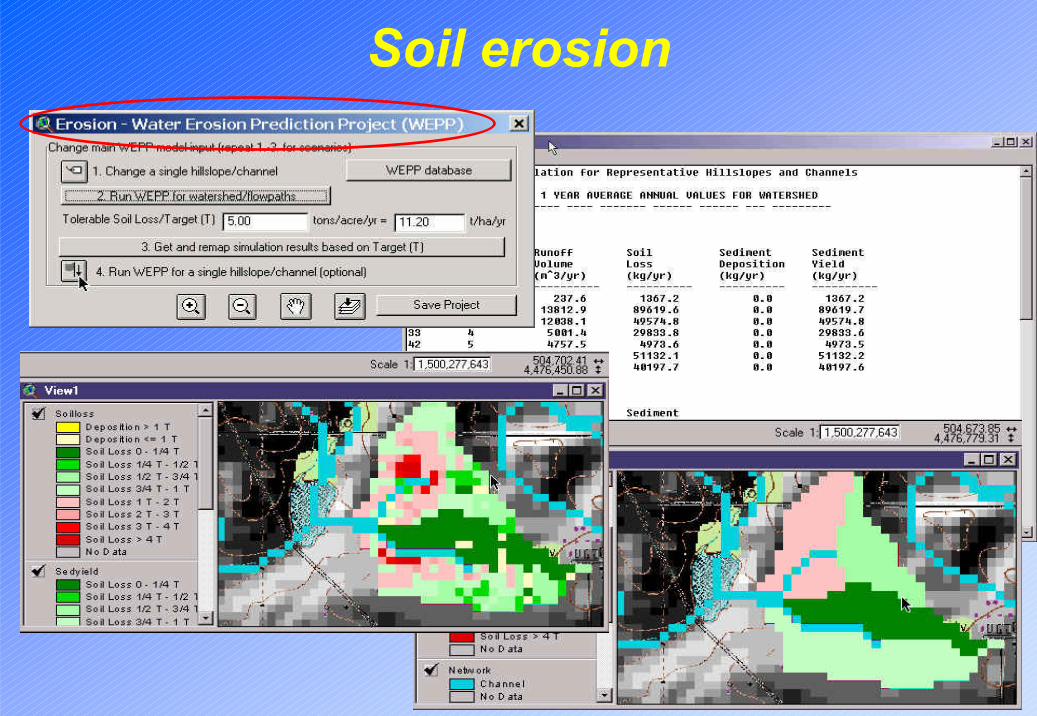
Soil erosion
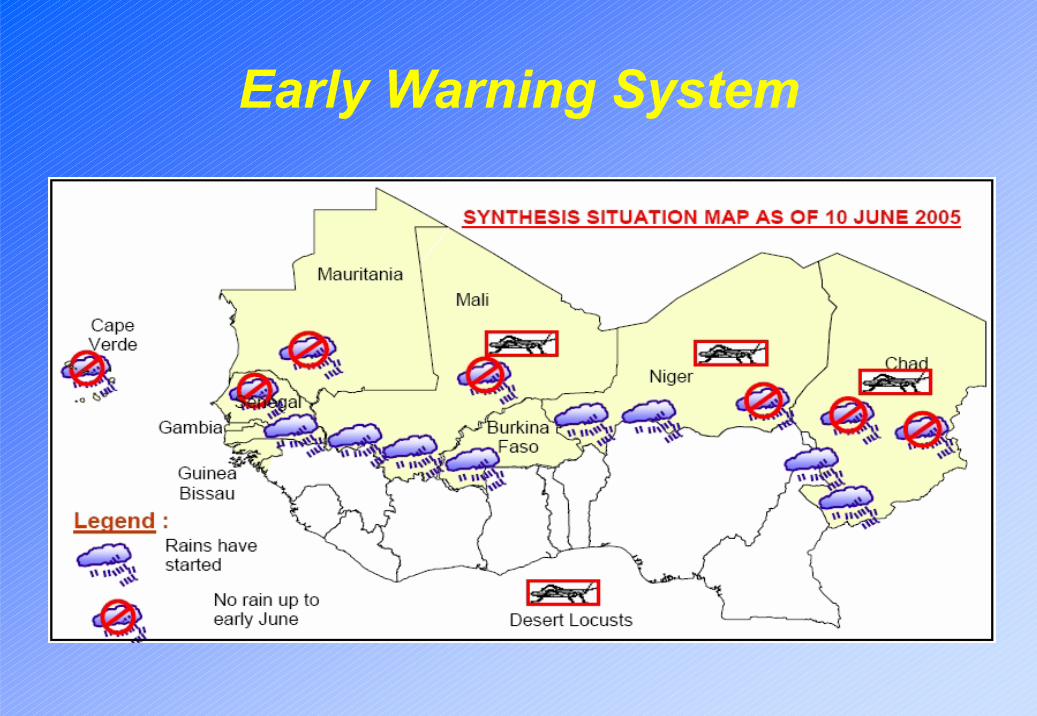
Early Warning System
Outline- State of the art
- Worldwide simulation models realisation and application areas
- Implementation of the model- Aims of application - Conditions of application- Required data- Constraints- Uncertainties- Advantages of application
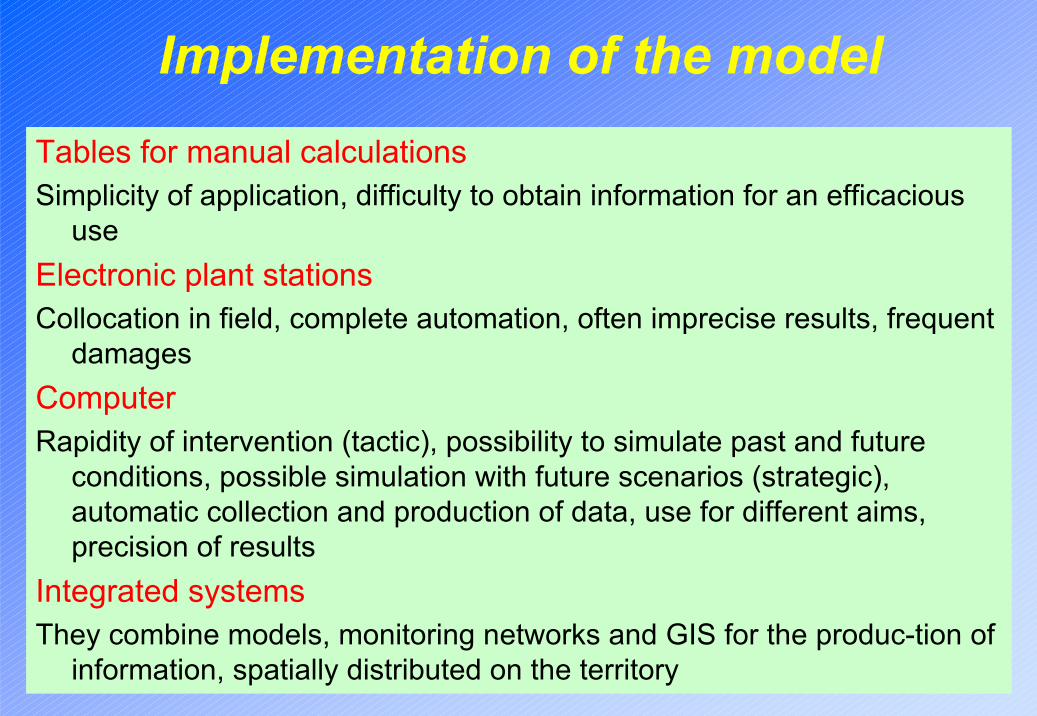
Tables for manual calculationsSimplicity of application, difficulty to obtain information for an efficacious
useElectronic plant stationsCollocation in field, complete automation, often imprecise results, frequent
damagesComputerRapidity of intervention (tactic), possibility to simulate past and future
conditions, possible simulation with future scenarios (strategic), automatic collection and production of data, use for different aims, precision of results
Integrated systemsThey combine models, monitoring networks and GIS for the produc-tion of
information, spatially distributed on the territory
Implementation of the model
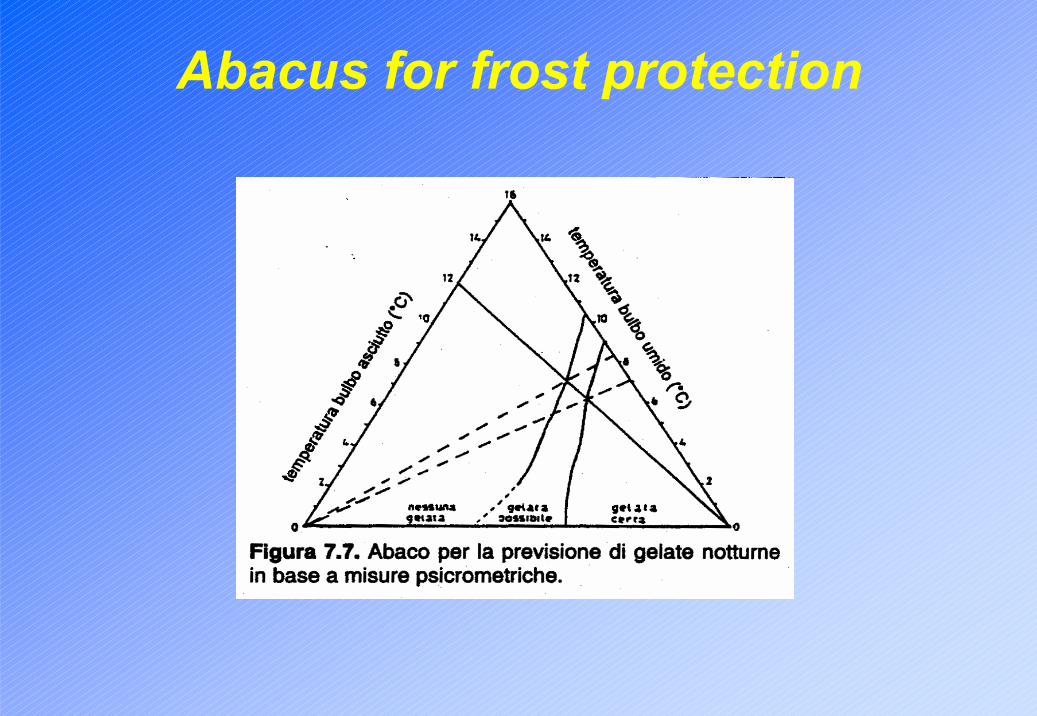
Abacus for frost protection
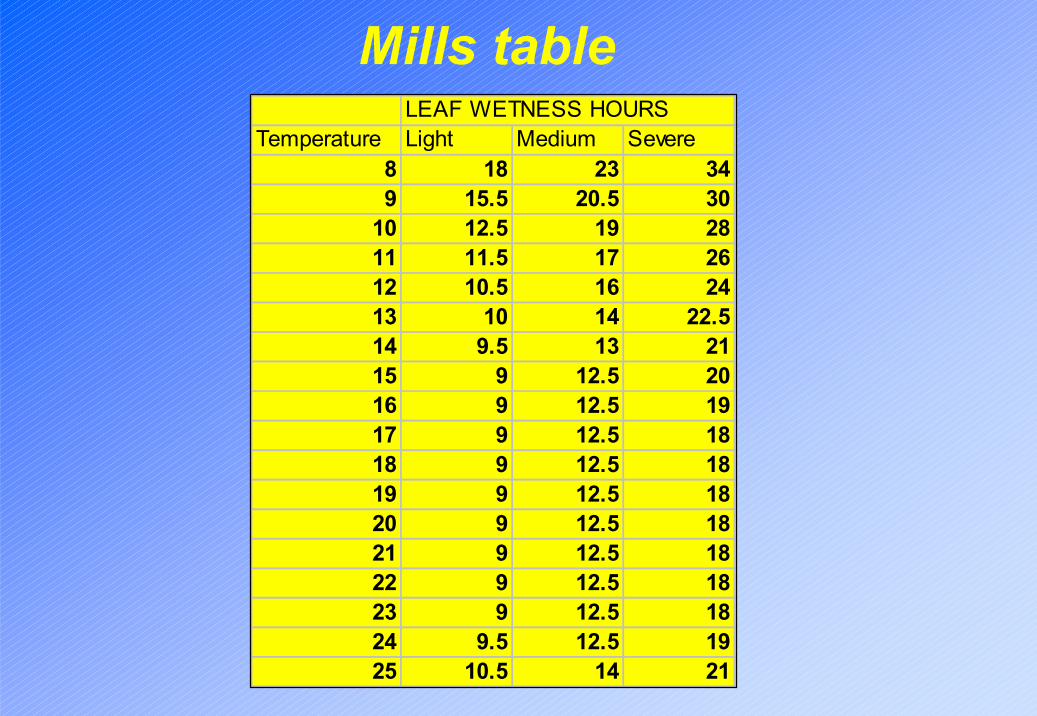
Mills tableLEAF WETNESS HOURS
Temperature Light Medium Severe8 18 23 349 15.5 20.5 30
10 12.5 19 2811 11.5 17 2612 10.5 16 2413 10 14 22.514 9.5 13 2115 9 12.5 2016 9 12.5 1917 9 12.5 1818 9 12.5 1819 9 12.5 1820 9 12.5 1821 9 12.5 1822 9 12.5 1823 9 12.5 1824 9.5 12.5 1925 10.5 14 21
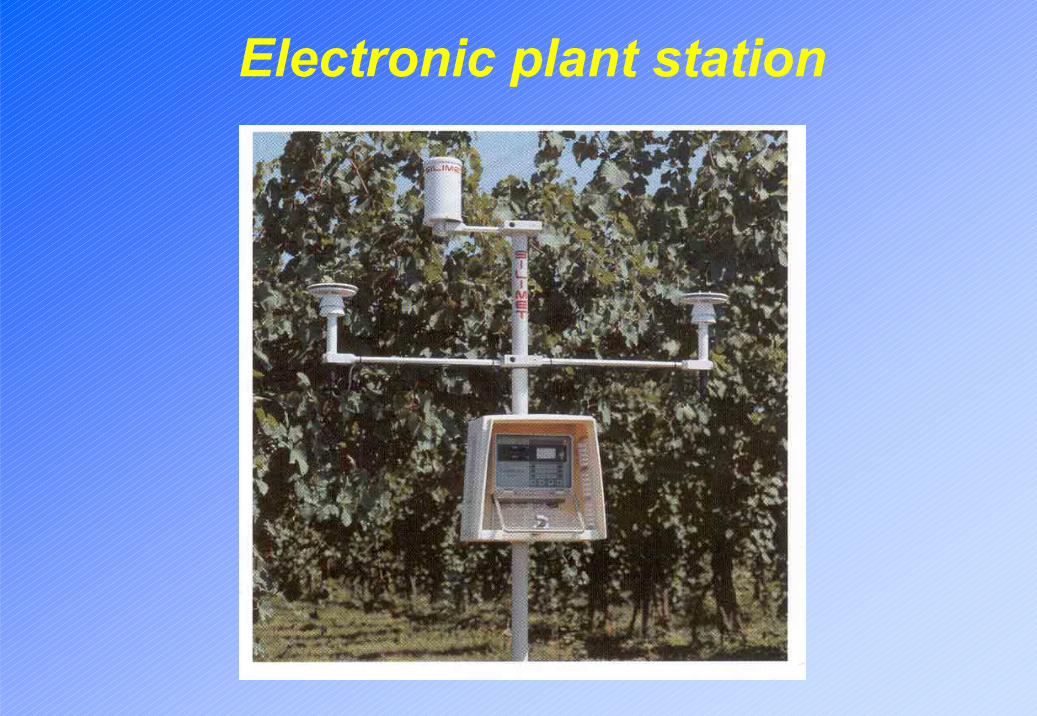
Electronic plant station
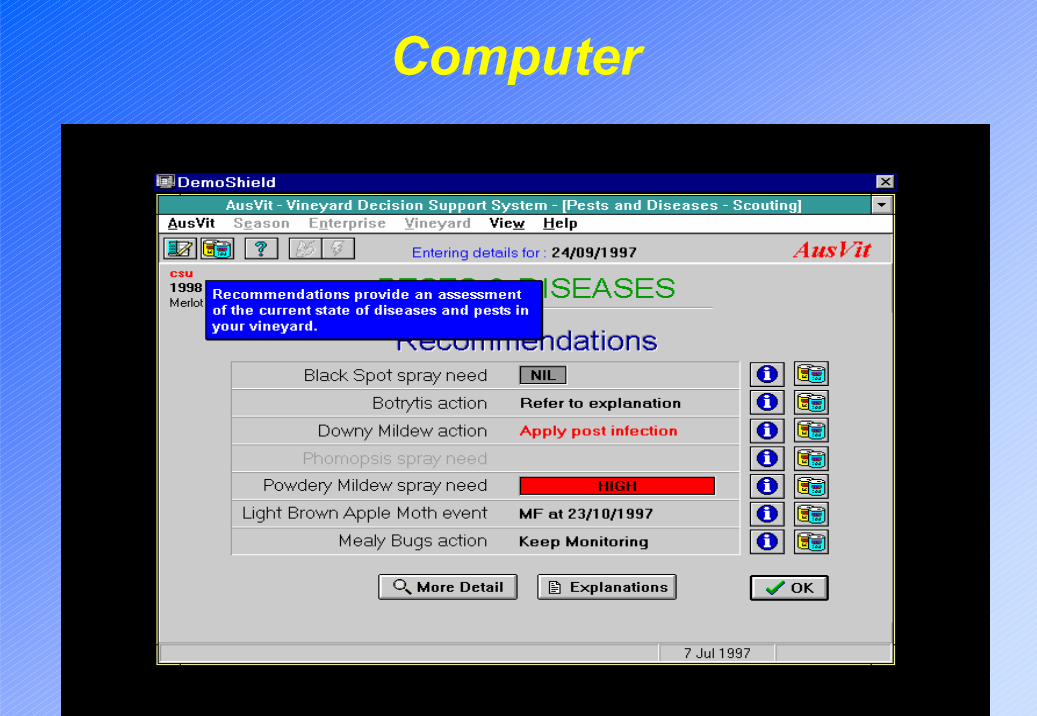
Computer
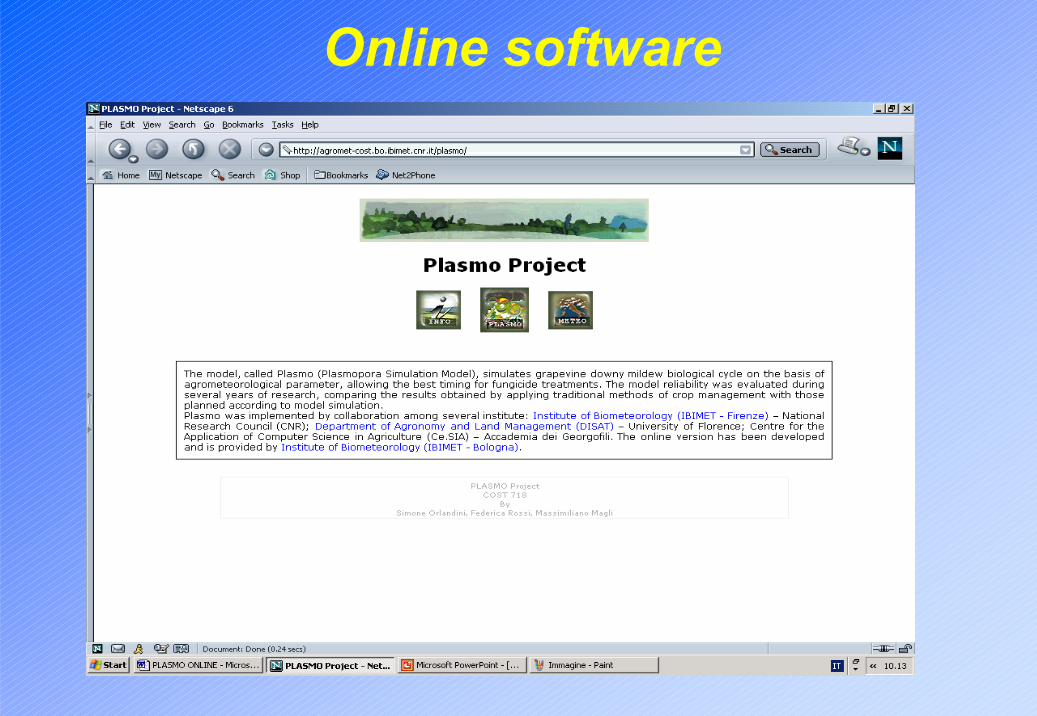
Online software
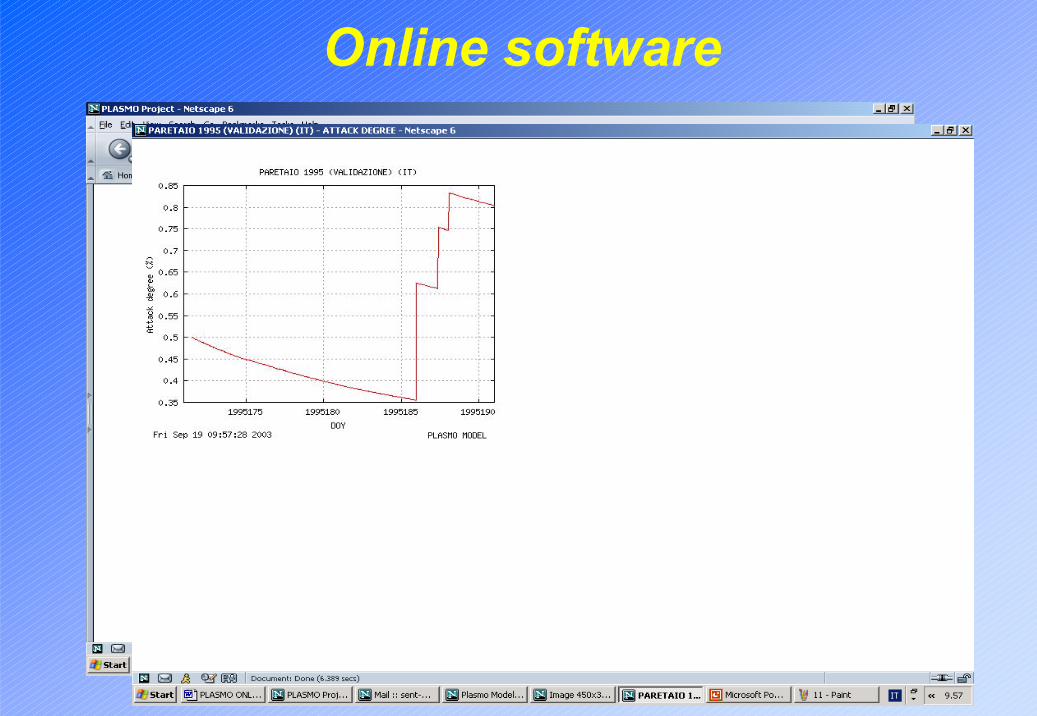
Online software
Integrated system
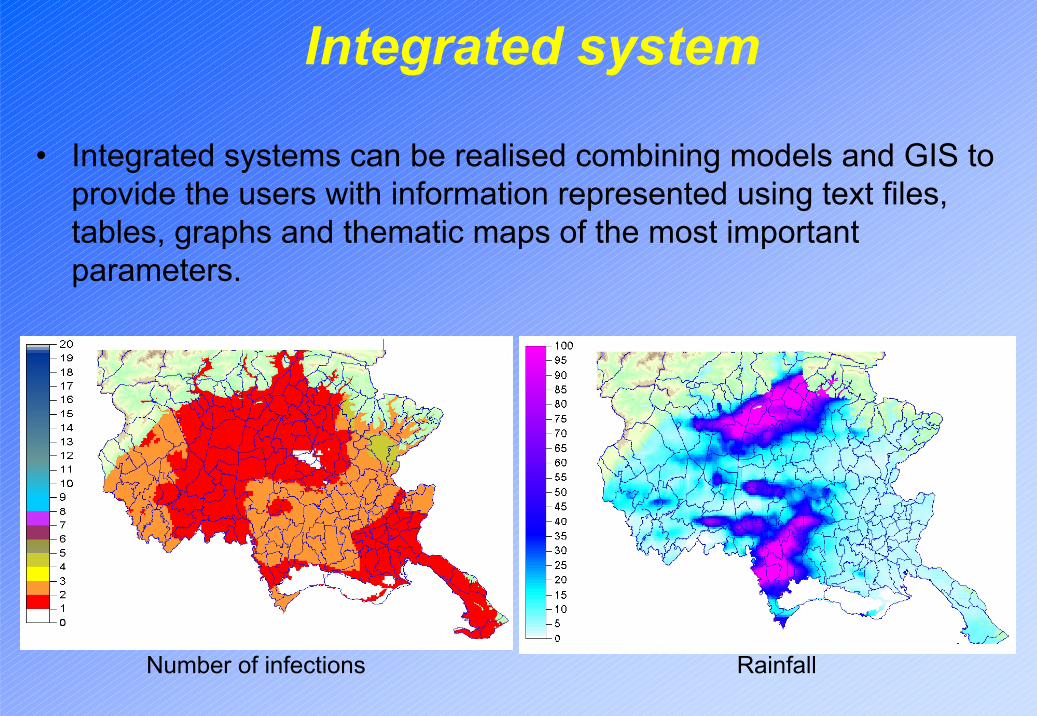
• Integrated systems can be realised combining models and GIS to provide the users with information represented using text files,tables, graphs and thematic maps of the most important parameters.
Number of infections Rainfall
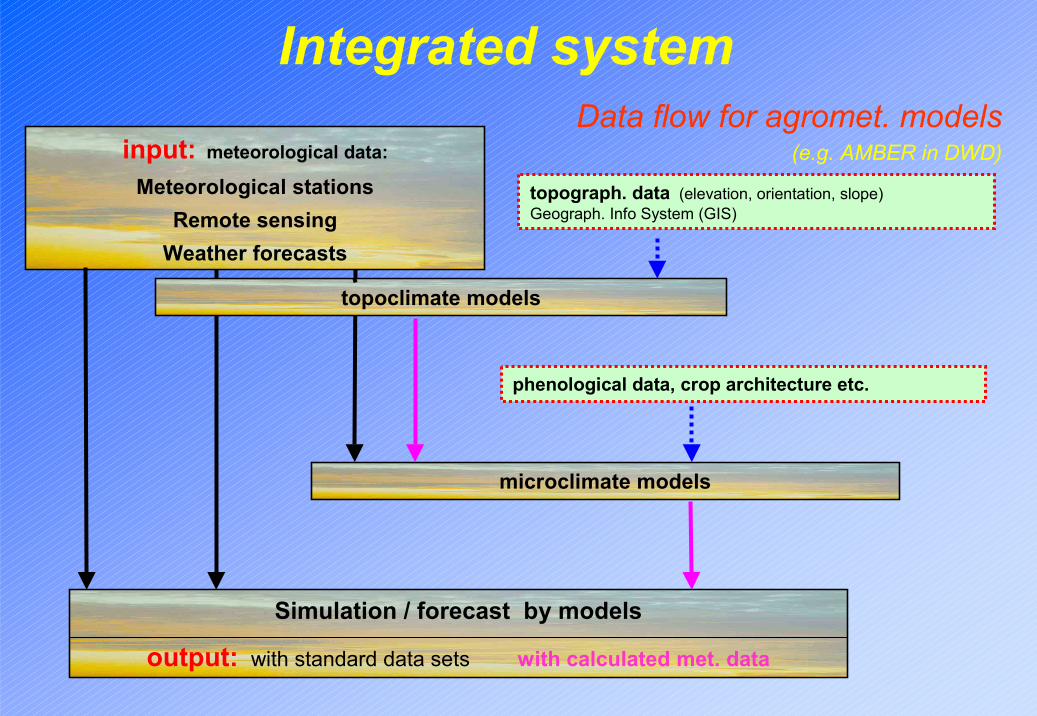
Integrated system
input: meteorological data:
Meteorological stationsRemote sensing
Weather forecasts
topograph. data (elevation, orientation, slope) Geograph. Info System (GIS)
topoclimate models
phenological data, crop architecture etc.
microclimate models
Simulation / forecast by models
output: with standard data sets with calculated met. data
Data flow for agromet. models(e.g. AMBER in DWD)
Outline- State of the art
- Worldwide simulation models realisation and application areas- Implementation of the model
- Aims of application- Conditions of application- Required data- Constraints- Uncertainties- Advantages of application
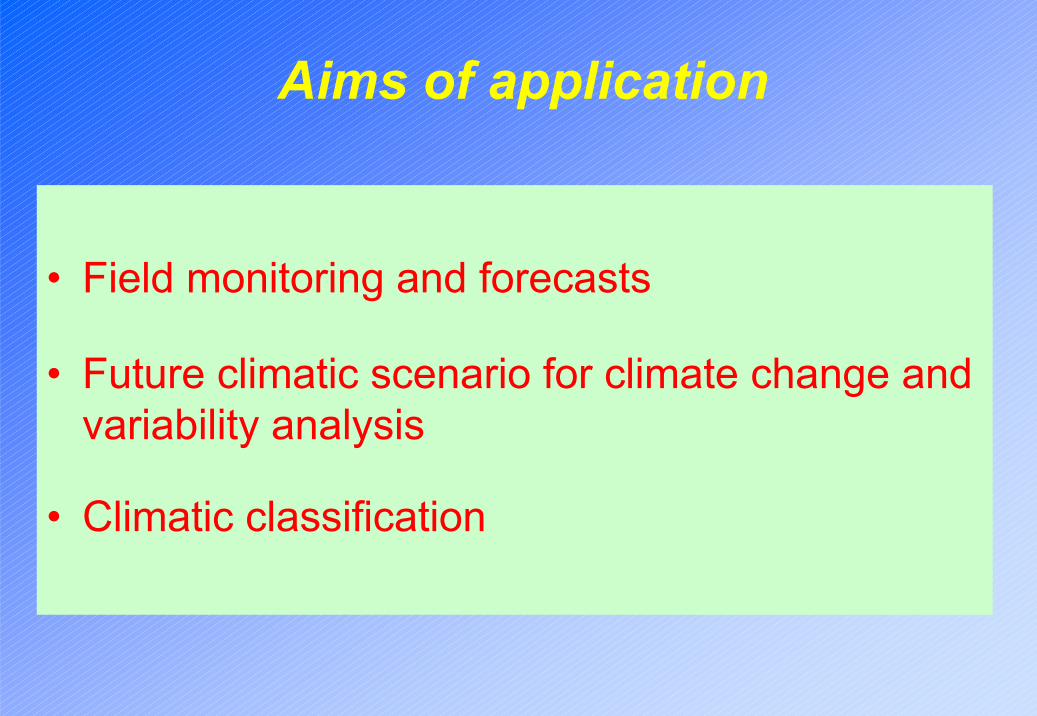
Aims of application
• Field monitoring and forecasts
• Future climatic scenario for climate change and variability analysis
• Climatic classification
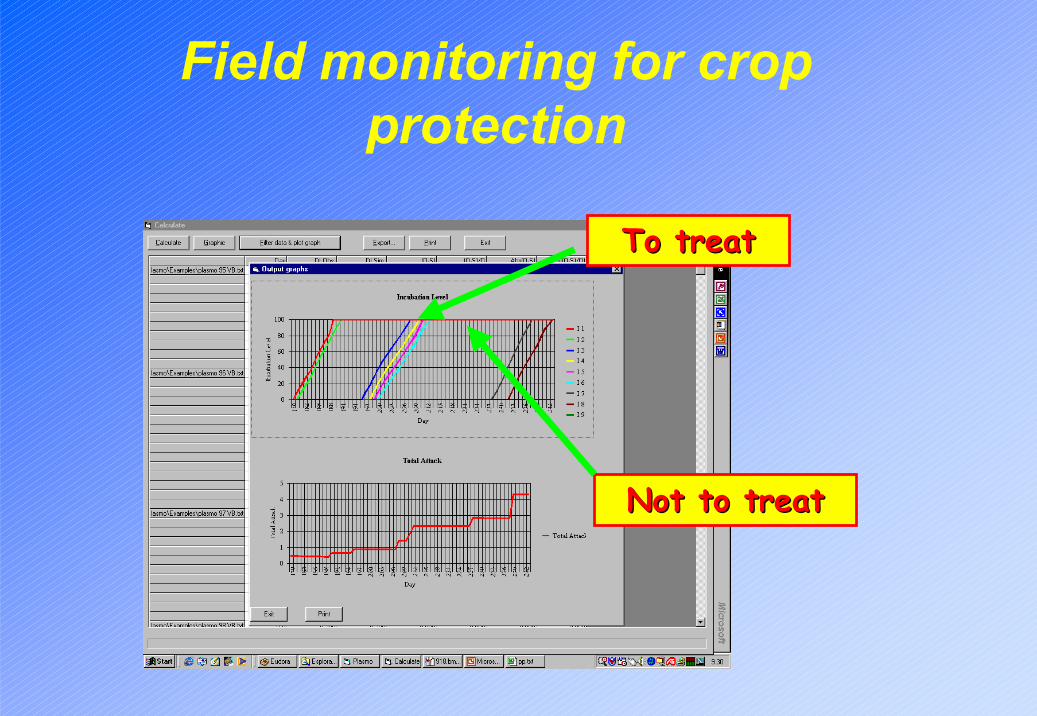
To treatTo treat
Not to treatNot to treat
Field monitoring for crop protection
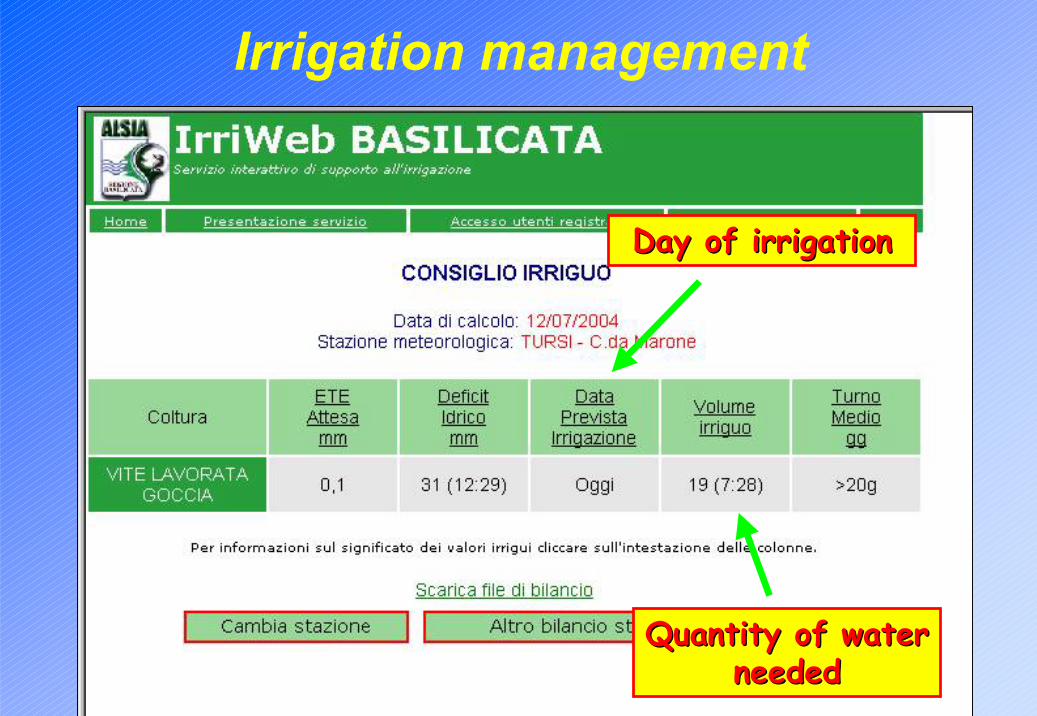
Day of irrigationDay of irrigation
Quantity of water Quantity of water neededneeded
Irrigation management
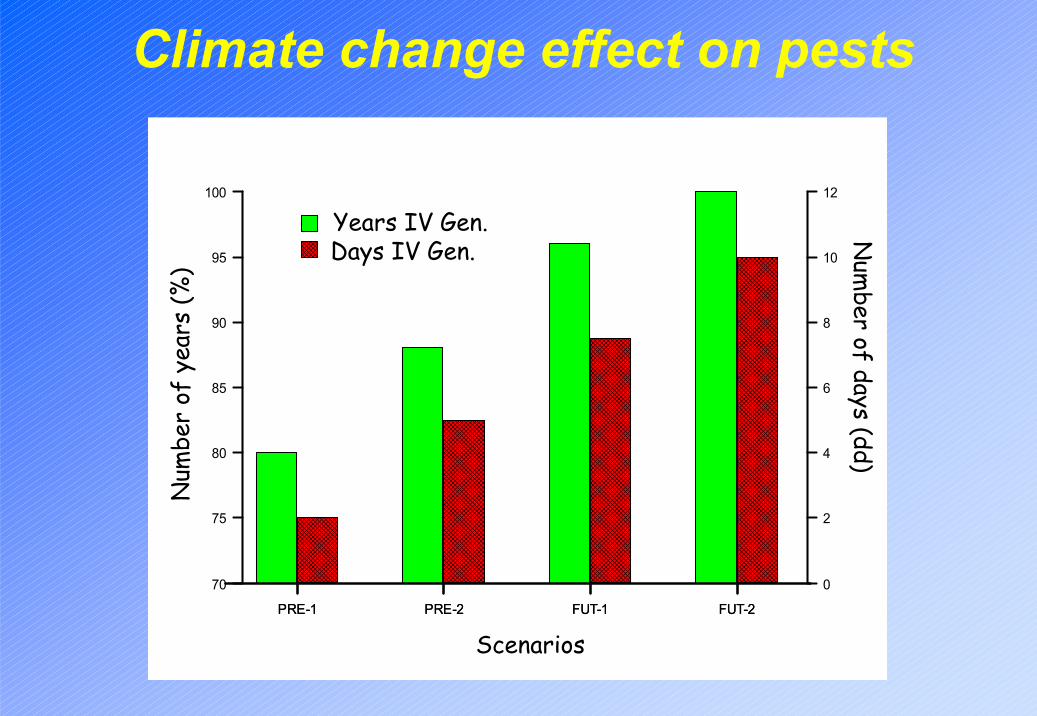
PRE-1 PRE-2 FUT-1 FUT-2
70
75
80
85
90
95
100
PRE-1 PRE-2 FUT-1 FUT-2
0
2
4
6
8
10
12
n
umer
o an
ni (%
)
Scenari
Anni IV Ge n. Giorni IV Gen.
num
ero
gior
ni (g
g)
Num
ber
of y
ears
(%)
Scenarios
Num
ber of days (dd)
Years IV Gen.Days IV Gen.
Climate change effect on pests
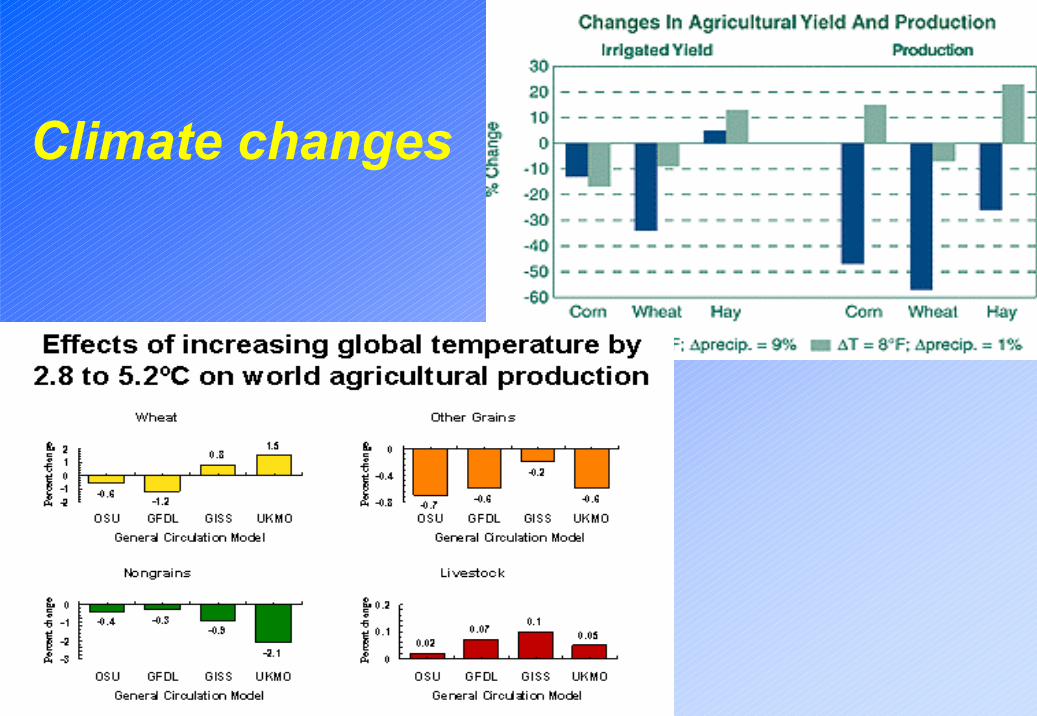
Climate changes
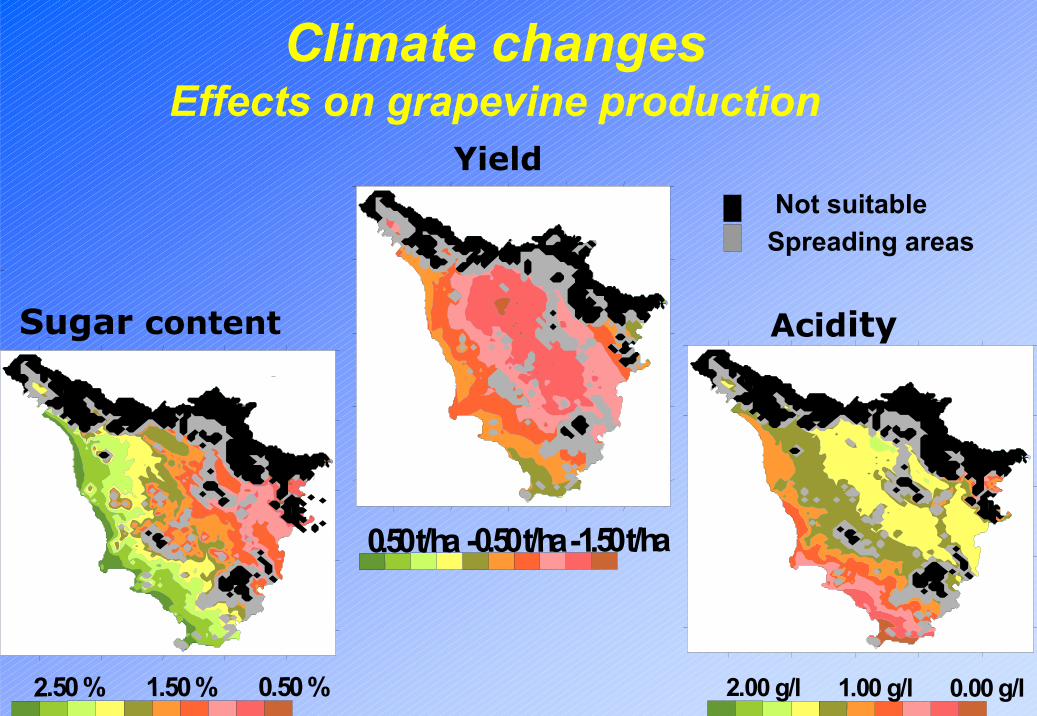
Not suitableSpreading areas
0.00 g/l1.00 g/l2.00 g/l
Acidity
0.50%1.50%2.50%
Sugar content
.
Yield
-1.50t/ha-0.50t/ha0.50t/ha
Climate changesEffects on grapevine production
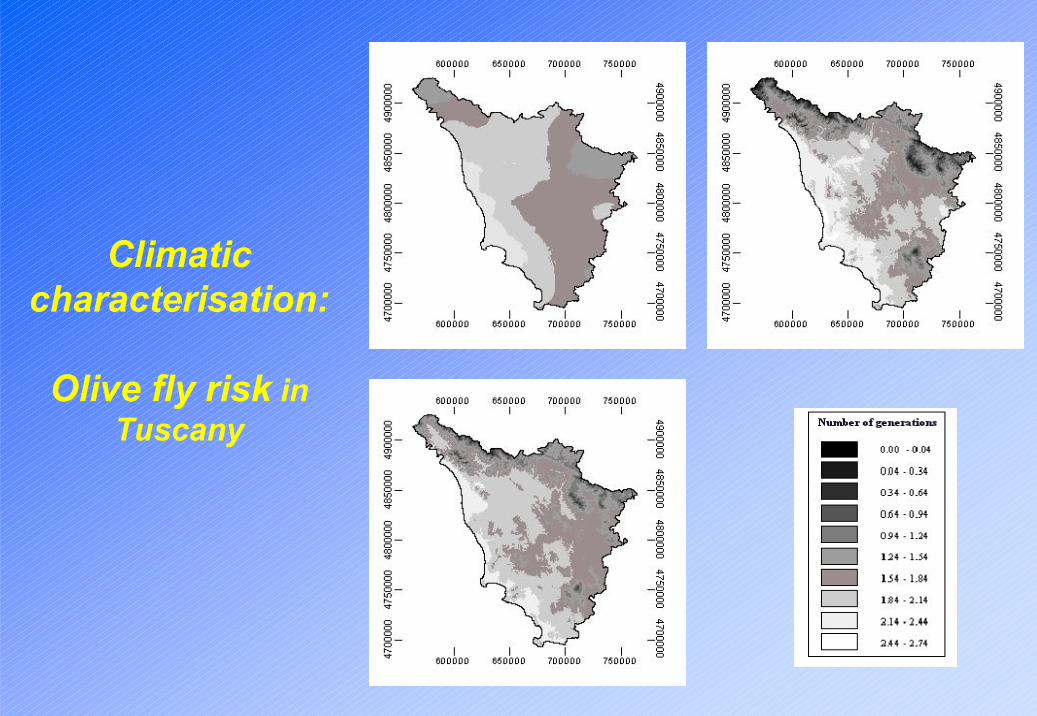
Climatic characterisation:
Olive fly risk in Tuscany
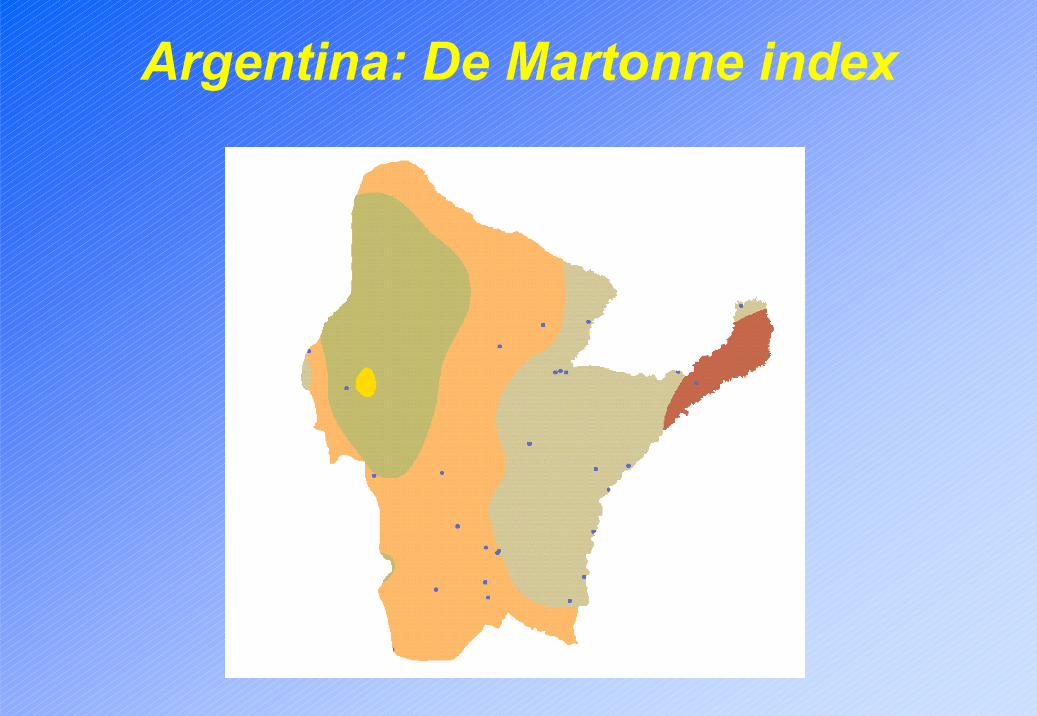
Argentina: De Martonne index
Outline- State of the art
- Worldwide simulation models realisation and application areas- Implementation of the model - Aims of application
- Conditions of application- Required data- Constraints- Uncertainties- Advantages of application
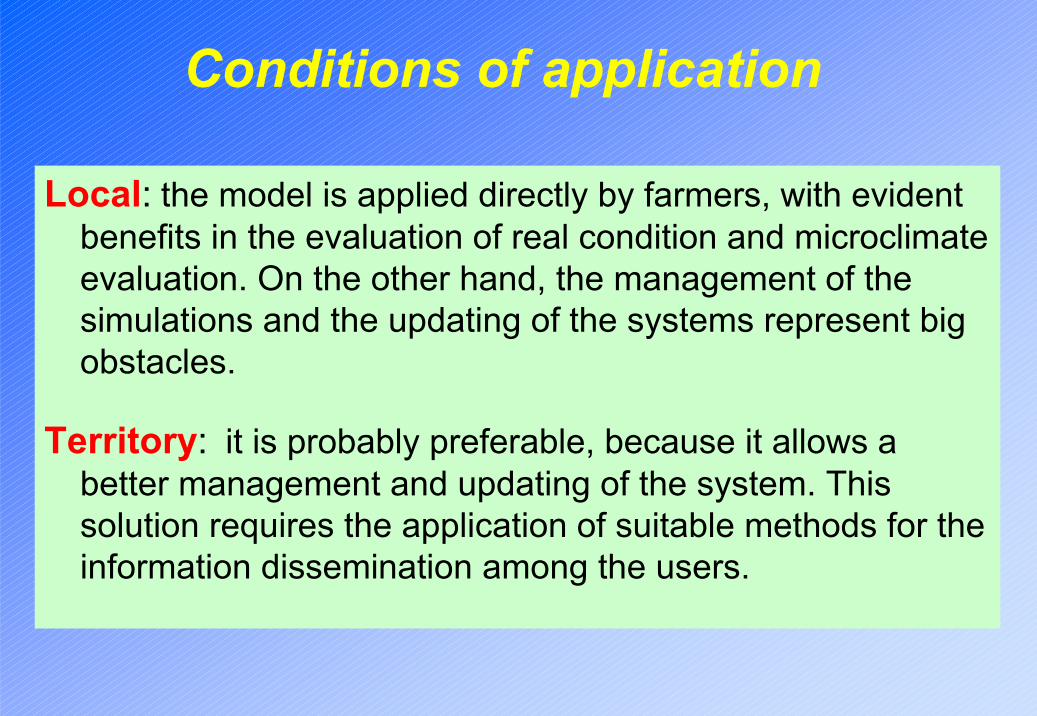
Conditions of application
Local: the model is applied directly by farmers, with evident benefits in the evaluation of real condition and microclimate evaluation. On the other hand, the management of the simulations and the updating of the systems represent big obstacles.
Territory: it is probably preferable, because it allows a better management and updating of the system. This solution requires the application of suitable methods for the information dissemination among the users.
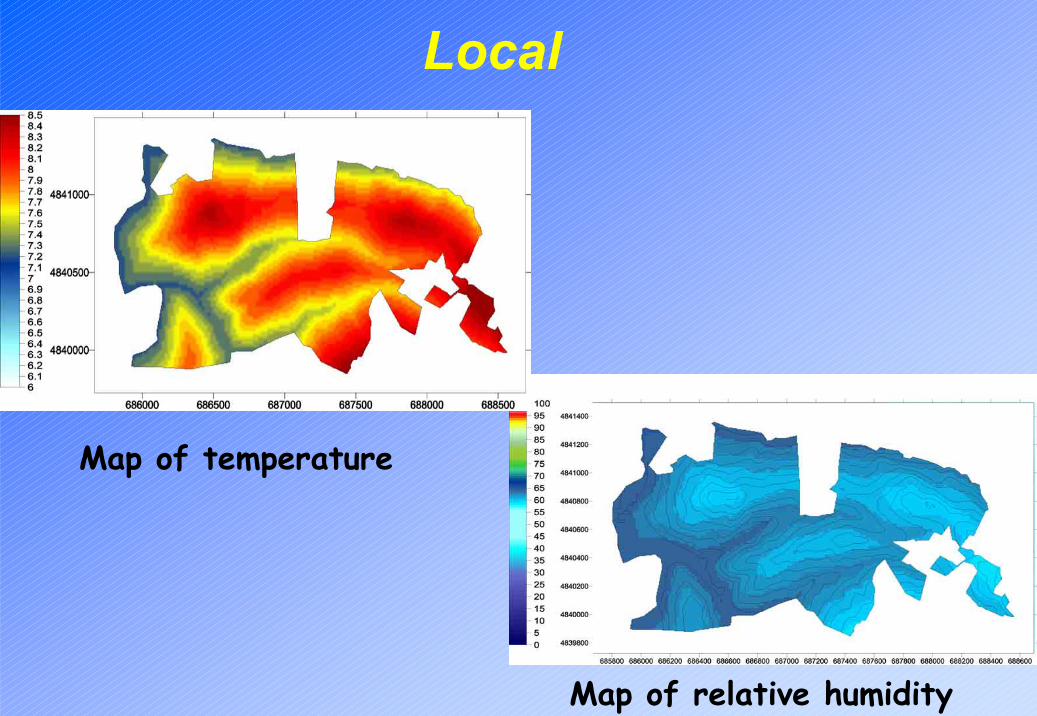
Map of relative humidity
Map of temperature
Local
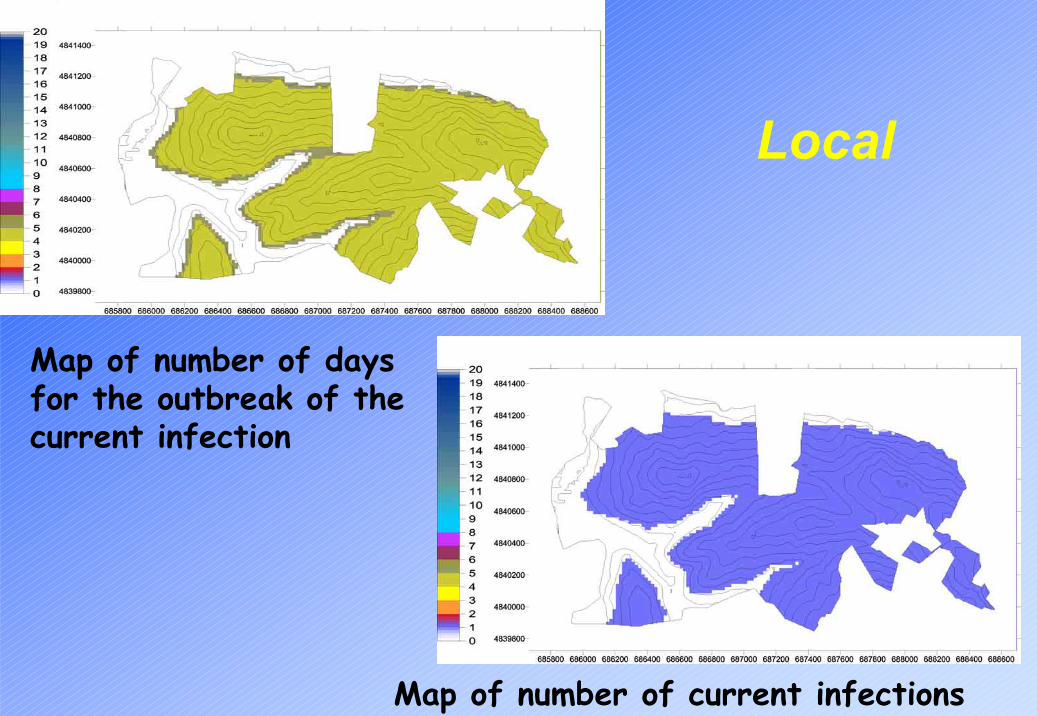
Map of number of current infections
Map of number of days for the outbreak of the current infection
Local
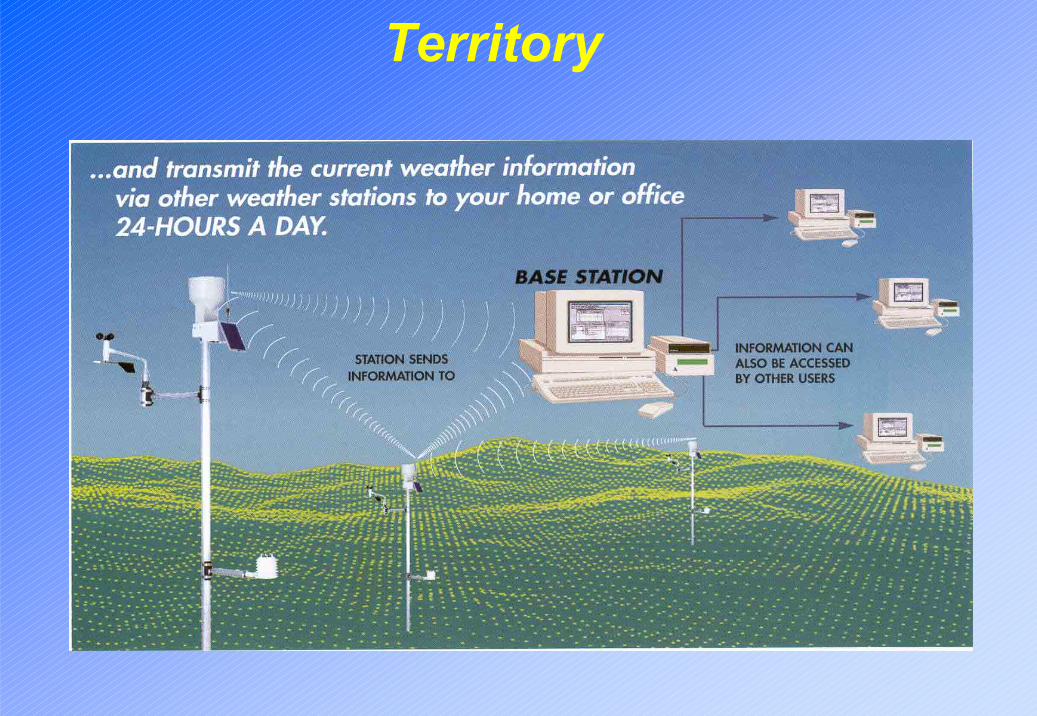
Territory
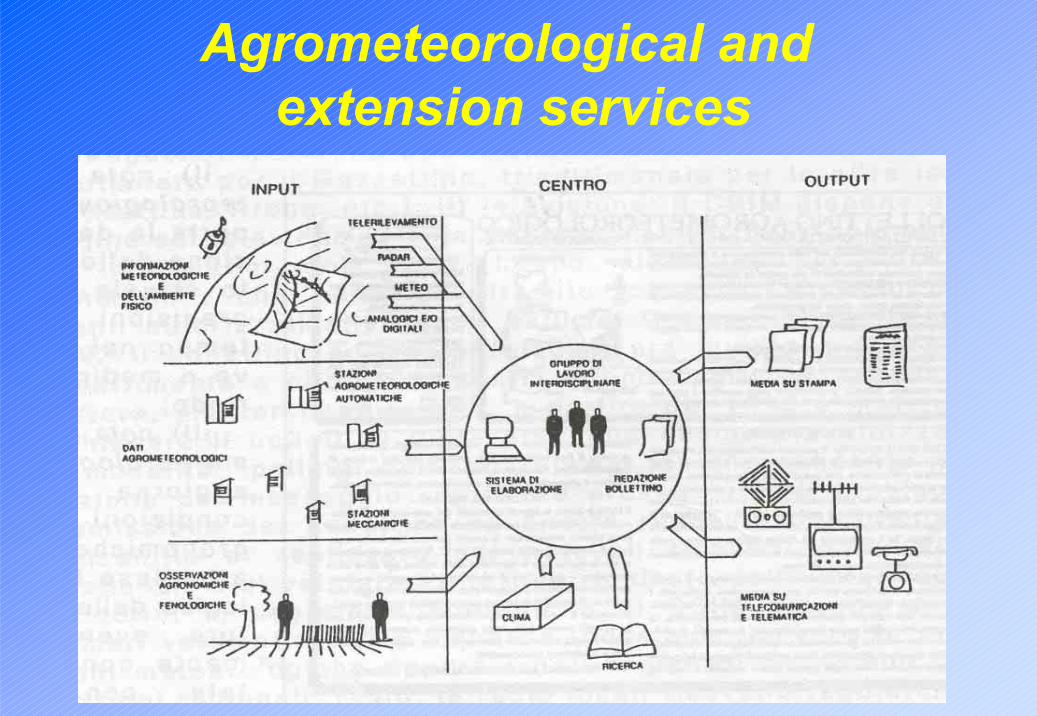
Agrometeorological and extension services
Information dissemination: the bulletins
• Advises and information to the users can be disseminated by using: personal contact, newspaper and magazines, radio and television, videotel, televideo, telefax, mail, phone, INTERNET, SMS.
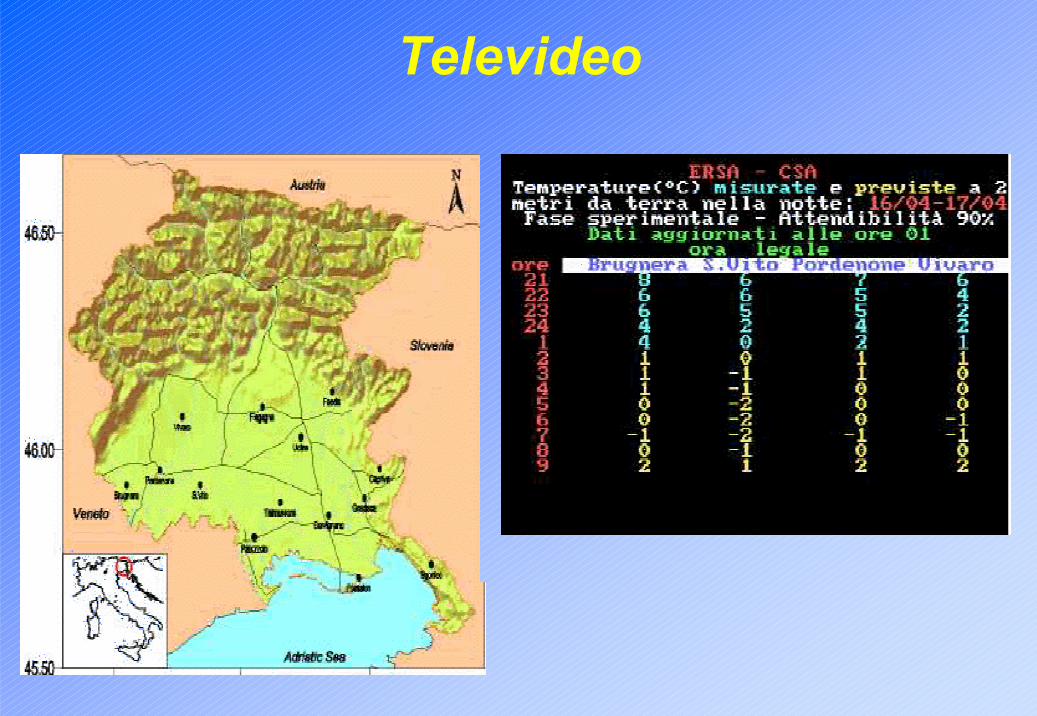
Televideo
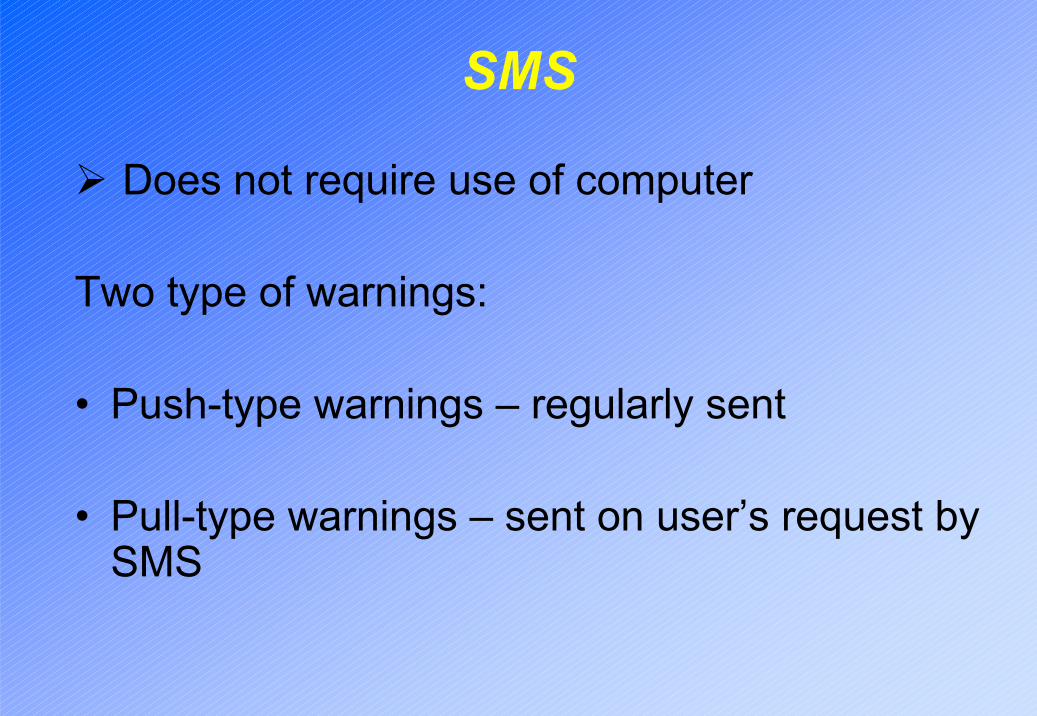
SMS
Does not require use of computer
Two type of warnings:
• Push-type warnings – regularly sent
• Pull-type warnings – sent on user’s request by SMS
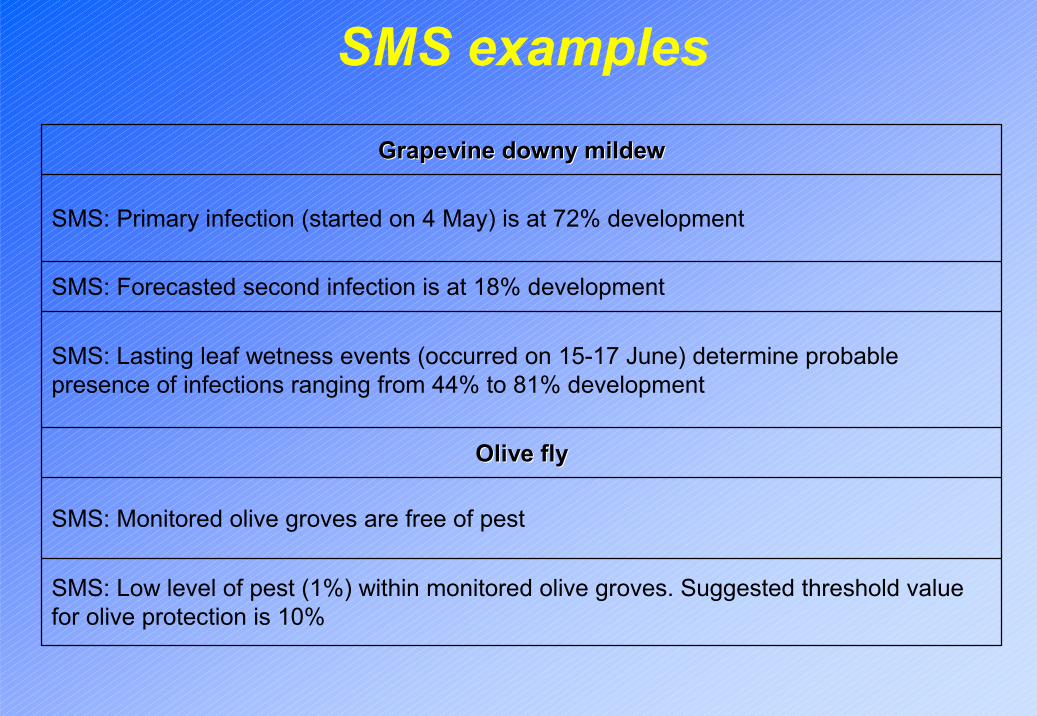
SMS: Low level of pest (1%) within monitored olive groves. Suggested threshold value for olive protection is 10%
SMS: Monitored olive groves are free of pest
Olive flyOlive fly
SMS: Lasting leaf wetness events (occurred on 15-17 June) determine probable presence of infections ranging from 44% to 81% development
SMS: Forecasted second infection is at 18% development
SMS: Primary infection (started on 4 May) is at 72% development
Grapevine downy mildewGrapevine downy mildew
SMS examples
o Fast dissemination and utilisation of informationo Interaction and feedback with the userso Immediate visualisation of informationo Easy comprehension of information and advises o Increase computer use by farmerso Cost reductiono Fast updating and improving of the systemo Control of system performingo Application of multimedia tools (texts, graphics, maps, figures,
audio, video, etc.)
Internet advantages
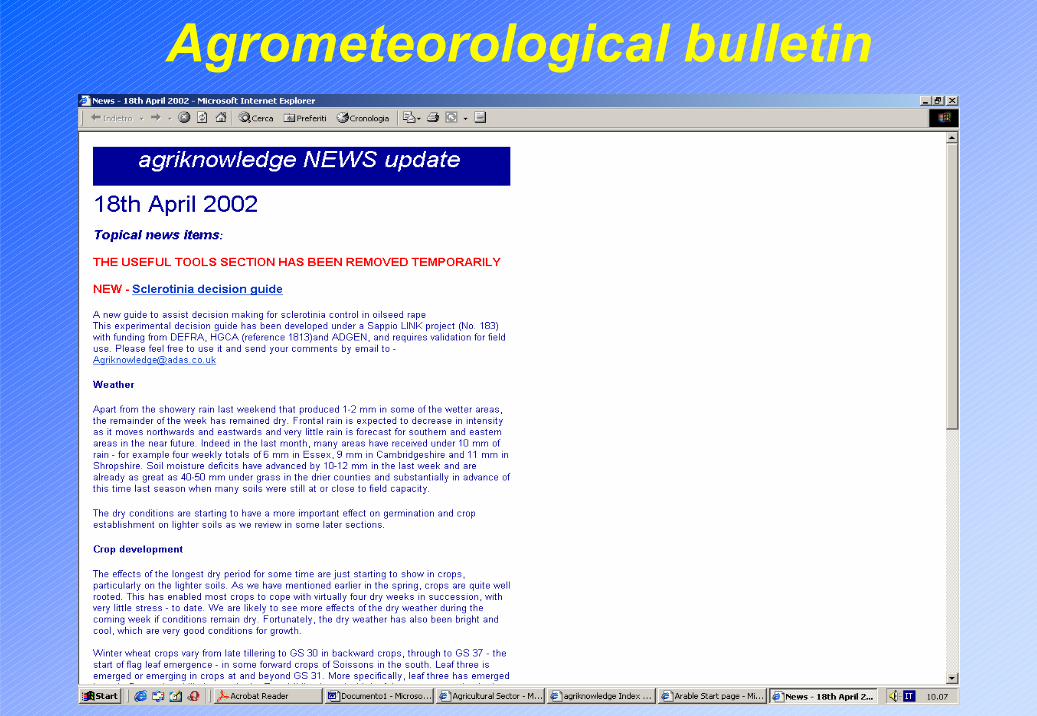
Agrometeorological bulletin
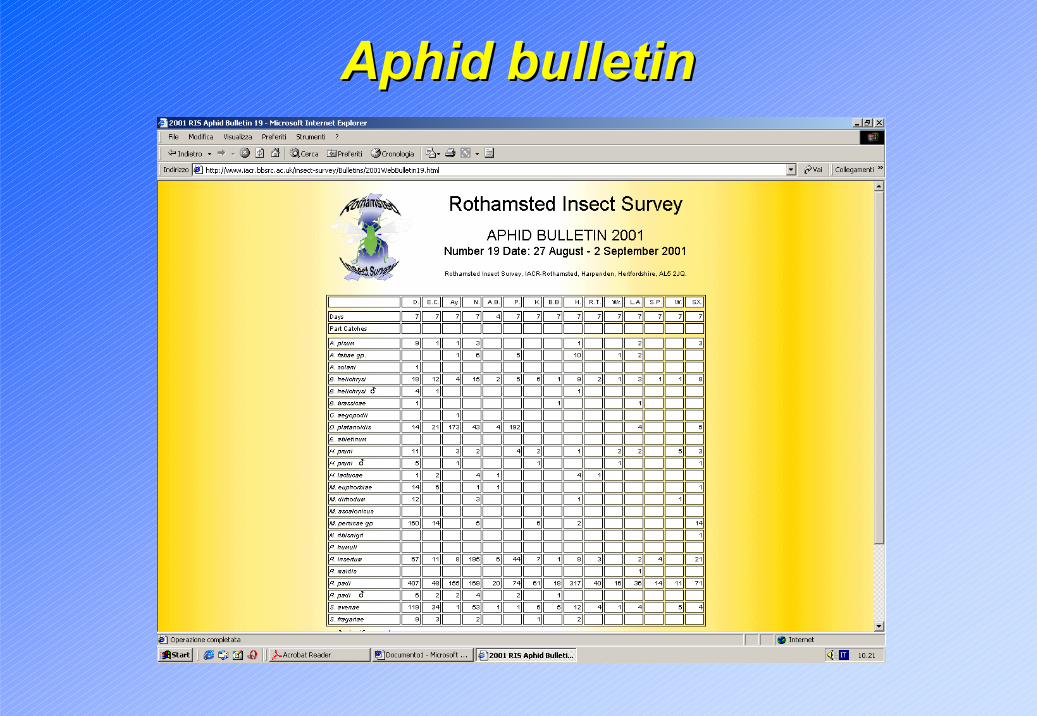
Aphid bulletin Aphid bulletin
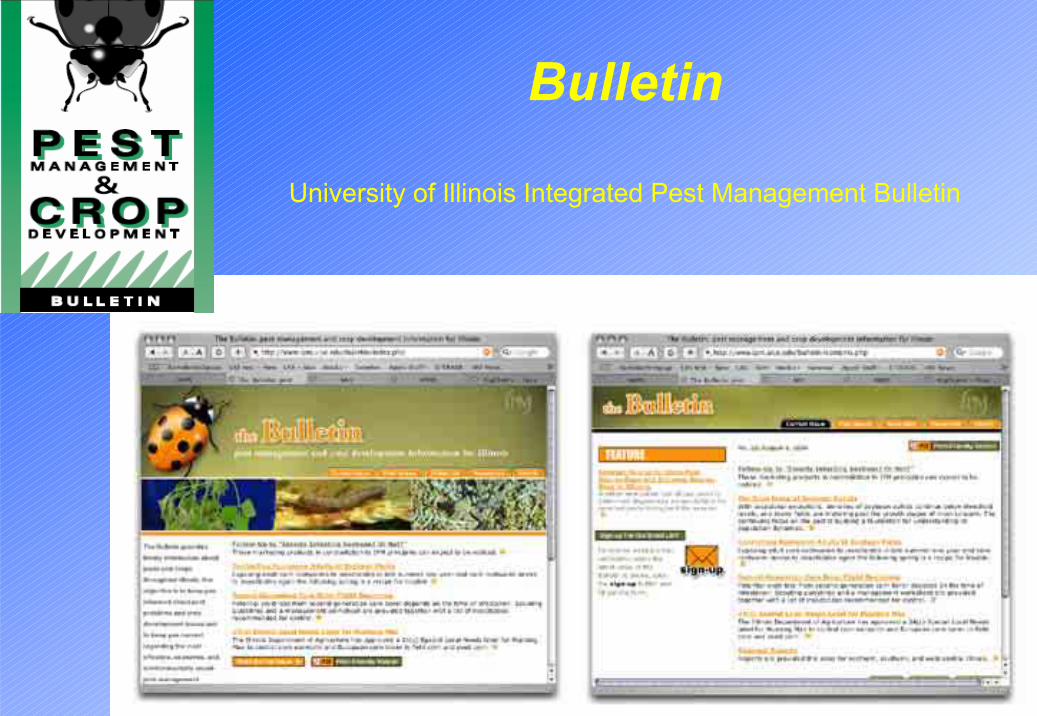
Bulletin
University of Illinois Integrated Pest Management Bulletin
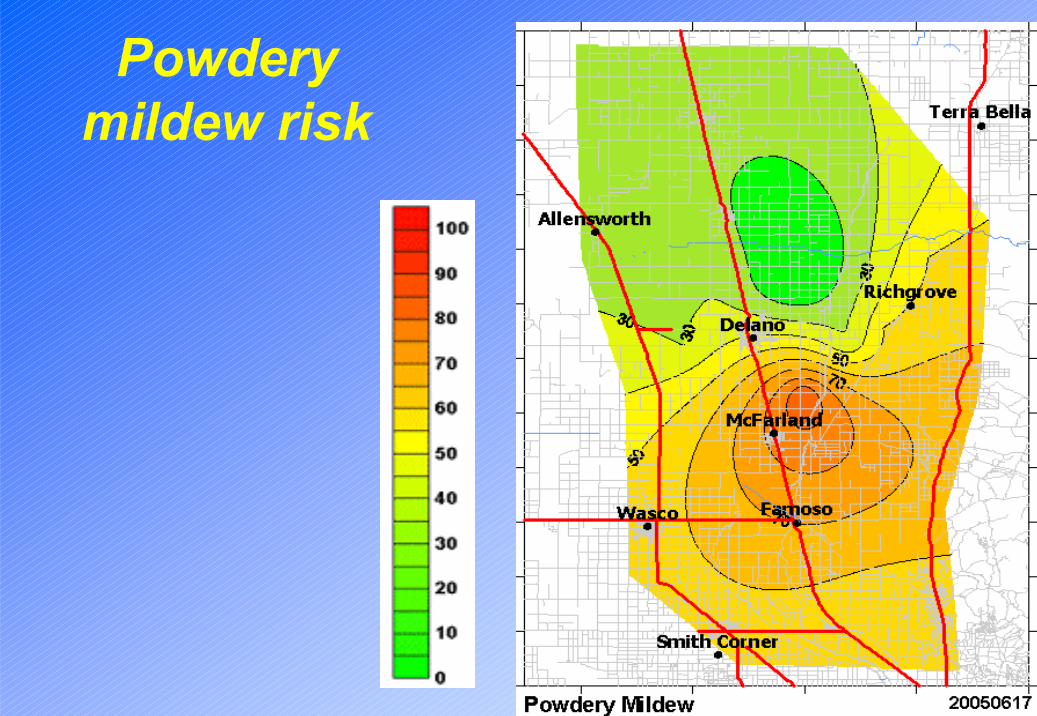
Powdery mildew risk


Outline- State of the art
- Worldwide simulation models realisation and application areas- Implementation of the model - Aims of application - Conditions of application
- Required data- Constraints- Uncertainties- Advantages of application
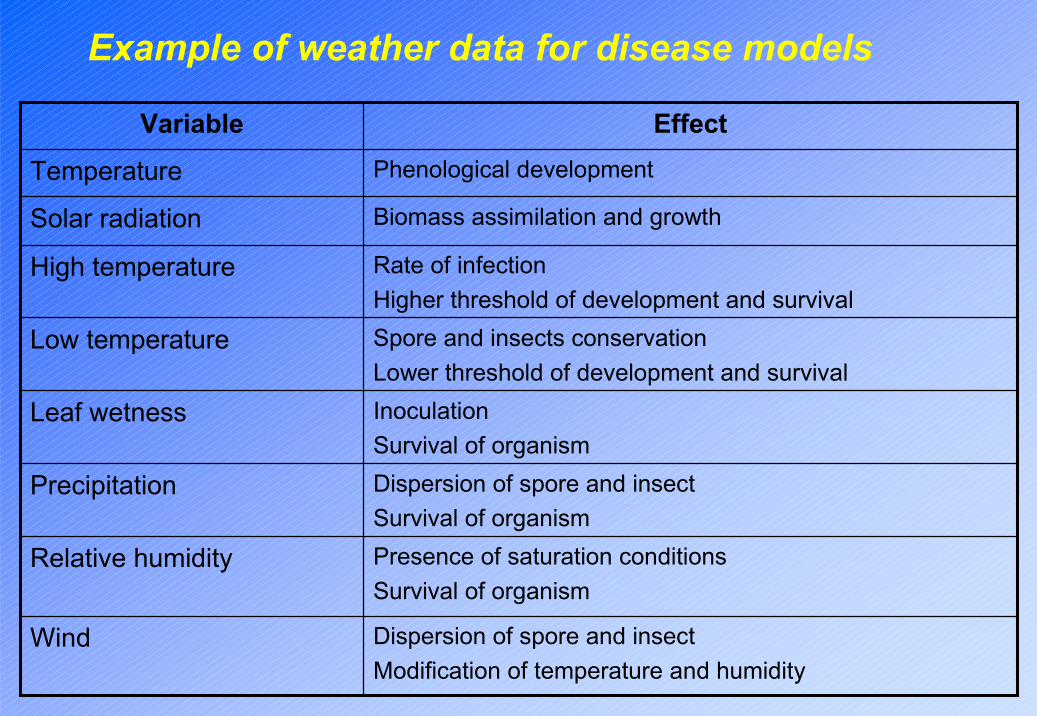
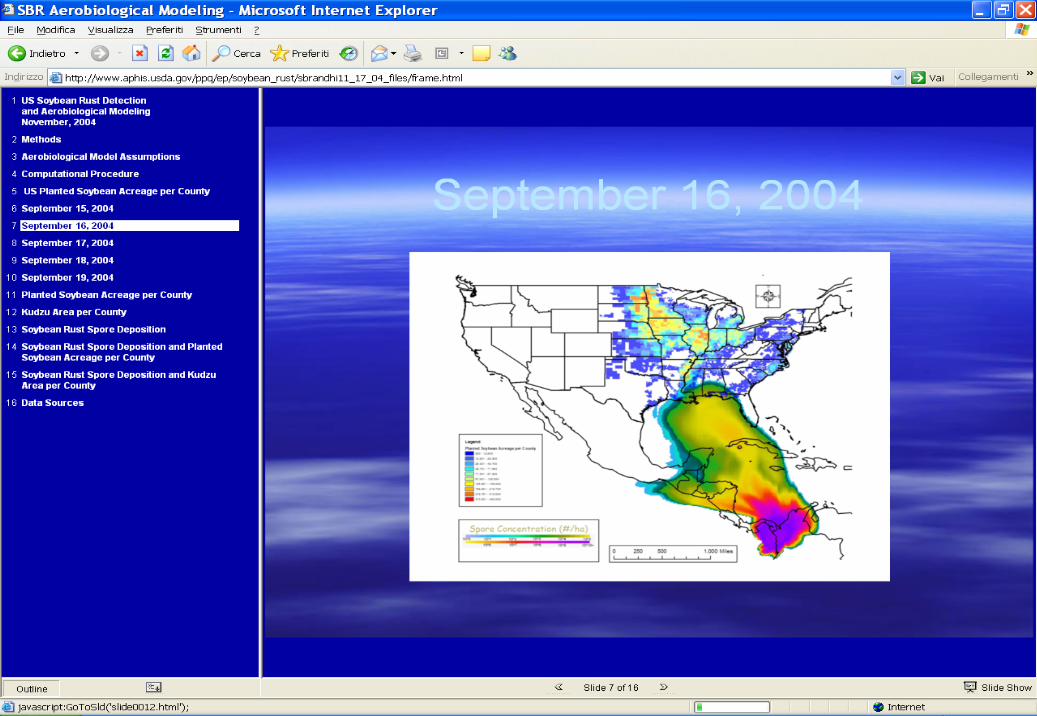
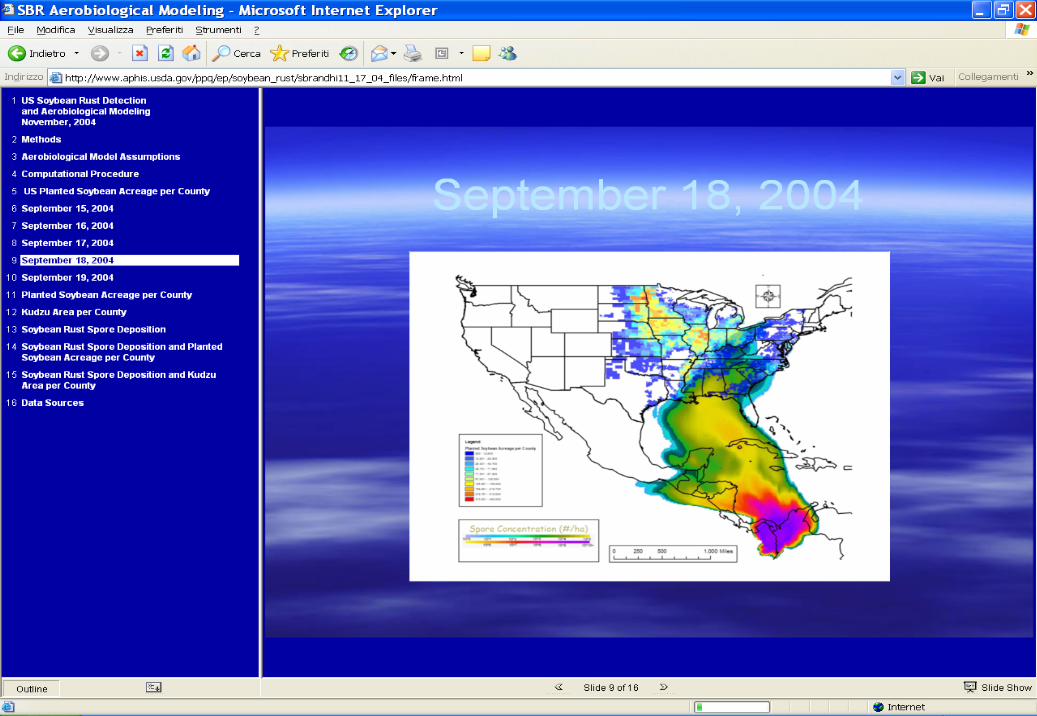
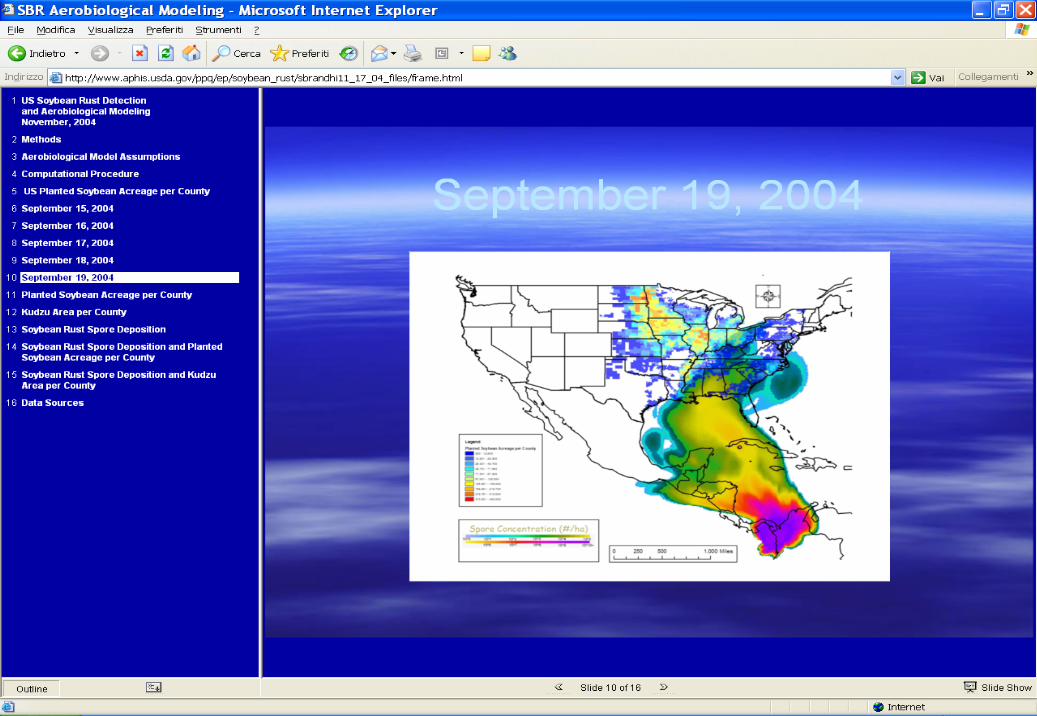
Example of weather data for disease models
Dispersion of spore and insectModification of temperature and humidity
Wind
Presence of saturation conditionsSurvival of organism
Relative humidity
Dispersion of spore and insectSurvival of organism
Precipitation
InoculationSurvival of organism
Leaf wetness
Spore and insects conservationLower threshold of development and survival
Low temperature
Rate of infectionHigher threshold of development and survival
High temperature
Biomass assimilation and growthSolar radiation
Phenological developmentTemperature
EffectVariable
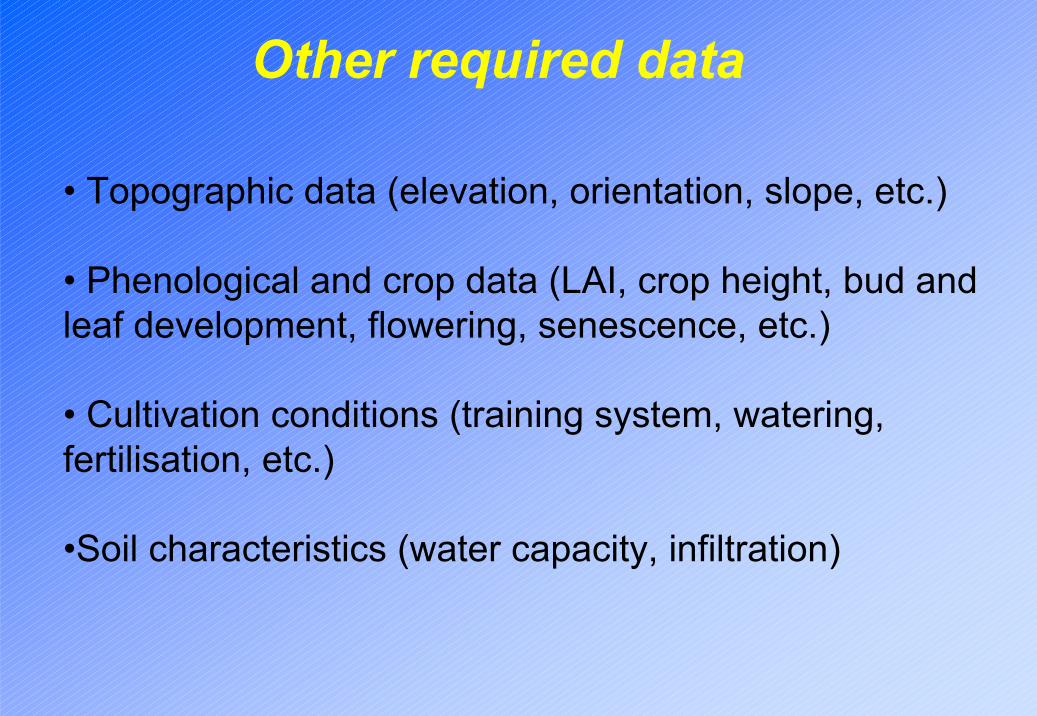
Other required data
• Topographic data (elevation, orientation, slope, etc.)
• Phenological and crop data (LAI, crop height, bud and leaf development, flowering, senescence, etc.)
• Cultivation conditions (training system, watering, fertilisation, etc.)
•Soil characteristics (water capacity, infiltration)
Source of data
• Field monitoring using meteorological stations
• Spatial interpolation
• Remote sensing
• Forecasts
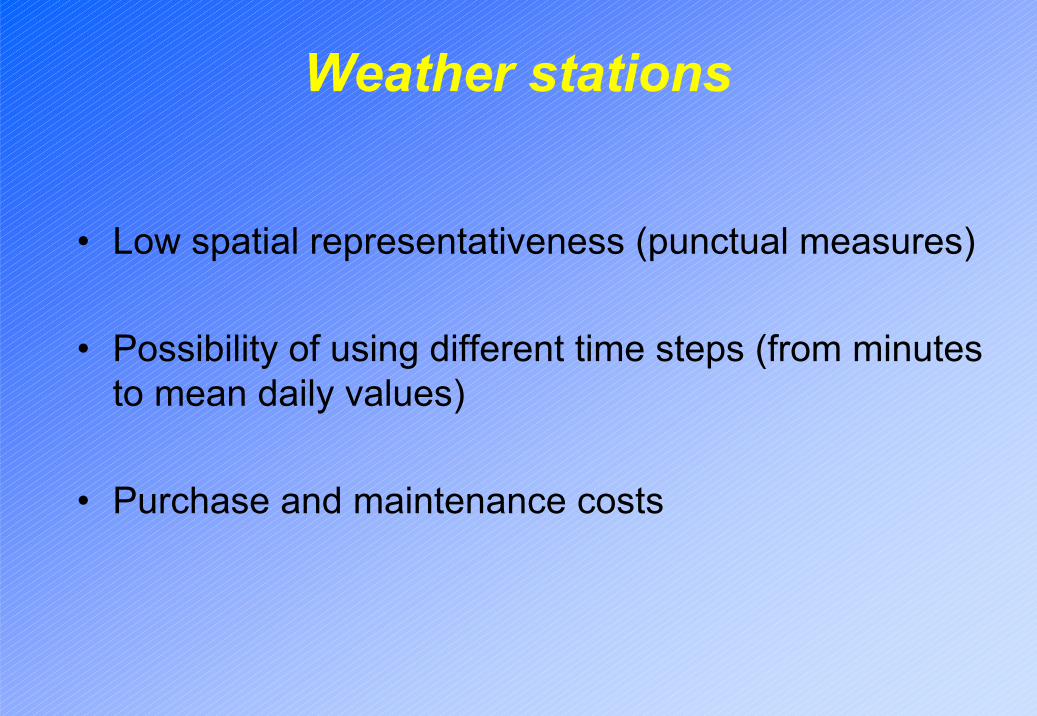
• Low spatial representativeness (punctual measures)
• Possibility of using different time steps (from minutes to mean daily values)
• Purchase and maintenance costs
Weather stations
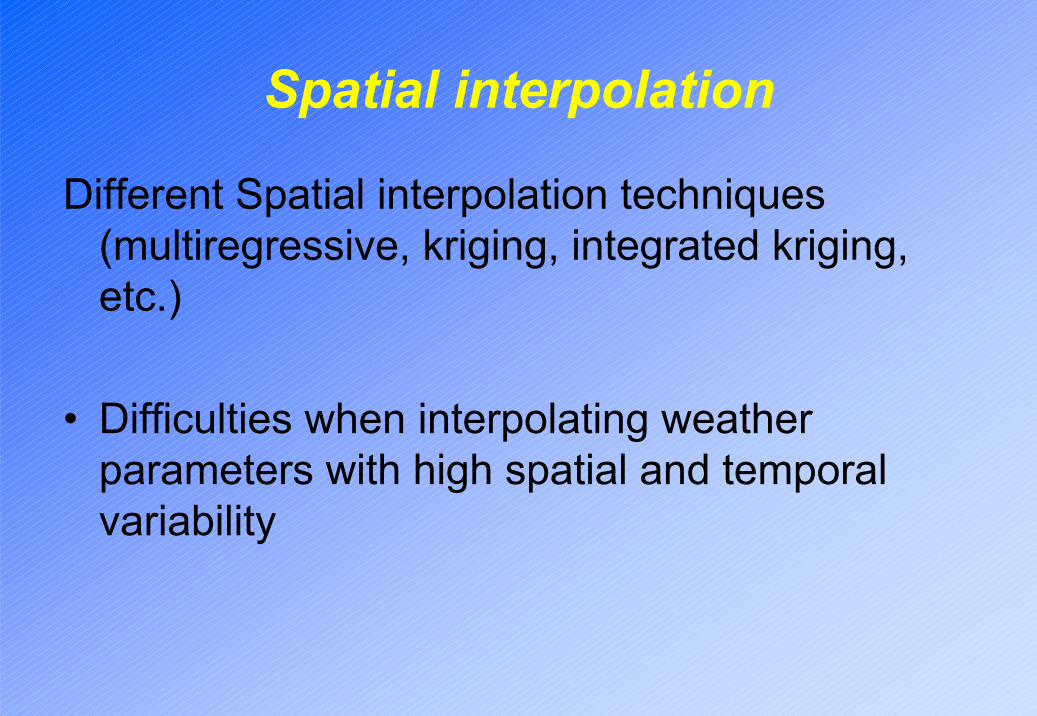
Different Spatial interpolation techniques (multiregressive, kriging, integrated kriging, etc.)
• Difficulties when interpolating weather parameters with high spatial and temporal variability
Spatial interpolation
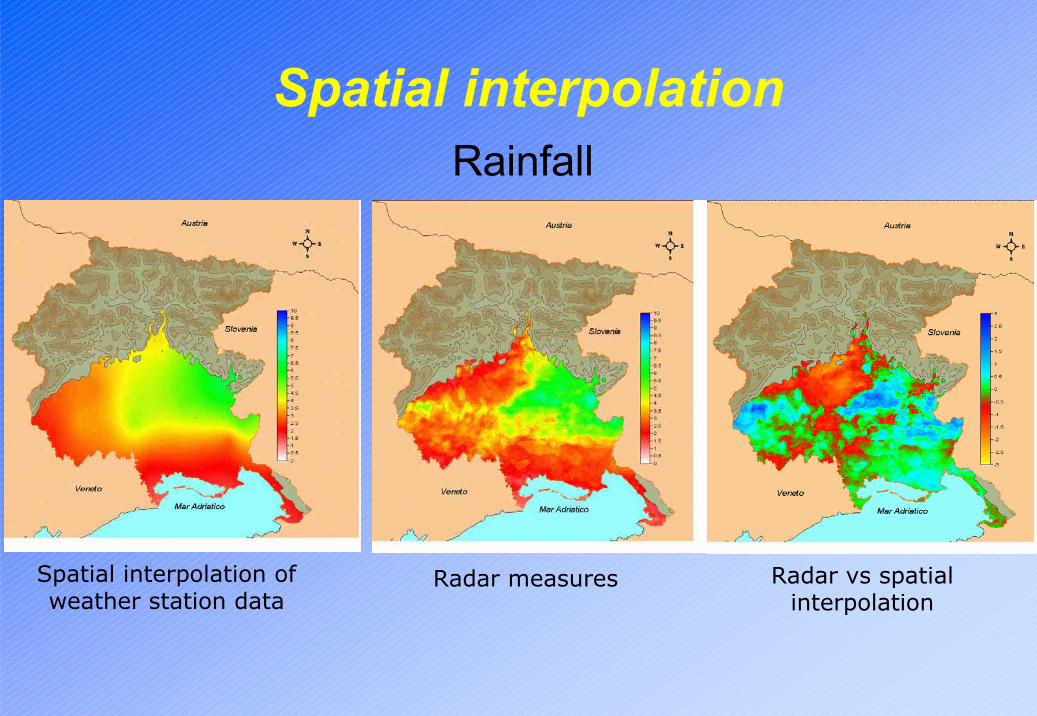
Spatial interpolation of weather station data
Radar measures Radar vs spatial interpolation
RainfallSpatial interpolation
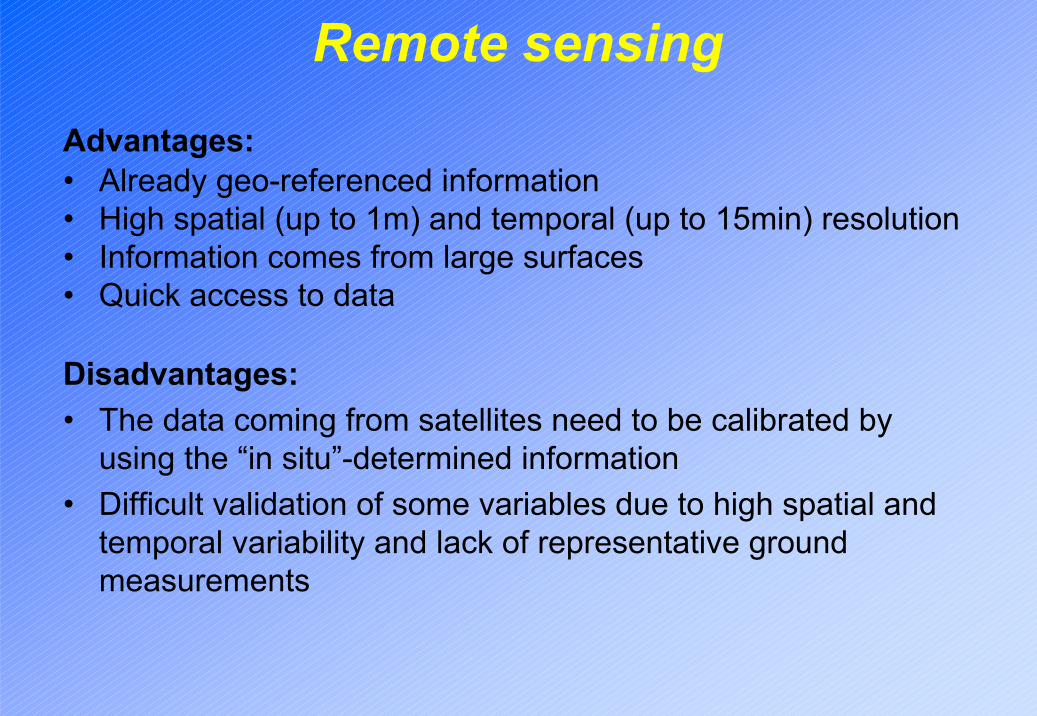
Advantages:• Already geo-referenced information• High spatial (up to 1m) and temporal (up to 15min) resolution• Information comes from large surfaces• Quick access to data
Disadvantages:• The data coming from satellites need to be calibrated by
using the “in situ”-determined information• Difficult validation of some variables due to high spatial and
temporal variability and lack of representative ground measurements
Remote sensing
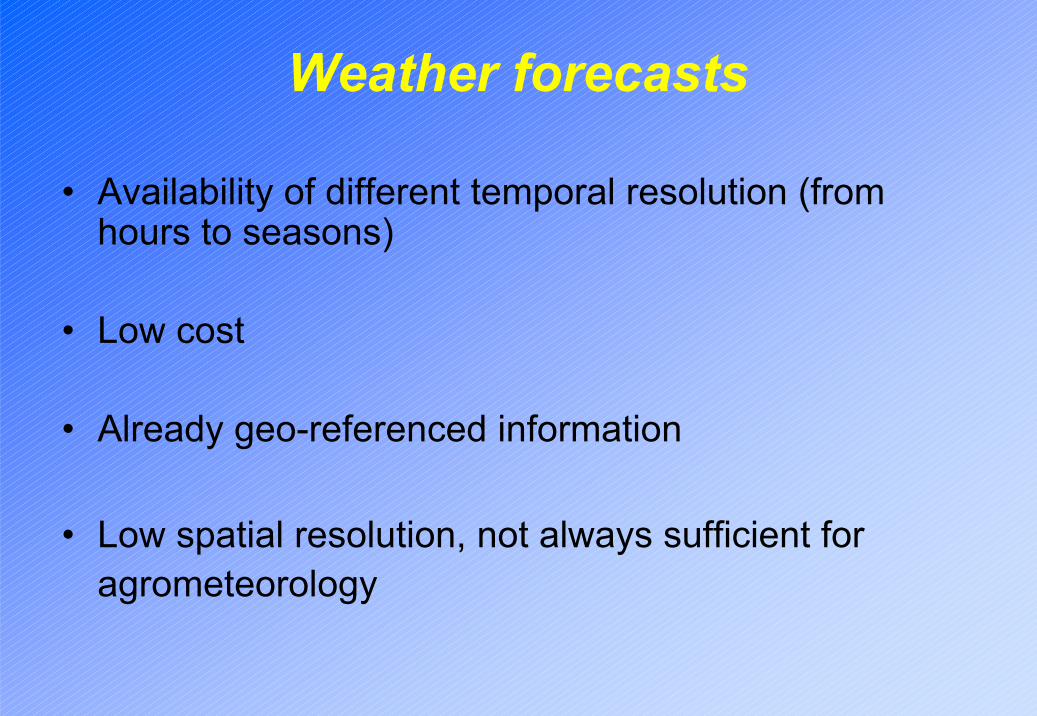
• Availability of different temporal resolution (from hours to seasons)
• Low cost
• Already geo-referenced information
• Low spatial resolution, not always sufficient for agrometeorology
Weather forecasts

Numerical weather models
Seasonal forecast
Outline- State of the art
- Worldwide simulation models realisation and application areas- Implementation of the model - Aims of application - Conditions of application- Required data
- Constraints- Uncertainties- Advantages of application
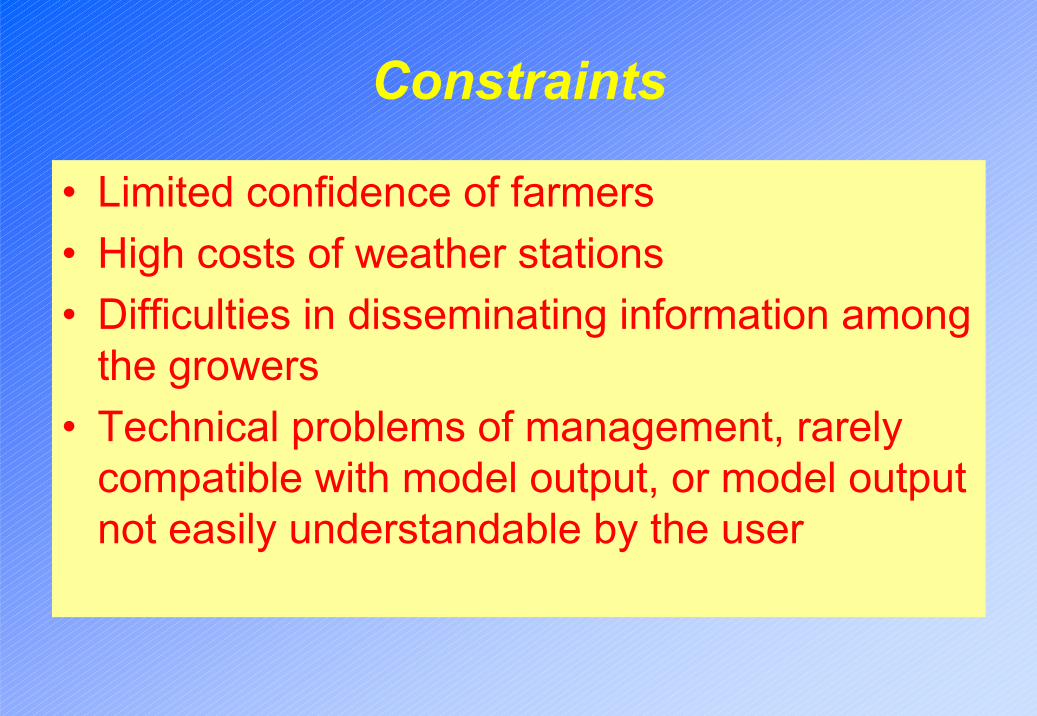
Constraints
• Limited confidence of farmers• High costs of weather stations• Difficulties in disseminating information among
the growers• Technical problems of management, rarely
compatible with model output, or model output not easily understandable by the user
Outline- State of the art
- Worldwide simulation models realisation and application areas- Implementation of the model - Aims of application - Conditions of application- Required data- Constraints
- Uncertainties- Advantages of application
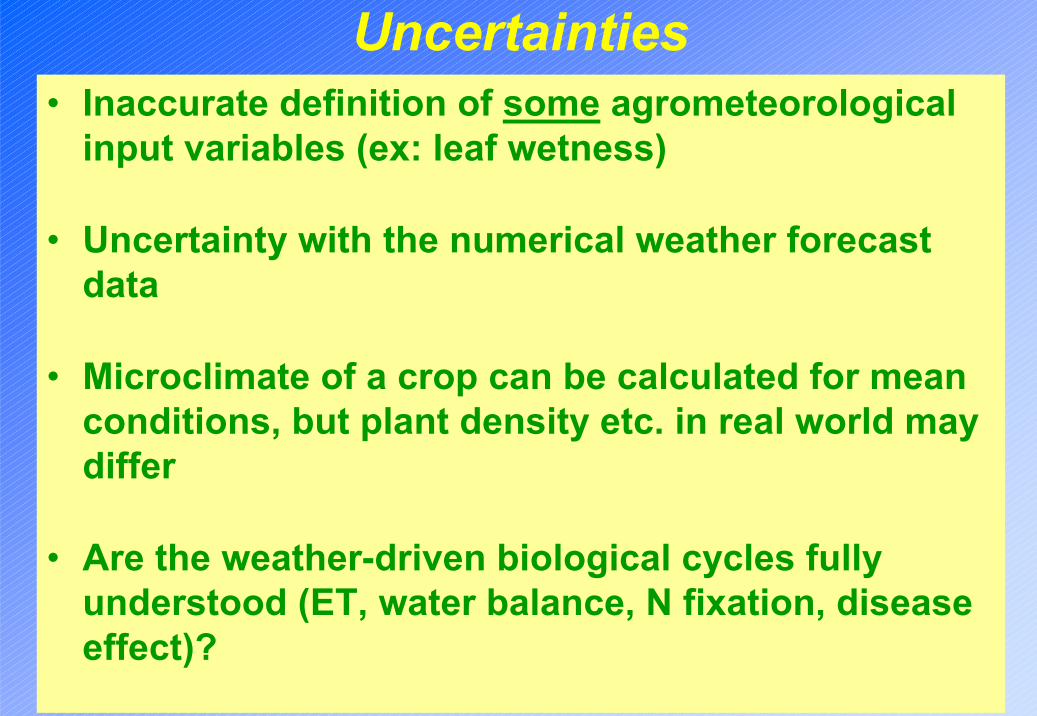
Uncertainties• Inaccurate definition of some agrometeorological
input variables (ex: leaf wetness)
• Uncertainty with the numerical weather forecast data
• Microclimate of a crop can be calculated for mean conditions, but plant density etc. in real world may differ
• Are the weather-driven biological cycles fully understood (ET, water balance, N fixation, disease effect)?
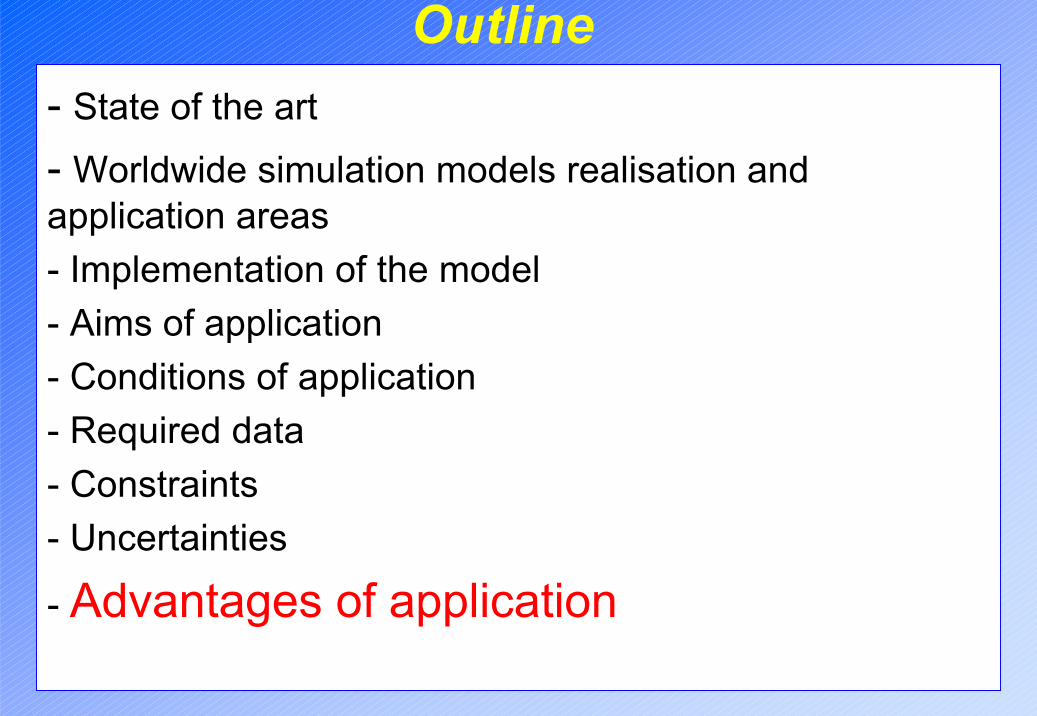
Outline- State of the art
- Worldwide simulation models realisation and application areas- Implementation of the model - Aims of application - Conditions of application- Required data- Constraints- Uncertainties
- Advantages of application
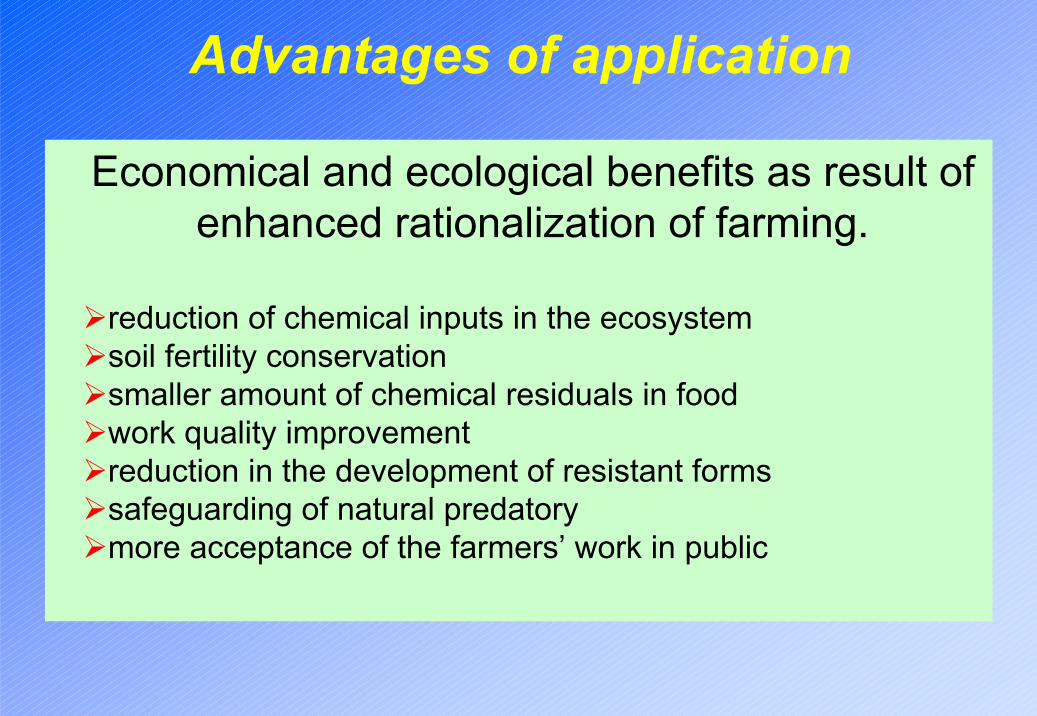
Advantages of application
Economical and ecological benefits as result of enhanced rationalization of farming.
reduction of chemical inputs in the ecosystemsoil fertility conservationsmaller amount of chemical residuals in food work quality improvementreduction in the development of resistant formssafeguarding of natural predatorymore acceptance of the farmers’ work in public
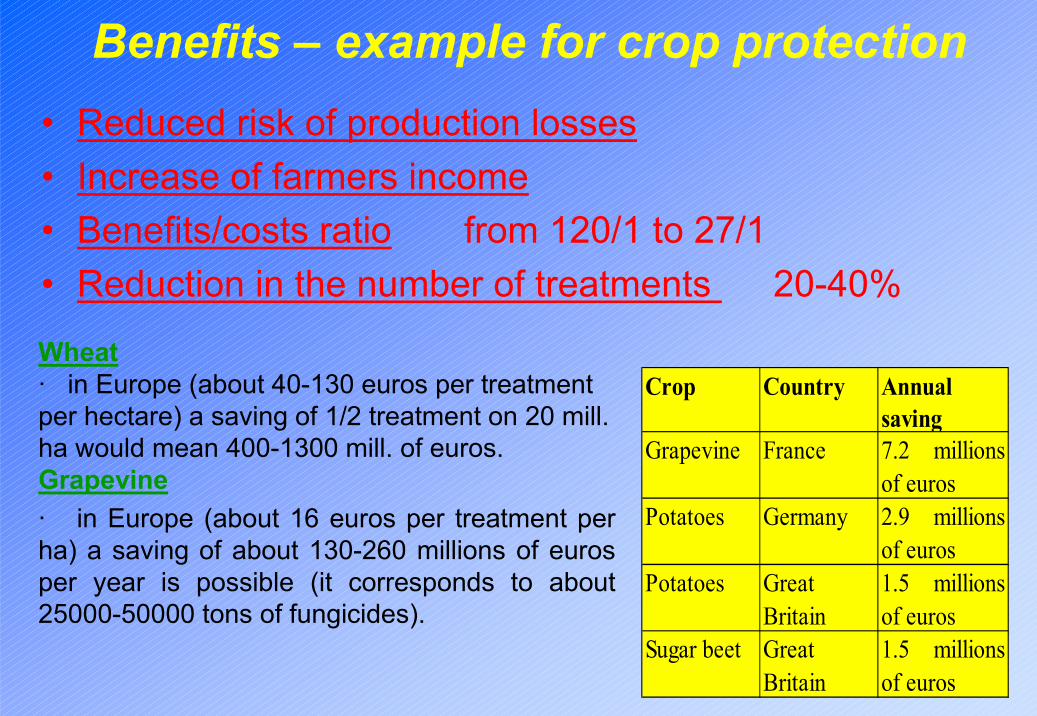
Benefits – example for crop protection• Reduced risk of production losses• Increase of farmers income• Benefits/costs ratio from 120/1 to 27/1• Reduction in the number of treatments 20-40%
Crop Country Annual saving
Grapevine France 7.2 millionsof euros
Potatoes Germany 2.9 millionsof euros
Potatoes Great Britain
1.5 millionsof euros
Sugar beet Great Britain
1.5 millionsof euros
Wheat· in Europe (about 40-130 euros per treatment per hectare) a saving of 1/2 treatment on 20 mill. ha would mean 400-1300 mill. of euros.Grapevine· in Europe (about 16 euros per treatment per ha) a saving of about 130-260 millions of euros per year is possible (it corresponds to about 25000-50000 tons of fungicides).