using servqual to measure users’ satisfaction of …/67531/metadc9005/m2/1/high_res_dyu, brenda...
TRANSCRIPT

USING SERVQUAL TO MEASURE USERS’ SATISFACTION OF COMPUTER
SUPPORT IN HIGHER EDUCATIONAL ENVIRONMENTS
Brenda Wai Fong Yu, B.Ed., M.S.
Dissertation Prepared for the Degree of
DOCTOR OF PHILOSOPHY
UNIVERSITY OF NORTH TEXAS
August 2008
APPROVED: Jon Young, Major Professor Cathleen Norris, Committee Member Maria Victoria Cereijo, Committee Member Jeff Allen, Chair of the Department of
Learning Technology Jerry R. Thomas, Dean of the College of
Education Sandra L. Terrell, Dean of the Robert B.
Toulouse School of Graduate Studies

Yu, Brenda Wai Fong, Using SERVQUAL to Measure Users’ Satisfaction of
Computer Support in Higher Educational Environments. Doctor of Philosophy
(Educational Computing), August 2008, 83 pp., 11 tables, 12 figures, references, 51
titles.
The purpose of this research was to measure users’ satisfaction with computer
support in the higher education environment. The data for this study were gathered over
a 5-week period using an online survey. Subjects (N=180) were members of a college
at a major Texas university, which included both faculty and staff. SERVQUAL was the
instrument used in this study. Two-ways statistical ANOVA analyses were conducted
and revealed three statistically significant differences for Gender, Classification, and
Comfort Level.

Copyright 2008
by
Brenda Wai Fong Yu
ii

iii
ACKNOWLEDGMENTS
I want to thank the members of my dissertation committee (Dr. Jon Young, Dr.
Cathleen Norris, and Dr. Victoria Cereijo) for all their guidance. Special thanks to Dr.
Charles Andrews, Mr. Paul Hons, and Mr. Robert Wellman for their support and help
with the online survey. Additional thanks go to the members of CIRA for their statistical
help, and Ms. Louise Keeton and Ms. Jennifer Lee for their friendships and help with
editing. Finally, I want to thank my family, my parents, and my siblings for all their
support and patience during this long process.

TABLE OF CONTENTS
Page
ACKNOWLEDGMENTS................................................................................................. III LIST OF TABLES...........................................................................................................VI LIST OF FIGURES........................................................................................................VII Chapters
1. INTRODUCTION........................................................................................ 1
Need for Study ................................................................................ 4
Purpose of the Study....................................................................... 5
Hypotheses ..................................................................................... 6
Summary......................................................................................... 6 2. LITERATURE REVIEW.............................................................................. 8
Service Quality ................................................................................ 8
Higher Education Support Role....................................................... 9
SERVQUAL .................................................................................... 9
Summary....................................................................................... 14 3. METHODOLOGY ..................................................................................... 15
Overview ....................................................................................... 15
Statistical Hypotheses................................................................... 16
Instrument Design and Validation ................................................. 17
Analysis of Data ............................................................................ 22
Summary....................................................................................... 23 4. RESULTS................................................................................................. 25
Data Analysis for Hypothesis 1 ..................................................... 30
Data Analysis for Hypothesis 2 ..................................................... 32
Data Analysis for Hypothesis 3 ..................................................... 35
Data Analysis for Hypothesis 4 ..................................................... 38
Data Analysis for Hypothesis 5 ..................................................... 41
Data Analysis for Hypothesis 6 ..................................................... 44
iv

Summary....................................................................................... 47 5. CONCLUSIONS ....................................................................................... 49
Overview ....................................................................................... 49
Summary of Findings .................................................................... 50
Analysis Result by the Order of SERVQUAL Questions ............... 51
Recommendations ........................................................................ 55
Specific Recommendations for Future Study ................................ 57 Appendices
A. SERVQUAL ONLINE SURVEY................................................................ 58 B. GENDER AND COMMENT...................................................................... 69 C. HISTOGRAMS - FREQUENCY................................................................ 76
REFERENCES.............................................................................................................. 80
v
LIST OF TABLES
Page
1. Alpha Coefficients on SERVQUAL (N = 171) ..................................................... 26
2. Intercorrelations among Subscale on SERVQUAL (N = 171)............................. 27
3. Descriptive Statistics for the Factors Means and Total Scale Mean on SERVQUAL (N = 171) ........................................................................................ 28
4. Summary of Gender, Classification, and Comfortable Level with Mean and Standard Deviation ............................................................................................. 29
5. ANOVA Results for Ho1 ..................................................................................... 32
6. ANOVA Results for Ho2 ..................................................................................... 35
7. ANOVA Results for Ho3 ..................................................................................... 38
8. ANOVA Results for Ho4 ..................................................................................... 41
9. ANOVA Results for Ho5 ..................................................................................... 44
10. ANOVA Results for Ho6 ..................................................................................... 47
11. Summary of Results ........................................................................................... 51
vi

vii
LIST OF FIGURES
Page
1. Gender by Classification on Satisfaction............................................................. 30
2. Gender by Comfort Level on Satisfaction. .......................................................... 31
3. Gender by Classification on Tangibles................................................................ 33
4. Gender by Comfort Level on Tangibles. ............................................................. 34
5. Gender by Classification on Reliability................................................................ 36
6. Gender by Comfort Level on Reliability............................................................... 37
7. Gender by Classification on Responsiveness..................................................... 39
8. Gender by Comfort Level on Responsiveness.................................................... 40
9. Gender by Classification on Assurance. ............................................................. 42
10. Gender by Comfort Level on Assurance ............................................................. 43
11. Gender by Classification on Empathy. ................................................................ 45
12. Gender by Comfort Level on Empathy................................................................ 46

CHAPTER 1
INTRODUCTION
The computer is an essential tool for productivity, education, and communication.
Some people use it every day but do not care how it works, while others need to
understand every detail before they feel comfortable with it as a luxury. In other words,
computer use is the main goal whether it is seen as a necessity or a tool. Computer
skills are necessary skills for the work force of today. Thus, learning to use a computer
is the first step to a secure future. Using a computer is an on-going task and getting
technical assistance from computer support personnel can be a bridging step toward
achievement. In an ideal world, computer skills, computer knowledge, and computer
support will endure and complement each other. A logical path to learn and use
computers is going to school. If this is not an option, learning computer skills on the job
is another alternative. Based on the assumptions listed above, one goal of computer
education is to attract new students on campus and retain good employees. Bateson
(1995) argues that in the current economic climate, many university departments and
course managers are giving serious thoughts to the issue of getting good quality
service.
Six years ago, the information technology (IT) industry suffered setbacks after
the dot com bubble burst. For example, many telecommunication professionals were
laid off. Those who are still employed are either very highly skilled in management with
high pay or are inexperienced entry-level workers in non-management areas with a
lower pay rate. There are a few middle level support-driven people still in the field.
The service industry constitutes a large and growing part of most economies and
1

the competition in this service sector will only intensify. Slade noticed that one way for
service firms to survive and grow is to consider a process of service differentiation
(2000). Service differentiation means that achieving higher or different levels of service
quality is necessary; therefore, firms need to enhance their images but not the actual
service quality, by consistently meeting or exceeding customers’ service expectations.
Since higher education is in the service sector, it follows that these same strategies are
relevant to higher education and that higher education institutions should necessarily
differentiate themselves from one another by meeting or exceeding their customers’
service expectations (Slade, 2000). Two questions to ponder are:
Do faculty members have time to communicate with support department
personnel and discuss their service expectations on top of their regular
teaching loads?
Do they really know what their needs are?
In 2004, Thompson noted, ‘customer wants and needs’ is a common phrase that
is often heard and seldom understood. Most people do not know the difference.
Thompson views a customer “want” as a desired outcome. A customer “need” is the
underlying value or benefit that drives their “wants” (Thompson). Therefore, ideal
service support will be tailored to customers’ “needs” and move toward their “wants.” In
the same year, Shahin (2004) also noticed managers in the service sector are under
increasing pressure to demonstrate that their services are customer-focused and that
continuous performance improvement is being delivered.
Magee (1996) noticed information systems (IS) managers normally will try to
improve low satisfaction ratings by asking what their customers wanted. However,
2

based on customers’ understanding of what is possible, they may require anything from
total data access without restriction to 99.9 percent network availability with instant
response. Knowing computer resource availability is just one part of customer
satisfaction and there are more factors directly related to the perception of value
delivered, which is not easily measured in any type of absolute value. However, it is
relatable to an expected outcome, in that exact moment when the service is delivered
(1996).
By understanding that there are multiple levels of user knowledge and skills,
several studies have demonstrated that some users are experts in technology, while
others lack training and/or experience with the computer technology required to perform
their job functions (Lazar, 1999). If users are not satisfied with the support they receive,
they are likely to file a complaint or seek help from other support sources. They could
seek this support inside or outside of the Management Information Systems (MIS)
department (George, Kling, and Iacono, 1990: Bowman, Grupe, Moore & Moore, 1993:
Ku, 1994, Govindarajulu, 1996: Govindarajulu and Reithel, 1998: Lazar, 1999). Because
of this support seeking behavior, support personnel inside MIS departments are being
forced to adjust the way they provide services in order to meet the changing needs of
users (Stockford, 1998: Guimaraes, Gupta and Rainer, 1999: Lazar, 1999).
According to Essex, Simha, Magal, and Masteller, effective customer support
and service has become a strategic imperative and we should, therefore, treat internal
users and external customers with the same level of service (1998).
Gutierrez (2000) investigated the relationship between IS support structures,
support services, service quality, and the characteristics of a diverse user population.
3

This study included investigating technical support issues influencing user satisfaction in
the areas of software, hardware and infrastructure support, and providing foundation
supply support services based on the type of user supported. Local Area Network, e-
mail, client/server computing, and the widespread use of the Internet have highlighted
this component of support (Ferris, 1998; Gloede, 1998). While infrastructure support is
not usually a function of an information center, it is an important component of MIS and
a highly visible component for the end-user (Musthaler, 1996: Raha, 1996: De Michelis,
Dubois, Jarke, Matthes, 1998).
Need for Study
The human resources department at a major Texas university offers quarterly
training sessions based on Anderson and Zemke’s book “Delivering Knock Your Socks
off Service” as a part of its annual Customer Service Week programming. In the
training, employees are encouraged to create a memorable experience for every
customer and try to create a win-win situation to satisfy customers (1991). The nature
and level of perceived quality and how to achieve it will be the central issue for higher
education across the country for many years to come. (Ritchie, 1994). Service quality is
a concept that has aroused considerable interest and debate in the research literature
because of the difficulties in both defining it and measuring it with no overall consensus
emerging on either (Wisniewski, 2001). There are a number of different definitions for
service quality. One that is commonly used defines service quality as the extent to
which a service meets customers’ needs or expectations are met (Lewis and Mitchell,
1990; Dotchin and Oakland, 1994a; Asubonteng et al., 1996; Wisneiwski and Donnelly,
4

1996). Thus, service quality can be defined as the difference between customer
expectations of service and perceived performance. If expectations are greater than
performance, then perceived quality is less than satisfactory and hence, customer
dissatisfaction occurs (Parasuraman et al., 1985; Lewis and Mitchell, 1990).
Some overworked university technology departments have traditionally kept strict
control over their technology infrastructure, hiring full- or part-time employees to
maintain the network, troubleshoot problems, and oversee repairs and upgrades.
(Holzberg, 2004). Holzberg also states that schools have a hard time securing qualified
technical support staff, because school committees and taxpayers choose to spend
available money on improving student-teacher ratios, rather than improving the
computer support service environment. Consequently, satisfactory quality service
support personnel can be hard to find. This study will try to determine how a technology
support department, like a major Texas university, can be effective under these
conditions.
Purpose of the Study
The purpose of this study is to measure users’ satisfaction of computer support in
the higher education environment. This study looked at support from the point of view of
faculty and staff in a single college at a major Texas university. The results of this study
will clarify the support needs of users and identify users’ satisfaction factors, as well as
factors relative to the quality of the support received, using SERVQUAL to measure this
perceived satisfaction.
5

Hypotheses
The overall hypothesis tested for this study is as follows: Computer support
technicians will provide services that meet faculty and staff’s expectations. There will be
no significant difference between these two factors. The six primary research questions
addressed in this study are:
Q1: Does a relationship exist between faculty member and staff member of
customers’ satisfaction of computer support technician?
Q2: Does a relationship exist between faculty and staff’ perception of
computer support technician’s Tangible?
Q3: Does a relationship exist between faculty and staff’ perception of
computer support technician’s Reliability?
Q4: Does a relationship exist between faculty and staff’ perception of
computer support technician’s Responsiveness?
Q5: Does a relationship exist between faculty and staff’ perception of
computer support technician’s Assurance?
Q6: Does a relationship exist between faculty and staff’ perception of
computer support technician’s Empathy?
Summary
Computers are everywhere and they are an essential tool for the modern
workforce. Some users work efficiently around computers and some need a little help.
This study will measure user satisfaction with the level of computer support service at a
major Texas university and pinpoint problem areas, if they exist. Service Quality, as a
6

concept, is widely addressed in the business world and its use is slowly spreading to
academic areas. The motivation for this study is to clarify the support needs of users
and identify satisfaction factors.
7

CHAPTER 2
LITERATURE REVIEW
Service Quality
Today, customer service is a global business and value represents one-fifth of all
world trade. More firms than ever are selling services instead of selling merchandize
(Szymanski, 2001). In 1985, A. Parasuraman, Valarie A. Zeithaml, and Leonard L.
Berry (PZB) suggested:
Service quality is more difficult for the consumer to evaluate than goods quality
Service quality perceptions result from a comparison of consumer expectations
with actual service performance
Quality evaluations are not made solely on the outcome of service; they also
involve evaluations of the process of service delivery (p.42)
Later in 1988, Parasuraman et al. again defined perceived service quality as “global
judgment, or attitude, relating to the superiority of the service” (p.16).
Satisfaction
The design of service settings may have a powerful effect on customer feelings
and perceptions. Simply showing courtesy and a sincere interest toward a customer will
gain their satisfaction (Oldfield & Baron, 2000). When service quality increases, the
satisfaction with the service and intentions to reuse the service is also increase. In
1992, DeLone and McLean outlined user satisfaction as the most appropriate dimension
to measure the success of the support organization. Bailey and Pearson (1983) define
satisfaction in any given situation as the total of one’s feelings or attitudes toward a
8

variety of factors affecting that situation. Galletta and Lederer (1989) explained the
importance of selecting user satisfaction as the independent variable for system
success. However, they point out that user satisfaction is hard to measure accurately.
They also suggest that attitudes and perceptions are different measures than
satisfaction, and as such, should not be ignored in research.
Higher Education Support Role
Oldfield stated in 2000 that the higher education environment is a pure service; it
provides person-to-person interaction. In this situation, customer satisfaction is often
established through the quality of personal contacts. In higher education this interaction
between end-users and their influence on each other is a powerful determinant of
overall satisfaction. So, by using a powerful measurement like SERVQUAL, the users’
satisfaction will be easily revealed.
Many of the measurements in service quality studies in the area of higher
education have been focused on the delivery method, such as the delivery of effective
courses and teaching (Oldfield, 2000). It is lacking research on what were the factors of
success support services. The ideal design of quality measures should be for specific
service providers, it should lead to a better understanding of the construct and to the
adaptation of quality improvement. It is hope that SERVQUAL meet its claim to measure
users’ satisfaction.
SERVQUAL
The original SERVQUAL questionnaire was designed to measure both
9

expectations (forecast) and perceptions (what actually happens) within a firm, with
respect to service quality. The original SERVQUAL started with 10 original dimensions,
which were:
1. Tangibles: Appearance of physical facilities, equipment, personnel, and
communication materials
2. Reliability: Ability to perform the promised service dependably and accurately
3. Responsiveness: Willingness to help customers and provide prompt service
4. Competence: Possession of required skill and knowledge to perform service
5. Courtesy: Politeness, respect, consideration, and friendliness of contact
personnel
6. Credibility: Trustworthiness, believability, and honesty of the service provider.
7. Feel secure: Freedom from danger, risk, or doubt
8. Access: Approachable and easy of contact
9. Communication: evaluate its customers and acknowledges their comments;
keeps customers informed in a language which they can understand
10. Understanding the customer: Making the effort to know customers and their
needs
After several revisions by the authors, the original 10 dimensions were reduced
to five dimensions in the final instrument used for this study:
Tangibles: Physical facilities, equipment, and appearance of personnel.
Reliability: Ability to perform the promised service dependably and
accurately.
Responsiveness: Willingness to help customers and provide prompt service.
10

Assurance: Knowledge and courtesy of employees and their ability to
inspire trust and confidence (which included competence,
courtesy, credibility, and security).
Empathy: Caring, individualized attention provide to its customers
(which included access, communication, and understanding
the customer).
When SERVQUAL was originally administered in 1985 to 1990s the same
question was asked twice. The first time the users were asked what their ideal situation
was; the second time the users were asked to evaluate their service support. The need
to ask the same question twice is a common cause of criticism involving use of the
SERVQUAL instrument.
In 1996, Asubonteng, McCleary, and Swan reviewed 25 published SERVQUAL
tests and reported conflicting results. A number of studies were started from concerns
about the efficacy of SERVQUAL in various fields and these concerns (expressed by
many of these 25 teams of researchers) were categorized into two classes. One was
the dimension structure and its stability, and the other was the appropriateness of usage
of service quality as a gap score (Yoon & Suh, 2004). The gap score in the original
SERVQUAL instrument is the expectations (forecast or wants) minus perceptions (what
actually happens)
Another critique of SERVQUAL came from Van Dyke, Prybutok, and Kappelman
in 1999; these researchers suggested using the perceived-performance-only scoring
method instead of the gap method. Thus, the perceived-performance-only scoring
method shows superior reliability and predictive validity.
11

As Gaster (1995) comments, “because service provision is complex, it is not simply a
matter of meeting expressed needs, but of finding out unexpressed needs, setting
priorities, allocating resources and publicly justifying and accounting for what has been
done” (Shahin, 2004, p. 5).
Below are some examples of dimensions from the SERVQUAL instrument that
are appropriate to this study.
Tangibles
Examples of the Tangibles dimension are “has up-to-date equipment.” “Physical
facilities are visually appealing” and “materials are visually appealing.” These aspects
might be not controlled by the technical support team, since every department within a
college has their own funding to purchase computer equipment and their own work
space is created by users themselves. So, the visual aspects are their own
environment.
Reliability
Some of the aspects in the reliability factor have to do with “doing what is
promised” and “doing it at the promised time.” Since the technical support team has only
three full time support personnel, one part-time administrative assistant, and four part-
time student technicians, most of the front line jobs are handled by the part-time student
support technicians. The student technician’s work time is necessarily limited. When a
customer request comes in, there may not be a student technician working, or they may
be working, but get called to an emergency situation. If the need for help and the
12

availability of personnel are out of synchronization, customers can not trust an
organization to do what they ask. Those customers may be dissatisfied.
Responsiveness
One of the aspects in the responsiveness factor is “gives prompt service.”
Providing a prompt response is the easily measurable amount of time spent and getting
the problem solved is the criterion applied by the user to evaluate their experiences.
The technical support team would be thrilled to give prompt response. Usually the
service call will be answer within two hours. However, due to limited man power, this
factor could post a red flag.
Assurance
One of the aspects in the assurance factor is “knowledge to answer questions.”
For example, users always consult the technical support team for technical opinions
when purchasing high tech tools. Other aspects in the assurance factor are “employees
can be trusted” and “feel safe in your transactions with employees.” The technical
support team hires highly motivated part-time student technicians and full-time staff.
Successful candidates demonstrate high knowledge skills and have the capacity to seek
resolutions for problems by searching the Web for solutions.
Empathy
The technical support team is enthusiastic while performing services for our
users. Three of these aspects of Empathy are “personal attention,” “understand your
13

specific needs,” and “operating hours are convenient” The technical support team is
known to know the users by their name, and know their specific needs, if they need
hand-on guidance or just need to point to the right direction. Also the office of the
technical support team opens from seven o’clock in the morning until six o’clock in the
evening, the main purpose for that long hour are making sure to support the faculty
members for the teaching of the class and the staff members for the smooth operating
of the office when their regular office hours from eight o’clock to five o’clock.
Summary
SERVQUAL was a reliable instrument, which created around 1985, and over the
years, it had been modified by the authors. The final version including five dimensions, it
was proven to measure user’s satisfaction.
14

CHAPTER 3
METHODOLOGY
Overview
This study used an online survey posted on a secure password-protected Web
site. Harris stated that survey research is appropriate for areas like support where we
are interested in evaluating factual information about a particular situation (Harris,
1995). This survey approach was also recommended by Gutierrez (2000) to:
Gather a large amount of data from multiple organizations
Test the SERVQUAL instrument, which measures the success of a support
organization
Determine individual differences in respondents
Obtain data about industry support organizations and their success
Determine which organizational support structure performs the best for
individual user types
Reveal a large number of uncontrolled variables are interacting unpredictably
Collect a wide range of variables and characteristics
This study provided one selection per item using the radio button force-
completion method. This method avoided multiple invalid answers, improved the
accuracy of responses, and increased the valid response rate. There are also other
rationales for using an online survey:
No time limit: subjects can take all the time they need and work at their own
pace without a time limit
15

Short survey: The entire survey normally took about 15 minutes to complete.
This discouraged boredom and helped to prevent fatigue
Location: No geographic limitation
Cost: Cost was less when the survey is distributed on the Web, because
there is no postage or paper used
The Texas University Institutional Review Board approved this methodology as a
means of protecting the privacy of the subjects involved in the survey.
Statistical Hypotheses
Six specific hypotheses were identified, which are stated below. The null
hypothesis is simply the hypothesis of “no difference” or “no relationship” existing
between variables.
Ho1: There is no significant difference between customers’ satisfaction, either
as faculty member or staff.
Ho2: There is no significant difference between faculty and staff’s perception of
computer support technician’s Tangible.
Ho3: There is no significant difference between faculty and staff’s perception of
computer support technician’s Reliability.
Ho4: There is no significant difference between faculty and staff’s perception of
computer support technician’s Responsiveness.
Ho5: There is no significant difference between faculty and staff’s perception of
computer support technician’s Assurance.
16

Ho6: There is no significant difference between faculty and staff’s perception of
computer support technician’s Empathy.
Instrument Design and Validation
Framework
The SERVQUAL model has been widely used to study the service industry in
general and education customer service, in particular (Kitchroen, 2004). Fedoroff (2005)
also stated that the SERVQUAL method from PZB is a technique that can be used for
performing a gap analysis of an organization’s service quality performance against
customer service quality needs.
As noted above, SERVQUAL aims to measure the gap between customer
expectations and perceptions in terms of five dimensions, namely Tangibles, Reliability,
Responsiveness, Assurance, and Empathy. The order of survey questions used
corresponds to these five dimensions:
Tangibles:
1. Computer support department has up-to-date equipment.
2. Computer support department's physical facilities are visually appealing.
3. Computer support department's employees are well dressed and appear neat.
4. The appearance of the physical facilities of Computer support department is in
keeping with the type of services provided.
Reliability:
5. When computer support department promises to do something by a certain time,
it does so.
17

6. When you have problems, computer support department is sympathetic and
reassuring.
7. Computer support department is dependable.
8. Computer support department provides its services at the time it promises to do
so.
9. Computer support department keeps its records accurately.
Responsiveness:
10. Computer support department does not tell customers exactly when services will
be performed.
11. You do not receive prompt service from computer support department's
employees.
12. Employees of computer support department are not always willing to help
customers.
13. Employees of computer support department are too busy to respond to customer
requests promptly.
Assurance:
14. You can trust employees of computer support department.
15. You feel confident your data will be protected in any transactions with computer
support department's employees.
16. Employees of computer support department are polite.
17. Employees get adequate support from computer support department to do their
jobs well.
18

Empathy:
18. Computer support department does not give you individual attention.
19. Employees of computer support department do not give you personal attention.
20. Employees of computer support department do not know what you needs are.
21. Computer support department does not have your best interests at heart.
22. Computer support department does not have operating hours convenient to all
their customers.
Reliability and Validity
PZB stated that SERVQUAL is a generic instrument with good reliability, validity,
and broad applicability in their original study of SERVQUAL. The purpose of
SERVQUAL is to serve as a diagnostic methodology for uncovering broad areas of a
company’s service quality shortfalls and strengths. SERVQUAL’s dimensions and items
represent core evaluation criteria that transcend specific companies and industries, as
implied by the systematic, multi-stage, and iterative process that produced the
instrument (Parasuraman, Zeithami and Berry, 1985, 1988).
There has been considerable research to re-examine the validity of SERVQUAL.
The most critical studies are listed below:
In 1996, Asubonteng, McCleary, and Swan listed a table for several studies
comparing the reliability and validity of SERVQUAL. They reported the reliability
coefficient (Cronbach’s alphas) as .87 - .90.
19

In 1997, Lam found that the results are consistent with those reported in Babakus
and Boller (1992) and Parasuraman et al. (1998), suggesting that both measures
exhibit desirable levels of reliability and internal consistency.
In 2004, Shahin concluded that the concept of measuring the difference between
expectations and perceptions in the form of the SERVQUAL gap score proved
very useful for assessing levels of service quality. This view was echoed by
Asubonteng et al., in their 1996 research: that SERVQUAL will predominate as a
service quality measure. They also pointed out that SERVQUAL’s lowest
reliability was 0.59 reported by Finn and Lamb (1991) and the highest reliability
was 0.97 reported by Babakus and Mangold (1992). According to these reports,
SERVQUAL is a very reliable instrument.
As stated by Asubonteng, McCleary, and Swan (1996):
The findings from studies provide some support for reliability and face validity for
the SERVQUAL scores on the five dimensions. Brown, Churchill, Peter (1993) provided
the following insights in their assessment of SERVQUAL. First, factor-analysis results
relating to the convergent validity of the items representing each dimension are mixed,
because in several studies the highest loadings of some items were on different
dimensions from those in Parasuraman et al. (1998). Second, lack of support for the
discriminant validity of SERVQUAL is reflected by the factor-loading pattern, and the
number of factors retained is inconsistent across studies. Third, the usefulness of
expectation scores and the appropriateness of analyzing gap scores need to be
examined. Fourth and last, the findings from across-study comparisons have very
important implications for service quality researchers and SERVQUAL users. (p. 75)
20

Population
The population in this study involves faculty members and staff members in a
college at a major Texas university. According to the university Fact Book (2005-2006),
there were about 2,045 faculty members and 2,252 staff members at university. Among
those, there were approximately 122 faculty members and 112 staff members in the
college at the time of the study.
Sample
The research sample consisted of voluntary participants from all departments
within the college. They included full-time faculty, part-time faculty, full-time staff, and
part-time staff. In this study, student assistants were included in the part-time staff
category. The survey instrument was distributed through a secure Web site and I sent
an invitation to everyone within the college. At the end of the five week data collection
period, 180 participants had responded. The participant group consisted of 76 faculty
members and 104 staff members.
Data Collection
Data for this study were collected using an online survey. I sent out e-mail
invitations with a link to the online survey and asked the subjects to participate in the
study. When the subjects clicked on the hyperlink sent to them in the e-mail, they were
taken to a secure Web site. The potential respondents were then asked to put in a
username and password (which was also included in the e-mail invitation). The first
page they encountered was a consent form, where participants clicked on “Agree”
21

button in order to start the survey. If the “Agree” button was not click, the survey would
not start. Also, the participants can hit the “Escape” button any time to exit the survey.
This online survey included 21 personal information and 22 satisfaction questions. The
whole process was expected to take about 15 minutes. After the participants finished
the survey, the survey also stamped the answer corresponded to the user’s computer’s
Internet Protocol (IP) address to prevent participants from taking the survey more than
once.
Analysis of Data
The results of this survey were stored on a secure Web server. The data were
easily exported to a spreadsheet and transferred to the Statistical Package for the
Social Sciences (SPSS) for analysis. I used SPSS version 15 to perform six ANOVA
tests with a level of significance of 0.05. Two-way analysis of variance (ANOVA) tests
were conducted involving two independent variables (Gender and Comfort Level, or
Gender and Classification), with a number of different dimension levels – dependent
variables - (Tangibles, Reliability, Responsiveness, Assurance, and Empathy). These
levels corresponded to the different groups or conditions. ANOVA compared the
variance (variability in scores) between the different groups (believed to be due to the
independent variables – Gender, Classification, and Comfort Level), with the variability
within each of the groups (believed to be due to chance). This technique presented
individual and point effect of two independent variables on one dependent variable. The
advantage of using a two-way design was that when examined the “main effect” for
each independent variable, it also explore the possibility of an “interaction effect.” An
22

interaction effect occurs when the effect of one independent variable on the dependent
variable depends on the level of a second independent variable.
The F ratio was also calculated, which represented the variance between the
groups, divided by the variance within the groups. A large F ratio indicates that there is
more variability between the groups (caused by the independent variable) than there is
within each group (referred to as the error term). A significant F test indicates that the
null hypothesis, which states that the population means are equal, can be rejected. A
significant F test does not, however, tell us which of the groups differ. For this, I need to
conduct post-hoc tests. Post-hoc tests are designed to help protect against the
likelihood of a Type 1 error (Pallant, 2001). However, this approach is stricter, making it
more difficult to obtain statistically significant differences. Also, ANOVA is known as
being robust for the violation of normality. In the normality situation, all the cell sizes
must be equal and the sample size (N) is large (Hair, Black, Babin, Anderson, Tatham,
2006). In this situation, central limit theorem was accepted. I looked at the effect size as
well. The effect size is a measurement of how much the range of scores from the two
groups overlap.
Summary
Population: All faculty and staff members of the college
Sample: Voluntary participants from above group
Instrument: SERVQUAL instrument
Data Collection Online survey posted on secure password-protected Web site. Procedures: Subjects remained totally anonymous
23

Data Analysis: Two sets of 2-way ANOVA were performed. One ANOVA was on Gender (male vs. female) X Classification (full-time vs. part-time). The other ANOVA was on Gender (male vs. female) X Comfort Level (very comfortable vs. comfortable).
24
CHAPTER 4
RESULTS
This study was designed to determine if any significant differences existed
between the level of satisfaction of the faculty and staff in the work performed by the
computer support services in the a college at a major Texas university. This chapter
presents the data collected through an online survey and the findings based on those
data. The methodology in Chapter 3 explained the usage of a reliable instrument called
SERVQUAL and also explained that an online survey was also used to collect twenty-
one (21) personal information items from the subjects. Because of the magnitude of the
data collected, I decided to use ANOVA to analyze the data regarding employment
status: Classification (full-time vs. part-time), Comfort Level of computer usage (very
comfortable, comfortable, uncomfortable, and very uncomfortable) and Gender (female
vs. male). At the time the survey was conducted, there were approximately 122 faculty
member and 112 staff members in the college. Among them, 76 faculty members and
104 staff members took the survey.
The Statistical Package for the Social Sciences (SPSS 15) statistical analysis
software was used for the analyses and also to present the results of the analysis for
each hypothesis. The alpha coefficient was set at the .05 level for analysis purposes.
The survey was placed online on October 19, 2007, and the original email invitation e-
mail was sent out on the same day. A follow-up e-mail was sent after 2 weeks, and the
survey was closed on November 28, 2007. There were 134 female and 46 male
participants. From the total of 180 subjects who completed the online survey, 58 were
full-time faculty, 18 were part-time faculty, 64 were full-time staff, and 40 were part-time
25

staff. The survey respondents had four levels of computer usage comfort levels from
which to choose: very comfortable, comfortable, uncomfortable, and very
uncomfortable. One hundred nine subjects selected very comfortable as their level of
computer use, 68 subjects selected comfortable, 3 selected uncomfortable, and no
respondents selected very uncomfortable.
I decided to use standardized score three as the criteria to eliminate the outliers
from the response data. Based on this criterion, nine respondents’ answers were
eliminated, including the three persons who chose uncomfortable as their computer use
comfort level. Thus, 171 was the final sample size for this dissertation.
Table 1 shows the alpha coefficients used. There has been debate for decades
about the acceptable and satisfactory cutoff criteria for alphas. Nunnally (1978)
recommended .70 as the minimum criterion for acceptable, .80 for satisfactory, and .90
and above for adequate. Based on these criteria, the internal consistency reliability
coefficients in Cronbach’s alpha in Table 1 are either satisfactory or adequate.
Table 1
Alpha Coefficients on SERVQUAL (N = 171)
Subscales Number of Items Cronbach α
Tangibles 4 .81
Reliability 5 .88
Responsiveness 4 .75
Assurance 4 .86
Empathy 5 .86
Total Satisfaction 22 .93
26

27
Table 2 shows the correlations among the five subscale ranges from .35 to .72 in
the desired positive direction at the .001 level. Based on Cohen (1988), these
coefficients are in the range of medium to large. The largest correlation is .72 between
Empathy and Responsiveness, which indicates that two factors share 53% of common
variances. In other words, nearly 50% of the variances are addressed by the two factors
separately. In summary, the data in Table 2 support the construct validity of the
SERVQUAL survey.
Table 2
Intercorrelations among Subscale on SERVQUAL (N = 171)
Subscales 1 2 3 4 5
1. Tangibles -
2. Reliability .58*** -
3. Responsiveness .35*** .64*** -
4. Assurance .49*** .66*** .57*** -
5. Empathy .42*** .67*** .72*** .69*** -
*** p < .001
The results of the correlations among the subscales are statistically significant at
the .001 level. They are either moderately or highly correlated (Cohen, 1988).
Table 3 shows the overall descriptive statistical analysis for the survey.
Table 4 shows the overall summary of Gender, Classification, and Comfortable
Level with Mean and Standard Deviation.

Table 3
Descriptive Statistics for the Factors Means and Total Scale Mean on SERVQUAL (N = 171)
Statistics Tangibles Reliability Responsiveness Assurance Empathy Satisfaction
Minimum 2.75 3.60 2.50 4.00 3.20 4.00
Maximum 7.00 7.00 7.00 7.00 7.00 7.00
Mean 5.50 6.10 5.90 6.21 6.07 5.97
SD .94 .83 1.04 .76 .95 .74
Skewness -.32 -.96 -1.11 -.93 -1.00 -.77
Kurtosis -.38 .54 1.01 .39 .33 -.02
ZSkewness -1.75 -5.22 -6.00 -4.99 -5.39 -4.14
ZKurtosis -1.03 1.45 2.73 1.04 .89 -.04
28

Table 4
Summary of Gender, Classification, and Comfortable Level with Mean and Standard Deviation
Gender Classification Comfort Level
Female Male Full-time Faculty
Part-time Faculty
Full-time Staff
Part-time Staff
Very
Comfortable Comfortable
n=129 n=42 n=55 n=16 n=61 n=39 n=129 n=42
M (SD) M (SD) M (SD) M (SD) M (SD) M (SD) M (SD) M (SD)
Tangibles_M 5.53 (.98) 5.44 (.82) 5.47 (.81) 4.97 (1.15) 5.69 (.97) 5.48 (.91) 5.57 (1.01) 5.41 (.83)
Reliability_M 6.17 (.82) 5.89 (.82) 6.10 (.85) 5.79 (.78) 6.26 (.77) 6.00 (.86) 6.18 (.83) 5.98 (.81)
Responsiveness_M 5.95 (1.01) 5.73 (1.12) 5.91 (1.13) 5.59 (1.19) 6.09 (.87) 5.69 (1.08) 5.91 (1.06) 5.88 (1.02)
Assurance_M 6.24 (.76) 6.10 (.77) 6.30 (.63) 5.84 (.93) 6.29 (.77) 6.10 (.81) 6.24 (.80) 6.17 (.70)
Empathy_M 6.16 (.92) 5.82 (1.04) 6.14 (.88) 5.90 (.89) 6.29 (.84) 5.72 (1.16) 6.12 (.95) 6.00 (.96)
Satisfaction_M 6.02 (.73) 5.80 (.76) 6.00 (.71) 5.64 (.77) 6.14 (.66) 5.80 (.83) 6.02 (.74) 5.90 (.74)
29

Data Analysis for Hypothesis 1
Hypothesis 1 stated: “There is no significant difference between customers’
satisfaction, either as faculty member or staff.” Hypothesis 1 was tested using two sets
of 2-ways ANOVA. One ANOVA was on Gender (male vs. female) X Classification (full-
time vs. part-time). The other ANOVA was on Gender (male vs. female) X Comfort
Level (very comfortable vs. comfortable). Homogeneity of variance (Levene Test) was
also conducted; the significance level was .58 for Gender by Classification and .72 for
Gender by Comfort Level. Both variance results were greater than .05, which means
that they met the assumption.
Figure 1 provides a graphical representation of the Gender by Classification on
Satisfaction.
MaleFemale
Gender
6.20
6.00
5.80
5.60
5.40
5.20
5.00
Est
imat
ed M
arg
inal
Mea
ns
Staff - part timeStaff - Full timeFaculty-part timeFaulty-Full timeClassification
Estimated Marginal Means of Satisfaction_M
Figure 1. Gender by Classification on Satisfaction.
30

Figure 2 provides a graphical representation of the Gender by Comfort Level on
Satisfaction.
MaleFemale
Gender
6.10
6.00
5.90
5.80
5.70
5.60
5.50
Est
imat
ed M
arg
inal
Mea
ns
ComfortableVery comfortableComfortLevel
Estimated Marginal Means of Satisfaction_M
Figure 2. Gender by Comfort Level on Satisfaction.
Then, ANOVA was performed. The results of this ANOVA are showed in Table 5.
The results showed that the significance level F (3, 163) = .25, P = .87, for Gender by
Classification. F (1, 167) = 3.41, P = .07 for Gender by Comfort Level. Neither the
interaction effect nor main effect was statistically significant for overall satisfaction for
Gender by Classification and Gender by Comfort Level.
31

Table 5
ANOVA Results for Ho1
SERVQUAL SS df MS F p η2
Satisfaction_M
Gender 1.24 1 1.24 2.32 .13 .01
Classification 3.67 3 1.22 2.30 .08 .04
Gender x Classification 040 3 .13 .25 .87 .01
Error 86.84 163 .53
Total 92.85 170
Satisfaction_M
Gender .88 1 .88 1.64 .20 .01
Comfort Level .00 1 .00 .00 .97 .00
Gender x Comfort Level 1.81 1 1.81 3.41 .07 .02
Error 88.94 167 .53
Total 92.85 170
The results for Hypothesis 1 showed all p-values were greater than .05. Hence,
there was no significant difference between customers’ satisfaction, either as faculty
member or staff. Therefore, I failed to reject the null hypothesis.
Data Analysis for Hypothesis 2
Hypothesis 2 stated: “There is no significant difference between faculty and staff’
perception of computer support technician’s Tangible.” Hypothesis 2 was tested using
two sets of 2-ways ANOVA. One ANOVA was on Gender (male vs. female) X
Classification (full-time vs. part-time). The other ANOVA was on Gender (male vs.
32

female) X Comfort Level (very comfortable vs. comfortable). Homogeneity of variance
(Levene Test) was conducted. The significance level was .17 for Gender by
Classification and .07 for Gender by Comfort Level. Both results were greater than .05,
which means that they met the assumption.
Figure 3 provides a graphical representation of the Gender by Classification on
Tangibles.
MaleFemale
Gender
5.50
5.00
4.50
Est
imat
ed M
arg
inal
Mea
ns
Staff - part timeStaff - Full timeFaculty-part timeFaulty-Full timeClassification
Estimated Marginal Means of Tangibles_M
Figure 3. Gender by Classification on Tangibles.
33

Figure 4 provides a graphical representation of the Gender by Classification on
Tangibles.
MaleFemale
Gender
5.65
5.60
5.55
5.50
5.45
5.40
5.35
Est
imat
ed M
arg
inal
Mea
ns
ComfortableVery comfortableComfortLevel
Estimated Marginal Means of Tangibles_M
Figure 4. Gender by Comfort Level on Tangibles.
Then, ANOVA was performed. The results of this ANOVA are showed in Table 6.
The ANOVA results were a significant F (3, 163) = 1.33, p = .04 for Classification, and F
(1,167) = .52, p = .47 for Gender by Comfort Level. These p-values showed a statistical
significance on Classification for Tangibles but no statistical significance on Gender by
Comfort Level for Tangibles.
34

Table 6
ANOVA Results for Ho2
SERVQUAL SS df MS F p η2
Tangibles_M
Gender .94 1 .94 1.09 .30 .01
Classification 7.24 3 2.41 2.79 .04 .05
Gender x Classification 3.45 3 1.15 1.33 .27 .02
Error 140.74 163 .86
Total 151.06 170
Tangibles_M
Gender .10 1 .10 .11 .74 .00
Comfort Level .29 1 .29 .32 .57 .00
Gender x Comfort Level .46 1 .46 .52 .47 .00
Error 149.33 167 .89
Total 151.06 170
The results for Hypothesis 2 showed that there was a statistically significant
difference in the main effect of Classification for Tangibles; the p-value was .04,
therefore, the null hypothesis was rejected.
Data Analysis for Hypothesis 3
Hypothesis 3 stated: “There is no significant difference between faculty and staff’
perception of computer support technician’s Reliability.” Hypothesis 3 was tested using
two sets of 2-ways ANOVA. One ANOVA was on Gender (male vs. female) X
Classification (full-time vs. part-time). The other ANOVA was on Gender (male vs.
35

female) X Comfort Level (very comfortable vs. comfortable). A homogeneity of variance
(Levene Test) was conducted. The significance level was .99 for Gender by
Classification, and .59 for Gender by Comfort Level. Both were greater than .05, which
means that they met the assumption.
Figure 5 provides a graphical representation of the Gender by Classification on
Reliability.
Figure 5. Gender by Classification on Reliability.
Figure 6 provides a graphical representation of the Gender by Comfort Level on
Reliability.
36

MaleFemale
Gender
6.20
6.00
5.80
5.60
Est
imat
ed M
arg
ina
l Mea
ns
ComfortableVery comfortableComfortLevel
Estimated Marginal Means of Reliability_M
Figure 6. Gender by Comfort Level on Reliability
Then, ANOVA were performed. The results of this ANOVA are showed in Table
7. The results showed F (3,163) = .51, p = .68 for Gender by Classification, and F
(1,167) = 4.82, p = .03 for Gender by Comfort Level. Thus, there was no statistically
significant difference on Reliability for Gender by Classification, but there was a
statistically significant difference in the interaction for Gender by Comfort Level.
37

Table 7
ANOVA Results for Ho3
SERVQUAL SS df MS F p η2
Reliability_M
Gender 1.57 1 1.57 2.34 .13 .01
Classification 3.15 3 1.05 1.56 .20 .03
Gender x Classification 1.02 3 .34 .51 .68 .00
Error 109.61 163 .67
Total 115.95 170
Reliability_M
Gender 1.40 1 1.40 2.15 .15 .01
Comfort Level .045 1 .05 .069 .79 .00
Gender x Comfort Level 3.14 1 3.14 4.82 .03 .03
Error 108.67 167 .65
Total 115.95 170
There is a statistically significant difference in the interaction of Gender by
Comfort Level for Reliability, p-value was .03; therefore, the null hypothesis was
rejected for Hypothesis 3.
Data Analysis for Hypothesis 4
Hypothesis 4 stated: “There is no significant difference between faculty and staff’
perception of computer support technician’s Responsiveness.” Hypothesis 4 was tested
using two sets of 2-ways ANOVA. One ANOVA was on Gender (male vs. female) X
38

Classification (full-time vs. part-time). The other ANOVA was on Gender (male vs.
female) X Comfort Level (very comfortable vs. comfortable). A homogeneity of variance
(Levene Test) were conducted. The significant level was .25 for Gender by
Classification and .86 for Gender by Comfort Level. Both were greater than .05, which
means that they met the assumption.
Figure 7 provides a graphical representation of the Gender by Classification on
Responsiveness.
MaleFemale
Gender
6.20
6.00
5.80
5.60
5.40
5.20
5.00
Est
imat
ed
Mar
gin
al M
ean
s
Staff - part timeStaff - Full timeFaculty-part timeFaulty-Full timeClassification
Estimated Marginal Means of Responsiveness_M
Figure 7. Gender by Classification on Responsiveness.
Figure 8 provides a graphical representation of the Gender by Comfort Level on
Responsiveness.
39

MaleFemale
Gender
6.00
5.80
5.60Est
ima
ted
Ma
rgin
al M
ean
s
ComfortableVery comfortableComfortLevel
Estimated Marginal Means of Responsiveness_M
Figure 8. Gender by Comfort Level on Responsiveness.
Then, ANOVA were performed. The results of this ANOVA are showed in Table
8. The results of ANOVA showed F (3,163) = .26, p = .85 for Gender by Classification,
and F (1,167) = 1.30, p = .26 for Gender by Comfort Level. Thus, there were no
statistically significant differences for Responsiveness for Gender by Classification and
Gender by Comfort Level.
40

Table 8
ANOVA Results for Ho4
SERVQUAL SS df MS F p η2
Responsiveness_M
Gender 091 1 .91 .83 .36 .01
Classification 4.68 3 1.56 1.43 .24 .03
Gender x Classification .87 3 .29 .26 .85 .01
Error 178.50 163 1.10
Total 185.72 170
Responsiveness_M
Gender .92 1 .92 .84 .36 .01
Comfort Level .224 1 .22 .21 .65 .00
Gender x Comfort Level 1.418 1 1.42 1.30 .26 .01
Error 182.78 167 1.10
Total 185.72 170
The results for Hypothesis 4 showed all p-value were great than .05. Hence,
there was no statistically significant difference between faculty members and staff
members on customers’ Responsiveness. Therefore, I failed to reject null Hypothesis 4.
Data Analysis for Hypothesis 5
Hypothesis 5 stated: “There is no significant difference between faculty and staff’
perception of computer support technician’s Assurance.” Hypothesis 5 was tested using
two sets of 2-ways ANOVA. One ANOVA was on Gender (male vs. female) X
Classification (full-time vs. part-time). The other ANOVA was on Gender (male vs.
41

female) X Comfort Level (very comfortable vs. comfortable). First, a homogeneity of
variance (Levene Test) was conducted. The significance level was .86 for Gender by
Classification and .65 for Gender by Comfort Level. Both were greater than .05, which
means that they met the assumption.
Figure 9 provides a graphical representation of the Gender by Classification on
Assurance.
MaleFemale
Gender
6.25
6.00
5.75
5.50
Est
ima
ted
Ma
rgin
al M
ean
s
Staff - part timeStaff - Full timeFaculty-part timeFaulty-Full timeClassification
Estimated Marginal Means of Assurance_M
Figure 9. Gender by Classification on Assurance.
Figure 10 provides a graphical representation of the Gender by Comfort Level on
Assurance.
42

MaleFemale
Gender
6.25
6.20
6.15
6.10
6.05
6.00
5.95
5.90
Est
ima
ted
Ma
rgin
al M
ean
s
ComfortableVery comfortableComfortLevel
Estimated Marginal Means of Assurance_M
Figure 10. Gender by Comfort Level on Assurance
Then, ANOVA was performed. The results of this ANOVA are showed in Table 9.
The results showed F (3,163) = .24, p = .87 for Gender by Classification, and
F (1,167) = 1.65, p = .20 for Gender by Comfort Level. Thus, there was no statistically
significant difference either on the main effect or on their interaction for Assurance for
Gender by Classification and Gender by Comfort Level.
43

Table 9
ANOVA Results for Ho5
SERVQUAL SS df MS F p η2
Assurance_M
Gender .69 1 .69 1.20 .28 .01
Classification 3.75 3 1.25 2.18 .09 .04
Gender x Classification .42 3 .14 .24 .87 .00
Error 93.63 163 .57
Total 98.21 170
Assurance_M
Gender .35 1 .35 .60 .44 .00
Comfort Level .02 1 .02 .03 .87 .00
Gender x Comfort Level .96 1 .96 1.65 .20 .01
Error 96.43 167 .58
Total 98.21 170
The research results for Hypothesis 5 showed that there is no statistically
significant difference between faculty members and staff members for customers’
Assurance. Therefore, I failed to reject null Hypothesis 5.
Data Analysis for Hypothesis 6
Hypothesis 6 stated: “There is no significant difference between faculty and staff’
perception of computer support technician’s Empathy.” Hypothesis 6 was tested using
two sets of 2-ways ANOVA. One ANOVA was on Gender (male vs. female) X
Classification (full-time vs. part-time). The other ANOVA was on Gender (male vs.
44
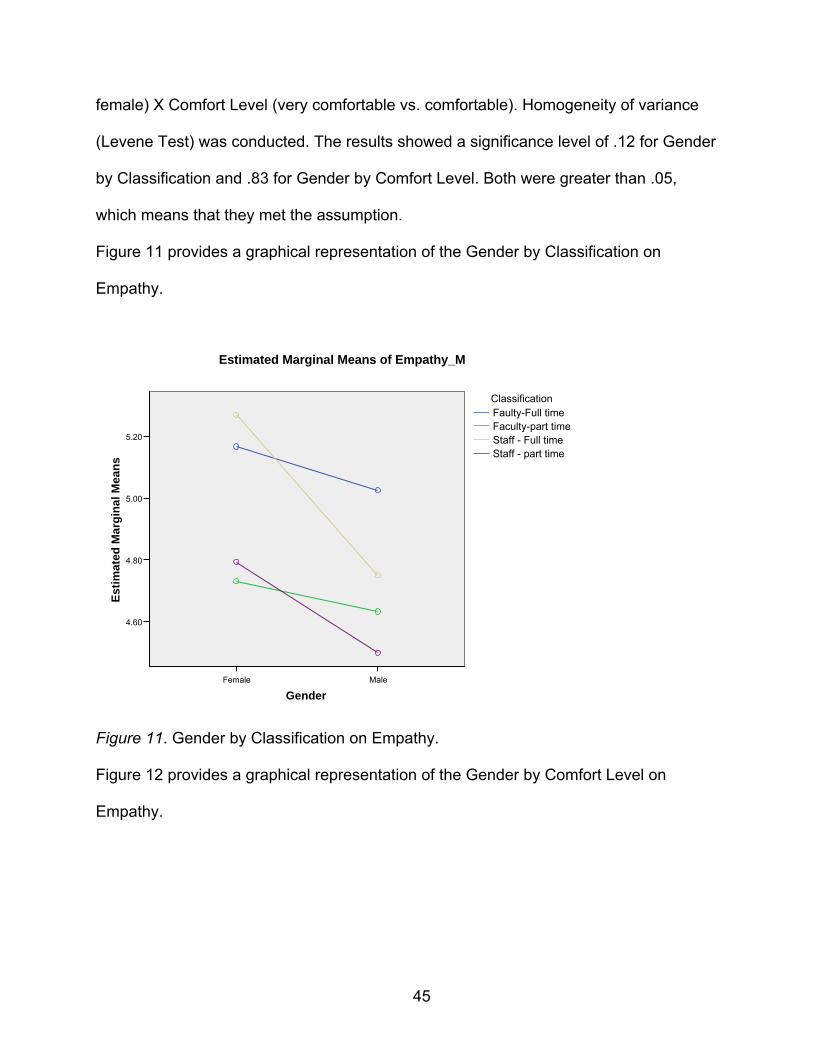
female) X Comfort Level (very comfortable vs. comfortable). Homogeneity of variance
(Levene Test) was conducted. The results showed a significance level of .12 for Gender
by Classification and .83 for Gender by Comfort Level. Both were greater than .05,
which means that they met the assumption.
Figure 11 provides a graphical representation of the Gender by Classification on
Empathy.
MaleFemale
Gender
5.20
5.00
4.80
4.60
Es
tim
ate
d M
arg
ina
l Me
an
s
Staff - part timeStaff - Full timeFaculty-part timeFaulty-Full timeClassification
Estimated Marginal Means of Empathy_M
Figure 11. Gender by Classification on Empathy.
Figure 12 provides a graphical representation of the Gender by Comfort Level on
Empathy.
45

MaleFemale
Gender
5.20
5.10
5.00
4.90
4.80
4.70
4.60
Est
imat
ed M
arg
ina
l Mea
ns
ComfortableVery comfortableComfortLevel
Estimated Marginal Means of Empathy_M
Figure 12. Gender by Comfort Level on Empathy.
Then, ANOVA was performed. The results of this ANOVA are showed in Table
10. The results showed F (3,163) = .16, p = .92 for Gender by Classification, and
F (1,167) =3.99, p = .05 for Gender by Comfort Level. These results showed a
statistically significant difference in the interaction effect for Empathy on Gender by
Comfort Level.
46

Table 10
ANOVA Results for Ho6
SERVQUAL SS df MS F p η2
Empathy_M
Gender 2.08 1 2.08 2.36 .13 .01
Classification 5.80 3 1.93 2.20 .09 .04
Gender x Classification .43 3 .14 .16 .92 .00
Error 143.48 163 .88
Total 154.87 170
Empathy_M
Gender 2.08 1 2.08 2.36 .13 .014
Comfort Level .09 1 .09 .10 .75 .001
Gender x Comfort Level 3.52 1 3.52 3.99 .05 .023
Error 147.32 167 .88
Total 154.87 170
The results for Hypothesis 6 showed that there was a statistically significant
difference on the interaction effect of Gender by Comfort Level, the p-value is .05, which
is significant. Therefore, the Null Hypothesis 6 was rejected.
Summary
The research survey was available online for five weeks. A total of 180 subjects
took the survey. After eliminating 9 persons by using standardized score three as the
criteria to eliminate the outliers, including three persons who chose uncomfortable as
their computer use comfort level. One hundred seventy-one subjects’ responses were
47

used for data analysis. Two sets (Gender by Classification and Gender by Comfort
Level) of 2 (Male and Female) X 2 (Full time vs. Part-time and Very Comfortable vs.
Comfortable), were used. Three statistical significant differences were found: one on the
main effect for the Classification of Tangibles, one for the interaction effect of Gender by
Comfort Level on Reliability and the other one for the interaction effect of Gender by
Comfort Level on Empathy. However, the overall satisfaction for Gender vs.
Classification and Gender vs. Comfort Level showed no significant differences.
48

CHAPTER 5
CONCLUSIONS
Overview
The purpose of this survey was to investigate the relationship of end-users’
satisfaction and their perception of computer support people. This survey was
conducted in the fall 2006 with 180 participants. All subjects were members of a college
at a major Texas university. There were six hypotheses presented in this study, and
three were found to be statistically significant.
Before this study was conducted, I mailed a letter to the publisher seeking
permission to use the SERVQUAL instrument for the study. The letter was returned with
no forwarding address. Since the book was published over a decade ago and the
publisher was no longer in business; the fair use of this survey was accepted.
The SERVQUAL instrument was introduced in 1985 by Parasuraman, Zeithaml,
and Berry. By the 1990’s, there had been several research projects and studies
conducted to test the validation of this survey. This research proved it to be a highly
valid instrument (see Chapter 3); a copy of this instrument is included (see Appendix A).
The original SERVQUAL survey asked each subject the same question twice—once to
evaluate the current support services quality and the second time to ask the subjects
their ideal idea of support services—and then analyzed the data. The SERVQUAL
survey is not a pre-test and post-test situation, but a real situation against expectation.
However, since a significant amount of research indicated that the SERVQUAL survey
was highly reliable, I decided to ask each subject only once to evaluate the current
49

support services and then analyze these results. This approach was also suggested by
Van Dyke, Prybutok, and Kappelman in their study from 1999:
The use of perception-minus-expectation gap scores was problematic.
Practitioners who want to measure Information System (IS) service quality should be
cautioned. We recommend that practitioners who utilize IS-SERVQUAL use the
perceived-performance-only scoring method. This method shows superior reliability and
predictive validity...the perceived-performance-only model of scoring was a better
predictor of both overall satisfaction and overall service quality than was the traditional
‘gap’ scoring method (p.11).
Research on pattern of several earlier studies which indicate that the perception-
only scores capture more of the variation, in both overall satisfaction and overall
perceived service quality. The indication is that the perception scores exhibit higher
predictive and convergent validity than the gap scores. (p. 8). Thus, the decision I
made to ask each subject to report only their level of satisfaction is justified.
By reading the subjects’ responses (see Appendix B) in the free-form writing at
the end of the survey, I judged that this survey was successful in measuring users’
satisfaction, mirroring Dotchin and Oakland (1994a, 1994b), which showed that
SERVQUAL was still used by many as the most appropriate method to measure
customer satisfaction.
Summary of Findings
Six hypotheses were evaluated by SPSS. Table 11 presents a summary of the
results. As shown in Table 11, only two of the null hypotheses were rejected.
50

Table 11
Summary of Results
Hypotheses Results
Ho1: There is no significant difference between customers’ satisfaction of computer support staff
Failed to Reject
Ho2: There is no significant difference between customers’ perception of computer support staff’s Tangibles
Rejected
Ho3: There is no significant difference between customers’ perception of computer support staff’s Reliability
Rejected
Ho4: There is no significant difference between customers’ perception of computer support staff’s Responsiveness
Failed to Reject
Ho5: There is no significant difference between customers’ perception of computer support staff’s Assurance
Failed to Reject
Ho6: There is no significant difference between customers’ perception of computer support staff’s Empathy
Rejected
Analysis Result by the Order of SERVQUAL Questions
The first four questions in SERVQUAL were grouped by dimensions named
Tangibles. An analysis of variance found a statistically significant difference for the
Classification (p <. 05) in the dimensions of Tangibles. Table 6 in Chapter 4 showed the
p-value was .04, and the effect size was .05. After examination of the statistical
analysis, 5% of the variances in Tangibles can be explained by Classification. In other
words, there was a 5% variation in Classification that was a statistically significant
difference. The results indicated that the perceptions of full-time employees were
different from part-time employees regarding their satisfaction on the up-to-date
51

equipment; physical facilities as visually appealing; employees as well-dressed; and
materials as visually appealing. It is very easy to understand, if the user was working
full-time, their point of view (their exposure to all of the Tangibles) on up-to-date
equipment would be different from the user only working part-time; the same is true for
the user working full-time, their focus on the visual appeal of their physical facilities will
be different from the user working part-time. For users working full-time, their idea of
well-dressed might be different from the user working part-time. Perhaps, users working
full-time may desire the computer support materials visual appeal to be different from
the part-time user. These realizations pointed me in the direction of including analyses
of users in different employment statuses. The results did reveal statistically significant
difference findings for the Tangibles regarding the computer support.
Questions 5 to 9 in SERVQUAL were grouped by a dimension called Reliability.
Reliability, as a concept, is a promise to do something. It is a follow-through of the
promise and includes a sincere interest in solving problems encountered along the way.
Reliability is also performing the service right the first time, providing services at the
promised time, and keeping accurate records of services performed. An analysis of
variance performed on the reliability data found a statistically significant difference
involving the interaction of Gender by Comfort Level. The results listed in Table 7 in
Chapter 4 showed the p-value was .03, and the effect size was .03. Therefore, there
was a 3% variance in Reliability that can be explained by the interaction of Gender and
Comfort Level. According to Cohen (1988), the effect size .03 is considered small. In
this study, there was a 3% users’ perception overlap, regardless of their gender and
52
how comfortable they reported they were in the totals for the Reliability dimension, with
a statistically significant difference from the rest of the group.
Questions 10 to 17 were grouped by the dimensions of Responsiveness and
Assurance, but an analysis of variance failed to find statistically significant differences in
these dimensions.
Questions 18 to 22 in SERVQUAL were grouped by a dimension called Empathy.
The concept of Empathy is to give individual attention while providing convenient
operating hours. Empathy also involves giving personal attention, always understanding
your specific needs, and putting the best interests of your customers at heart. The
analysis of variance for Empathy found a statistically significant difference on the
interaction of Gender and Comfort Level (p = .05). As mentioned in Chapter 2, the
technical support team is a small office, operated by 3 full-time employees, 1
administrative assistant, and 4 part-time student technicians. All employees of the
technical support team are enthusiastic about providing excellent support to its users.
However, because users perceive situations differently, the findings showed Gender
compared with different Comfort Levels to be significantly different. For example, a male
user may report the support experience with a high score for the Empathy dimension,
while the same support experience may reported by a female user as not adequate. At
times, some female users have been known to depend on their emotions to judge
situations. So, if they perceive service as lacking, their satisfaction score for Empathy
may be lower.
Over time, I have noticed that more female students take computer classes. In
addition, more female users seek computer help, in contrast to male users. Imagine this
53

situation: when a male user calls for computer help, their situation may be more serious
and they may suffer some level of frustration while they experience the result of their
own trial and error. In this situation, depending on the mood of the male user, they may
grade the support experience with a high score or a low score based on their degree of
calm in this situation. Using this same situation with a female user, she might feel more
confident about her abilities to trouble-shoot since she took computer classes. She may
think that she can fix the problem without help. However, after several unsuccessful
attempts, she may finally call for help and, at this stage; she may rate the support staff
higher on the Empathy dimension.
Below are several points that may affect the results of this study:
Different nature of the users’ work: Are the users doing clerical work all day long?
Or do they use the computer as just one part of their work load?
Work classification: Demands of a full-time user may be different from those on a
part-time user
Satisfaction opinions: Different opinions towards satisfaction
Acceptance of change: Different views about accepting new idea/changes
Education level: Different education levels of the users may result in different
points of view toward searching for solutions
Perception of support: Different perceptions towards support methods; need for
hands-on guidance or work-around solutions
Work schedules: Different work/shift hours may affect the availability of support
54

Different life experiences: Some users may have some different life experiences
before they come to the university; therefore, former support experiences may
affect their perceptions of computer support
Help requests: Some users may think they bother the support people when they
ask for help; some may think that the problem was created by the support people
to make sure they have a computer problem to solve
Recommendations
Today, office productivity is based on computer usage. The efficiency of using
technology is the key to success for any business, no matter whether that business is in
corporate America or in the field of education. Studying perceptions about computer
support is one important concept that can lead to strategies that contribute to the
success of the support organization.
The results presented in the previous chapters only indicated a fraction of the
whole support process. Appendix C showed the frequency histograms of SERVQUAL
instrument, it showed the mean averages on all five dimensions were all higher than 5
in 7 Likert scale. Sometimes they were negative skewed; it meant the scores were piled
up on the higher scale. In other words, more faculty and staff gave the support
technician high score. It may leaded to display the user were satisfied with the support
services.
In this study, I discovered that there was a statistically significant difference in
Tangibles, but the research was not clear in the exact direction it occurred. So, I
55

suggest that a future study be conducted to study a factor analysis to pinpoint the
significant difference.
Support staff cannot only focus on troubleshooting; they need to predict the
user’s need and provide timely response and try to meet the user’s expectations and
perceptions about their need. Timely communication is another key element for the
success of support services. For example, if the support personnel fix the problem but
fail to communicate with the user, it will affect the perception of user satisfaction.
Since this survey only represented one college, an extension of the use of the
SERVQUAL survey to other colleges and universities could reveal very different and
interesting results. In a very recent personal example, a user changed her job location
from the college to the president’s office at the university. She e-mailed me asking for
computer support help on her first day in her new job location. She noted that she
experienced a lack of computer support there. In her new working environment,
colleagues told her that was normal and the support team would show up in a day or
two. This is not an isolated example, as other end-users known to me have relayed
multiple incidents of inadequate computer support in other campus locations. For
instance, the normal duration of service trouble calls in one college is about two to three
days. So, as noted before, if the use of the SERVQUAL survey was extended to other
colleges and universities (or units within those institutions), it could reveal other
significant results.
There are two forms of computer support, one is centralized computer support
and the other one is decentralized computer support. This university is using a modified
decentralized method. Every college within the university has its own computer support
56

57
team and each team has access to centralized support from the computer and
information technology center (CITC) at the university. Even though research studies
have been conducted to find out which method is the best, this is still a debatable area.
However, with the result of this study, it seems that the current support system at this
college is working properly. Also, since computer support not only involves trouble-
shooting, but also problem-solving and teaching end-users how to deal with issues the
next time they come up, the end-user’s perception is a very important factor when
studying the satisfaction level of computer support. As noted before, this study only
focused on the interaction of Gender, Classification, and Comfort Level. Other factors
such as age, daily hours of computer usage, and length of computer usage may show
other areas of significant differences. This survey also included 22 personal items,
which may also provide some suggestions for future research.
Specific Recommendations for Future Study
Replicate this study and extend to other colleges or universities, by either
combining or comparing the data. It is hoped that future studies would find more
patterns for dimensions.
Replicate this study and analyze it with a quantitative measurement method. It is
hoped that specific positive characteristics for computer support personnel would
be revealed.
Further research is also needed to explore the links among attribute level, quality
level, value level, and personal value level, as well as their impact on the way
these constructs have been measured.

APPENDIX A
SERVQUAL ONLINE SURVEY
58

59

60

61

Online Survey - Selection Details
Dear faculty or staff: Thank you for your participation in this survey. The survey consists of 24 questions about you and 22 questions about computer support services in your department. It will take about 13 minutes to complete. All the data collected will be saved on secure web server and will not share with anyone. -Brenda Yu. Instruction: Please use your mouse to select your responses. Age Select one "1">under 21 "2">21-25 "3">26-30 "4">31-35 "5">36-40 "6">41-50 "7">51-60 "8">over 60 Gender:Female Male Female Classification "1">Faculty - Full-time "2">Faculty - Part-time "3">Staff - Full-time "4">Staff - Part-time Member of Department: "0">Select one "1">Academic Computing Services "2">College of Art and Science "3">College of Business Administration "4">College of Education "5">College of Engineering "6">College of Music "7">Honors College "8">College of Public Affairs and Community Service "9">School of Library and Information Sciences "10">School of Merchandising and Hospitality Management "11">School of Visual Arts "12">Toulouse School of Graduate Studies
62

Year(s) in position: Select one "1">Less than a year "2">1 - 3 years "3">3 - 5 years "4">5 - 10 years "5">10 - 15 years "6">15 - 20 years "7">20 - 30 years "8">30 - 40 years "9">40 - 50 years "10">50 - 60 years "11">60 + years Year(s) working with computer: "0">Select one "1">Less than a year "2">1 - 3 years "3">3 - 5 years "4">5 - 10 years "5">10 - 15 years "6">15 - 20 years "7">20 - 30 years "8">30 - 40 years "9">40 - 50 years "10">50 - 60 years "11">60 + years Average number of hours spent on a computer at work (daily): "0">Select one "1">Less than 1 hour "2">1 - 2 hours "3">2 - 3 hours "4">3 - 4 hours "5">4 - 5 hours "6">5 - 6 hours "7">6 - 7 hours "8">7 - 8 hours "9">8 - 9 hours "10">9 - 10 hours "11">10 - 11 hours "12">11 - 12 hours "13">over 12 hours
63

Daily_home_use: "0">Select one</option> "1">Less than 1 hour</option> "2">1 - 2 hours</option> "3">2 - 3 hours</option> "4">3 - 4 hours</option> "5">4 - 5 hours</option> "6">5 - 6 hours</option> "7">6 - 7 hours</option> "8">7 - 8 hours</option> "9">8 - 9 hours</option> "10">9 - 10 hours</option> "11">10 - 11 hours</option> "12">11 - 12 hours</option> "13">over 12 hours</option> Computer applications used: Email OfficeSuite>Productivity software (Word processing, Spreadsheet, Presentation, Database) WorkRelatedWebSearch Enterainment (News, weather, sports, interest, etc. How often do you use the computer support: "0">Select one "1">everyday "2">at least once a week "3">at least once a month "4">at least once a year "5">Never ComfortLevel: "0">Select one "1">very comfortable "2">comfortable "3">uncomfortable "4">very uncomfortable I prefer to learn by: "0">Select one "1">trial and error "2">being taught "3">using step-by-step instruction "4">books/references "5">support expert "6">using friend with knowledge "7">other
64

I use the computer to: "0">Select one "1">do not use at all "2">surf the web "3">learn new application "4">play games "5">get the News "6">other My learning preferences are: "0">Select one "1">listening "2">reading "3">iconic "4">direct expereience I consider my life style to be: "0">Select one "1">laid back "2">demanding "3">team player "4">adventurous "5">self-sufficient "6">other If I run into computer problems at work, I usually solve my problem: "0">Select one "1">by myself, search answers on the web "2">with the help of a technician in my office "3">let a technician remote control my computer I would like to receive more support on: "0">Select one "1">neither "2">hardware "3">software "4">both I would like more training on: "0">Select one "1">nothing "2">Operating Systems "3">productivity applications "4">general tasks "5">all of above "6">other
65

My preferred method of training is: "0">Select one "1">hands-on instructor lead session "2">Web based training I prefer a training/workshop schedule: "0">Select one "1">several times each semester in a set time "2">walk-in clinic "3">by appointment "4">web based I gain most of my computer knowledge through: "0">Select one "1">trial and error "2">formal training "3">web resources "4">family members "5">co-worker "6">workshops "7">books/reference "8">vendor/retail staff "9">TV shows When I get my computer serviced, it is important that my technician: -explains and clearly describes unfamiliar terminology -polite technician - well dressed When getting my computer repaired, it is important that: - job is done quickly, so I can go back to work ASAP - alternatives are given, so I can work around the problem in the future< - job is done efficiently, even though repairs take longer I would like to see my computer support services add: "0">Select one "1">training sessions on new computer application "2">remote desktop assistant while on the phone with technician "3">Security for my data "4">Faculty/staff resource learner center "5">More equipment can loan out "6">online chat services
66

SERVQUAL instrument: Q1. Computer support department has up-to-date equipment. Q2. Computer support department's physical facilities are visually appealing. Q3. Computer support department's employees are well dressed and appear neat. Q4. The appearance of the physical facilities of Computer support department is in keeping with the type of services provided. Q5. When Computer support department promises to do something by a certain time, it does so. Q6. When you have problems, Computer support department is sympathetic and reassuring. Q7. Computer support department is dependable. Q8. Computer support department provides its services at the time it promises to do so. Q9. Computer support department keeps its records accurately. Q10. Computer support department does not tell customers exactly when services will be performed. Q11. You do not receive prompt service from Computer support department's employees. Q12. Employees of Computer support department are not always willing to help customers. Q13. Employees of Computer support department are too busy to respond to customer requests promptly. Q14. You can trust employees of Computer support department. Q15. You feel confident your data will be protected in any transactions with Computer support department's employees. Q16. Employees of Computer support department are polite. Q17. Employees get adequate support from Computer support department to do their jobs well.
67

68
Q18. Computer support department does not give you individual attention. Q19. Employees of Computer support department do not give you personal attention. Q20. Employees of Computer support department do not know what you needs are. Q21. Computer support department does not have your best interests at heart. Q22. Computer support department does not have operating hours convenient to all their customers.

APPENDIX B
GENDER AND COMMENT
69

Gender Comment 1 1 1 1 1 1
1 I am new and have only needed support once. This was to update my macromedia flashplayer. The response was fast and friendly. I wouldve liked to have had a "N/A" option on the survey.
1 1 1 2 2 no comment....... 2 2 Good Job Coe Tech... 2
2 its amusing having a country boy as a tech support personel it keeps me amused!
2
Overall, I am very satisfied with the level of support that I receive from computer support. I have never had a computer issue that was not resolved in a timely manner, nor have I been assisted by a technician who was not curtious.
1 1 Thank you for the hard work. Good Luck with disertation! 1
1
Difficult to answer questions regarding appearance of facility (2, 4) - they always come to me. Same with records (9) and support (17) of employees within department. I would have preferred to leave blank, but due to forced answer,I marked all questio
1 1 1 1 1 I am a graduate assistant and do not use computer support. 1 2 1 1 1 1 1 1 1
70

1
Trainings on existing (not just new) software applications would be helpful as many of us do not understand all of the ways in which we can maximize basic our use of programs such as word, excel, powerpoint, etc.
1 employees of computer support department are always kind and very knowledgable.
1 1 1 2 2 2 2 2
2
Form was a little confusing due to the negatively worded questions (eg: 18, 19, 20, etc.) I suppose lower ratings are better in this case. Also I felt that many of the pull-downs should have been check boxes. For example: "I use the computer too" ...
1 1 1 1 1
1
I do not want or require extensive computer support on a regular basis. I prefer to solve most problems on my own. In cases where I do want and require assistance, I want support to be timely and effective. My schedule is quite demanding
1 1
1 College of Education provides exceptional computer support and has been available to my department. We have a good working relationship.thank you
1 College of Education provides exceptional computer support and has been available to my department. We have a good working relationship.thank you
1 All we need are working computers, loaded with latest software and 24/7 computer support. Rest we can figure out and explore with your assurance and backing. Thank you.
1 2 1
1
I wanted to leave number 9 blank because I could not answer number 9 since I do not know anything about the record keeping of Computer Services. You need an "I do not know category." The survey format required an answer to 9.
71

1
1 THE COE Computer Department strives to provide good service to its constituents.
1 1 1 1 1 1 1
1 The only time I had requested support is to download new software or programs necessary to facilitate my work needs. If we could download programs on our own, we would need support for easy tasks.
1
1 At times, I have felt that the tech thinks he know how to solve a problem before listening to the clients explication of the problem. Therefore, some miscommunication that hamper efficient problem-solving
1 1
1 I was forced to select something I would like Computer supprot to provide and I dont care to have any of those things added but selected one so I could submit the survey.
1 1 1 1 1 1 1
1
This might have been tested a bit more before using. Each response should have had a N/A, because while I infrequently use the computing services on the phone, I dont have any idea what the offices look like or whether the people dress a certain way.
1 The techs that Ive met are really nice gentlemen, and theyre very knowledgeable in their field. They are trustworthy and dependable, and have great personalities as well.
1 I have been very pleased over the years with the computer Service Department and appreciate the help.
1 Brenda, check your spelling and wording on some questions :-) 1 1 1 1
1 some of these questions seem like trick questions! wish there were choices such as "doesnt apply", or "I dont know"
72

1 1 1 1 1 1 2
2
My interaction with the Computer Support Department has been limited to having one program installed, so under the sub-heading SERVQUAL instrument:I cannot answer many of the questions adequately so I chose option4.
2
Professors should have the ability (authorization) to load software on their office computer without having to call Computer Support to come over and do it. This requirement is time-consuming and, quite frankly, ridiculous.
2 2
2 More classrooms need to contain work stations for student-teacher-computer/web interactions.
2 2
2 just a thought - you did not leave options for none of above on many questions -forcing an answer could invalidate many questions...
1 I have always found help, promptly and on an expert level when I have needed it.
1 I filled out this survey for the computer support personnel in COE. My answers for support personnel from webvista would be very different.
1 1 It would be nice to have 24/7 service, even if on the phone. 1 1 1 1 1
1 The Tech Dept has always been readily available to fix any problems whether caused by operator of equipment malfunction!
1
There is one and only one of the computer support personnel who is obnoxious. I asked for an explanation of something and he said "oh, you dont need to know that, never mind." He is loud and often rude. Everyone else is quite excellent.
1 The COE Tech Department is the best! Always very helpful, courteous and responds to problems very quickly. You are most appreciated!
1 1 1
73

1 1 1 1 1 1 1 1 1 1 1 1 1 1 1 1 1 1 1
1 Overall, I am VERY pleased with the support I get from the computer tech dept.
1 Each time I call the computer support department, the employees come so fast that usually they have to wait until I can get ready to show or tell them what I need.
1 I love Brenda and the COE techs; they have been wonderful throughout the time Ive worked with them, seven years!!
1 2 2 2 2
2 The negatively worded questions are hard to read. They word "not" should be BOLD and underlined
2 Brenda is a delight. She is a ray of sunshine in a cloudy world, and she is funny.... especially when she tries to say Ls. :-)
2 2 2 2 2
1
The COE/Tech Department is extremely knowledgable and helpful and will try to help everyone out promptly with a computer problem and be very polite in doing so. If they cant solve a problem, they will tell you so - such as a Dell problem, etc. Customer
1
74

75
1 I only have positive remarks to make about the Computer Support Department.
1 1 1 1 1 1 1 1
1 I am rarely in the Computer support Dept. offices and do not know what other support depts. might have or do so do not feel I can make any comments or comparisons.
2 I am very satisfied with the excellent computer support in the COE and mostly satisfied with the UNT computer support.
2 2 2 2 2 2 2 Computer support is very satisfactory. 2 2
2 COE TECH is very good and has taken care of most of my needs on a timely basis and with good results.

APPENDIX C
HISTOGRAMS - FREQUENCY
76

8.007.006.005.004.003.002.00
25
20
15
10
5
0
Fre
qu
en
cy
Mean =5.5044�Std. Dev. =0.94265�
N =171
Tangible_M
6.004.00
40
30
20
10
0
Fre
qu
en
cy
Mean =6.1029�Std. Dev. =0.82586�
N =171
Reliable_M
77

8.007.006.005.004.003.002.00
40
30
20
10
0
Fre
qu
ency
Mean =5.8962�Std. Dev. =1.04521�
N =171
Responsibility_M
7.006.005.004.00
50
40
30
20
10
0
Fre
qu
ency
Mean =6.2091�Std. Dev. =0.76008�
N =171
Assurance_M
78

6.004.00
60
40
20
0
Fre
qu
ency
Mean =6.0737�Std. Dev. =0.95447�
N =171
Empathy_M
7.006.506.005.505.004.504.00
20
15
10
5
0
Fre
qu
enc
y
Mean =5.9692�Std. Dev. =0.73904�
N =171
Satisfaction_M
79

REFERENCES
Anderson, K., & Zemke, R. (1991). Delivering knock your socks off service. New York: American Management Association.
Asubonteng, P., McCleary K. J., & Swan, J. E. (1996). SERVQUAL revisited: A critical review of service quality. Journal of Services Marketing, 10(6), 62-81.
Babakus, E., & Boller, G. W. (1992). An empirical assessment of the SERVQUAL scale. Journal of Business Research, 24, 254-263.
Babakus, E., & Mangold, G. W. (1992), Adapting the SERVQUAL scale to hospital services: An empirical investigation. Health Services Research, 26(6), 767-786.
Bailey, J. E., & Pearson, S. W. (1983). Development of a tool for measuring and analyzing computer user satisfaction. Management Science, 29(5), 530-545.
Bateson, J. E. G. (1995). Managing services marketing: Text and readings. Fort Worth, TX: Dryden Press Series in Marketing, Harcourt.
Bowman, B., Grupe, F. H., Moore, D. L., & Moore, W. D. (1993). An examination of sources of support preferred by end-user computing personnel. Journal of End User Computing, 5(4), 4-11.
Brown, T. J., Churchill, G. A., & Peter, J. P. (1993). Research note: improving the measurement of service quality. Journal of Retailing, 69(1), 126-39.
Cohen, J. W. (1988). Statistical power analysis for the behavioral sciences (2nd ed.). Hillsdale, NJ: Lawrence Erlbaum Associates.
DeLone, W. H., & McLean, E. R. (1992). Information systems success: The quest for the dependent variable. Information Systems Research, 3(1), 64-70.
Donnelly, M., & Shiu, E. (1999). Assessing service quality and its link with value for money in a UK local authority’s housing repairs service using the SERVQUAL approach. Total Quality Management, 10(4 & 5), S498-506.
De Michelis, G., Dubois, E., Jarke, M., & Matthes, F. (1998). A three faceted view of information systems. Communications of the ACM, 41(12), 64-70.
Dotchin, J. A., & Oakland, J. S. (1994a). Total quality management in services: Part 2 service quality. International Journal of Quality & Reliability Management, 11(3), 27-42.
Dotchin, J. A., & Oakland, J. S. (1994b). Total quality management in services: Part 3 Distinguishing perceptions of service quality. International Journal of Quality & Reliability Management, 11(4), 6-28.
80

Essex, P. A., Simha, R., Magal, S. R., & and Masteller, D. E. (1998). Determinants of information center success. Journal of Management Information Systems, 15(2), 95-117.
Ferris, N. (1998). Systems integration’s new look. Government Executive, 30(12), 57-58.
Finn, D. W., & Lamb, C. W. (1991). An evaluation of the SERVQUAL scales in a retailing setting. Advances in Consumer Research, 18, 338-357.
Galletta, D. F., & Lederer, A. L. (1989). Some cautions on the measurement of user information satisfaction. Decision Science, 20(3), 419-438.
Gaster, L. (1995). Quality in public services: Managers’ choices. Buckingham, England: Open University Press.
George, J. F., Kling, R., & Iacono, S. (1990). The role of training and support in desktop computing. Desktop information technology: Proceedings of the IFIP WG 8.2 Working Conference on Desktop Information Technology and Organizational Worklife in the 1990's (pp. 237-253).
Gloede, C. (1998). What you should be driving your network toward. Midrange Systems, 11(16), 20.
Govindarajulu, C. (1996). A model of computer user attitudes and intentions toward the source of support. (Doctoral dissertation, University of Mississippi, 1996).
Govindarajulu, C., & Reithel, B. J. (1998). Beyond the information center: An instrument to measure end-user computing support from multiple sources. Information Management, 33(5), 241-250.
Guimaraes, T., Gupta, Y. P., & Rainer, R. K., Jr. (1999). Empirically testing the relationship between end-user computing problems and information center success factors. Decision Science, 30(1), 393-413.
Gutierrez, C. F. (2000). An investigation of technical support issues influencing user satisfaction. (Doctoral dissertation, University of North Texas, 2000).
Hair, J. F., Black, W. C., Babin, B. J., Anderson, R. E., & Tatham, R. L. (2006). Multivariate data analysis (6th ed.). Upper Saddle River, NJ: Pearson Education, Inc.
Harris, D. P. (1995). People helping people: Examining the relationship between the support provider and the support recipient in an IS environment. (Doctoral dissertation, Claremont University, 1995).
Holzberg, C. (2004). A little help from our friends. Retrieved October 2006 from http://www.techlearning.com/story/showArticle.php?articleID=17300812
81

Kitchroen, K. (2004). Literature review: Service quality in educational institutions. ABAC Journal, 24(2), 14-25.
Ku, C. Y. F. (1994). A critical success factors study of management information systems downsizing: From management information systems managers' perspectives. (Doctoral Dissertation, Mississippi State University, 1994).
Lam, S. S. K. (1997). SERVQUAL: A tool for measuring patients’ opinions of hospital service quality in Hong Kong. Total Quality Management, 8(4), 145-152.
Lazar, G. (1999). There are many levels of customer support. Retrieved June 2007 from www.datamation.com/plugins/ workbench/nwinf/stories/9906dtminfra1.html
Lewis, B. R., & Mitchell, V. W. (1990). Defining and measuring the quality of customer service. Marketing Intelligence & Planning, 8(6), 11-17.
Magee, F. (1996, September 26). To improve customer satisfaction, lower service levels. Gartner Group.
Musthaler, L. (1996). Get ready to meet the challenge of continuous network uptime. Network World, 13(5), 48.
Nunnally, J. O. (1978). Psychometric theory. New York: McGraw-Hill.
Oldfield, B., & Baron, S. (2000). Student perceptions of service quality in a UK university business and management faculty. Quality Assurance in Education, 8(2), 85-95.
Pallant, J. (2001). SPSS survival manual. Buckingham, England: Open University Press, McGraw-Hill.
Parasuraman, A., Zeithaml, V. A., & Berry, L. L. (1985). A conceptual model of service quality and its implication. Journal of Marketing, 49, 41-50.
Parasuraman, A., Zeithaml, V. A., & Berry, L. L. (1988). SERVQUAL: A multiple-item scale for measuring consumer perceptions of service quality. Journal of Retailing, 64(1), 16.
Raha, A. K. (1996). Real-time communications in ATM networks. (Doctoral Dissertation, Texas A&M University, 1996).
Ritchie, S. M. (1994). Metaphor as a tool for constructivist science teaching. International Journal of Science Education, 16(3), 293-303.
Shahin, A. (2004). SERVQUAL and model of service quality gaps: A framework for determining and prioritizing critical factors in delivering quality services. Retrieved July 14, 2007, from www.qmconf.com/docs/0077.pdf
82

83
Slade, D. (2000). Why do they leave, why do they stay? Perceptions of service quality at a new university. ANZMAC 2000 visionary marketing for 21st Century: Facing the challenge. Retrieved June 2007, from http://smib.vuw.ac.nz:8081/www/ANZMAC2000/CDsite/papers/s/Slade1.PDF
Stockford, P. (1998). Internet and call centers: A match made in cyberheaven. Retrieved October 2006 from www.datamation.com/plugins/workbench/nwinf/stories/06callb.html
Szymanski, D. (2001). Customer satisfaction: A meta-analysis of the empirical evidence. Journal of the Academy of Marketing Science. 29(1), 16-35.
Thompson, H. (2004). Who Stole My Customer?? Winning strategies for creating and sustaining customer loyalty. Upper Saddle River, NJ: Pearson Prentice Hall.
Van Dyke, T. P., Prybutok, V. R., & Kappelman, L. A. (1999). Cautions on the use of the SERVQUAL measure to assess the quality of information systems services. Decision Sciences, 30(3), 11.
Wisniewski, M. (2001). Using SERVQUAL to assess customer satisfaction with public sector services. Managing Service Quality, 11(6), 380-388.
Wisniewski, M. & Donnelly, M. (1996). Measuring service quality in the public sector: the potential for SERVQUAL. Total Quality Management, 7(4), 357-365.
Yoon, S., & Suh, H. (2004). Ensuring IT consulting SERVQUAL and user satisfaction: A modified measurement tool. Information Systems Frontiers, 6(4), 341-351.