using scenarios in the california water plan
DESCRIPTION
Using Scenarios in the California Water Plan. Overview. Background Update 2005 scenario narratives Analysis performed for Update 2005 Scenarios in Update 2009. Background. - PowerPoint PPT PresentationTRANSCRIPT

1
Using Scenarios in the Using Scenarios in the California Water PlanCalifornia Water Plan
Uncertain Trends
0
10
20
30
40
1960 1980 2000 2020 2040
Historical
Curent Trends
Less ResourceIntensive
More ResourceIntensive

2
OverviewOverview
● Background● Update 2005 scenario narratives● Analysis performed for Update 2005● Scenarios in Update 2009

3
BackgroundBackground
● In a scenario process, managers invent and then consider, in depth, several varied stories of equally plausible futures. The stories are carefully researched, full of relevant detail, oriented towards real-life decisions, and designed (one hopes) to bring forward surprises and unexpected leaps of understanding Peter Schwartz, “The Art of the Long View,
Planning for the Future in an Uncertain World”

4
Schwartz’ View of ScenariosSchwartz’ View of Scenarios
● Serve as a tool for ordering one’s perceptions
● Evaluate different actions or responses based on different plausible futures
● Do not want to pick one preferred future or the most likely future
● Make strategic decisions that will be sound for all plausible futures

5
Water Plan Scenarios Water Plan Scenarios Represent Baseline ConditionsRepresent Baseline Conditions
● Water Plan Scenarios only consider conditions that: are plausible during planning horizon under
consideration affect future water demands or supplies the water community has little control over

6
Multiple Quantitative ViewsMultiple Quantitative Views
● Water Portfolios
Describe where water originates, where it flows, and what it is used for based on recent data
● Future Baseline Scenarios Describe expected changes by 2030 if water
managers do not take additional action
● Alternative Response Packages Describe packages of promising actions, predict
expected outcomes, and compare performance under each scenario
7
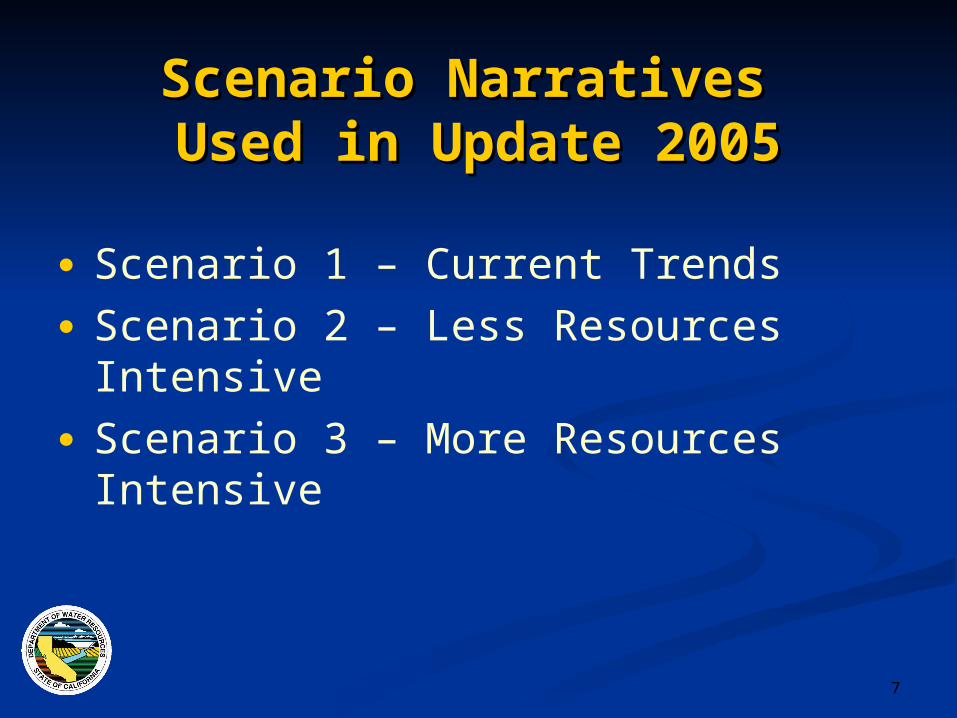
Scenario Narratives Scenario Narratives Used in Update 2005Used in Update 2005
● Scenario 1 – Current Trends● Scenario 2 – Less Resources Intensive● Scenario 3 – More Resources Intensive

8
Scenario 1Scenario 1Current TrendsCurrent Trends
● Recent trends continue for the following: Population growth and development patterns Agricultural and industrial production Environmental water dedication Naturally occurring conservation (like
plumbing code changes, natural replacement, actions water users implement on their own)

9
Scenario 2 Scenario 2 Less Resource IntensiveLess Resource Intensive
● Includes the following: Recent trends for population growth Higher agricultural and industrial production More environmental water dedication Higher naturally occurring conservation than
Current Trends (but less than full implementation of all cost-effective conservation measures available)

10
Scenario 3 Scenario 3 More Resource IntensiveMore Resource Intensive
● Includes the following: Higher population growth rate Higher agricultural and industrial production No additional environmental water dedication
(year 2000 level) Lower naturally occurring conservation than
Current Trends

11
Update Update 20052005
Table of Table of ScenarioScenarioFactorsFactors

12
Scenario Analysis Scenario Analysis Performed for Update 2005Performed for Update 2005
13
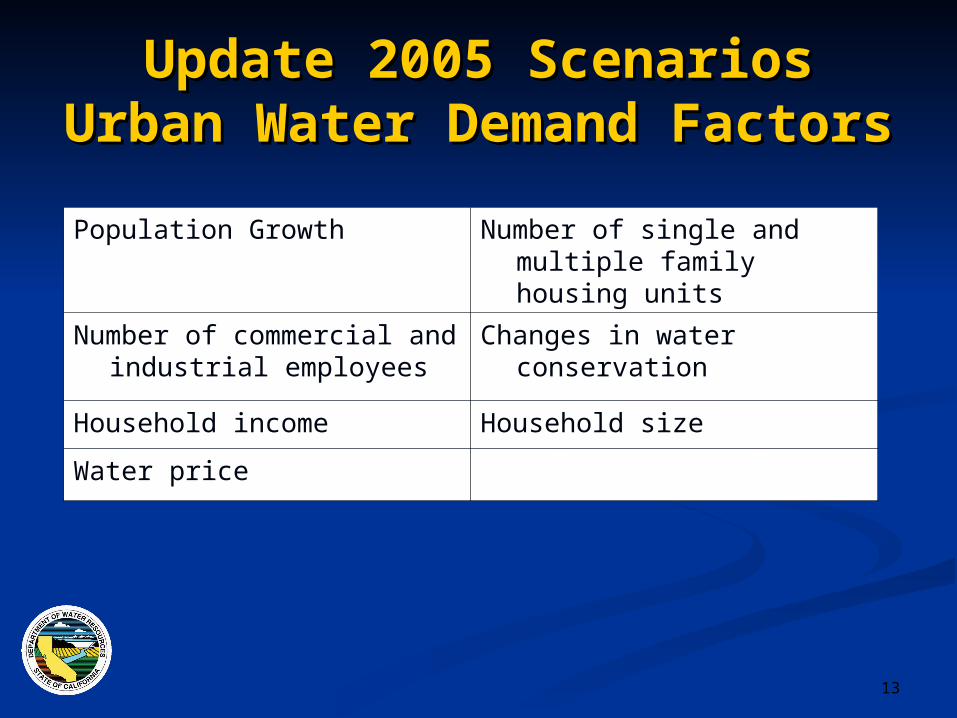
Update 2005 ScenariosUpdate 2005 ScenariosUrban Water Demand FactorsUrban Water Demand Factors
Population Growth Number of single and multiple family housing units
Number of commercial and industrial employees
Changes in water conservation
Household income Household size
Water price

14
Update 2005 ScenariosUpdate 2005 ScenariosPopulationPopulation
Year2000
CurrentTrends
LessResourceIntensive
MoreResourceIntensive
0
10
20
30
40
50
60P
op
ula
tio
n (
Mil
lio
ns)

15
Update 2005 ScenariosUpdate 2005 ScenariosHousing UnitsHousing Units
CurrentTrends
LessResourceIntensive
MoreResourceIntensiveYear
2000
0
2
4
6
8
10
12
14
16
18
20H
ou
sin
g U
nit
s (
Mil
lio
ns
)
SingleFamilyHouses
MultipleFamilyHouses

16
Update 2005 ScenariosUpdate 2005 ScenariosEmployeesEmployees
Year2000
CurrentTrends
LessResourceIntensive
MoreResourceIntensive
0
5
10
15
20
25
30
35E
mp
loye
es (
Mil
lio
ns)
CommercialEmployees
IndustrialEmployees

17
Update 2005 ScenariosUpdate 2005 ScenariosAgricultural Water Demand FactorsAgricultural Water Demand Factors
Irrigated land area Crop yield
Multiple crop area Irrigation practices
Changes in water conservation Water price
Agricultural economic markets
18
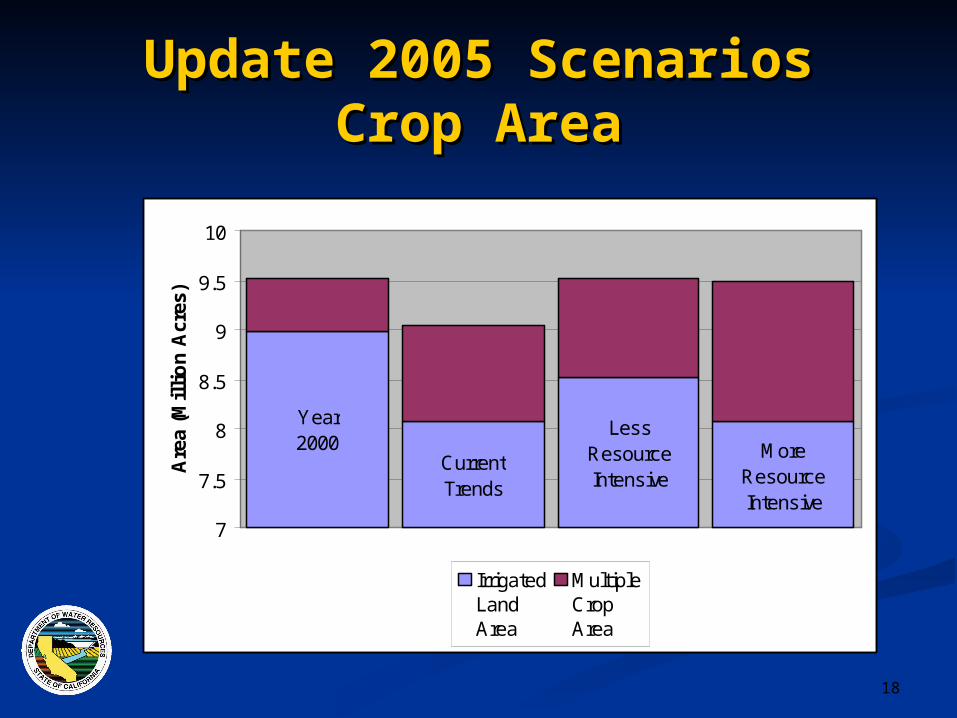
Update 2005 ScenariosUpdate 2005 ScenariosCrop AreaCrop Area
Year2000
CurrentTrends
LessResourceIntensive
MoreResourceIntensive
7
7.5
8
8.5
9
9.5
10
Are
a (M
illi
on
Acr
es)
IrrigatedLandArea
MultipleCropArea

19
Update 2005 ScenariosUpdate 2005 ScenariosInformation Sources for Environmental Objectives
Trinity River Main stem RestorationPlan ROD
Final Restoration Plan for theAnadromous Fish Restoration Program
Central Valley Project Improvement Act“B2” fishery goals
San Joaquin River restoration goals
Central Valley Project Improvement Act“Level 4” Refuge requirements
CALFED Bay-Delta ProgramEcosystem Restoration Program goals
San Joaquin River Vernalis flow goals
Year 2000 unmet environmental water objectives
Location Unmet Objective (TAF)
Trinity River (Lewiston) 344
American River (Nimbus) 55
San Joaquin River (Vernalis) 96
San Joaquin River (Below Friant) 268
Stanislaus River (Goodwin) 34
ERP Flow Objective 65
Level 4 Wildlife Refuge Supply 125
Total 987

20
Scenario Demand Changes StatewideScenario Demand Changes Statewide

21
Scenario Scenario Demand Demand Changes Changes
bybyRegionRegion

22
Sample Response PackagesSample Response Packages
● Pacific Institute Study “California Water 2030: An Efficient Future” www.pacinst.org/publications/
● UC Santa Barbara Bren School and RAND Corp Study “Rethinking Water Policy Opportunities in
Southern California” www.bren.ucsb.edu/academics/WaterPolicyProgram.htm

23
Sample Response PackagesSample Response Packages
● RAND Corporation Study “Presenting Uncertainty About Climate
Change to Water Managers” (Draft)

24
Update 2009 ScenariosUpdate 2009 ScenariosSome ConsiderationsSome Considerations
● Scenario themes and factors● Planning horizon / Time step ● Climate change● Drought conditions● Flood management● Others?

25
Next Steps on ScenariosNext Steps on Scenarios
● Develop narrative scenarios Advisory Committee, Regional Forums, and
Plenary
● Identify options for quantifying scenarios Statewide Water Analysis Network
● Include scenario narratives and factors in Assumptions and Estimates Report
26
Reference InformationReference Information
● http://www.waterplan.water.ca.gov Chapter 4, Volume 1, Update 2005 Volume 4 Article, “Quantified Scenarios of 2030
Water Demand”
● Rich Juricich [email protected] (916) 651-9225

27
Questions?Questions?