using network clustering to predict copy number variations
TRANSCRIPT

USING NETWORK CLUSTERING TO PREDICT COPY NUMBER VARIATIONS
ASSOCIATED WITH HEALTH DISPARITIES
BY
Yi Jiang
Li Yang Farah Kandah Professor of Computer Science Assistant Professor of Computer Science (Chair) (Committee Member)
Katherine Winters Senior Lecturer of Computer Science (Committee Member)

ii
USING NETWORK CLUSTERING TO PREDICT COPY NUMBER VARIATIONS
ASSOCIATED WITH HEALTH DISPARITIES
BY
Yi Jiang
A Thesis Submitted to the Faculty of the University of Tennessee at Chattanooga in Partial Fulfillment of the Requirements of the Degree of Master:
Computer Science
The University of Tennessee at Chattanooga Chattanooga, Tennessee
December 2014

iii
ABSTRACT
Substantial health disparities exist between African Americans and Caucasians in
the United States. Copy number variations (CNVs) are one form of human genetic
variations that have been linked with complex diseases and often occur at different
frequencies among African Americans and Caucasian populations. In this study, we
aimed to investigate whether CNVs with differential population frequencies can
contribute to health disparities from the perspective of gene networks. We inferred
network clusters from two different human gene/protein networks. We then evaluated
each network cluster for the occurrences of known pathogenic genes and genes located in
CNVs with different population frequencies, and used false discovery rates (FDRs) to
rank network clusters. This approach let us identify five clusters enriched with known
pathogenic genes and with genes located in CNVs with different frequencies between
African Americans and Caucasians. These clustering patterns predict four candidate
causal population-specific CNVs that play potential roles in health disparities.

iv
ACKNOWLEDGEMENTS
I would like to express my deepest gratitude to my advisor, Prof. Li Yang, for her
thoughtful guidance, warm encouragement, great patience, and financial support during
the whole period of my research. I appreciate her vast knowledge and skills, and her
assistance in writing this thesis.
I would like to thank my thesis committee members, Prof. Farah Kandah and Ms.
Katherine Winters for their excellent advises and detailed review during the preparation
of this thesis.
I would also like to thank Prof. Hong Qin at Spelman College, Atlanta, GA, for
thoughtful guidance, insightful discussion, correction of my writing, and the help to
develop my background in computational biology and genetics.

v
TABLE OF CONTENTS
ABSTRACT iii ACKNOWLEDGEMENTS iv LIST OF TABLES v LIST OF FIGURES vi LIST OF ABBREVIATIONS vii CHAPTERS
I. INTRODUCTION 1
1.1 Objectives of the Study 1 1.2 Health Disparities 1 1.3 Genome-Wide Association Studies 4 1.4 Copy Number Variations 5 1.5 Protein-Protein Interaction Networks 6 1.6 Network-Based Analysis 8 1.7 Contributions of the Study 10
II. MATERIAL AND METHODS 12
2.1 Network Clustering 13 2.2 Gene Mapping of CNVs and SNPs 14 2.3 Cluster Analyses 16 2.4 Biological Significance Analyses 20
III. RESULTS AND DISCUSSION 22
3.1 Network Clustering Results 22 3.2 Gene Mapping Results 23 3.3 Cluster Analyses Results 24
3.3.1 Clusters enriched with genes located in African American CNVs 30
3.3.2 Clusters enriched with genes located in Caucasian CNVs 31

vi
3.4 Plausible inks of population-specific CNVs in the identified Network Clusters to Health Disparities 32 3.4.1 Duplication of HSPB1 and Health Disparities in
African Americans 33 3.4.2 Duplication of ATP2A1 and Health Disparities in Caucasians 35
IV. CONCLUSION 36
REFERENCES 37 APPENDIX
A. CODES FOR GENE MAPPING OF SNPS AND CNV COORDINATES 44
B. CODES FOR RIGHT-TAILED FISHER’S EXACT TEST 46
C. CODES FOR FALSE DISCOVERY RATE CALCULATION 49 VITA 51

vii
LIST OF TABLES
2.1 Contingency table for Fisher’s exact test on pathogenic genes 17 2.2 Contingency table for Fisher’s exact test on CNV genes 17 3.1 Summary of biological networks 23 3.2 Results of gene mapping of SNPs and CNV coordinates 24 3.3 Top-ranked clusters from HPRDNet 26 3.4 Top-ranked clusters from MultiNet 27 3.5 Cluster analysis results for HPRDNet and MultiNet 28 3.6 Selected genes with potential roles in health disparities and their located CNVs 29 3.7 Enriched GO terms with CNV-genes in the identified network clusters 32 3.8 Associated diseases of genes with enriched GO terms 33

viii
LIST OF FIGURES
1.1 Death rates of selected ethnicities for five causes of death in the United States 2 2.1 Overview of our approach to identify CNVs associated with health disparities 13 3.1 Graph representations of selected clusters for biological significance analysis 28 3.2 Graph representations of cluster AA1, AA2 and AA3 31

ix
LIST OF ABBREVIATIONS
HGV, Human genetic variation
CNV, Copy number variation
SNP, Single nucleotide polymorphism
GWAS, Genome wide association studies
GSA, Gene set analysis
PPIN, Protein-protein interaction network
HPRD, Human protein reference database
PPI, Protein-protein interaction
AA, African American
CA, Caucasian
MCL, Markov Cluster Algorithm
CHD, Coronary Heart Disease
PANOGA, pathway and network oriented GWAS analysis
RA, Rheumatoid Arthritis
FDR, false discovery rate
GO, Gene ontology
OMIM, Online Mendelian Inheritance in Man
dbSNP, Single Nucleotide Polymorphism Database
SERCA1, Sarco/endoplasmic reticulum Ca2+-ATPase 1

1
CHAPTER I
INTRODUCTION
1.1 Objectives of the Study
In this study, we aim to investigate the association of health disparities and
genetic variations with different population frequencies, to better understand health
disparities between African Americans and Caucasians,
Here, we propose a novel network clustering based approach to associate
population-specific copy number variations (CNVs) and health disparities. First, we
obtain human gene/protein interaction networks and partition them into gene clusters.
Second, we search pathogenic single nucleotide polymorphisms (SNPs) and population-
specific CNV loci in genome database to generate gene lists. Third, clusters are ranked
based on results of gene enrichment tests for pathogenic genes and CNV-genes. At last,
we investigate the biological significance of clusters that were ranked at first place. We
will use this approach to identify CNVs that may contribute to health disparities between
African Americans and Caucasians in diseases.
1.2 Health Disparities
Health disparities refer to differences in health status between people grouped by
social or demographic factors, such as race, gender, income or geographic region. The
differences could be in the presence of disease distribution, health outcomes, quality of

2
health care and access to health care services. In United States, health disparities between
African Americans and other racial and ethnic populations are found in life expectancy,
death rates, and health measures. Figure 1.1 shows the death rates of selected ethnicities
for five causes of death in the United States. The death rates are per 100,000 population
and age-adjusted to the 2000 census. AI, AN and PI refer to American Indian, Alaska
Native, and Pacific Islander, respectively. As we can see, the death rates of African
Americans are found higher than those of other populations in heart diseases, prostate
cancer (in male), breast cancer (in female), and diabetes (National Center for Health
Statistics 2007; National Center for Health Statistics 2013) (Figure 1.1). According to a
recent study, eliminating health disparities would have reduced direct medical care
expenditures by about $230 billion and indirect costs associated with illness and
premature death by more than $1 trillion for the years 2003 to 2006 (LaVeist et al. 2011).
Figure 1.1 Death rates of selected ethnicities for five causes of death in the United States.
0
50
100
150
200
250
Heart Disease Prostate
Cancer*
Breast Cancer* Liver Disease Diabetes
De
ath
Ra
te p
er
10
0,0
00
po
pu
lati
on
Cause of Death
Death rates of selected ethnicities in US
Whites
African American
AI or AN
Asian or PI
Hispanic

3
Many factors contribute to health disparities (American Public Health
Association). People with different socioeconomic status, such as income, education and
occupation, will have different opinions on health practice and different access to healthy
diet. People living in rural area and/or with low income will have trouble to obtain
essential health care. People in different culture will have different living style, such as
different living habit and diet, which will affect disease prevalence and health treatment
outcome.
In addition, human genetic variations (HGVs) play a significant role in health
disparities (Fine et al. 2005; Ramos & Rotimi 2009). Human genes contain information
that is required to build, regulate and maintain our bodies. HGVs are permanent changes
in human genes and may cause alterations in an individual's phenotype, from physical
properties to disease risk. According to “out of Africa” model, modern humans speciated
in Africa and then migrated to other continents of the world (Stringer & Andrews 1988).
During the migration, genetic variations occurred and kept due to random chance, natural
selection, and other genetic mechanisms, at different frequencies from region to region
(Tishkoff & Verrelli 2003). It is believed that genetic variations are the main reasons of
many diseases, and thus different occurrence frequencies can lead to differences in
disease susceptibility or resistance among various populations. Studies on associations of
genetic variations and diseases are essential to understand disease etiology and health
disparities, and are greatly advanced by the completion of the International HapMap
Project (Ramos & Rotimi 2009). With the aid of modern genome sequencing techniques,
the HapMap contains information of common human genetic variants, such as where

4
these variants occur in our DNA, and how they are distributed within and among
different population, which can be used by researchers to link genetic variants to diseases.
1.3 Genome-Wide Association Studies
Genome-wide association studies (GWAS) are currently an effective approach to
identify diseases-associated genetic variations (Hirschhorn & Daly 2005; Wang et al.
2005). In GWAS, a group of diseased individuals is compared to a group of healthy
individuals for a large number of Single Nucleotide Polymorphisms (SNPs) (Clarke et al.
2011). The frequency of each allele is compared between two groups and a statistical test
is performed with a null hypothesis that no association exists between disease and the
SNP. Usually tests of millions of SNPs are carried out, which requires multiple
hypothesis testing procedures to control false positives (Dudbridge & Gusnanto 2008).
Although GWAS have revealed many disease-associated SNPs, only a few of them are
associated with moderate or large increase in disease risk, and some well-known genetic
risk factors have been missed (Williams et al. 2007). One possible reason is that GWAS
focus only on individual genetic variations and do not address complex gene interactions
(Moore & Williams 2009). Another possible reason is that the current statistical analysis
is “unbiased”, since it ignores available knowledge of disease pathobiology (Moore et al.
2010).
Several approaches tried to incorporate GWAS results with known biological
knowledge. One of them is called Gene Set Analysis (GSA) (Cantor et al. 2010; Lehne et
al. 2011; Wang et al. 2007), which associates variations in an entire set of genes with a
phenotype. A gene set is defined as a set of genes that are involved in common biological

5
processes or pathways, or as a set of interacting proteins identified from protein-protein
interaction networks (Lehne et al. 2011). In GSA, enrichment tests are performed by
comparing the frequency of significantly associated SNPs in a particular set of genes with
that among all other genes not in the set. Gene sets containing significantly more
associated SNPs will have closer association with the corresponding phenotypes. The
advantage of GSA is that it detects associations of the phenotype with a gene set, not
individual SNPs. Therefore it does not ignore SNPs that have low p-values but still
contribute to phenotypes, and it reduces the number of statistical tests and requires less
stringent multiple testing correction (Lehne et al. 2011).
1.4 Copy Number Variations
Unlike SNPs, which affect only one single nucleotide base, copy number
variations (CNVs) are duplications or deletions of relatively large genomic segments that
can contain one or more genes (Feuk et al. 2006; Freeman et al. 2006). The widespread
presence of CNVs in normal individuals was first reported in 2004 (Iafrate et al. 2004;
Sebat et al. 2004). And to date, over 100,000 non-overlapping human CNVs have been
identified, with the size varying from 50 base pair to more than one million bases pairs,
and they cover about 70% of the whole genome (MacDonald et al. 2014).
In early genetic association studies, CNVs have been associated with various
complex diseases (Feuk et al. 2006; Ionita-Laza et al. 2009). Updates on CNVs’ roles in
some diseases, such as psychoses (Lee et al. 2012), autism (Wang et al. 2013),
autoimmunity (Olsson & Holmdahl 2012) and schizophrenia (Hosak et al. 2012), have
been reviewed recently. Computational tools and methods have been developed to help

6
address the potential roles of CNVs in human diseases. The CNVannotator was
developed to provide considerable capabilities for researchers to annotate specific CNVs
in a reliable and efficient manner (Zhao & Zhao 2013). The NETBAG+ algorithm was
developed to search for strongly cohesive gene clusters affected by CNVs, using a
likelihood network constructed based on a combination of various functional descriptors.
(Gilman et al. 2012). Recently, it is reported that CNVs can occur at different frequencies
between African Americans and Caucasians (McElroy et al. 2009), and naturally the
question about the potential roles of CNVs in health disparity is raised.
1.5 Protein-Protein Interaction Networks
Protein-protein interactions (PPIs) play diverse roles in biology. It is observed that
proteins seldom carry out their function in isolation, and usually proteins involved in the
same cellular processes interact with each other (von Mering et al. 2002). Advanced
high-throughput technologies, such as yeast-two-hybrid screening, mass spectrometry,
and protein microarray chip technologies, have generated huge data sets of protein-
protein interactions (von Mering et al. 2002).
Several databases have been constructed as repositories for experimentally
discovered protein interactions (Mathivanan et al. 2006). PPIs are incorporated into PPI
databases through curation from the literatures by biologists, or through direct deposit by
the investigators before their publication. For example, Human Protein Reference
Database (HPRD) is a joint project between the Institute of Bioinformatics in Bangalore,
India and the Pandey lab at Johns Hopkins University in Baltimore, USA. HPRD
contains annotations related to human proteins based on experimental evidence from the

7
literature (Mishra et al. 2006; Peri et al. 2004; Prasad et al. 2009). HPRD includes not
only PPIs, but also interactions between proteins and other small molecules, as well as
information about post-translational modifications, subcellular localization, protein
domain architecture, tissue expression and association with human diseases. PPIs in
HPRD are usually direct physical interactions. Pairwise interactions are often represented
by undirected links in a graph model of network. Some databases contain indirect genetic
or regulatory interactions, and some contain directional interactions such as those in
phosphorylation, metabolic, signaling and regulatory networks. In one study, various
interaction data have been put together to construct a unified global network named
MultiNet (Khurana et al. 2013).
Protein-protein interaction (PPI) data can be represented in the form of networks,
in which nodes are proteins and edges are interactions. The protein-protein interaction
network (PPIN) can help understand the basic scheme of cell functions by correlating the
components of the network with their cellular functions, which can be done by clustering
processes (Lin et al. 2007; Pizzuti et al. 2012; Wang et al. 2010). In PPIN, a cluster is a
set of genes that share a large number of interactions, and the clustering process is to
group genes into clusters which contain more interactions among genes in the same
cluster than in different clusters. Clustering process can identify both protein complexes
and functional modules (Lin et al. 2007; Pizzuti et al. 2012; Wang et al. 2010). Protein
complexes are groups of proteins that bind to each other at the same time and place,
while functional modules consist of proteins that participate in the same cellular process
through interactions between themselves at a different time and place. Usually the PPINs
do not contain information about when and where proteins interacts, therefore protein
8
complexes and functional modules are not treated differently in clustering processes. The
results of clustering process of PPINs can help to infer the principal function of each
cluster from the functions of its members, and suggest possible functions of cluster
members based on the functions of other members.
Many distance-based or graph-based clustering algorithms were developed to
cluster PPINs (Lin et al. 2007; Pizzuti et al. 2012; Wang et al. 2010). The Markov
Clustering (MCL) algorithm is a fast, scalable, and unsupervised clustering algorithm,
which simulates stochastic flows in graphs (van Dongen 2000). The algorithm simulates
random flows within a graph by alternation of two operations called expansion and
inflation. In expansion, the flow moves within the same dense regions or out to other
dense regions. The inflation operation strengthens the flow within the dense regions and
weakens the flow out of the dense regions. The expansion and inflation steps are repeated
until a steady state is reached. A recent study compared MCL with other three clustering
algorithms, restricted neighborhood search clustering (RNSC), super paramagnetic
clustering (SPC) and molecular complex detection (MCODE), on six PPINs to detect
previously annotated gene clusters (Brohee & van Helden 2006). The conclusion was that
MCL algorithm outperformed the other algorithms in the extraction of complexes from
interaction networks.
1.6 Network-Based Analysis
Gene/Protein interaction networks combined with GWAS data can help
understand complex biological activities and cellular mechanisms of complex diseases
(Barabasi et al. 2011; Halldorsson & Sharan 2013; Sharan et al. 2007; Vidal et al. 2011;

9
Wang et al. 2011). This is based on the assumption of “guilt by association”, which
means that genes associated with the same or related functions or diseases tend to interact
with each other and cluster together with high connectivity in networks (Altshuler et al.
2000; Oliver 2000).
One example of using PPIN to identify disease-associated genes was reported in a
study of incident Coronary Heart Disease (CHD) (Jensen et al. 2011). In this study, an
experiment-derived PPI database InWeb was used to produce unbiased protein complexes
and corresponding gene sets, which were then ranked based on results of enrichment tests
of CHD-associated genes. In the identified gene set, five out of 19 genes were involved in
abnormal cardiovascular system physiological features, and pathways related to blood
pressure regulation were significantly enriched.
Another methodology that utilizes the PPINs to discover disease associated
clusters is called the pathway and network oriented GWAS analysis (PANOGA), which
combines GWAS data with current knowledge of biochemical pathways, PPINs, and
functional and genetic information of selected SNPs (Bakir-Gungor & Sezerman 2011).
In their study, genes related to significant SNPs from GWAS data were identified and
were assigned with functional attributes, which were used in the process of identifying
clusters associated with the disease. Then, genes in one identified cluster were tested
whether they are part of important pathways. The application of this methodology on
Rheumatoid Arthritis (RA) dataset identified new RA-associated pathways, in addition to
pathways previously identified by GWAS analysis. The newly identified pathways were
found to include many genes that are known to be used as drug targets for the treatment
of RA. Moreover, new genes have been identified to be associated with RA.

10
Protein interactions could provide important clues to help illustrate SNP’s
functional association (Huang et al. 2010). Protein interaction network was combined
with other traditional hybrid features, such as sequence, structure and pathway properties,
and it was used to establish predictors using hundreds of those features. These predictors
can correctly identify around 80% of known disease-associated SNPs and is valuable to
predict undiscovered disease-associated SNPs.
In another approach, a genome-scale functional gene network, named HumanNet,
was constructed by incorporating gene expression, protein interaction, sequence and other
genomic data to prioritize candidate disease genes, which can facilitate both seed gene-
based and GWAS-based disease association studies (Lee et al. 2011). In seed gene-based
approach, gene connections in the network were assigned with weights, calculated by
using label propagation algorithms based on their distance to the seed genes. Genes
connected to seed genes with larger weights were be considered as more likely to be
associated with target diseases. Although for GWAS data there are no definite seed genes,
this approach can still boost the power of association analysis by using a different ranking
score (Lee et al. 2011). In the analysis of Crohn’s disease and type 2 diabetes, the
HumanNet not only boosted the identification of correct associations, but organized the
associated genes into processes, which arouse attentions to genes that were not
significantly identified in GWAS.
1.7 Contributions of the Study
Although genetic factors play a crucial role in health disparities, only a few
association studies have been reported in common complex diseases, such as breast

11
cancer (Long et al. 2013), prostate cancer (Bensen et al. 2014; Bensen et al. 2013; Xu et
al. 2011), type 2 diabetes (Ng et al. 2014) and vascular diseases (Wei et al. 2011). In
order to better understand health disparities between African Americans and Caucasians,
we aim to investigate the association of health disparities and genetic variations with
different population frequencies.
Here, we propose a novel network clustering based approach on CNVs for health
disparities. First, we choose to focus on CNVs. Although CNVs are one important type of
genetic variations, and can occur at different frequencies among African Americans and
Caucasians, no association studies have been reported so far to our best knowledge.
Therefore, this work is the first study on association of CNVs and health disparities.
Second, our approach is on gene level, and pathogenic SNPs and population specific
CNV loci are mapped to corresponding gene names. Current GWAS on health disparities
still focused on individual SNPs, but we choose to focus on genes, because only a small
fraction of the genetic heredity of most diseases can be explained by the SNPs, and a
gene-based approach can allow us using the information encoded by protein interaction
networks (Lee et al. 2011). Third, association analysis in our approach uses gene clusters
inferred from gene networks, which is based on the rationale that interacting genes often
have the same functions or participate in the same biological processes. In addition,
unlike common Gene Set Analysis (GSA) studies that compares significantly associated
SNPs (Cantor et al. 2010; Lehne et al. 2011; Wang et al. 2007), our novel approach
compares the frequency of pathogenic genes or population specific CNV related genes
between clusters to evaluated the relationship between clusters and diseases or CNVs.

12
CHAPTER II
MATERIALS AND METHODS
This chapter introduces materials (gene/protein networks and gene sets) we
collected and prepared for this study, and methods we used in clustering process, cluster
analyses and biological significance analysis.
Our overall work flow is shown in Figure 2.1. To identify potential CNVs
associated with health disparities, our basic idea is to identify gene clusters that are
enriched with both pathogenic genes and genes located in population-specific CNVs.
Health disparities in diseases associated with identified clusters could be considered as
results of the occurrence of corresponding CNVs. Specifically, we first obtained two
human gene/protein networks and partitioned them into gene clusters. We then identify
disease-associated genes and genes located in population-specific CNVs in those clusters.
Statistical tests were performed on each cluster to estimate its significances of containing
pathogenic genes and genes in population-specific CNVs. Finally, we ranked gene
clusters based on false discovery rates (FDRs). Top-ranked clusters were enriched both
for pathogenic genes and for genes in CNVs with differential frequencies between
African-Americans and Caucasians. These clusters were then searched for enriched Gene
Ontology (GO) terms and related disease phenotypes to identify corresponding biological
significance.

Figure 2.1 Overview of our approach to identify CNVs associated with health disparities
2.1 Network Clustering
We obtained two human
Reference Database (HPRD)
another from MultiNet (Khurana et al. 2013
HPRDNet) is one of the largest human gene/protein interaction networks, and
only physical protein-protein interactions (PPIs)
including PPI, phosphorylation,
These two networks share 8468 genes (89.6% of HPRDNet and 58.6% of MultiNet)
only 8769 interactions (23.8% of HPRDNet and 8% of MultiNet).
were both partitioned into gene clusters using the M
13
1 Overview of our approach to identify CNVs associated with health disparities
human gene/protein networks, one from Human Protein
Reference Database (HPRD) (Mishra et al. 2006; Peri et al. 2003; Prasad et al. 2009
Khurana et al. 2013). The HPRD network (referred to
is one of the largest human gene/protein interaction networks, and
protein interactions (PPIs). The MultiNet is a unified network
phosphorylation, metabolic, signaling, genetic and regulatory networks.
8468 genes (89.6% of HPRDNet and 58.6% of MultiNet)
only 8769 interactions (23.8% of HPRDNet and 8% of MultiNet). These two networks
into gene clusters using the Markov Cluster (MCL) Algorithm
1 Overview of our approach to identify CNVs associated with health disparities
otein
Prasad et al. 2009) and
to as
is one of the largest human gene/protein interaction networks, and contains
network
metabolic, signaling, genetic and regulatory networks.
8468 genes (89.6% of HPRDNet and 58.6% of MultiNet) but
These two networks
Algorithm (van

14
Dongen 2000). MCL (version10-201) was installed and run in an Ubuntu 11.10 system.
The following command was used to run clustering:
mcl <network> --abc -I <I value> --force-connected=y -o <result>
Option <network> refers to the input file that contains the gene/protein interaction
network. In the input file, each line contains a pair of gene names, separated by a tab
space, which represent a gene-gene interaction. Option <I value> refers to the inflation
parameter I, which was from 1.1 to 2.0 with a step of 0.1. Option <result> refers to the
output file to which the clustering results will be saved. In the output file, each line
contains a set of gene names separated by a tab space, which are member of a cluster.
2.2 Gene Mapping of CNVs and SNPs
Two sets of genes were used in this study: genes located in population-specific
CNVs and pathogenic genes. Currently, there are no ready-made sources containing
information of these genes. However, coordinates of disease-associated SNPs and
population-specific CNVs were available and were searched in the UCSC Genome
Database (Karolchik et al. 2014) through its MySQL API to obtain the corresponding
gene name sets. All works were done using codes in Java. The following Java statements
were used to establish the connection to UCSC Genome Database MySQL interface:
// setup connection to UCSC Genome Database String username = "genome";
String password = "";
String url = "jdbc:mysql://genome-mysql.cse.ucsc.edu/hg19"; Class.forName("com.mysql.jdbc.Driver"); Connection con = DriverManager.getConnection(url, username,
password);

15
CNV coordinates were obtained from a CNV map in African Americans and
Caucasians (McElroy et al. 2009). There are three types of CNVs in this map: (1) CNVs
only occur in African Americans, (2) CNVs only occur in Caucasians, and (3) CNVs
occurred in both African Americans and Caucasians. To simplify the analysis, we further
partitioned the last type: CNVs that occurred more than 50% in African Americans or in
Caucasians were combined with the first and second types of CNVs, respectively. This
repartition resulted in two modified CNV sets with differential population frequencies.
The coordinates of these CNVs were then searched in the UCSC Genome Database
through its MySQL API to obtain the corresponding gene sets. The SQL statements were
formed in Java codes (APPENDIX A) and submitted, in which begin, end, and chrom
refer to the starting positions, ending positions and chromosomes of the CNVs,
respectively:
// search related genes of CNVs
select distinct X.geneSymbol, G.chrom, G.txStart, G.txEnd from knownGene as G, kgXref as X where ((G.txStart>begin AND G.txEND<end or
(G.txStart>begin AND G.txStart<end or (G.txEND>begin AND G.txEND<end or
(G.txStart<begin AND G.txEnd>end AND
X.kgId = G.name AND G.chrom = chrom);
For simplicity, CNVs that occur more frequently in African Americans were called
African-American CNVs or CNV_AA; CNVs that occur more frequently in Caucasians
were called Caucasian CNVs or CNV_CA.
Disease-associated SNPs were retrieved from a file, OmimVarLocusIdSNP.bcp,
obtained from the FTP site of Single Nucleotide Polymorphism Database (dbSNP)
(Sherry et al. 2001). Coordinates of these SNPs were then queried against the MySQL

16
API of the UCSC Genome Database to identify genes in which those SNPs are located.
The following SQL statements were composed in Java codes (see APPENDIX A) and
submitted, in which SNP refers to the RSid of the SNPs:
//search related genes of SNPs. select distinct S.name, X.geneSymbol from snp138 as S, knownGene as G, kgXref as X
where S.name = SNP AND X.kgId = G.name AND S.chrom = G.chrom AND G.txStart <= S.chromStart AND G.txEnd >= S.chromEnd;
This identified gene set was termed as pathogenic genes.
2.3 Cluster Analyses
Clusters were obtained from both HPRDNet and MultiNet using MCL with a
range of ten inflation parameters. For each cluster, contingency tables were constructed
using the numbers of pathogenic genes and population-specific CNV-related genes.
Table 2.1 is for pathogenic significance test, and Table 2.2 is for tests of enrichment
significance of CNVrelated genes (CNV_AA or CNV_CA genes). Q and q are the
number of pathogenic genes in the whole networks and that in current cluster,
respectively. N and m are the number of genes in whole networks and that in current
cluster, respectively. S and s are the number of CNV_AA or CNV_CA genes in the
whole networks and that in current cluster, respectively.
In statistics, a contingency table is a type of table that displays the frequency
distribution of multiple variables, usually in a two by two format. The significance of the
difference between the two proportions (derived based on observed frequencies) can be
evaluated by various statistical tests, such as Pearson's chi-squared test and Fisher's exact

17
test. If the proportions in the different columns are significantly different between rows
(or vice versa), we say that there is a contingency between the two variables. In our case,
we want to know whether a cluster contains more pathogenic genes or population-
specific CNV-related genes than all of the other clusters. If it does, we say this cluster is
enriched with such genes and thus has stronger connections to diseases or is more likely
to be affected by population-specific CNVs. If a cluster is found to be significant in both
enrichment tests, it will be of most interest to us.
Table 2.1
Contingency table for Fisher’s exact test on pathogenic genes
Pathogenic Genes Non-pathogenic Genes Total
Genes in this cluster q m-q m
Genes in other clusters Q-q N-Q-m+q N-m
Total Q N-Q N
Table 2.2
Contingency table for Fisher’s exact test on CNV genes
CNV Genes Non-CNV Genes Total
Genes in this cluster s m-s m
Genes in other clusters S-s N-S-m+s N-m
Total S N-S N
In this study, right-tailed Fisher’s exact tests were applied to these contingency
tables to calculate enrichment significance of pathogenic genes, CNV_AA or CNV_CA
genes, respectively. Fisher's exact test is a statistical test used in the analysis of

18
contingency tables. It is valid for all sample sizes, but in practice it is employed mostly
when sample sizes are small, which is the main reason it is chosen in for our analyses.
Using Table 2.1 as an example, the null hypothesis H0 is that the proportion of
pathogenic genes in one cluster less than or equals to that in all other clusters, and the
alternative hypothesis H1 indicates that this pathogenic occurrence in this cluster is more
than random expectation:
�� : �
��
� �
�
�� : �
��
� �
�
in which Q and q are the number of pathogenic genes in the whole networks and that in
current cluster, respectively, and N and m are the number of genes in whole networks and
that in current cluster, respectively. In other words, if the null hypothesis is true, we
would have
� ��
× �
The question we ask is: what is the probability that the observed q value is larger than the
expected value in the null hypothesis? The right-tailed Fisher’s exact test will give the
answer: if the p-value is small (common cutoff values are 0.001, 0.01, 0.05, or 0.10), we
can say that in this cluster pathogenic genes were significantly enriched. The smaller the
p-values, the more significant the enrichment is. The right-tailed Fisher’s exact tests were
performed in the R statistical environment (R Development Core Team 2013), with the
following R statements composed in Java codes (see APPENDIX B) and submitted to the
R engine:

19
// pathogenic gene enrichment tests. cluster = c(q, m-q);
other = c(Q-q, N-Q-m+q); tb = rbind(cluster, other); fisher.test(tb, alternative="greater")$p.value;
// population-specific CNV-related gene enrichment tests. cluster = c(s, m-s);
other = c(S-s, N-S-m+s); tb = rbind(cluster, other); fisher.test(tb, alternative="greater")$p.value;
The right-tailed Fisher’s exact tests were performed to each cluster in each
clustering results, which led to the multiple comparisons problem. The multiple
comparisons problem, or multiple testing problem, occurs when a set of statistical tests
are performed simultaneously (Miller 1981), in which the null hypothesis are more likely
to be incorrectly rejected based on individual tests when all tests were considered as a
whole. The False discovery rate (FDR) control is a statistical method to correct for
multiple comparisons. In a list of tests, FDR procedures are designed to control the
proportion of incorrectly rejected null hypotheses, i.e. “false discoveries” (Benjamini &
Hochberg 1995). There are many statistical procedures that use p-values to estimate or
control the FDR, such as Benjamini-Hochberg procedure (Benjamini & Hochberg 1995)
and Q-value procedure (Storey et al. 2004). However, most of them assume that p-values
are continuously distributed and based on two-sided tests. Therefore, it is difficult to
reliably estimate the FDR when the p-values are discrete or based on one-sided tests.
Since p-values in our study are discrete and based on one-sided tests, a proper FDR
calculation procedure needs to be carefully chosen. The Robust FDR Routine does not
rely on the assumptions that tests are two-sided or yield continuously p-values, and was
shown to have excellent performance in a series of data (Pounds & Cheng 2006). Based
20
on obtained p-values from the right-tailed Fisher’s exact tests, we calculated FDRs using
the Robust FDR Routine in the R statistical environment. The following R statements
were composed in Java codes (see APPENDIX C) and submitted to the R engine:
// Run robust FDR routine. // p is the vector of all sorted p-values.
robust.fdr(p, discrete=T, use8=F)$fdr";
Ranking were applied to clusters with p-value<0.10 and FDR<0.20 in both
enrichment tests for pathogenic genes and population-preferred CNVs genes. Assuming
both tests are independent, the FDR values were multiplied and the products were used to
rank the network clusters.
The same cluster analysis procedure was applied to each clustering results with
different MCL inflation parameters. For clarity, we focused our biological significance
analyses on clusters that were consistently ranked at the first place with different MCL
inflation parameter values.
2.4 Biological Significance Analyses
To understand the biological significance of the clusters, their corresponding
Gene Ontology (GO) terms were analyzed. Gene ontology is a project to unify the
representation of gene and gene product attributes (Gene Ontology Consortium 2008).
More specifically, the project aims to develop and maintain the vocabulary of gene and
gene product attributes, annotate genes and gene products, and provide tools for data
access and functional interpretation. GO terms describe properties of genes and their
products and are grouped into three domains: cellular component (where they locate),
molecular function (what they do at the molecular level), and biological process (which

21
molecular events they participate). One of the main uses of the GO terms is to perform
enrichment analysis on gene sets by comparing one target gene set to the background
gene set. If a GO term appears more often in the target gene set than in the background
gene set, it is said to be enriched in this gene set, or this gene set is highly related to this
GO term, which could help to understand the underlying biological relevance.
In this study, biological relevance of selected network clusters were analyzed by
the Gene Ontology enrichment analysis and visualization tool, or GOrilla (Eden et al.
2009) to search for enriched GO terms. In GOrilla search, genes in the selected clusters
were target genes, and all other genes in the network were treated as background genes.
To investigate the possible links of population-specific CNVs to heath disparities, we
first identified significantly enriched GO terms that are associated with CNV_AA or
CNV_CA genes. We then focused on the pathogenic genes associated with the enriched
GO terms, and examined their related disease phenotypes in OMIM database (Online
Mendelian Inheritance in Man 2014). These disease phenotypes were searched for
reported health disparities between African American and Caucasian populations.

22
CHAPTER III
RESULTS AND DISCUSSION
This chapter shows our results in network clustering, gene mapping and cluster
analyses, and discusses the plausible links of population-specific CNVs in the identified
network clusters to health disparities.
3.1 Network Clustering Results
Two gene/protein interaction networks were chosen in this study: HPRDNet and
MultiNet. For HPRDNet, three types of interactions were removed before clustering
process: 1) interaction between same gene; 2) interaction involving unknown genes; 3)
and interactions with ambiguous genes. For MultiNet, all interactions were submitted to
clustering process. Clusters were inferred using MCL with ten different inflation values.
Descriptive statistics of the two networks and their clustering results are summarized in
Table 3.1. When inflation parameter I was increased, the cluster sizes decreased and the
cluster numbers increased. This is because higher I value increases the granularity or
tightness of clusters. The “--force-connected=” option is also proven to have an effect on
clustering results for both networks. When this option was set to “N”, we identified
several uninformative clusters with some genes do not connect to any other genes in the
same cluster.

23
Table 3.1
Summary of biological networks
Network Inflation
Value
Total
Clusters
Cluster Sizes
Maximum Minimum Median Mean
HPRDNet:
9451 genes
36880 interactions
1.1 111 9203 2 2 85 1.2 128 9025 1 2 74 1.3 363 3454 1 3 26 1.4 660 432 1 5 14 1.5 1036 260 1 4 9 1.6 1401 192 1 3 7 1.7 1704 152 1 3 6 1.8 1990 146 1 3 5 1.9 2222 119 1 3 4 2.0 2447 90 1 3 4
MultiNet:
14445 genes
109598 interactions
1.1 21 14399 2 2 450 1.2 22 14394 2 2 430 1.3 43 13614 1 2 220 1.4 226 5560 1 3 42 1.5 600 3524 1 2 16 1.6 923 2402 1 2 10 1.7 1387 1589 1 2 7 1.8 1660 1215 1 2 6 1.9 1887 996 1 2 5 2.0 2116 804 1 2 4
3.2 Gene Mapping Results
Chromosome coordinates of pathogenic SNPs and population-specific CNVs
were searched in the UCSC Genome Database. Totally 2810 pathogenic genes, 194
CNV_AA genes and 258 CNV_CA genes were obtained. Since this study focuses on
network-derived gene clusters, only genes that are listed in HPRDNet or MultiNet were
kept. Details of gene mapping results are shown in Table 3.2.

24
Table 3.2
Results of gene mapping of SNPs and CNV coordinates
Pathogenic Genes CNV_AA CNV_CA
Total 2810 194 258 in HPRDNet 1791 48 62 in MultiNet 2143 64 97
3.3 Cluster Analysis Results
We performed cluster analyses on each of the ten clustering results for both
HPRDNet and MultiNet. Ranking were applied only to clusters with p-value<0.10 and
FDR<0.20 in both enrichment tests for pathogenic genes and those for population-
preferred CNVs genes. The products of FDRs of both enrichment tests were used to rank
the network clusters.
The ranking results are listed in Table 3.3 and Table 3.4. The value of inflation
parameter I used in clustering process is from 1.1 to 2.0, increased by 0.1. Cluster NO is
the serial number of a cluster. CNV_AA and CNV_CA are CNV-related genes. Cluster
Names are names of clusters selected for biological significance analyses. p_CNV and
FDR_CNV, and p_OMIM and FDR_OMIM are p-values and FDR values from
enrichment tests for CNV-related genes and pathogenic genes, respectively. FDR product
is the multiplication result of FDR_CNV and FDR_OMIM and is used for ranking.
We focused on clusters that were consistently ranked at the first place with
different MCL inflation parameter values for further biological significance analyses. It is
worth to mention that clusters containing gene CYP2E1 were filtered out, although in

25
HPRDNet these clusters have been ranked three times at first place in cluster ranking for
CNV_AA gene enrichment tests, and three times at first place for CNV_CA gene
enrichment tests (Table 3.3). This is because gene CYP2E1 is affected by multiple CNVs
and these CNVs have different population preferences. CYP2E1’s location was compared
with those CNVs’ loci. It is found that CYP2E1 is located in the overlapped region
among those CNVs, which means it may not have CNV-caused population-preferred
variations, and may not contribute to health disparities. Therefore, clusters containing
gene CYP2E1 were not included in the following analysis, and the corresponding clusters
ranked at second place were selected instead.
Details of selected clusters are listed in Table 3.5, and their graph representations
are shown in Figure 3.1. In Figure 3.1, each rounded rectangle represents a gene and each
gray line represents a gene-gene interaction. Black rounded rectangles represent non-
pathogenic genes and orange rounded rectangles represent pathogenic genes. Genes
labeled with red or blue ovals are located in African American CNVs or in Caucasian
CNVs. Genes with Green lines share the same GO terms. In each cluster, different line
types represent the enrichment of different GO terms. Line types shown in different
clusters refer to the enrichment of different GO terms. The CNV_AA or CNV_CA genes
in the selected clusters and the details of their corresponding CNVs are listed in Table 3.6.
In Table 3.6, Chr represents chromosomes. CNV Regions are regions of CNVs identified
in more than a single individual. All CNVs listed have a type of Duplication, referring to
one copy increase. CNV Regions and Types are from the CNV map (McElroy et al.
2009). CNV Occurrence describes in CNVs occurrence in African American and
Caucasian populations.

26
Table 3.3
Top-ranked clusters from HPRDNet
I Cluster
No
Cluster
Name CNV_AA CNV_CA OMIM Size p_CNV FDR_CNV p_OMIM FDR_OMIM
FDR
product
1.1 - - - - - - - - - - 1.2 - - - - - - - - - - 1.3 - - - - - - - - - - 1.4 175 AA1 HSPB1 - 8 11 0.0534 0.1548 1.56E-4 3.78E-6 5.85E-07 1.5 190 AA1 HSPB1 - 8 11 0.0534 0.1032 1.56E-4 1.45E-5 1.50E-06 187 CYP2E1 - 5 11 0.0534 0.1032 0.0408 0.1772 1.83E-02 429 CA1 - ATP2A1 4 5 0.0324 0.1094 0.0055 1.80E-5 1.97E-06 271 - SLC4A4 5 8 0.0513 0.1241 0.0082 4.01E-4 4.98E-05 257 - CRX 5 9 0.0575 0.1260 0.0155 0.0155 1.95E-03 1.6 162 AA2 HSPB1 - 8 12 0.0581 0.0964 3.91E-4 4.08E-5 3.93E-06 181 CYP2E1 - 5 11 0.0534 0.0936 0.0408 0.1796 1.68E-02 470 CA1 - ATP2A1 4 5 0.0324 0.0896 0.0055 0.0369 3.31E-03 392 - SLC4A4 4 6 0.0387 0.1007 0.0139 0.1238 1.25E-02 1.7 142 AA2 HSPB1 - 8 12 0.0581 0.0842 3.91E-4 0.0454 3.82E-03 509 CA1 - ATP2A1 4 5 0.0324 0.0690 0.0055 0.1989 1.37E-02 1.8 444 CYP2E1 - 5 6 0.0295 0.0628 0.0012 0.1231 7.73E-03 109 AA3 HSPB1 - 8 13 0.0628 0.0889 8.48E-4 0.1010 8.98E-03 444 - CYP2E1 5 6 0.0387 0.0781 0.0012 0.1231 9.61E-03 516 CA1 - ATP2A1 4 5 0.0324 0.0756 0.0055 0.1910 1.44E-02 1.9 430 CYP2E1 - 5 6 0.0295 0.0246 0.0012 0.1171 2.88E-03 430 - CYP2E1 5 6 0.0387 0.0684 0.0012 0.1171 8.01E-03 2.0 412 CYP2E1 - 5 6 0.0295 0.0241 0.0012 0.1594 3.84E-03 412 CYP2E1 5 6 0.0387 0.0470 0.0012 0.1594 7.49E-03

27
Table 3.4
Top-ranked clusters from MultiNet
I Cluster
No.
Cluster
Name CNV_AA CNV_CA OMIM Size p_CNV FDR_CNV p_OMIM FDR_OMIM
FDR
product
1.1 - - - - - - - - - - 1.2 - - - - - - - - - - 1.3 - - - - - - - - - - 1.4 30 ANXA8, IGHG1 - 12 46 0.0176 0.1588 0.0326 0.1745 2.77E-02
85 CA1 - ATP2A1 4 5 0.0331 0.1501 0.0021 0.0289 4.34E-03 1.5 174 AA4 HSPB1 - 5 5 0.0220 0.0979 7.16E-5 0.0023 2.25E-04
188 CA1 - ATP2A1 4 5 0.0331 0.1237 0.0021 0.0345 4.27E-03 1.6 258 AA4 HSPB1 - 5 5 0.0220 0.0743 7.16E-5 0.0035 2.60E-04
277 CA1 - ATP2A1 4 5 0.0331 0.1708 0.0021 0.0384 6.56E-03 1.7 320 AA4 HSPB1 - 5 5 0.0220 0.0838 7.16E-5 0.0057 4.78E-04
351 CA1 - ATP2A1 4 5 0.0331 0.1814 0.0021 0.0467 8.47E-03 1.8 377 AA4 HSPB1 - 5 5 0.0220 0.0809 7.16E-5 0.0067 5.42E-04
412 CA1 - ATP2A1 4 5 0.0331 0.1347 0.0021 0.0509 6.86E-03 248 - CLN3 4 7 0.0461 0.1459 0.0116 0.1625 2.37E-02
1.9 410 AA4 HSPB1 - 5 5 0.0220 0.0747 7.16E-5 0.0078 5.83E-04 443 CA1 - ATP2A1 4 5 0.0331 0.1159 0.0021 0.0663 7.68E-03 316 - CLN3 4 6 0.0396 0.1190 0.0056 0.1118 1.33E-02
2.0 142 ECHS1 - 8 12 0.0519 0.1196 6.55E-5 0.0096 1.15E-03 479 CA1 - ATP2A1 4 5 0.0331 0.0988 0.0021 0.0728 7.19E-03

28
Table 3.5
Cluster analysis results for HPRDNet and MultiNet
Network Cluster
Name CNV_AA CNV_CA
Pathogenic
gene number
Cluster
Size
HPRDNet AA1 HSPB1 - 8 11 AA2 HSPB1 - 8 12 AA3 HSPB1 - 8 13 CA1 - ATP2A1 4 5 MultiNet AA4 HSPB1 - 5 5 CA1 - ATP2A1 4 5
Figure 3.1 Graph representations of selected clusters for biological significance analysis

29
Table 3.6
Selected genes with potential roles in health disparities and their located CNVs
Gene Chr Gene Coordinates CNV Region CNV Type CNV Occurrence
HSPB1 7 75,931,861-75,933,614 75,867,431-76,481,102 Duplication Only in African American
75,929,740-76,481,102 Duplication Only in African American
75,929,740-76,568,388 Duplication higher in African American than in Caucasian
ATP2A1 16 28,889,726-28,915,830 28,306,730-28,936,772 Duplication Only in Caucasian

30
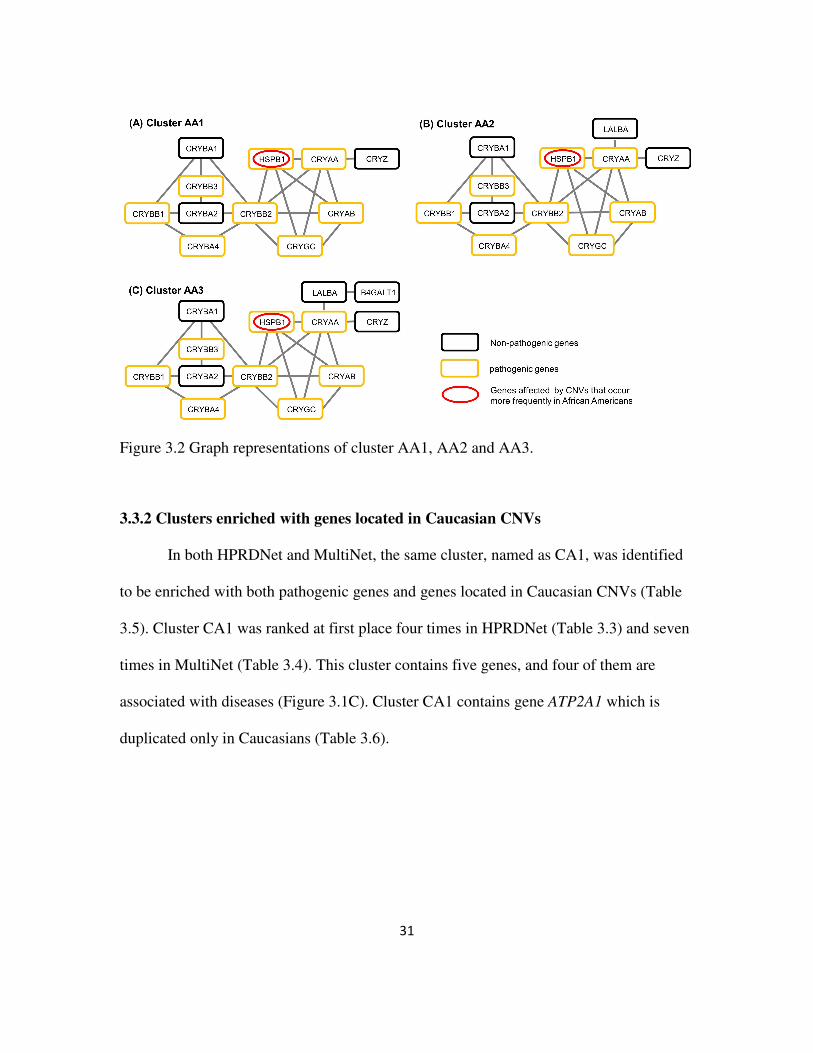
3.3.1 Clusters enriched with genes located in African American CNVs
We found four similar clusters, (AA1, AA2, and AA3 in HPRDNet and AA4 in
MultiNet), that are enriched both for pathogenic genes and for genes located in African-
American CNVs (Table 3.5). In HPRDNet, cluster AA1, AA2 and AA3 together were
ranked at first place five times; and cluster AA4 were ranked at first place five times in
Multinet (Table 3.4). Cluster AA1 contains 11 genes, within which eight are pathogenic
genes (Figure 3.1A). Cluster AA2 and AA3 contain one and two more genes than cluster
AA1, respectively (Figure 3.2). In MultiNet, cluster AA4 contains five genes and can be
considered as a sub-cluster of cluster AA1, AA2 and AA3 (Figure 3.1B). All four clusters
contain gene HSPB1 (Table 3.5), which is mainly duplicated in African Americans
(Table 3.6). Since cluster AA1, AA2 and AA3 were selected from the same network and
are highly similar to each other, only cluster AA1 and AA4 were studied in biological
significance analyses.
31
Figure 3.2 Graph representations of cluster AA1, AA2 and AA3.
3.3.2 Clusters enriched with genes located in Caucasian CNVs
In both HPRDNet and MultiNet, the same cluster, named as CA1, was identified
to be enriched with both pathogenic genes and genes located in Caucasian CNVs (Table
3.5). Cluster CA1 was ranked at first place four times in HPRDNet (Table 3.3) and seven
times in MultiNet (Table 3.4). This cluster contains five genes, and four of them are
associated with diseases (Figure 3.1C). Cluster CA1 contains gene ATP2A1 which is
duplicated only in Caucasians (Table 3.6).

32
3.4 Plausible Links of population-specific CNVs in the identified Network Clusters
to Health Disparities
To investigate the possible links of population-specific CNVs to heath disparities,
we first identified significantly enriched GO terms that are associated with CNV_AA or
CNV_CA genes in the identified network clusters. We then focus on the pathogenic
genes with the enriched GO terms, and examined their associated disease phenotypes in
OMIM database. The results of GO term enrichment analysis are listed in Table 3.7, and
the associated diseases are listed in Table 3.8.
Table 3.7
Enriched GO terms with CNV-genes in the identified network clusters
Clusters Involved Genes GO Domain GO ID GO term
AA1 HSPB1, CRYAA,
CRYAB,
CRYBB2,
CRYBA1,
CRYBA2
Molecular Function
GO:0042802 Identical protein binding
AA4 HSPB1, CRYAA,
CRYAB
Biological Process
GO:0043086 negative regulation of catalytic activity
GO:0043066 negative regulation of apoptotic process
GO:0043069 negative regulation of programmed cell death
HSPB1, CRYAA,
CRYAB, CRYBB2
Molecular Function
GO:0042802 Identical protein binding
HSPB1, CRYAB Cellular Component
GO:0030018 Z disc
CA1 ATP2A1,
ATP2A2, PLN
Biological Process
GO:0048878 chemical homeostasis
ATP2A1, PLN Biological Process
GO:0006937 regulation of muscle contraction
GO:0008016 regulation of heart contraction

33
Table 3.8
Associated diseases of genes with enriched GO terms.
Cluster Gene Associated Disease
AA1 HSPB1 Axonal Charcot-Marie-Tooth disease type 2F and Distal hereditary motor neuronopathy type 2B AA4 CRYAA Multiple types of cataract 9 CRYAB Multiple types of cataract 16 Dilated cardiomyopathy-1II Myofibrillar myopathy-2 CRYAB-related fatal infantile hypertonic myofibrillar myopathy CRYBB2 Multiple types of Cataract 3
CA1 ATP2A1 Brody myopathy ATP2A2 Acrokeratosis verruciformis Darier disease PLN Dilated cardiomyopathy-1P Familial hypertrophic cardiomyopathy-18
3.4.1 Duplication of HSPB1 and Health Disparities in African Americans
Gene HSPB1 is located in genomic duplication regions occurring more frequently
in African Americans (Table 3.6), and is found in the cluster family of AA1, AA2, AA3,
and AA4 (Table 3.5). For cluster AA1, only one GO molecular function term related to
gene HSPB1 is significantly enriched (Cluster AA1 in Table 3.7). For cluster AA4, in
addition to the same enriched GO molecular functions term, three more GO biological
process terms and one GO cellular component term are found significantly enriched
(Cluster AA4 in Table 3.7). In the genes with the enriched GO terms, four of them are
known to be associated with diseases (Cluster AA1/AA4 in Table 3.8). Among these four
genes, three of them are implicated in health disparities of African Americans.
Specifically, gene CRYAB is related to dilated cardiomyopathy and myofibrillar

34
myopathy. African Americans were found at higher risk for idiopathic dilated
cardiomyopathy compared with Caucasian, and this could not be explained by income,
education, alcohol use, smoking, or history of some other diseases (Coughlin et al. 1993).
Moreover, gene CRYAA, CRYAB and CRYBB2 are all related to various types of cataract.
It was reported that age-specific blindness prevalence was higher for African Americans
compared with Caucasian, and cataract accounts for 36.8% of all blindness in African
American, but for only 8.7% in Caucasian (Congdon et al. 2004).
We would like to emphasize that gene HSPB1 is located in three CNVs that occur
frequently in African Americans. Our results predict that HSPB1 is a potential causal
gene in these CNVs for health disparities. How could HSPB1 duplication contribute to
health disparity? Based on the direct interaction between HSPB1 and CRYAB and the fact
that both genes are expressed in Z-disc (Table 3.7), it is plausible that HSPB1 may play
an unknown role in cardiomyopathy. Alternatively, HSPB1 might be involved in cataract,
because HSPB1, CRYAA and CRYAB interact with each other and all can negatively
regulate apoptotic process (Table 3.7). Studies suggested that lens epithelial cell
apoptosis may be a common cellular basis for initiation of non-congenital cataract
formation (Li et al. 1995), and inhibition of epithelial cell apoptosis may be one possible
mechanism that inhibits cataract development (Nahomi et al. 2013). Our results here
argue for further experimental studies to test the possible role of HSPB1 CNVs in
cardiomyopathy or cataract/blindness in African Americans.

35
3.4.2 Duplication of ATP2A1 and Health Disparities in Caucasians
Gene ATP2A1 in cluster CA1 is located in a genomic duplication region that
occurs only in Caucasians (Table 3.6). We found that three genes in cluster CA1 are
enriched with various GO biological process terms that involve ATP2A1 (Cluster CA1 in
Table 3.7). All of the three genes are related to diseases when they mutated (Cluster CA1
in Table 3.8). Our results here predict that APT2A1 is a candidate causal gene for health
disparity in this region.
How would ATP2A1 influence health disparity? Among the diseases related to the
pathogenic genes in cluster CA1, idiopathic dilated cardiomyopathy occurs less often in
Caucasians than in African Americans (Coughlin et al. 1993). One possibility is that
higher copies of ATP2A1 may offer some benefits to Caucasians. Studies have shown that
increased activity of sarco/endoplasmic reticulum Ca2+-ATPase 1 (SERCA1), which is
encoded by ATP2A1, can partially rescue the heart from •OH-induced injury
(Hiranandani et al. 2006), and protect the heart from ischemia-reperfusion (I/R) injury
(Talukder et al. 2007). Another possibility is that higher copies of ATP2A1 only lead to
moderate risk of cardiomyopathy in Caucasians, and this moderate effect is
overshadowed by other genetics factors not covered by our CNV dataset.

36
CHAPTER IV
CONCLUSION
In this study, we proposed a network clustering based approach to associate
CNVs to health disparities in African and American. Gene clusters were inferred from
two human gene/protein networks, HPRDNet and MultiNet, by MCL clustering
algorithm with different parameters. Each cluster was ranked based on products of FDR
values obtained from the right-tailed Fisher’s exact tests for enrichment of pathogenic
genes or CNV-genes. Five clusters were consistently found to be ranked at first place and
be enriched with both pathogenic genes and genes located in African-American or
Caucasian CNVs. In cluster AA1, AA2, AA3 and AA4, gene HSPB1 is located in
African-American-specific CNVs that are duplicated more frequently in African-
Americans. In clusters CA1, gene ATP2A1 is located in a Caucasian-specific CNV that is
duplicated only in Caucasians. All gene clusters are associated with certain diseases that
occur more often in one population than in the other, which could be considered as results
of the occurrence of corresponding CNVs. Although we only studied population-
differential CNVs and did not consider the roles of other genetic factors, our
computational studies have generated some interesting hypotheses for further
experimental studies to understand health disparities in these diseases.

37
REFERENCES
Altshuler D, Daly M, and Kruglyak L. 2000. Guilt by association. Nat Genet 26:135-137.
American Public Health Association. Health Disparities: The Basics. Available at
http://www.apha.org/NR/rdonlyres/54C4CC4D-E86D-479A-BABB-
5D42B3FDC8BD/0/HlthDisparty_Primer_FINAL.pdf2014).
Bakir-Gungor B, and Sezerman OU. 2011. A new methodology to associate SNPs with human
diseases according to their pathway related context. PLoS One 6:e26277.
Barabasi AL, Gulbahce N, and Loscalzo J. 2011. Network medicine: a network-based approach to
human disease. Nat Rev Genet 12:56-68.
Benjamini Y, and Hochberg Y. 1995. Controlling the False Discovery Rate: A Practical and
Powerful Approach to Multiple Testing. Journal of the Royal Statistical Society Series B
(Methodological) 57:289-300.
Bensen JT, Xu Z, McKeigue PM, Smith GJ, Fontham ET, Mohler JL, and Taylor JA. 2014. Admixture
mapping of prostate cancer in African Americans participating in the North Carolina-
Louisiana Prostate Cancer Project (PCaP). Prostate 74:1-9.
Bensen JT, Xu Z, Smith GJ, Mohler JL, Fontham ET, and Taylor JA. 2013. Genetic polymorphism
and prostate cancer aggressiveness: a case-only study of 1,536 GWAS and candidate
SNPs in African-Americans and European-Americans. Prostate 73:11-22.
Brohee S, and van Helden J. 2006. Evaluation of clustering algorithms for protein-protein
interaction networks. BMC Bioinformatics 7:488.
Cantor RM, Lange K, and Sinsheimer JS. 2010. Prioritizing GWAS results: A review of statistical
methods and recommendations for their application. Am J Hum Genet 86:6-22.
Clarke GM, Anderson CA, Pettersson FH, Cardon LR, Morris AP, and Zondervan KT. 2011. Basic
statistical analysis in genetic case-control studies. Nat Protoc 6:121-133.
Congdon N, O'Colmain B, Klaver CC, Klein R, Munoz B, Friedman DS, Kempen J, Taylor HR, and
Mitchell P. 2004. Causes and prevalence of visual impairment among adults in the
United States. Arch Ophthalmol 122:477-485.

38
Coughlin SS, Labenberg JR, and Tefft MC. 1993. Black-white differences in idiopathic dilated
cardiomyopathy: the Washington DC dilated Cardiomyopathy Study. Epidemiology
4:165-172.
Dudbridge F, and Gusnanto A. 2008. Estimation of significance thresholds for genomewide
association scans. Genet Epidemiol 32:227-234.
Eden E, Navon R, Steinfeld I, Lipson D, and Yakhini Z. 2009. GOrilla: a tool for discovery and
visualization of enriched GO terms in ranked gene lists. BMC Bioinformatics 10:48.
Feuk L, Carson AR, and Scherer SW. 2006. Structural variation in the human genome. Nat Rev
Genet 7:85-97.
Fine MJ, Ibrahim SA, and Thomas SB. 2005. The role of race and genetics in health disparities
research. Am J Public Health 95:2125-2128.
Freeman JL, Perry GH, Feuk L, Redon R, McCarroll SA, Altshuler DM, Aburatani H, Jones KW,
Tyler-Smith C, Hurles ME, Carter NP, Scherer SW, and Lee C. 2006. Copy number
variation: new insights in genome diversity. Genome Res 16:949-961.
Gene Ontology Consortium. 2008. The Gene Ontology project in 2008. Nucleic Acids Res
36:D440-444.
Gilman SR, Chang J, Xu B, Bawa TS, Gogos JA, Karayiorgou M, and Vitkup D. 2012. Diverse types
of genetic variation converge on functional gene networks involved in schizophrenia.
Nat Neurosci 15:1723-1728.
Halldorsson BV, and Sharan R. 2013. Network-based interpretation of genomic variation data. J
Mol Biol 425:3964-3969.
Hiranandani N, Bupha-Intr T, and Janssen PM. 2006. SERCA overexpression reduces hydroxyl
radical injury in murine myocardium. Am J Physiol Heart Circ Physiol 291:H3130-3135.
Hirschhorn JN, and Daly MJ. 2005. Genome-wide association studies for common diseases and
complex traits. Nat Rev Genet 6:95-108.
Hosak L, Silhan P, and Hosakova J. 2012. Genomic copy number variations: A breakthrough in
our knowledge on schizophrenia etiology? Neuro Endocrinol Lett 33:183-190.
Huang T, Wang P, Ye ZQ, Xu H, He Z, Feng KY, Hu L, Cui W, Wang K, Dong X, Xie L, Kong X, Cai YD,
and Li Y. 2010. Prediction of deleterious non-synonymous SNPs based on protein
interaction network and hybrid properties. PLoS One 5:e11900.
Iafrate AJ, Feuk L, Rivera MN, Listewnik ML, Donahoe PK, Qi Y, Scherer SW, and Lee C. 2004.
Detection of large-scale variation in the human genome. Nat Genet 36:949-951.

39
Ionita-Laza I, Rogers AJ, Lange C, Raby BA, and Lee C. 2009. Genetic association analysis of copy-
number variation (CNV) in human disease pathogenesis. Genomics 93:22-26.
Jensen MK, Pers TH, Dworzynski P, Girman CJ, Brunak S, and Rimm EB. 2011. Protein interaction-
based genome-wide analysis of incident coronary heart disease. Circ Cardiovasc Genet
4:549-556.
Karolchik D, Barber GP, Casper J, Clawson H, Cline MS, Diekhans M, Dreszer TR, Fujita PA,
Guruvadoo L, Haeussler M, Harte RA, Heitner S, Hinrichs AS, Learned K, Lee BT, Li CH,
Raney BJ, Rhead B, Rosenbloom KR, Sloan CA, Speir ML, Zweig AS, Haussler D, Kuhn RM,
and Kent WJ. 2014. The UCSC Genome Browser database: 2014 update. Nucleic Acids
Res 42:D764-770.
Khurana E, Fu Y, Chen J, and Gerstein M. 2013. Interpretation of genomic variants using a unified
biological network approach. PLoS Comput Biol 9:e1002886.
LaVeist TA, Gaskin D, and Richard P. 2011. Estimating the economic burden of racial health
inequalities in the United States. Int J Health Serv 41:231-238.
Lee I, Blom UM, Wang PI, Shim JE, and Marcotte EM. 2011. Prioritizing candidate disease genes
by network-based boosting of genome-wide association data. Genome Res 21:1109-
1121.
Lee KW, Woon PS, Teo YY, and Sim K. 2012. Genome wide association studies (GWAS) and copy
number variation (CNV) studies of the major psychoses: what have we learnt? Neurosci
Biobehav Rev 36:556-571.
Lehne B, Lewis CM, and Schlitt T. 2011. From SNPs to genes: disease association at the gene
level. PLoS One 6:e20133.
Li WC, Kuszak JR, Dunn K, Wang RR, Ma W, Wang GM, Spector A, Leib M, Cotliar AM, Weiss M,
and et al. 1995. Lens epithelial cell apoptosis appears to be a common cellular basis for
non-congenital cataract development in humans and animals. J Cell Biol 130:169-181.
Lin C, Cho Y-R, Hwang W-C, Pei P, and Zhang A. 2007. Clustering Methods in a Protein–Protein
Interaction Network. Knowledge Discovery in Bioinformatics: John Wiley & Sons, Inc.,
319-355.
Long J, Zhang B, Signorello LB, Cai Q, Deming-Halverson S, Shrubsole MJ, Sanderson M, Dennis J,
Michailiou K, Easton DF, Shu XO, Blot WJ, and Zheng W. 2013. Evaluating genome-wide
association study-identified breast cancer risk variants in African-American women. PLoS
One 8:e58350.
MacDonald JR, Ziman R, Yuen RK, Feuk L, and Scherer SW. 2014. The Database of Genomic
Variants: a curated collection of structural variation in the human genome. Nucleic Acids
Res 42:D986-992.

40
Mathivanan S, Periaswamy B, Gandhi TK, Kandasamy K, Suresh S, Mohmood R, Ramachandra YL,
and Pandey A. 2006. An evaluation of human protein-protein interaction data in the
public domain. BMC Bioinformatics 7 Suppl 5:S19.
McElroy JP, Nelson MR, Caillier SJ, and Oksenberg JR. 2009. Copy number variation in African
Americans. BMC Genet 10:15.
Miller RG. 1981. Simultaneous statistical inference. New York: Springer-Verlag.
Mishra GR, Suresh M, Kumaran K, Kannabiran N, Suresh S, Bala P, Shivakumar K, Anuradha N,
Reddy R, Raghavan TM, Menon S, Hanumanthu G, Gupta M, Upendran S, Gupta S,
Mahesh M, Jacob B, Mathew P, Chatterjee P, Arun KS, Sharma S, Chandrika KN,
Deshpande N, Palvankar K, Raghavnath R, Krishnakanth R, Karathia H, Rekha B, Nayak R,
Vishnupriya G, Kumar HG, Nagini M, Kumar GS, Jose R, Deepthi P, Mohan SS, Gandhi TK,
Harsha HC, Deshpande KS, Sarker M, Prasad TS, and Pandey A. 2006. Human protein
reference database--2006 update. Nucleic Acids Res 34:D411-414.
Moore JH, Asselbergs FW, and Williams SM. 2010. Bioinformatics challenges for genome-wide
association studies. Bioinformatics 26:445-455.
Moore JH, and Williams SM. 2009. Epistasis and its implications for personal genetics. Am J Hum
Genet 85:309-320.
Nahomi RB, Wang B, Raghavan CT, Voss O, Doseff AI, Santhoshkumar P, and Nagaraj RH. 2013.
Chaperone peptides of alpha-crystallin inhibit epithelial cell apoptosis, protein
insolubilization, and opacification in experimental cataracts. J Biol Chem 288:13022-
13035.
National Center for Health Statistics. 2007. Health, United States, 2007. Hyattsville, MD.
National Center for Health Statistics. 2013. Health, United States, 2012: With Special Feature on
Emergency Care. Hyattsville, MD.
Ng MC, Shriner D, Chen BH, Li J, Chen WM, Guo X, Liu J, Bielinski SJ, Yanek LR, Nalls MA, Comeau
ME, Rasmussen-Torvik LJ, Jensen RA, Evans DS, Sun YV, An P, Patel SR, Lu Y, Long J,
Armstrong LL, Wagenknecht L, Yang L, Snively BM, Palmer ND, Mudgal P, Langefeld CD,
Keene KL, Freedman BI, Mychaleckyj JC, Nayak U, Raffel LJ, Goodarzi MO, Chen YD,
Taylor HA, Jr., Correa A, Sims M, Couper D, Pankow JS, Boerwinkle E, Adeyemo A,
Doumatey A, Chen G, Mathias RA, Vaidya D, Singleton AB, Zonderman AB, Igo RP, Jr.,
Sedor JR, Kabagambe EK, Siscovick DS, McKnight B, Rice K, Liu Y, Hsueh WC, Zhao W,
Bielak LF, Kraja A, Province MA, Bottinger EP, Gottesman O, Cai Q, Zheng W, Blot WJ,
Lowe WL, Pacheco JA, Crawford DC, Grundberg E, Rich SS, Hayes MG, Shu XO, Loos RJ,
Borecki IB, Peyser PA, Cummings SR, Psaty BM, Fornage M, Iyengar SK, Evans MK,
Becker DM, Kao WH, Wilson JG, Rotter JI, Sale MM, Liu S, Rotimi CN, and Bowden DW.
2014. Meta-analysis of genome-wide association studies in African Americans provides
insights into the genetic architecture of type 2 diabetes. PLoS Genet 10:e1004517.

41
Oliver S. 2000. Guilt-by-association goes global. Nature 403:601-603.
Olsson LM, and Holmdahl R. 2012. Copy number variation in autoimmunity--importance hidden
in complexity? Eur J Immunol 42:1969-1976.
Online Mendelian Inheritance in Man O. 2014. Baltimore, MD: McKusick-Nathans Institute of
Genetic Medicine, Johns Hopkins University.
Peri S, Navarro JD, Amanchy R, Kristiansen TZ, Jonnalagadda CK, Surendranath V, Niranjan V,
Muthusamy B, Gandhi TK, Gronborg M, Ibarrola N, Deshpande N, Shanker K,
Shivashankar HN, Rashmi BP, Ramya MA, Zhao Z, Chandrika KN, Padma N, Harsha HC,
Yatish AJ, Kavitha MP, Menezes M, Choudhury DR, Suresh S, Ghosh N, Saravana R,
Chandran S, Krishna S, Joy M, Anand SK, Madavan V, Joseph A, Wong GW, Schiemann
WP, Constantinescu SN, Huang L, Khosravi-Far R, Steen H, Tewari M, Ghaffari S, Blobe
GC, Dang CV, Garcia JG, Pevsner J, Jensen ON, Roepstorff P, Deshpande KS, Chinnaiyan
AM, Hamosh A, Chakravarti A, and Pandey A. 2003. Development of human protein
reference database as an initial platform for approaching systems biology in humans.
Genome Res 13:2363-2371.
Peri S, Navarro JD, Kristiansen TZ, Amanchy R, Surendranath V, Muthusamy B, Gandhi TK,
Chandrika KN, Deshpande N, Suresh S, Rashmi BP, Shanker K, Padma N, Niranjan V,
Harsha HC, Talreja N, Vrushabendra BM, Ramya MA, Yatish AJ, Joy M, Shivashankar HN,
Kavitha MP, Menezes M, Choudhury DR, Ghosh N, Saravana R, Chandran S, Mohan S,
Jonnalagadda CK, Prasad CK, Kumar-Sinha C, Deshpande KS, and Pandey A. 2004. Human
protein reference database as a discovery resource for proteomics. Nucleic Acids Res
32:D497-501.
Pizzuti C, Rombo S, and Marchiori E. 2012. Complex Detection in Protein-Protein Interaction
Networks: A Compact Overview for Researchers and Practitioners. In: Giacobini M,
Vanneschi L, and Bush W, eds. Evolutionary Computation, Machine Learning and Data
Mining in Bioinformatics: Springer Berlin Heidelberg, 211-223.
Pounds S, and Cheng C. 2006. Robust estimation of the false discovery rate. Bioinformatics
22:1979-1987.
Prasad TSK, Goel R, Kandasamy K, Keerthikumar S, Kumar S, Mathivanan S, Telikicherla D, Raju R,
Shafreen B, Venugopal A, Balakrishnan L, Marimuthu A, Banerjee S, Somanathan DS,
Sebastian A, Rani S, Ray S, Harrys Kishore CJ, Kanth S, Ahmed M, Kashyap MK, Mohmood
R, Ramachandra YL, Krishna V, Rahiman BA, Mohan S, Ranganathan P, Ramabadran S,
Chaerkady R, and Pandey A. 2009. Human Protein Reference Database--2009 update.
Nucleic Acids Res 37:D767-772.
R Development Core Team. 2013. R: A language and environment for statistical computing.
Vienna, Austria: R Foundation for Statistical Computing.

42
Ramos E, and Rotimi C. 2009. The A's, G's, C's, and T's of health disparities. BMC Med Genomics
2:29.
Sebat J, Lakshmi B, Troge J, Alexander J, Young J, Lundin P, Maner S, Massa H, Walker M, Chi M,
Navin N, Lucito R, Healy J, Hicks J, Ye K, Reiner A, Gilliam TC, Trask B, Patterson N,
Zetterberg A, and Wigler M. 2004. Large-scale copy number polymorphism in the human
genome. Science 305:525-528.
Sharan R, Ulitsky I, and Shamir R. 2007. Network-based prediction of protein function. Mol Syst
Biol 3:88.
Sherry ST, Ward MH, Kholodov M, Baker J, Phan L, Smigielski EM, and Sirotkin K. 2001. dbSNP:
the NCBI database of genetic variation. Nucleic Acids Res 29:4.
Storey JD, Taylor JE, and Siegmund D. 2004. Strong control, conservative point estimation, and
simultaneous conservative consistency of false discovery rates. Journal of the Royal
Statistical Society, Series B 66:187-205.
Stringer CB, and Andrews P. 1988. Genetic and fossil evidence for the origin of modern humans.
Science 239:1263-1268.
Talukder MA, Kalyanasundaram A, Zhao X, Zuo L, Bhupathy P, Babu GJ, Cardounel AJ, Periasamy
M, and Zweier JL. 2007. Expression of SERCA isoform with faster Ca2+ transport
properties improves postischemic cardiac function and Ca2+ handling and decreases
myocardial infarction. Am J Physiol Heart Circ Physiol 293:H2418-2428.
Tishkoff SA, and Verrelli BC. 2003. Patterns of human genetic diversity: implications for human
evolutionary history and disease. Annu Rev Genomics Hum Genet 4:293-340.
van Dongen S. 2000. Graph Clustering by Flow Simulation PhD. University of Utrecht.
Vidal M, Cusick ME, and Barabasi AL. 2011. Interactome networks and human disease. Cell
144:986-998.
von Mering C, Krause R, Snel B, Cornell M, Oliver SG, Fields S, and Bork P. 2002. Comparative
assessment of large-scale data sets of protein-protein interactions. Nature 417:399-403.
Wang J, Li M, Deng Y, and Pan Y. 2010. Recent advances in clustering methods for protein
interaction networks. BMC Genomics 11 Suppl 3:S10.
Wang K, Li M, and Bucan M. 2007. Pathway-based approaches for analysis of genomewide
association studies. Am J Hum Genet 81:1278-1283.
Wang P, Carrion P, Qiao Y, Tyson C, Hrynchak M, Calli K, Lopez-Rangel E, Andrieux J, Delobel B,
Duban-Bedu B, Thuresson AC, Anneren G, Liu X, Rajcan-Separovic E, and Suzanne Lewis
43
ME. 2013. Genotype-phenotype analysis of 18q12.1-q12.2 copy number variation in
autism. Eur J Med Genet 56:420-425.
Wang WY, Barratt BJ, Clayton DG, and Todd JA. 2005. Genome-wide association studies:
theoretical and practical concerns. Nat Rev Genet 6:109-118.
Wang X, Gulbahce N, and Yu H. 2011. Network-based methods for human disease gene
prediction. Brief Funct Genomics 10:280-293.
Wei P, Milbauer LC, Enenstein J, Nguyen J, Pan W, and Hebbel RP. 2011. Differential endothelial
cell gene expression by African Americans versus Caucasian Americans: a possible
contribution to health disparity in vascular disease and cancer. BMC Med 9:2.
Williams SM, Canter JA, Crawford DC, Moore JH, Ritchie MD, and Haines JL. 2007. Problems with
genome-wide association studies. Science 316:1840-1842.
Xu Z, Bensen JT, Smith GJ, Mohler JL, and Taylor JA. 2011. GWAS SNP Replication among African
American and European American men in the North Carolina-Louisiana prostate cancer
project (PCaP). Prostate 71:881-891.
Zhao M, and Zhao Z. 2013. CNVannotator: a comprehensive annotation server for copy number
variation in the human genome. PLoS One 8:e80170.

44
APPENDIX A
CODES FOR GENE MAPPING OF SNPS AND CNV COORDINATES

45
// Setup connection to UCSC Genome Database
String username = "genome";
String password = "";
String url = "jdbc:mysql://genome-mysql.cse.ucsc.edu/hg19";
Class.forName("com.mysql.jdbc.Driver");
Connection con = DriverManager.getConnection(url, username, password);
Statement stmt = con.createStatement();
ResultSet rs = null;
// Search for gene names by SNP id
// Compose and submit SQL statements to UCSC Genome Database
rs = stmt.executeQuery(
"select distinct S.name, X.geneSymbol " +
"from snp138 as S, knownGene as G, kgXref as X " +
"where S.name = '" + "rs" + new_snp + "' AND X.kgId = G.name AND
S.chrom = G.chrom AND " + "G.txStart <= S.chromStart AND
G.txEnd >= S.chromEnd;");
// extract results and write to output file
if (rs.next()){
do {
for (int i=1; i<3; i++) { output.print(rs.getString(i)+"\t"); }
output.println();
}while (rs.next());
}
else { output.println("rs" + new_snp + "\t" + "gene_not_found"); }
// Search for gene names by CNV loci
// Compose and submit SQL statements to UCSC Genome Database
rs = stmt.executeQuery(
"select distinct X.geneSymbol, G.chrom, G.txStart, G.txEnd " +
"from knownGene as G, kgXref as X " +
"where ((G.txStart>" + begin + " AND G.txEND<" + end + ") or " +
"(G.txStart>" + begin + " AND G.txStart<" + end + ") or " +
"(G.txEND>" + begin + " AND G.txEND<" + end + ") or " +
"(G.txStart<" + begin + " AND G.txEnd>" + end + ")) AND " +
"X.kgId = G.name AND G.chrom = '" + chrom + "';");
// extract results and write to output file
if (rs.next()) {
do {
for (int l=1; l<5; l++) { output.print(rs.getString(l)+"\t"); }
output.println();
}while (rs.next());
}
else { output.println("not found"); }

46
APPENDIX B
CODES FOR RIGHT-TAILED FISHER’S EXACT TEST

47
//setup R engine
Rengine re = new Rengine (new String[] {}, false, null);
// Check if the session is working.
if (!re.waitForR()) { return; }
//Fisher's exact test for OMIM genes
for (int k=1; k<=nCluster; k++)
{
if(AA_GeneClusters[k].get_q() != 0)
{
// obtain values and create the contingency table
double cluster_q = AA_GeneClusters[k].get_q();
double cluster_m = AA_GeneClusters[k].get_m();
double cluster_nonOMIM = cluster_m - cluster_q;
double other_OMIM = Q - cluster_q;
double other_nonOMIM = N - Q - cluster_nonOMIM;
re.eval("cluster = c("+cluster_q+","+cluster_nonOMIM+")");
re.eval("other = c("+other_OMIM+","+other_nonOMIM+")");
re.eval("tb = rbind(cluster, other)");
// perform the Fisher’s exact test and obtain the p-value
double p_OMIM = re.eval("fisher.test(tb,
alternative=\"greater\")$p.value").asDouble();
}
}
//Fisher’s exact test for AA and CA genes
for (int k=1; k<=nCluster; k++)
{
double cluster_AA_s = AA_GeneClusters[k].get_s();
double cluster_CA_s = CA_GeneClusters[k].get_s();
double cluster_m = AA_GeneClusters[k].get_m();
double other_AA = S_AA - cluster_AA_s;
double other_CA = S_CA - cluster_CA_s;
// Fisher's exact test for AA only
if(AA_GeneClusters[k].get_s() != 0)
{
// obtain values and create the contingency table
double cluster_nonAA = cluster_m - cluster_AA_s;
double other_nonAA = N-cluster_m-S_AA+cluster_AA_s;
re.eval("cluster = c("+cluster_AA_s+","+cluster_nonAA+")");
re.eval("other = c("+other_AA+","+other_nonAA+")");
re.eval("tb = rbind(cluster, other)");
// perform the Fisher’s exact test and obtain the p-value
double p_AA = re.eval("fisher.test(tb,
alternative=\"greater\")$p.value").asDouble();
}
// Fisher's exact test for CA only
if(CA_GeneClusters[k].get_s() != 0)
{

48
// obtain values and create the contingency table
double cluster_nonCA = cluster_m - cluster_CA_s;
double other_nonCA = N-cluster_m-S_CA+cluster_CA_s;
re.eval("cluster = c("+cluster_CA_s+","+cluster_nonCA+")");
re.eval("other = c("+other_CA+","+other_nonCA+")");
re.eval("tb = rbind(cluster, other)");
// perform the Fisher’s exact test and obtain the p-value
double p_CA = re.eval("fisher.test(tb,
alternative=\"greater\")$p.value").asDouble();
}
}

49
APPENDIX C
CODES FOR FALSE DISCOVERY RATE CALCULATION

50
// Calculate FDR values
//fp is the File object of input file
Scanner pScan = new Scanner(fp);
//RstatementA contains a R statement to create a tuple of all p-values.
String RstatementA = "p=c(";
while (pScan.hasNextLine())
{
String line = pScan.nextLine();
Scanner lineReader = new Scanner(line);
lineReader.next();
int tmp = (int) lineReader.nextDouble();
if (tmp != 0)
{
lineReader.next();
double p = lineReader.nextDouble();
RstatementA = RstatementA + p + ", ";
log.println("RstatementA"+RstatementA);
}
}
RstatementA = RstatementA.substring(0, RstatementA.length()-2) + ")";
// create a tuple named “p”
re.eval(RstatementA);
// load robust-fdr routine
re.eval("source(\"D:/eclipse/workspace/test/robust-fdr.R\")");
// RstatementD contains a R statement to run robust-fdr routine
String RstatementD = "robust.fdr(p, discrete=T, use8=F)$fdr";
// Obtain fdr values and save to an array
double[] fdr_disc = re.eval(RstatementD).asDoubleArray();

51
VITA
Yi Jiang was born in Suzhou, Jiangsu, China. He attended Nanjing University and
obtained the Bachelors of Science degree in Applied Chemistry in May 2001. Yi
completed the Master of Science degree in Pharmaceutical Sciences at University of
Florida before he entered the Computer Sciences Program at University of Tennessee at
Chattanooga. Yi worked as teaching and research assistants in Department of Computer
Science, and graduated with a Master of Science degree with thesis option in Computer
Science in December 2014. Yi’s research interests include data analysis, database
management and computer programming.