using modes for time series classification - rohit chatterjee
TRANSCRIPT

Copyright © 2013 Microland LimitedJuly 2015
Using Modes for Time Series Analysis
Extraordinary.Everyday.

Copyright © 2013 Microland Limited 2
About this Talk
Time Series Classification
IT Operations Analytics
Pattern Recognition
Anomaly Detection

Copyright © 2013 Microland Limited 3
About Me
Computer Science
• UT Austin
Math• UT Austin• UW
Madison
Finance• Interactive
Brokers
Software Development
• Tally Solutions
Data Science
• Microland
Rohit [email protected]

Copyright © 2013 Microland Limited 4
IT Operations Management
IT Systems are monitored continuously
Large quantities of machine data generated
Scope for automated analysis

Copyright © 2013 Microland Limited 5
Time Series in IT Monitoring Data

Copyright © 2013 Microland Limited 6
Goal
We Need Features
We Want to Classify These Series

Copyright © 2013 Microland Limited 7
Looking for Features
MeanVarianceMaxMinPeak-to-peakSlope
Not enough
We could try:

Copyright © 2013 Microland Limited 8
Limitations of Mean and Variance
Both these series have the same value for σ / μ
But they look very different!

Copyright © 2013 Microland Limited 9
Consider the Mode
Single Mode Two Modes

Copyright © 2013 Microland Limited 10
Modal “Strength”
One mode, almost 100% of the series
Each mode is at around 50%

Copyright © 2013 Microland Limited 11
The “Run Ratio”
-The run is broken- The longer run is around
80% of the modal series
-The first mode’s run is unbroken- 100% of the modal series
(Similarly for the second mode…)
Copyright © 2013 Microland Limited 12
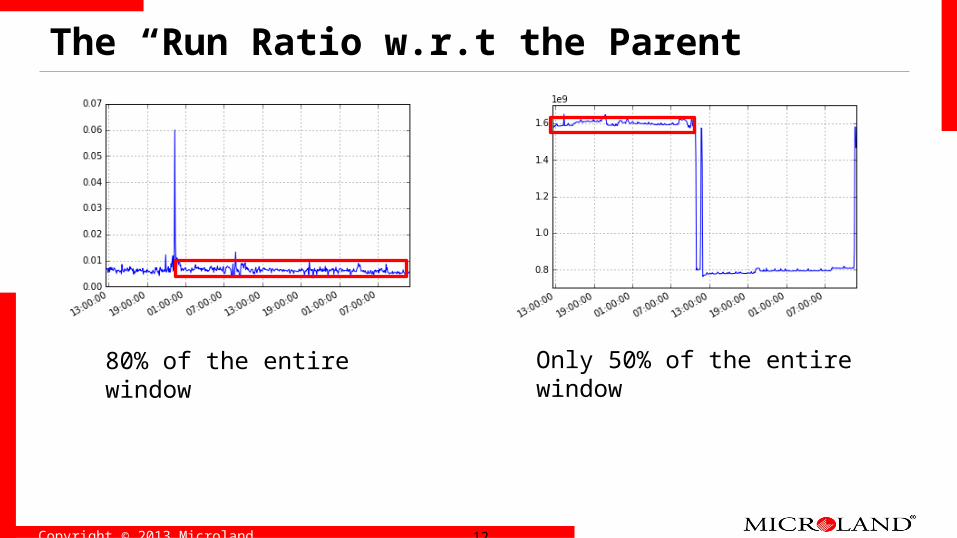
The “Run Ratio w.r.t the Parent”
80% of the entire window Only 50% of the entire window

Copyright © 2013 Microland Limited 13
Using the Run Ratio
The mode in each graph has
a strength of98%
Vs.
This one has a larger run ratio

Copyright © 2013 Microland Limited 14
What if There is No Mode?

Copyright © 2013 Microland Limited 15
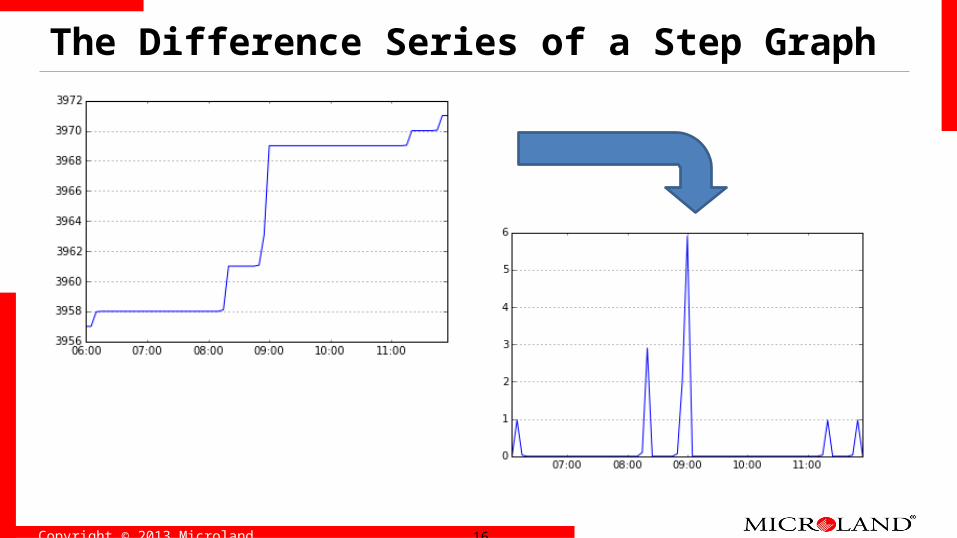
The Difference Series
d(n) = s(n) – s(n-1)
Copyright © 2013 Microland Limited 16
The Difference Series of a Step Graph

Copyright © 2013 Microland Limited 17
A Signature


Copyright © 2013 Microland Limited www.microland.com
Q & A