using linked survey and administrative data to better
TRANSCRIPT

Using Linked Survey and Administrative Data to Better Measure Income: Implications for Poverty, Program Effectiveness and Holes in the Safety Net
Bruce D. Meyer, University of Chicago and NBER
Nikolas Mittag, CERGE-EI and IZA
July 30, 2017
Abstract We examine the consequences of underreporting of transfer programs in household survey data for several prototypical analyses of low-income populations. We focus on the Current Population Survey (CPS), the source of official poverty and inequality statistics. We link administrative data for food stamps, TANF, General Assistance, and subsidized housing from New York State to the CPS at the household level. Program receipt in the CPS is missed for over one-third of housing assistance recipients, over 40 percent of food stamp recipients and over 60 percent of TANF and General Assistance recipients. Dollars of benefits are also undercounted for reporting recipients, particularly for TANF, General Assistance and housing benefits. We find that the survey sharply understates the income of poor households. Underreporting in the survey data also greatly understates the effects of anti-poverty programs and changes our understanding of program targeting, often making it seem that welfare programs are less targeted to both the very poorest and middle-income households than they are. Using the combined data rather than survey data alone, the poverty reducing effect of all programs together is nearly doubled while the effect of housing assistance is tripled. We also re-examine the coverage of the safety net, specifically the share of people without work or program receipt. Using the administrative measures of program receipt rather than the survey ones often reduces the share of single mothers falling through the safety net by one-half or more.
Key words: Poverty, Inequality, Measurement Error, Administrative Data, Survey Misreporting, Linked Data
Any opinions and conclusions expressed here are those of the authors and do not necessarily represent the views of the New York Office of Temporary and Disability Assistance (OTDA) or the U.S. Census Bureau. Mittag would like to thank the Upjohn Institute for Employment Research and the Czech Science Foundation (grant no. 16-07603Y) for financial support. We have greatly benefitted from the comments of Robert Moffitt, Charles Brown, Carlos Lamarche, Derek Wu and seminar participants at the Conference in Honor of Jerry Hausman, 2014 Joint Statistical Meetings, University of Chicago, Federal Reserve Bank of Atlanta, 2015 AEA Annual Meetings, 2015 SEA Annual Meetings, University of Wisconsin, Georgia State University, UNCE at Charles University, Northwestern University, University of Alicante and Iowa State University. We are grateful for the assistance of many OTDA and Census Bureau employees including George Falco, Dave Dlugolecki, Graton Gathright, Amy O’Hara, and Frank Limehouse. The data analysis was conducted at the Chicago Census Research Data Center by researchers with Special Sworn Status and the results were reviewed to prevent the disclosure of confidential information. Pablo Celhay provided excellent research assistance. Meyer: Harris School of Public Policy Studies, University of Chicago, 1155 E. 60th Street, Chicago, IL 60637, [email protected] Mittag: CERGE-EI, Politických vězňů 7, Prague 1, 110 00, Czech Republic. [email protected]

1
1. Introduction
Survey data are used for many purposes and are one of the most important sources of information
for policy makers and researchers. A large share of the empirical research in economics and other social
sciences relies on survey data, as indicated by the hundreds of thousands of citations to the Current
Population Survey (CPS). Additionally, many of the official statistics that are frequently used to design and
evaluate policies, such as the rates of unemployment and health insurance coverage, rely on household
survey data. The CPS is the source of these statistics, as well as official income distribution and poverty
statistics. The survey is also extensively used to determine the effects of transfers on the income
distribution, program participation rates, and the extent to which individuals are missed by specific
programs or by the safety net entirely. However, the usefulness of the information in the CPS and other
household surveys depends on its accuracy, which has unfortunately been declining. In this paper, we
examine the implications of CPS survey errors in welfare program reporting and imputation for our
understanding of the income distribution, poverty, and the effects of government programs.
We focus on three prototypical analyses. First, a large literature examines measures of hardship
and the distribution of household income among those with few resources. These statistics supply us with
vital information on the prevalence and extent of material deprivation among the worst off in the
population. Most well-known is the annual official income and poverty report, the 2015 version being U.S.
Census Bureau (2015a). The official poverty rate is also one of the most cited government statistics in the
popular press. Many other scholars have used these data to calculate poverty or income distribution
measures at the bottom, including Blank and Schoeni (2003), Hoynes, Page and Stevens (2006), and
Armour, Burkhauser and Larrimore (2013). A second prototypical question researchers and policymakers
ask is how the addition of the income from specific programs alters the poverty rate and other measures
of material deprivation. These calculations provide estimates of the poverty-reducing effects of policies
and which types of individuals benefit. Such analyses for more than a dozen government programs can be

2
seen in the annual Supplemental Poverty Measure report, the 2015 version being U.S. Census Bureau
(2015b). Many researchers have conducted similar analyses such as the series of papers using the Survey
of Income and Program Participation (SIPP) exemplified by Ben-Shalom, Moffitt, and Scholz (2012). A third
important question is who is missed by transfer programs. This information may point to failings of the
safety net to reach many of those who it is intended to help. Maybe most well known in this line of work
are the papers by Blank and Kovak (2007, 2009) and related papers by Bitler and Hoynes (2010), Loprest
(2011), and Loprest and Nichols (2011). These papers focus on the share of single mothers who neither
work nor receive income from government transfer programs.
In each of these prototypical cases, we find that survey errors, mainly the mis-reporting of
government transfer receipt and amounts, but also item nonresponse and inaccurate imputation,1 greatly
distort our view of the situation of those with the fewest resources and the effects of transfer programs.
We focus on these descriptive analyses, because the consequences of misreporting are clear for these
statistics. The direction and rough magnitude of biases we see are likely to apply in many other similar
analyses. On the other hand, any lessons from studies of multivariate regression models are likely to be
much less general, depending on the control variables and other elements of the specification (Meyer,
Goerge and Mittag 2017; Meyer and Mittag forthcoming).
A fundamental difficulty in evaluating the extent of survey errors and their consequences is that
one needs an external measure of truth to compare to survey responses. In this study, we replace survey
responses on the receipt and amount of government transfers with administrative records for four income
transfer programs (food stamps, TANF, General Assistance, and subsidized housing) linked to a major
survey (the CPS) over a six-year period. In most cases, the administrative records are extremely accurate
(they contain actual payments made, they are validated by the agency, and definitions are comparable to
1 For simplicity, we sometimes refer to both sources of error as misreporting and the problem as program underreporting below, even though the survey data are a mix of reported and assigned values.

3
survey definitions). The administrative data are linked to survey data at the household level with a high
match rate, because validated social security numbers are required to receive three of the programs.
Measurement error is an issue for many variables,2 but is particularly severe for transfer
programs, with receipt missed for over one-third of housing assistance recipients, over forty percent of
SNAP recipients, and over sixty percent of TANF and General Assistance recipients based on New York
data. Even among those who correctly report receipt, average amounts received in the CPS fall short of
the accurate amounts by six percent for SNAP, forty percent for TANF and General Assistance, and 74
percent for housing assistance. Measurement error is not the only data problem for some of the analyses
on which we focus. A general decline in household survey quality is documented in Meyer, Mok and
Sullivan (2015a,b), who focus on several of the most used surveys including the CPS. Over time, we are
seeing fewer households respond to interviewers (unit nonresponse) and fewer who respond agree to
answer income questions (item nonresponse). Item nonresponse rates have been rising over the past 25
years and are on the order of 20-30 percent or higher for both earnings (Bollinger and Hirsch 2006) and
government transfers (Meyer, Mok and Sullivan 2015b). For the many transfer programs Meyer, Mok, and
Sullivan (2015b) examine, imputed dollars account for 24 to 36 percent of total dollars received in the CPS
in 2012. Several studies examine whether earnings imputation error affects measures of poverty (Turek
et al. 2009; Hokayem, Bollinger and Ziliak 2015) and estimates of the tails of the income distribution
(Bollinger et al. 2015). The latter two papers find substantial bias at the bottom. On the other hand, Bee,
Gathright and Meyer (2015) find little bias in the income distribution due to unit nonresponse.
Here, we find that correcting for survey errors sharply changes key results from survey data. Using
the administrative variables, poverty and inequality are lower than officially reported, program effects are
2 For example, significant measurement error has been documented for income (e.g. Bound and Krueger 1991; Bollinger 1998; Dahl, DeLeire and Schwabish 2011; Abowd and Stinson 2013), education (Black, Sanders and Taylor 2003), employment status (Poterba and Summers 1986; Chua and Fuller 1987) and health insurance coverage (Davern et al. 2008). Bound, Brown and Mathiowetz (2001) provide an overview.

4
larger, and fewer individuals have fallen through the safety net. Incomes below the poverty line are
substantially understated in the CPS, particularly below half the poverty line, where unreported transfers
exceed reported cash income. While the substantive importance of underreporting becomes smaller as
reported income rises, correcting for underreporting makes a larger difference to household resources
than including reported non-cash benefits throughout the income distribution. Correcting for
underreporting of transfer receipt also reveals that government anti-poverty policies are much more
effective: in the corrected data, the poverty reducing effect of all programs combined is nearly doubled
while the effect of housing assistance is tripled. Both the change in household income and the revised
poverty reduction are even more pronounced for some subpopulations that are at particular risk of
deprivation. The correction is particularly large for single mothers: using administrative instead of
reported program receipt shows that the four programs reduce the poverty rate by an additional 11
percentage points, amplifying the poverty reducing effect of public assistance more than 6-fold and that
of housing assistance more than 10-fold. In addition, we find that the fraction of non-working single
mothers missed by government transfers is much lower than previously reported. Depending on how we
define being missed by the safety net, the CPS overstates the fraction by 33-113 percent. This result
underlines that the coverage of the safety net is much better than the survey data suggest. Trends in
poverty rates are also appreciably different when incorporating the administrative data in the survey.
This study demonstrates how administrative data can be linked to survey data to improve income
measures, a method likely to become commonplace, maybe even institutionalized in the future. Even
though we correct only a small part of the safety net, the errors from multiple programs add up, so that
the corrections are substantial. Given the under-reporting found in programs for which we do not correct
here, such as Social Security Retirement and Disability (Gathright and Crabb 2014; Meyer, Mok and
Sullivan 2015a) and in retirement benefits (U.S. Census Bureau 2015c), these results suggest that even
larger corrections are in order.

5
In Section 2, we describe our linked survey and administrative data and report on the extent of
misreporting. In the following sections, we use our linked administrative data to re-examine prototypical
analyses of low-income populations. We perform each analysis twice, once using the survey answers and
once using the administrative measures of program receipt and amounts received. In Section 3, we
examine the distribution of government transfers across the income distribution. In Section 4, we examine
the poverty reducing effects of the different transfer programs, while in Section 5 we examine the
frequency with which families are missed by the programs. Section 6 discusses the applicability of our
results to the entire U.S., to other programs and to other surveys, while Section 7 offers conclusions,
outlining the implications of our results for researchers and policymakers.
2. Data, Methods and the Extent of Measurement Error
Data
We begin with household survey data from the New York State sample of the 2008-2013 Current
Population Survey Annual Social and Economic Supplement (CPS-ASEC). Early in the survey year, usually
March, the CPS asks about income in the previous calendar year (the reference year). Income is collected
on many sources including earnings and a large set of government transfer programs. Imputed values for
many in-kind benefits are also available in the survey files including housing assistance.
We link administrative records from two sources to the CPS. The first set of administrative records
is from the New York State Office of Temporary and Disability Assistance (OTDA). The records are monthly
payments from SNAP (food stamps), TANF, and General Assistance for all individuals in New York State
from 2007 through 2012. Since the 1996 welfare reform act, General Assistance has grown relative to
federal cash assistance; in recent years, total benefit payments have exceeded those of TANF both

6
nationally and in NY.3 Besides payment amounts and dates, the files include addresses and payment types.
The records are from actual payments, and appear to be accurate. For SNAP, for example, the overall total
from our administrative records differs from official aggregate outlays by less than one percent in all years.
The individual identifiers have been checked by NY OTDA against social security records.
The second source of administrative data is records on housing assistance from the Department
of Housing and Urban Development (HUD). These records are from the 2009-2012 PIC and TRACS data
files and include the programs under HUD jurisdiction. The records contain information on all program
recipients including addresses, number and ages of family members, and rent paid by the tenant from
April 2008 to March 2012. While the data include the market rent for most units, because they are part
of voucher programs, the data do not include rent amounts for publicly owned housing units. We impute
market rent for these units using conditional mean imputation within cells formed by five-digit ZIP code
and household size. Further details on the data and imputations as well as the definitions discussed in the
remainder of this section are provided in the Data Appendix.
Methods
We match the administrative data to the CPS survey data at the individual level using individual identifiers
created by the Person Identification Validation System (PVS) of the U.S. Census Bureau.4 In short, the PVS
uses the person data (such as address, name, gender, and date of birth) from the administrative records
and survey data to search for a matching record in a reference file derived from the Social Security
Administration Numerical Identification file. The reference file contains all transactions recorded against
a social security number. If a matching record is found, the social security number of the record from the
3 The national numbers are based on the Bureau of Economic Analysis National Income and Product Accounts, Table 3.12 line 37 http://www.bea.gov/iTable/iTable.cfm?ReqID=9&step=1#reqid=9&step=1&isuri=1 which come from a survey of states and localities on their expenditures. 4 NORC (2011) and Wagner and Layne (2014) discuss the PVS in detail.

7
reference file is transformed into a protected identification key (PIK)5 and attached to the corresponding
records in our data. A PIK is obtained for over 99 percent of the administrative records from each source.
Our unit of analysis is a household, so we aggregate the data to the household level. Using the household
as the unit of analysis is logical given the sharing of resources among members, but it also insures a high
rate of data linkage. Since the administrative data contain records for each recipient person, we are able
to link the information from a program case to the household if we can link any recipient in the household.
91 percent of the households in the CPS contain at least one member with a PIK. To account for incomplete
matching, we multiply the household weights by the inverse of the predicted probability of any household
member having a PIK (see e.g. Wooldridge 2007). 6 As the high rate of PIK-linking suggests, our results do
not appreciably change when using the adjusted household weights.
Our main approach is to consider two measures of household income or program receipt: first, a
measure that relies only on survey data, and, second, a measure that substitutes some or all of our
administrative data for the survey data on transfer program receipt. The CPS questions regarding SNAP,
TANF, and General Assistance refer to receipt during the previous calendar year and we define the
administrative variables accordingly. In our analyses below, we aggregate TANF and General Assistance
to public assistance because the two programs have the same benefits in New York and cases are allocated
to the programs in significant part to satisfy federal rules rather than based on other distinctions.
The housing data neither include state and city funded programs nor those funded by non-HUD
federal agencies, so they do not cover all types of public housing. Thus, individuals who report housing
assistance in the survey data, but cannot be found in the HUD data may very likely be receiving benefits
5 There is a one-to-one correspondence between PIKs and social security numbers; PIKs are used to protect the anonymity of individuals in the data. 6 The data appendix provides further detail on the adjustment and how we obtain the required probabilities. The adjustment does not correct for failure to link households in which all members with a PIK are true non-recipients, but there are true recipients among the members without a PIK. In the appendix, we explain that such cases should be uncommon and note a result in related work (Meyer, Goerge and Mittag 2017) that such errors cause the incompletely linked data to understate the difference between survey reports and true receipt.
8
through a non-HUD housing program. Therefore, we consider a household to be a recipient of housing
assistance if it is a recipient according to either the survey or the administrative data. In contrast to the
other transfer programs, the CPS questions on housing assistance refer to the current month rather than
any time over the previous year. Thus, we define receipt of housing assistance in the linked data based on
the current month as well. The amount of the housing subsidy in the CPS is not reported, but imputed by
the U.S. Census Bureau using an adjusted conditional mean imputation based on the American Housing
Survey (AHS). The imputation of the subsidy amount is based on sparse information, so that the CPS
contains at most 9 unique values of the subsidy for each of the four regions, and the same value is assigned
to a family of similar composition and income in New York City and Slippery Rock, PA.7 In light of these
shortcomings of the amounts on the official CPS file, we also report results using the imputed housing
subsidy amounts that the U.S. Census Bureau creates for the experimental poverty measure (U.S. Census
Bureau, 2005). We refer to these amounts as “experimental housing subsidy amounts” below and
summarize key differences from the measure on the official file. Full results are provided in the appendix
and supplementary tables. This measure uses fair market rents instead of imputations from the AHS, and
also uses an imputed tenant payment. See Johnson, Renwick, and Short (2011) and Renwick and Mitchell
(2015) for further discussion of both imputation procedures and several alternatives.8
We use these imputed CPS market values for those who report receipt of housing assistance in
the survey, but do not receive assistance from any of the programs in the administrative HUD data, while
we use the administrative amount whenever the administrative data indicate receipt.9 The validation
7 The imputation uses predicted amounts derived from a model estimated in the 1985 AHS (adjusted for inflation). Most of the predictor and cell variables in the model are imputed themselves (e.g. market rent in the AHS and unit size in the CPS are imputed). The cells for the imputation of the subsidy are based on very sparse criteria (3 income ranges, 3 apartment sizes and 4 geographic regions). 8 Results using the housing imputation for the supplemental poverty measure (U.S. Census Bureau, 2015b) for the years when it is available (after 2009) are qualitatively similar and available upon request. 9 In both cases, we annualize the current month subsidy as described in the appendix.

9
information for housing is only available from 2008 to 2011. Consequently, we limit most analyses to this
time period, but include 2007 and 2012 when analyzing SNAP and public assistance. The safety net in New
York is more extensive than in other states, with receipt rates and amounts received above the national
average, particularly for housing assistance. Consequently, we report several results without housing
assistance to focus on the more nationally comparable parts of the safety net.10
Due to the high match rates and the quality of the administrative data, we believe that the
administrative information on program receipt is accurate enough for us to consider as the truth. We do
not mean to claim that linked administrative data are free of errors or contain fewer errors than survey
data in general. Both administrative data and data linkage vary substantially in quality. Our records are
based on actual payments, which are monitored well and consequently line up very closely with
administrative aggregates. Other linked data, such as some components of tax records, are based on
individual reports, so they may be as error ridden as some survey variables. In such cases, it may be better
to combine administrative and survey measures as in Abowd and Stinson (2013), Kapteyn and Ypma
(2007), Oberski et al. (2017), or Meijer, Rohwedder and Wansbeek (2012). While our administrative
variables are not error-free, such errors should be infrequent compared to the extent of survey
misreporting. Therefore, we argue that the results based on the linked administrative data are close to
true values.
Measurement Error
We first summarize the extent of error in survey data on program receipt and amounts to document the
need for corrected income distribution estimates. The first three columns of Table 1 report error rates for
the full New York sample, while the last three columns show similar rates for those with income below
10 Another reason to do so is that Public Assistance and SNAP benefits can be viewed as cash or close to cash, while housing benefits may be valued at less than cost given their in-kind nature or if landlords inflate rents, as Collinson and Ganong (2015) argue. Others argue that the greater certainty of public benefits may make them more valuable than cash in the form of variable earnings (Deshpande 2016, Blundell et al. 2013).
10
twice the poverty line, given our focus on those with low incomes. The errors arise from a combination of
misreporting and imputation due to item non-response, or, for housing assistance amounts, the absence
of a survey question. The first row of Table 1 reports the false negative rates, i.e. the share of true
recipients who do not report receipt in the survey. In the full sample, the false negative rate is 43, 63, and
36 percent for SNAP, public assistance, and housing assistance, respectively. The error rates are still high,
but somewhat lower in the sub-sample of those with incomes below twice the poverty line. The full
sample false negative rates for SNAP and public assistance are higher than found thirty years ago by
Marquis and Moore (1990) in the SIPP, but lower for SNAP than found recently in Meyer, Goerge, and
Mittag (2017) in the CPS for Illinois and Maryland.
Reported in the second row of the table, the false positive rate, i.e. the share of true nonrecipients
who are recorded as recipients, is much lower for these programs. The rates are 1.9, 0.7, and 2.8 percent
for SNAP, public assistance, and housing assistance, respectively. While the rates of false positives are
low, they apply to the much larger pool of non-recipients, so they constitute a substantial share of
households. As a consequence, the reporting rate, the share of dollars paid out that are reported in the
survey, is substantially higher than the share among true recipients. The false positive rates are high in
this table for two additional reasons. First, a substantial share of households does not answer the receipt
questions and has imputed responses. A large share of the false positives is due to the educated guesses
by the U.S. Census Bureau. This is particularly severe for SNAP and public assistance, where imputed
responses make up 36 and 43 percent of the false positives. Second, as discussed above, in the case of
housing assistance, we cannot be certain that households who report receipt, but are not recorded in the
HUD data, do not receive housing assistance from non-HUD federal, state, or local programs. Given that

11
there are several such programs in New York, it is likely that the majority of the 2.8 percent false positive
rate for housing assistance is due to recipients of other programs.11
There is even less previous evidence on misreporting of amounts than on misreporting of receipt,
see Bee and Mitchell (2017) for an exception. However, our results show that it is a substantial problem
as well. The third row of Table 1 shows that more than half of those who correctly report receipt of SNAP
commit large errors (more than $500 in absolute value) in reporting annual amounts. This misreporting
of amounts is even worse for public assistance, where only 12 percent of reporting recipients report an
amount that lies within $500 of their true amount. Our results show that the differences between the
imputed housing assistance amounts and the accurate values are large, understating the true average
subsidy by a factor of almost 4. At the individual level, 97.5% of the imputed amounts for reporting
recipients are off by $500 or more and 75% are off by $4000 or more in the annual amount. This
discrepancy is not surprising given the shortcomings of the imputation procedure discussed above. It is
also in line with the differences Johnson, Renwick, and Short (2011) find when comparing aggregate
numbers from HUD and the CPS for the entire U.S.12
The discrepancies in amounts recorded for true recipients are not as extreme for SNAP and public
assistance. However, the correlations between accurate and reported amounts are low and the standard
deviations of the errors are on the order of 75 percent of mean amounts received. This pattern further
underlines that even among those who correctly report receipt, few report correct amounts. On the
positive side, the results show that amounts are understated less on average than receipt. While the
results confirm the finding in Meyer, Mok, and Sullivan (2015b) that there is only slight net underreporting
11 Thus, in the analyses below, we treat the reports of housing assistance that are not recorded in the HUD administrative data as correct reports, but we do not treat such cases as correct here in order to illustrate the difference between the administrative and the survey data. 12 The differences they find are smaller, but the actual subsidies are higher in New York than in the U.S. (yet imputations are not), and we calculate amounts per household rather than family. Due to lack of data access, we cannot compute household level error rates for the experimental housing subsidy amounts; see Johnson, Renwick and Short (2011) and Renwick and Mitchell (2015) for comparisons.

12
of amounts by true SNAP recipients, our results show substantial underreporting of amounts of public
assistance and housing assistance. We suspect that the substantial under-reporting of public assistance
amounts is at least partly due to a large share of recipients having a portion of their payment sent directly
to their landlord. Taken together, the findings of substantial errors in both receipt and amounts received
suggest that misreporting has the potential to sharply alter the outcomes we examine.
While microdata-based false negative rates are not available for the rest of the country, one can
compare the net reporting rate, the share of dollars paid out for a program that is recorded in the survey,
in New York to that of the rest of the U.S. The sources of state-level reporting rates as well as national
rates by year can be found in Meyer, Mok, and Sullivan (2015a,b). These rates suggest that New York has
worse reporting of public assistance that the rest of the U.S., but better reporting of SNAP than other
states. In Section 6, we discuss the differences between New York and the rest of the U.S. and the broader
applicability of our results.
Income Measures and Subpopulations
In the analyses below, we use reported pre-tax money income (in 2012 dollars) as our main measure of
income, since it is the official and most commonly used measure of household resources in the CPS.
However, we repeat all analyses using a supplemental poverty measure (SPM) type income definition,
which includes in-kind transfers (reported food stamps and imputed market values of housing assistance,
school lunch, Medicaid, Medicare and employer health insurance contributions) and subtracts taxes (state
and federal income and payroll taxes after credits). Our measures of poverty use the official federal
poverty thresholds, which we do not adjust for the SPM income measure. We also use the poverty
thresholds as an equivalence scale to adjust for household size and composition by reporting results in
terms of income relative to the poverty line. The federal poverty thresholds arguably have several
shortcomings and are often considered arbitrary, but in lieu of a universally preferred measure, they
provide a well-known and easily interpretable metric to analyze economic hardship. Contrary to un-linked

13
administrative records, our linked data provide us with the demographic detail necessary to analyze
demographic groups that are known to be particularly affected by poverty. Therefore, besides analyzing
the overall population, we focus on three disadvantaged groups: single mother headed households
(unmarried females with at least one child under 18 present), households with an elderly member (age
65 or older), and households with a disabled member.13
3. Program Effects Across the Income Distribution
We first examine how misreporting affects our understanding of the economic well-being of households
throughout the income distribution, particularly low-income households. We find that underreporting of
government transfers severely understates income of those in deep poverty and thereby makes poverty
look more severe and inequality look worse than it truly is. In addition, while missing dollars as a share of
income fade out quickly as income rises, dollars missed in the survey remain sizeable high up in the income
distribution. Throughout the income distribution, accounting for unreported dollars from our four
programs makes a larger difference than adding reported amounts of our two non-cash programs to cash
income.
Table 2 compares dollars received and reported from SNAP, public assistance, and housing
assistance as well as these programs combined in New York State in 2008-2011 by bins of annual reported
pre-tax household money income relative to the poverty line.14 The definition of the income bins uses
survey data only, since we are primarily interested in how accounting for misreporting changes our views
of the economic conditions of individuals at different points in the income distribution, based on the
typically available data. Throughout the income distribution, program dollars reported are much lower
than the administrative numbers.
13 The survey questions we use to identify disabled individuals were added to the CPS in survey year 2009, so our analyses of households with a disabled member are restricted to reference years 2008 to 2012. 14 Results using our SPM-type income measure to define the income bins are in Appendix Table A3 and we discuss the main differences at the end of this section.
14
The first row of each panel (for all programs first and then each program separately) contains
estimates of program dollars received from the CPS survey data. The second row replaces the survey
reports of program dollars received by the numbers recorded in the administrative data. Focusing first on
those with reported incomes below half the poverty line in column 1, the first two rows of Table 2 show
that while $1,553 in program dollars are reported per person, actual receipt is $2,991. Thus, measures of
income that use the CPS reports of government transfers make individuals in deep poverty look
substantially worse off. And those reported to be in deep poverty are not a small group—they are 5.5
percent of all individuals. As shown in the third row, more than $1400 in transfer payments are missing in
the survey data per person. This makes an important difference for a poor family as, shown in the fourth
row, it adds up to 110 percent of their reported cash income.15 Reported cash income can be found in the
second line from the bottom of the table. In other words, the dollars from the four programs we examine
that are not reported in the survey exceed the amount of cash income that is reported by this group. The
fifth row of each panel contains the dollar reporting rate, i.e. the percentage of dollars received that are
reported in the survey, which is just over half at 52 percent for all programs combined for those in deep
poverty. To put the magnitude of missing transfer dollars into context, the last row for all programs
combined contains the amount received from the two non-cash programs (food stamps and housing
assistance) according to the survey as a proportion of reported cash income. This ratio is 104 percent for
those reported to be in deep poverty, smaller than unreported benefits as a percent of reported cash
income. When including the experimental housing subsidy amounts in income rather than those on the
ASEC file (in Appendix Table A2), income according to the survey increases by $356 for those in deep
15 Note that the base for this percentage includes reported public assistance, but neither food stamps nor housing assistance. We use this denominator for consistency as the numerator changes, but reported cash income also is the most commonly used measure of resources in the CPS and is used to compute the official poverty rate. It therefore provides a good illustration of the magnitude of survey errors relative to the resources included in official statistics.

15
poverty. While this change improves the fraction of resources of the very poor that are captured by the
survey, the missing transfers still amount to 83 percent of reported cash income.
Consequently, accounting for misreporting substantially improves measures of well-being of
individuals in deep poverty, so individuals at the bottom of the income distribution are less severely
deprived than the survey data suggest. In addition, missing a large share of income of the very poor likely
makes measures of inequality look worse, particularly since many common measures of inequality are
most sensitive to values in the tails of the income distribution. Many recent academic papers and policy
reports have emphasized including non-cash benefits in income when measuring poverty (Citro and
Michael 1995 is an important example). This idea is a key element of the Census Bureau’s new
Supplemental Poverty Measure. Reported benefits from the programs we examine here account for a
large share of the differences between such SPM-type and the official poverty rate (see e.g. Figure 3 in
U.S. Census Bureau 2015b). We find that the increase in available resources from adding unreported
benefits from the four programs is larger than the reported amount received from the two non-cash
programs. This suggests that the change in well-being of the poor when correcting for misreporting may
be comparable to or larger in magnitude than the change when moving from a pre-tax money income
measure of resources to an SPM-type definition that includes in-kind benefits based on survey reports.
Subpopulations
Repeating the analyses for disadvantaged subpopulations further underlines that program under-
reporting in the CPS makes poverty look more severe. Missing dollars per person for households with an
elderly member in deep poverty are slightly lower, by $100, than in the overall population, while the CPS
understates resources of households with a disabled member and single mother headed households even
more severely. Missing dollars per person in deep poverty are higher than the overall average by about
30%, or $500 for both groups. Single mother headed households in deep poverty have more than $2000
per person in additional income than the CPS suggests from our four programs alone. Adding these

16
benefits to pre-tax money income increases their resources by more than 150 percent. In comparison,
adding the survey measures of food stamps and housing assistance only represents an increase of 135
percent ($1734). As in the overall population using the experimental housing subsidy amounts makes the
survey resource measure higher, but a substantial share of income remains missing in the survey. See
Supplementary Table S5 for further detail.
Relative Importance of Programs
Misreporting not only understates the importance of transfers overall, but also makes programs
with somewhat higher reporting rates such as the Food Stamp Program appear relatively more important
for low income individuals. With annual transfers of $914 per individual in deep poverty, food stamps are
a more important resource than public assistance, but substantially smaller than housing assistance.
However, 85 percent of food stamp dollars received by individuals in deep poverty are reported in the
CPS, while housing and public assistance have low dollar reporting rates in this income category (38
percent for housing assistance and 34 percent for public assistance). The higher reporting rate makes the
Food Stamp Program appear to be the most important transfer program for those in deep poverty: In the
survey data, it accounts for slightly more than half of transfer income received from any of the programs
we analyze. However, the administrative data reveal that it makes up less than a third of total dollars
received and that housing assistance is a more important resource for individuals in deep poverty.
Missing Dollars as Income Rises
Missing program dollars, as a share of income, fall quickly as income rises. For those between half
the poverty line and the poverty line, the unreported dollars add up to 28 percent of reported income.
The decline continues above the poverty line as reported cash income is almost 10 times higher than
missing transfers for those in near poverty (100-150 percent of the poverty line) and more than 20 times
higher for individuals between 150 and 200 percent of the poverty line. As a share of income, missing

17
dollars become almost negligible after that.16 This fade out is mainly driven by the rapid increase in income
and reinforced by declining total amounts received from government programs. However, throughout the
income distribution, adding unreported dollars continues to increase available resources by a larger
amount than does including reported non-cash benefits in the income definition.
For the subpopulations, amounts received are higher and reporting rates comparable, so
substantial absolute dollar amounts are missing in the survey at higher income levels as well. For the
disabled and elderly, more than $2000 per person are missing between 50 and 100 percent of the poverty
line and more than $1600 are missing between 100 and 150 percent. For single mother headed
households below 150 percent of the poverty line, missing dollars are slightly lower, but both received
and missing dollars remain sizeable higher in the income distribution. Between 150 and 200 percent of
the poverty line, missing dollars still add up to 10 percent of reported cash income for these households.
Even for individuals in single mother headed households that belong to the upper half of the income
distribution (with income that exceeds four times the poverty rate) the survey numbers fall short of actual
benefit receipt by $414 per person.
The main reason why missing dollars remain sizeable in higher income ranges is that reporting
rates decline with income. While slightly more than half of transfer dollars received in deep poverty and
almost half (46 percent) of dollars received between 50 and 100 percent of the poverty line are reported,
only 38% of dollars received between 100 and 200 percent of the poverty line and an even smaller 20%
of dollars received higher up is captured by the CPS. Reporting rates that decline with income not only
make simple corrections for misreporting inaccurate, but also imply that transfer payments become less
and less visible in the survey data as income increases. Consequently, studies of those that have annual
16 As Appendix Table A2 shows, using experimental housing subsidy amounts only affects the level of these numbers, but has little effect on the rate of decline as income rises.

18
incomes well above the poverty line but still receive transfers, such as those with volatile incomes or those
who mix work with welfare receipt, are likely to be particularly affected by the problem of underreporting.
In summary, we find that underreporting in the CPS causes us to severely underestimate
resources available to the poor and thereby makes poverty look more severe and inequality worse. As a
share of income, the understatement of resources in the survey data fades out at higher income levels,
but does so slower for the elderly, disabled and single mothers. Using the SPM-type income measure
instead of reported cash income to form the income bins changes our results slightly, but does not affect
the main conclusions. Results are reported in Appendix Table A3.17
4. Poverty Reduction and Program Effects
The poverty reduction due to government transfers is one of the most important indicators used to
evaluate the effectiveness of individual transfer programs as well as overall government policies to reduce
economic deprivation. Most of such analyses, regardless of the indicator of effectiveness they employ,
are based on survey data, since other data sources rarely provide the required family characteristics.
In the calculations below, we consider anyone to be moved out of poverty by a program if their
non-program income is below the poverty threshold, but exceeds it when adding benefits received from
the program. These statistics have two well-known caveats. First, they abstract from behavioral
responses. Second, more than one program may receive credit for moving a given household out of
poverty if they individually raise the household above the poverty threshold. Of course, when we look at
the effect of combinations of programs this double counting is removed. We focus on 2008 to 2011,
because we have administrative data on all programs for these four years. The average poverty rate
17 Most notably, both dollars received and missing dollars are lower up to 150 percent of the poverty line and higher above this threshold. This result holds both in absolute terms and as a share of cash income. The main reason for this pattern is that including reported government transfers in the income definition moves many individuals, particularly transfer recipients, to higher income bins.
19
excluding the four programs we examine (i.e. according to reported cash income without public
assistance) was 13.6 percent over this time period.
Table 3 shows that the four programs moved a much larger fraction of people out of poverty than
the CPS suggests. Including reported benefits from the four programs in the income definition reduces
the average poverty rate by 2.8 percentage points, while including benefits according to the
administrative data reduces it by 5.3 percentage points. Thus, when taking underreporting into account,
all programs combined move another 2.5 percent of the population out of poverty. Consequently, the
overall poverty reducing effect of the four government transfer programs is almost twice as large as the
CPS indicates. Housing assistance appears particularly more effective when using the administrative
numbers, moving an additional 1.7 percent of all individuals out of poverty. It thereby has the largest
poverty reducing effect of the programs we examine. However, this reduction is severely understated in
the survey data, where it is only half as large.18 Excluding housing assistance entirely, the poverty
reduction of food stamps and public assistance combined was 1.9 percentage points in the CPS and almost
50 percent higher in the linked data (2.8 percentage points). Most of the reduction is due to food stamps
(2.1 percentage points), and only 0.5 percentage points are due to public assistance.
Subpopulations
The survey understatement of poverty reduction is even more pronounced for single mother headed
households and those with a disabled member, due to their higher program receipt. Results are reported
in the bottom panel of Table 3 for single mothers and in Appendix Table A5 for households with an elderly
or disabled member. While average poverty rates according to the base income measure are lower for
18 The results in Appendix Table A4 show that understating housing subsidy amounts plays an important role in these analyses. The experimental housing subsidy amounts suggest a substantially higher poverty reducing effect of housing assistance (2 percentage points) and all programs combined (3.9 percentage points). While this is an improvement, fully correcting for underreporting still increases the poverty reduction by about a third of the (already improved) survey estimates.

20
households with elderly members (10.0 percent), they are higher for those with a disabled member (19.8
percent) and those headed by single mothers (37.5 percent). For households with disabled members and
those headed by single mothers, both the poverty reducing effects and the differences between the
administrative and the survey measures are striking. All programs combined account for a 10.2 percentage
point reduction in the poverty rate for disabled households and 18.3 percentage points for single mother
headed households. For the latter, the survey only captures a reduction of 7.3 percentage points.
Consequently, a reduction in the poverty rate of 11.0 percentage points, over 1.5 times that in the
reported data, is missed when only using the survey data.
As Table 3 shows, the difference for single mother headed households is primarily due to the large
impact of housing assistance, which has poorly reported receipt and poorly imputed amounts. The poverty
reduction due to housing assistance in the CPS is only 0.7 percent, while the administrative numbers show
that the decrease exceeds 7 percentage points, i.e. its poverty reducing effect for single mothers is 10
times higher than the CPS suggests. This understatement is drastically reduced (to 25 percent for housing
assistance and 49 percent overall) when using the experimental housing subsidy amounts.19 These
findings underline that substantial improvements to the survey based estimates are feasible, but also that
studies of subpopulations should be particularly cautious about survey errors.
Public assistance also has a much larger effect on the poverty rate for all three subgroups than
the effect recorded in the CPS: using the administrative measure, it is 5 times larger than recorded for
households with a disabled member and 6.5 times larger for households headed by a single mother. As
the poverty rate is lower for the elderly, the effect of our four government programs is lower for them in
absolute terms. Yet, they still reduce poverty by 38 percent, while the survey data only suggest a reduction
of 24 percent.
19 Appendix Tables A5 and A6 show that the improvements are less sharp, but still substantial for the elderly and the disabled.

21
Other Income Thresholds
The comparisons above show that the CPS poorly measures the number of people moved across the
federal poverty threshold, but the literature frequently considers other income cutoffs. The previous
section shows that overall reporting rates decline with income, so the fraction of program effects missed
by the CPS is likely to be larger for higher cutoffs and smaller for lower cutoffs. For example, the reduction
in deep poverty due to government programs appears lower in the CPS than it actually is by a smaller
amount than the reduction in poverty. On average, 6 percent of individuals lived in households with base
income below 50 percent of the poverty line, i.e. in deep poverty, between 2008 and 2012. According to
administrative measures of transfer receipt, government transfers account for a smaller reduction in the
rate of deep poverty than the poverty rate, at 3.3 versus 5.3 percentage points. In the survey data, the
reduction in both rates is similar at 2.5 and 2.8 percentage points for deep poverty and poverty,
respectively.
Reporting rates decline with income, so while government programs become less important at
higher income thresholds, the fraction of their effect that is missed in the CPS also becomes larger. For
example, 22.3 percent of individuals live in near poverty, i.e. in households with base income below 150
percent of the federal poverty line. The four government transfer programs reduce this rate by 4.3
percentage points. Thus, their effect is indeed smaller in absolute numbers than their effect on poverty.
However, only a 1.2 percentage point decrease in near poverty is captured by the survey reports.
Consequently, the programs move more than 3.5 times as many people out of near poverty as the CPS
suggests, making them look substantially more effective when correcting for misreporting. The CPS
indicates that government transfers only move 0.6 percent of the population across twice the poverty
line, while the linked data reveal that they move 2.8 percent across this threshold.
For the disadvantaged subpopulations, the differences between the survey and administrative
effects are often larger at higher thresholds. Of the 11-point reduction in near poverty for single mother

22
headed households, only 2 percentage points can be found in the CPS. Similar results are found at twice
the poverty line. Using the experimental housing subsidy amounts improves the estimates of poverty
reduction, but this improvement is smaller at higher thresholds. This result is due to the imputed amounts
from the experimental poverty measure becoming closer to the original ASEC imputations (and eventually
even lower) as income rises.
Poverty Gaps
Next, we examine the poverty gap and how much of it is filled by government transfers. The poverty gap,
the total dollars needed to raise all households to the poverty line, has been emphasized by many
researchers as better capturing deprivation (see e.g. Ravallion 1996, Deaton 1997). Correcting the survey
data for underreporting increases the share of the poverty gap filled by the four programs by 44 percent;
they now fill about half of the poverty gap rather than one-third of the gap. As with the poverty rate,
housing assistance is the most important program, filling more than a quarter of the poverty gap. Food
stamps are almost as important, filling 23 percent of the poverty gap, while public assistance accounts for
an 11-percentage point reduction.20 Both housing and public assistance are poorly reported and thereby,
with about half of their effect missing in the survey data, appear much less effective at narrowing the
poverty gap. SNAP is reported more accurately, but almost a quarter of its effect is missing nonetheless.
The survey data also miss a large share of the poverty gap that is filled for the disadvantaged
subgroups. Even though the poverty gap is of similar magnitude for them, government programs fill a
larger share of it for households with disabled members (62 percent) and single mother headed
households (67 percent). Again, the differences between survey and administrative data are striking. For
example, the survey misses a 10 percentage point reduction in the gap due to public assistance and a 22
percentage point reduction due to housing assistance for single mother headed households.
20 Note that the contributions of the individual programs add up to more than their joint contribution, since pooling them leads to a larger amount being spent above the poverty line.

23
Changes over Time
Due to measurement error, the survey data may not only misrepresent the level of poverty and program
effects, but also how they change over time as trends in misreporting magnify or hide trends in poverty.
We focus on how accurately the CPS reflects the effect of the government program expansion during the
Great Recession. According to our base income measure, the poverty rate grew steadily between 2008
and 2011, from 12.7 percent to 14.4 percent, i.e. a 1.7 percentage point (13.8 percent) increase. However,
when including transfers, the poverty rate only grew by 0.8 percentage points (7 percent) according to
survey reports and 0.3 percentage points (4 percent) according to the administrative measures. Neither
of the measures that include transfers suggests an economically large increase in poverty over the
recessionary period,21 but the increase is more than twice as large when relying on survey data only.
Substantively, these numbers show that the expansion of government benefits successfully dampened
the increase of the poverty rate, because the poverty reducing effect of the programs kept up with its
increase: according to the administrative data, the poverty reduction due to all programs combined
increased from 4.5 to 5.9 percentage points between 2008 and 2011. In the survey data, the poverty
reducing effect of all programs combined grew by 1 percentage point from 2.1 to 3.1 percent between
2008 and 2011, quite a bit less than the 1.4 percentage point increase we see in the linked data. The
difference is mainly due to increased underreporting of SNAP. This result shows that trends in reporting
can affect trends in measured outcomes.
The results are overall similar, but less pronounced when looking at our SPM-type income
measure. This difference is mainly due to fewer people being poor according to the SPM-type income.
While the differences between CPS reports and the administrative measures are still large, both program
effects and their understatement in the CPS are smaller overall for the measures we examine. In summary,
21 This is in line with Sherman (2011), who relies on a simple imputation of missing program benefits and finds that programs fill in nearly the entire drop in income in the recession.

24
transfer misreporting not only makes the economic situation of low income households look worse, but
also causes the poverty reducing effect of government transfer programs to be greatly understated. We
find that regardless of the measure of poverty used, underreporting makes poverty look higher in survey
data and severely understates the effectiveness of government policies in reducing economic hardship.
Particularly for the disadvantaged subpopulations, government programs have a strikingly larger effect
on measures of poverty than indicated in the CPS. The CPS is the source of the official poverty rate and
thereby an important source of information that guides anti-poverty policies. Underreporting of transfer
receipt therefore makes government efforts to reduce poverty appear much less effective. Maybe even
worse, since measures of the cost of government programs are usually based on administrative data,
under-reporting in surveys has an uneven effect on cost-benefit analyses.
5. Holes in the Safety Net
Another important criterion used by researchers to evaluate government transfer programs and the
overall safety net is how well they reach people in need. We focus on single mothers who have little or
no income from both work and welfare programs. This group has been called disconnected single
mothers, and has received particular attention in the literature (Turner, Danziger and Seefeld 2006, Blank
and Kovak 2009, Bitler and Hoynes 2010, Loprest 2011, Loprest and Nichols, 2011). The government
programs for which we link data are particularly relevant for single mothers. However, we expect
misreporting to make the safety net look substantially worse for other disadvantaged groups as well, since
the consequences of misreporting loom particularly large in such studies for several reasons. First, the
measures of interest are very sensitive to the common failure to report program receipt in surveys.
Second, unlinked administrative data usually do not contain the covariates required to isolate particularly
poor populations, so these kinds of analyses usually have to rely on survey data. Finally, reporting rates
are known to differ by demographic group (Meyer, George, and Mittag 2017), so using survey data alone
to determine which demographic groups the safety net fails to reach is particularly problematic.

25
Table 4 reports the percentage of single mother headed households who are missed by the safety
net according to survey reports and administrative program receipt for 2008 to 2011. The first row uses
the definition from Blank and Kovak (2009), which considers anyone disconnected who does not work and
does not receive TANF, but we also include General Assistance, since much of what used to be TANF is
now under the General Assistance program. In line with their definition, we only consider single female
household heads under age 55 and exclude full-time students and households with income higher than
twice the poverty line. Also following their approach, we initially require no earnings and no benefits in
the left panel of Table 4, but then allow up to $2000 in annual earnings and $1000 in benefits from all
programs combined in the right panel.22 Even for the definition of Blank and Kovak in the first row, which
is only affected by failure to report public assistance, the CPS overstates the number of single mother
headed households without earnings and access to the safety net by 34 percent. While allowing for some
earnings and program receipt increases the numbers of households left behind, it does not decrease the
extent to which the survey overstates the gaps in coverage of the safety net. The survey continues to
overstate the number of households by 33 percent, so that according to the CPS, slightly more than 5
percent of all single mother headed households seem to fall through the cracks of the safety net even
though they are in fact program recipients, as we see in the administrative data.
The problem that survey data overstates holes in the safety net is not due to the particular
definition used by Blank and Kovak, but arises regardless of how we use the survey data to measure the
coverage of the safety net and extreme deprivation. Taking more transfer programs into account makes
the safety net look much more effective at reaching disadvantaged populations, but does not alleviate the
problems caused by underreporting of government transfers. In the remaining rows of Table 4, we
consider several definitions of being missed by the safety net, varying what programs we include. Going
down the rows of Table 4 underlines two patterns. First, we see that a large share of those who neither
22 For comparability with their definition, all amounts are in 2005 dollars.
26
work nor receive public assistance do receive other cash or non-cash transfers. Including non-cash
benefits particularly affects the number of households the safety net fails to reach: adding food stamp
receipt reduces the fraction by 75 percent (70 percent for the low income and benefits definition). This
reduction is larger than the effect of including reported receipt of all other cash programs combined.
Accounting for housing assistance as well, reduces the remaining number by over 30 percent.23
Second, regardless of which programs are included in the definition, the third and sixth columns
of Table 4 show that the extent to which the safety net fails to reach those in need depends substantively
on whether or not we use the administrative data to measure program receipt. Depending on which
additional programs we include, the extent to which the CPS overstates the fraction of single mothers that
neither work nor participate in any of the programs rises to between 50 and 113 percent in the survey
data. The range of overstatement is slightly lower (40 to 82 percent) when including households with low
earnings and low benefit receipt, but the survey data still make the coverage of the safety net and its
ability to reach disadvantaged individuals look much worse. In fact, including additional programs
aggravates the problem of underreporting. The fraction of single mothers who appear to fall through the
cracks, but actually receive one or more of the government benefits according to the administrative data,
increases as the definition of the safety net becomes more inclusive. While 25 percent of those who
appear to be left behind when only considering public assistance do in fact receive program benefits, this
share rises to more than 40 percent when including food stamps and housing assistance. Finally, more
than 75 percent of those who appear to be left behind in the survey when including all cash and non-cash
transfers are actually covered by one or more of the programs.24 On the positive side, the CPS correctly
23 Using the housing assistance amounts from the experimental poverty file does not affect this substantively. It only marginally decreases the reduction for the low benefits definition. 24 When including all cash and non-cash programs, 0.8% of households are left behind according to the survey and 0.2% according to the administrative measure. These numbers are based on the 2007-2012 data, because the sample size using 2008-2011 data only is too small to allow disclosure. The numbers are not included in Table 4 and understate the difference between survey and combined data as housing assistance is not corrected in 2007 and 2012.

27
reflects the pattern of the time trend. The administrative and the survey data agree on the fact that both
the number and the share of single mothers the safety net fails to reach increased initially during our time
period and declined as the economy improved.
The exaggeration of the extreme left tail of the income distribution seems to be a common effect
of program misreporting. Other measures that heavily weight these outliers are likely subject to
substantial error. For example, the share of individuals with income below $2 per day (e.g. Ravallion, Chen,
and Sangraula 2008, Shaefer and Edin, 2013) is likely to be overstated in surveys due to program
misreporting. In most cases, receipt of a single government program is sufficient to move a household out
of this category. Thus, the pervasive failure to report program receipt at all makes any entirely survey
based measure of extreme poverty likely to exaggerate true material deprivation.
6. Applicability to other States, Programs, and Datasets
While our specific results pertain to New York, a large and important state, over a six-year period, it is
very likely that our results are more general. As Table 5 shows, New York is similar demographically to the
rest of the U.S. in terms of age, education, race and the share Hispanic. The poverty rate in New York and
the generosity of its welfare system are higher than in the nation as a whole. The most striking difference
between New York and the rest of the U.S. is the frequency of public housing receipt. Our results on the
importance of under-reporting of housing assistance receipt and the understatement of the value of the
assistance almost certainly overstate these problems for the rest of the U.S.25
On the other hand, several other studies have found reporting of SNAP to be worse in other states
than what we find for New York. While evidence from validation studies for other states is scarce, it
indicates that reporting is better in New York. Meyer, Goerge, and Mittag (2017) find higher rates of
misreporting in the CPS for Illinois and Maryland. Cerf Harris (2015) uses validated ACS data to show that
25 There is a bias in the other direction, though, since we do not have information on the substantial non-HUD housing programs, we understate the differences between the survey and complete administrative data.

28
the rates of false negatives are substantially higher in Texas than in New York. In terms of aggregate
comparisons, Meyer, Mok, and Sullivan (2015a,b) provide a detailed picture of dollar reporting rates
nationally. As mentioned above, their results indicate that New York appears to have higher reporting
than the national average.
More importantly, we are only able to correct for mis-reporting in four programs, SNAP, TANF,
General Assistance, and housing assistance. Meyer, Mok and Sullivan (2015a) document that the CPS
substantially understates receipt of other benefits including the Earned Income Tax Credit, unemployment
insurance, Supplemental Security Income (SSI), Workers’ Compensation, and Social Security (OASDI).
While net reporting of OASDI receipt is better than for other programs, given its size and the evidence on
the extent of underreporting of OASDI and SSI (e.g. Nicholas and Wiseman 2010), the dollars missed
exceed those for any of the programs analyzed here. Our study would likely show much larger overall
effects of unreported transfers if we were able to include these programs. We expect that our results
especially understate the problem of under-reported transfers to those 65 and older given that we do not
have administrative data on the major programs for this demographic group such as OASDI and SSI.
Using data from a different survey, such as the ACS or the SIPP, may reduce some of the problems
that we have noted, but introduces others. Program underreporting rates in in the ACS and SIPP are lower
than in the CPS (Meyer, Goerge, and Mittag 2017), but still substantial. The ACS does not record the
amounts of key benefits such as SNAP, while the SIPP has comparability issues across waves, particularly
with the recent redesign. Thus, using other data sets does not solve the problem of survey errors.
7. Conclusions and Implications
Previous work has documented that government transfers are substantially under-reported in surveys
such as the CPS. Past work has not directly shown that substituting accurate measures for these error-
ridden variables greatly changes the results of widely used analyses of important questions. The results in
this paper show that using administrative data combined with survey data sharply alters our view of the

29
well-being of households at the bottom of the income distribution and the effects of transfer programs.
The corrected data indicate that those with very low incomes, specifically those below half the poverty
line, have considerably higher incomes than reported. The under-reporting of transfers is less important
as income rises, but for some programs such as SNAP and housing assistance, substantial dollars are
under-reported well above the poverty line. Throughout the income distribution, correcting for
underreporting of our four programs has a larger impact on household resources than including reported
non-cash benefits from these programs. The omission of the latter is one of the principal arguments
advanced for new poverty measures such as the SPM. We also find that poverty rates are markedly lower
and the poverty reducing effects of government programs are much greater. All of these differences are
much larger for disadvantaged groups, in particular single mother headed households. In addition, we find
that the fraction of non-working single mothers missed by government transfers is much lower than
previously reported.
Since income and program receipt are widely used in descriptive analyses, and as dependent and
independent variables in causal studies, these results have broad implications. Going beyond income and
program receipt, this study shows that linked data can be a key tool to improve both the quality of
available data and the accuracy of the estimates derived from these data. Therefore, besides the
substantive contributions of the paper, it demonstrates the value of linking administrative data to an
important and widely used survey dataset. This type of linkage is likely to be increasingly used to augment
and remedy weaknesses of survey data. In addition to replacing the survey reports by the more accurate
administrative measure as we do here, linked data can also be used to improve survey data by examining
imputations for item nonresponse and how they affect estimates (e.g. Bollinger et al. 2015, Hokayem,
Bollinger and Ziliak 2015, Meyer, Goerge and Mittag, 2017). A series of recent papers (Schenker,
Raghunathan and Bondarenko 2010, Davern, Meyer and Mittag 2016, Mittag 2016) uses information from
linked data to create better imputations.

30
However, linked data may often not be available for the specific question or population of
interest. In such cases, one way for researchers to proceed is to use the contaminated survey data and a
correction for misreporting. Only a few studies attempt to correct for program underreporting (see e.g.
Scholz, Moffitt and Cowan 2009 or Sherman 2011), but most do not. Meyer and Mittag (forthcoming) and
Mittag (2016) show that even simple corrections can yield large improvements, but corrections can also
make biases worse if key assumptions do not hold. The results demonstrate that a better understanding
of reporting errors can greatly improve such corrections. Linked data can be used to study the conditions
under which survey errors arise more generally and thereby point to the conditions under which surveys
are likely to be (un)reliable (Celhay, Meyer and Mittag, 2017).
Another way to proceed in the absence of linked data is to improve the way we use survey data
by being more cautious when they are known to be problematic. Survey users can also use our findings
to avoid misleading conclusions from the contaminated survey data. Policy makers and researchers
interested in descriptive statistics on income can use the evidence on the direction and rough magnitude
of the bias to assess the likely error in their statistics of interest. Academic researchers interested in causal
inference rely on more complex models where the bias from misreporting depends on joint distributions
of mis-measured and other variables. Since it is harder to assess the direction or magnitude of bias in
these cases, further work with validation data is needed, but will be necessarily more context specific.
Researchers can also avoid measures where misreporting is particularly severe altogether and rely on
more robust measures, for example, by using consumption instead of income as a measure of income for
the poor as Meyer and Sullivan (2003, 2008, 2011, 2012a,b) suggest.
In brief, the findings of this paper have important implications for survey producers and data
users, including both policy makers and academic researchers. For survey producers, they highlight that
misreporting in survey data is a first order concern. Investigating it further would allow them to reduce it
through better survey design and to mitigate its consequences by informing data users about the extent

31
and nature of survey errors. For data users, our results amplify the call for caution with survey data.
Beyond the extent of misreporting already documented in previous studies, our findings clearly show that
errors in multiple mis-measured variables can lead to large cumulative biases. On the positive side, this
study highlights that linking survey and administrative data can solve or greatly mitigate this problem.

32
References
Abowd, J.M., and Stinson, M.H. 2013. Estimating Measurement Error in Annual Job Earnings: A Comparison of Survey and Administrative Data. Review of Economics and Statistics, 95(5), 1451–1467.
Armour, P., Burkhauser, R.V. and Larrimore, J. 2013. Deconstructing Income and Income Inequality Measures: A Crosswalk from Market Income to Comprehensive Income. American Economic Review, 101(3), 173-177.
Bee, C.A., Gathright, G.M.R., and Meyer, B.D. 2015. Bias from Unit Non-Response in the Measurement of Income in Household Surveys. Unpublished Paper, University of Chicago.
Bee, C. A., and Mitchell, J. 2017. The Hidden Resources of Women Working Longer: Evidence from Linked Survey-Administrative Data. In C. Goldin and L.F. Katz (Eds.), Women Working Longer: Increased Employment at Older Ages. Chicago: University of Chicago Press.
Ben-Shalom, Y., Moffitt, R.A., and Scholz, J. K. 2012. An Assessment of the Effectiveness of Anti-Poverty Programs in the United States. In P.N. Jefferson (Ed.), The Oxford Handbook of the Economics of Poverty. Oxford: Oxford University Press.
Bitler, M., and Hoynes, H. 2010. The State of the Social Safety Net in the Post–Welfare Reform Era. Brookings Papers on Economic Activity.
Black, D.A., Sanders, S., and Taylor, L. 2003. Measurement of Higher Education in the Census and Current Population Survey. Journal of the American Statistical Association, 98(463), 545–554.
Blank, R.M. and Kovak, B.K. 2009. The Growing Problem of Disconnected Single Mothers. In C. J. Heinrich and J. K. Scholz (Eds.) Making the Work-Based Safety Net Work Better. New York: Russell Sage Press.
Blank, R. M., and Schoeni, R. F. 2003. Changes in the Distribution of Children's Family Income over the 1990's. American Economic Review, 93(2), 304-308.
Blundell, R., Costa Dias, M., Meghir, C., and Shaw, J. 2013. Female labor supply, human capital, and welfare reform. NBER Working Paper No. 19007.
Bollinger, C.R. 1998. Measurement error in the Current Population Survey: a nonparametric look. Journal of Labor Economics, 16(3), 576–94.
Bollinger, C.R. and Hirsch, B. 2006. Match Bias from Earnings Imputation in the Current Population Survey: The Case of Imperfect Matching. Journal of Labor Economics, 24(3), 483-519.
Bollinger, C.R., Hirsch, B.T., Hokayem, C.M., & Ziliak, J.P. 2015. Trouble in the Tails? What We Know about Earnings Nonresponse Thirty Years after Lillard, Smith, and Welch. University of Kentucky Center for Poverty Research Discussion Paper Series, DP2015-02.

33
Bound, J., and Krueger, A.B. 1991. The Extent of Measurement Error in Longitudinal Earnings Data: Do Two Wrongs Make a Right? Journal of Labor Economics, 9(1), 1-24.
Bound, J., Brown, C., and Mathiowetz, N. 2001. Measurement error in survey data. In: J.J. Heckman & E.E. Leamer (Eds.), Handbook of Econometrics. Vol. 5, cp. 59, pp. 3705–3843. Amsterdam: Elsevier.
Celhay, P., Meyer, B.D., and Mittag, N. 2017. What Leads to Measurement Errors? Evidence from Reports of Program Participation from Multiple Surveys. Unpublished Manuscript.
Chua, T. C., and Fuller, W. A. 1987. A model for multinomial response error applied to labor flows. Journal of the American Statistical Association, 82(397), 46-51.
Cerf Harris, B.. 2014. “Within and Across County Variation in SNAP Misreporting: Evidence from Linked ACS and Administrative Records.” U.S. Census Bureau CARRA Working Paper 2014-05.
Citro, C.F. and Michael, R.T. (Eds.). 1995. Measuring Poverty: A New Approach. Washington, DC: National Academy Press.
Collinson, R.A., and Ganong, P. 2015. The Incidence of Housing Voucher Generosity. Unpublished Manuscript.
Dahl, M., DeLeire, T., and Schwabish, J.A. 2011. Estimates of Year-to-Year Volatility in Earnings and in Household Incomes from Administrative, Survey, and Matched Data. Journal of Human Resources, 46(4), 750–774.
Davern, M., Call, K.T., Ziegenfuss, J., Davidson, G., Beebe, T.J., and Blewett, L. 2008. Validating Health Insurance Coverage Survey Estimates: A Comparison of Self-Reported Coverage and Administrative Data Records. Public Opinion Quarterly, 72(2), 241-259.
Davern, M., Meyer, B.D., and Mittag, N. 2016. Creating Improved Survey Data Products Using Linked Administrative-Survey Data. In 2016 Federal Committee on Statistical Methodology Research Conference Proceedings.
Deaton, A. 1997. The Analysis of Household Surveys. Baltimore: Johns Hopkins Press.
Deshpande, M. 2016. Does Welfare Inhibit Success? The Long-Term Effects of Removing Low-Income Youth from the Disability Rolls. American Economic Review 106(11), 3300–3330.
Gathright, G.M.A., and Crabb, T.A. 2014. Reporting of SSA Program Participation in SIPP. Working Paper, U.S. Census Bureau.
Hokayem, Charles, Christopher Bollinger, and James P Ziliak. 2015. The Role of CPS Nonresponse in the Measurement of Poverty. Journal of the American Statistical Association, 110(511), 935-945.
Hoynes, H.W., Page, M.E. and Stevens, A.H. 2006. Poverty in America: Trends and Explanations. Journal of Economic Perspectives 20: 47-68.

34
Johnson, P., Renwick, T. and Short, K. 2011. Estimating the Value of Federal Housing Assistance for the Supplemental Poverty Measure. U.S. Census Bureau SEHSD Working Paper #2010-13.
Kapteyn, A., and Ypma, J.Y. 2007. Measurement error and misclassification: A comparison of survey and administrative data. Journal of Labor Economics, 25(3), 513-551.
Loprest, P. 2011. Disconnected families and TANF. Washington, DC: The Urban Institute. Temporary Assistance for Needy Families Program—Research Synthesis Brief.
Loprest, P., and Nichols, A. 2011. Dynamics of being disconnected from work and TANF. Washington, DC: The Urban Institute.
Marquis, K. H., and Moore, J.C. 1990. Measurement Errors in SIPP Program Reports. In Proceedings of the 1990 Annual Research Conference. 721–745. Washington, D.C.: U.S. Bureau of the Census.
Meijer, E., Rohwedder, S., and Wansbeek, T. 2012. Measurement error in earnings data: using a mixture model approach to combine survey and register data. Journal of Business & Economic Statistics, 30(2).
Meyer, B.D., Goerge, R. and Mittag, N. 2017. Errors in Survey Reporting and Imputation and Their Effects on Estimates of Food Stamp Program Participation. Unpublished Manuscript.
Meyer, B.D. and Mittag, N. forthcoming. Misclassification in Binary Choice Models. Journal of Econometrics.
Meyer, B.D., Mok, W.K.C. and Sullivan, J.X. 2015a. The Under-Reporting of Transfers in Household Surveys: Its Nature and Consequences. Harris School of Public Policy Studies, University of Chicago Working Paper.
Meyer, B.D., Mok, W.K.C. and Sullivan, J.X. 2015b. Household Surveys in Crisis. Journal of Economic Perspectives, 29 (4), 199–226.
Meyer, B.D. and Sullivan, J.X. 2012a. Identifying the Disadvantaged: Official Poverty, Consumption Poverty, and the New Supplemental Poverty Measure. Journal of Economic Perspectives, Summer 2012, 111-136.
_____. 2012b. Winning the War: Poverty from the Great Society to the Great Recession. Brookings Papers on Economic Activity, Fall, 133-183.
_____. 2011. Further Results on Measuring the Well-Being of the Poor Using Income and Consumption. Canadian Journal of Economics.
_____. 2008. Changes in the Consumption, Income, and Well-Being of Single Mother Headed Families. American Economic Review, 98(5), 2221-2241.
_____. 2003. Measuring the Well-Being of the Poor Using Income and Consumption. Journal of Human Resources, 38:S, 1180-1220.

35
Mittag, N. 2016. Correcting for Misreporting of Government Benefits IZA Discussion Paper No. 10266.
Nicholas, J. and Wiseman, M. 2010 Elderly Poverty and Supplemental Security Income, 2002-2005. Social Security Bulletin, Vol. 70(2).
NORC. 2011. Assessment of the US Census Bureau's Person Identification Validation System. NORC at the University of Chicago Final Report presented to the US Census Bureau.
Oberski, D.L., Kirchner, A. Eckman, S. and Kreuter, F. 2017. Evaluating the quality of survey and administrative data with generalized multitrait-multimethod models. Journal of the American Statistical Association
Poterba, J.M., and Summers, L.H. 1986. Reporting Errors and Labor Market Dynamics. Econometrica, 54(6), 1319.
Ravallion, M. 1996. Issues in measuring and modeling poverty. Washington, D.C: World Bank Publications.
Ravallion, M., Chen, S. and Sangraula, P. 2008. Dollar a Day Revisited. Research Working Paper no. 4620, World Bank, Washington, DC.
Renwick, T., and Mitchell, J. 2015. Estimating the Value of Federal Housing Assistance for the Supplemental Poverty Measure. U.S. Census Bureau SEHSD Working Paper #2016-01.
Shaefer, H.L., and Edin, K. 2013. Rising extreme poverty in the United States and the response of federal means-tested transfer programs. Social Service Review, 87(2), 250-268.
Scholz, J.K., Moffitt, R. and Cowan, B. 2009. Trends in income support. In: M. Cancian and S. Danziger, (Eds.), Changing poverty, changing policies, Washington, D.C.: Russell Sage Foundation.
Sherman, A. 2011. Poverty and Financial Distress Would Have Been Substantially Worse in 2010 Without Government Action, New Census Data Show. Center on Budget and Policy Priorities Policy Report.
Schenker, N., Raghunathan, T. E. and Bondarenko, I. (2010), Improving on analyses of self-reported data in a large-scale health survey by using information from an examination-based survey. Statistics in Medicine, 29: 533–545.
Turek, J., Scheuren, F. Sinclair-James, B., Ghose, B. and Desale, S. 2009. The Effects of Imputation of CPS Income and Poverty Series: 1981-2007. In JSM Proceedings, Section on Survey Research Methods. Alexandria, VA: American Statistical Association, 1892-1900.
Turner, L., Danziger, S. and Seefeldt, K. 2006. Failing the Transition from Welfare to Work: Women Chronically Disconnected from Employment and Cash Welfare. Social Science Quarterly 87(2): 227–249.
36
U.S. Census Bureau. 2005. Alternative Poverty Estimates in the United States: 2003. P60-227. June 2005.
U.S. Census Bureau. 2015a. Income and Poverty in the United States: 2014. P60-252, September 2015.
U.S. Census Bureau. 2015b. The Supplemental Poverty Measure: 2014. P60-254, September 2015.
U.S. Census Bureau. 2015c. American Community Survey Research and Evaluation Report, Center for Administrative Records Research and Applications Memorandum Series #16-7.
Wagner, D., and Layne, M. 2014. The Person Identification Validation System (PVS): Applying the Center for Administrative Records Research & Applications' (CARRA) Record Linkage Software. U.S. Census Bureau CARRA Working Paper 2014-01.
Wooldridge, J.M. 2007. Inverse Probability Weighted Estimation for General Missing Data Problems. Journal of Econometrics, 141, 1281–1301.

37
Data Appendix
Definitions of Subpopulations
Households with an elderly member are households in which anyone is 65 or older. A household is
included in the subsample of households with a disabled member if anyone in the household gave a
positive answer to any of the 6 disability questions. Since these questions were first included in the 2009
CPS, this subsample starts in reference year 2008. When we restrict the analysis to single mothers, we use
households headed by an unmarried female (divorced, widowed or never married) with at least one child
under 18 present in the household (including foster, grand and step children). We use a slightly different
definition of single mother headed households in section 5. Following Blank and Kovak (2009), we exclude
full-time students, those with incomes above twice the poverty line and households headed by a female
younger than 18 or older than 55.
Adjusting for Incomplete Linking
We link the administrative data to the survey data using the PIK as the linking variable. As described in
section 2, the PVS of the U.S. Census Bureau assigns PIKs to individuals in the survey data and the
administrative records from matching records in a reference file. While PIKs are assigned at the individual
level, we analyze program receipt and poverty at the household level. Our administrative data include
information on all individuals in the assistance unit, so we can correctly infer the receipt status and
amount received of all CPS households containing at least one recipient that was assigned a PIK in both
the survey and the administrative records. The fraction of administrative records for which the PVS could
not obtain a PIK is negligible at less than one percent. These administrative records that cannot be linked
only amount to less than 0.5 percent of total SNAP and 1.8 percent of total PA dollars received. Based on
discussions with OTDA and inspecting the records, most records without a PIK are adjustments to prior
payments and late payments to closed cases. Most households receive the programs we examine for

38
multiple months, so that we are still able to link their receipt status. Thus, we can link practically all CPS
households with at least one program recipient with a PIK to their program benefit history. However,
survey households in which no individual has a PIK cannot be linked to the administrative data. In 9
percent of the households in the CPS data no individual has a PIK, and we correct our estimates for this
incomplete linking by adjusting the household weights using inverse probability weighting (see e.g.
Wooldridge 2007).
In particular, we define a binary variable in the survey data that equals 1 if anyone in the survey
household is assigned a PIK. We then obtain the probability of a household having a PIK by estimating a
Probit model using this variable as the dependent variable and demographic and economic characteristics
of the household and its head as independent variables. The estimated coefficients are reported in Table
A1. Using these coefficients, we predict the probability of a household having at least one member with
a PIK and multiply the household weights by the inverse of this probability. We use these adjusted
household weights in all analyses, which corrects the bias from incomplete linkage under the assumption
that conditional on the covariates of the Probit models, whether the household is assigned a PIK does not
predict program receipt or the amount received.
The adjustment above does not correct for failure to link households in which some members
have a PIK, but none of the program recipients has a PIK. However, few households contain both
individuals with and without a PIK. This first result is due to only 14 percent of individuals in the CPS being
without a PIK and most of these individuals living in households where no individual has a PIK. Second,
very few households contain both recipients and non-recipients. For a failed link, these two rare
conditions need to both occur and none of the recipients can have a PIK. In addition, these failed links
make us overstate false positives (when receipt is incorrectly reported) and understate false negatives
(when true receipt is not reported). Consequently, these linking failures make us understate the difference
between the survey reports and true program receipt (see Meyer, Goerge and Mittag 2017).
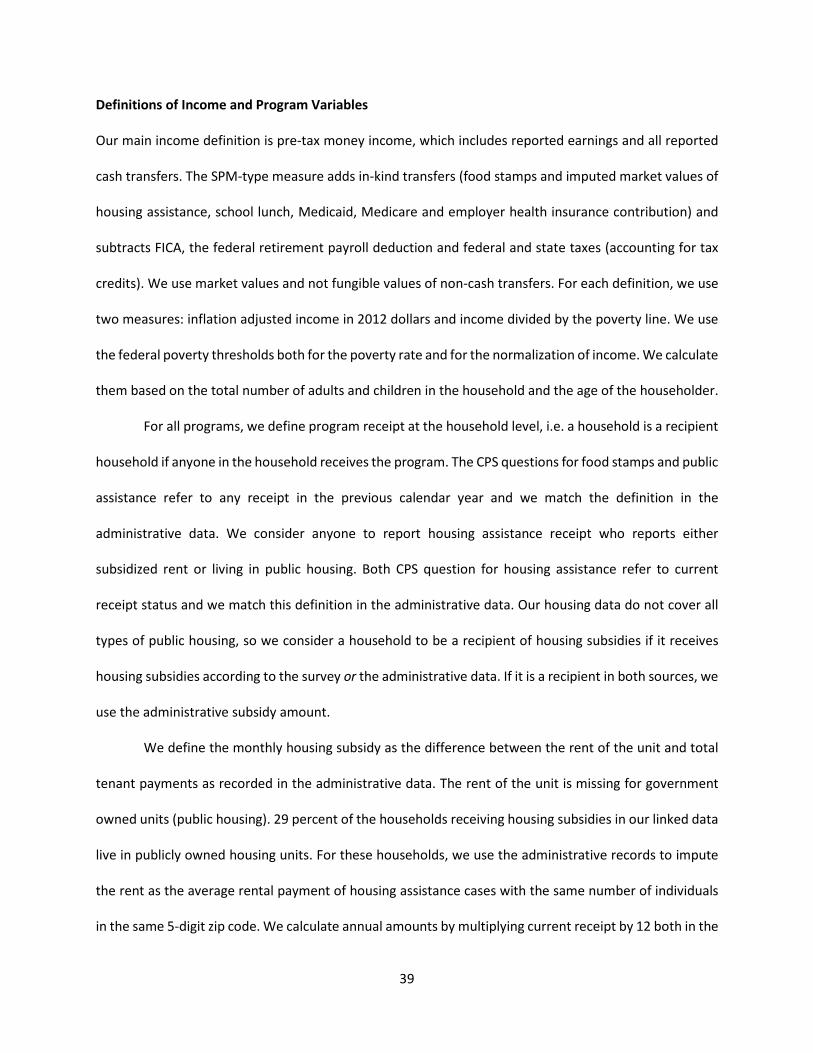
39
Definitions of Income and Program Variables
Our main income definition is pre-tax money income, which includes reported earnings and all reported
cash transfers. The SPM-type measure adds in-kind transfers (food stamps and imputed market values of
housing assistance, school lunch, Medicaid, Medicare and employer health insurance contribution) and
subtracts FICA, the federal retirement payroll deduction and federal and state taxes (accounting for tax
credits). We use market values and not fungible values of non-cash transfers. For each definition, we use
two measures: inflation adjusted income in 2012 dollars and income divided by the poverty line. We use
the federal poverty thresholds both for the poverty rate and for the normalization of income. We calculate
them based on the total number of adults and children in the household and the age of the householder.
For all programs, we define program receipt at the household level, i.e. a household is a recipient
household if anyone in the household receives the program. The CPS questions for food stamps and public
assistance refer to any receipt in the previous calendar year and we match the definition in the
administrative data. We consider anyone to report housing assistance receipt who reports either
subsidized rent or living in public housing. Both CPS question for housing assistance refer to current
receipt status and we match this definition in the administrative data. Our housing data do not cover all
types of public housing, so we consider a household to be a recipient of housing subsidies if it receives
housing subsidies according to the survey or the administrative data. If it is a recipient in both sources, we
use the administrative subsidy amount.
We define the monthly housing subsidy as the difference between the rent of the unit and total
tenant payments as recorded in the administrative data. The rent of the unit is missing for government
owned units (public housing). 29 percent of the households receiving housing subsidies in our linked data
live in publicly owned housing units. For these households, we use the administrative records to impute
the rent as the average rental payment of housing assistance cases with the same number of individuals
in the same 5-digit zip code. We calculate annual amounts by multiplying current receipt by 12 both in the

40
survey and in the administrative data. This convention overstates the amount for households that only
received assistance for part of the previous year. For households in the administrative data, we could
obtain the exact amount from the administrative data, but this is not possible for recipients of state-level
and non-HUD programs. However, we are mainly interested in aggregate amounts and doing so would
understate them because we would not include housing assistance received by households that received
assistance, but did not do so in the interview month. As long as there are no seasonal trends in housing
assistance, multiplying the monthly amount by 12 assigns some of the benefits to the wrong households,
but yields unbiased aggregate amounts.

Error Type Sample SNAP
Public
Assistance
Housing
Assistance SNAP
Public
Assistance
Housing
Assistance
False negatives True recipients 42.8% 63.3% 35.6% 33.0% 56.8% 29.6%
False positives True non-recipients 1.9% 0.7% 2.8% 7.6% 2.0% 8.0%
Absolute error in amount >$500 Recipients who report 53.22% 87.89% 97.50% 52.66% 88.27% 97.57%
Mean of true amount (annual) Recipients who report $3,389 $5,213 $12,000 $3,499 $5,317 $12,014
Mean of reported amount (annual) Recipients who report $3,170 $3,152 $3,081 $3,262 $3,004 $3,230
SD of error in amount Recipients who report $2,392 $4,619 $8,776 $2,341 $4,384 $8,657
Correlation true and reported amount Recipients who report 0.55 0.22 0.07 0.57 0.26 0.08
Income < 2X Poverty LineFull Sample
Note: Estimation uses households with at least one PIKed member only, weights are adjusted for PIK rates. SNAP and public assistance amounts are average annual
receipt per household, housing assistance amounts are annualized from monthly amounts per household. False positives for housing assistance may be recipients of
non-HUD housing programs and therefore should not necessarily be interpreted as survey errors.
Table 1
Survey Errors in Transfer Receipt Reporting, CPS New York , 2008-2011

< 50% 50-100% 100-150% 150-200% 200-250% 250-300% 300-350% 350-400% >400%
Dollars Received per Person Survey $1,553 $1,302 $612 $369 $194 $80 $58 $41 $14
Dollars Received per Person Admin $2,991 $2,850 $1,630 $970 $632 $429 $299 $189 $98
Dollars Missing per Person in Survey $1,438 $1,548 $1,018 $600 $439 $348 $241 $148 $84
... as Share of Reported Cash Income 110.2% 28.3% 11.6% 4.9% 2.8% 1.9% 1.1% 0.6% 0.2%
Net Dollar Reporting Rate 52% 46% 38% 38% 31% 19% 19% 22% 14%
Reported Non-cash Benefits (% of Cash Income) 104.0% 21.5% 6.3% 2.4% 1.2% 0.4% 0.2% 0.1% 0.0%
Dollars Received per Person Survey $780 $669 $337 $174 $92 $30 $28 $16 $6
Dollars Received per Person Admin $914 $884 $464 $306 $209 $101 $100 $63 $31
Dollars Missing per Person in Survey $135 $214 $127 $131 $117 $71 $72 $47 $25
... as Share of Reported Cash Income 10.3% 3.9% 1.4% 1.1% 0.8% 0.4% 0.3% 0.2% 0.0%
Net Dollar Reporting Rate 85% 76% 73% 57% 44% 30% 28% 25% 18%
Dollars Received per Person Survey $193 $119 $48 $78 $13 $8 $3 $7 $2
Dollars Received per Person Admin $567 $306 $91 $90 $30 $33 $21 $17 $11
Dollars Missing per Person in Survey $373 $187 $43 $12 $16 $25 $18 $10 $9
... as Share of Reported Cash Income 28.6% 3.4% 0.5% 0.1% 0.1% 0.1% 0.1% 0.0% 0.0%
Net Dollar Reporting Rate 34% 39% 53% 87% 45% 24% 16% 42% 19%
Dollars Received per Person Survey $578 $510 $218 $117 $88 $39 $27 $18 $6
Dollars Received per Person Admin $1,509 $1,660 $1,076 $574 $394 $294 $179 $109 $57
Dollars Missing per Person in Survey $932 $1,150 $858 $457 $306 $255 $152 $91 $50
... as Share of Reported Cash Income 71.4% 21.0% 9.8% 3.7% 2.0% 1.4% 0.7% 0.3% 0.1%
Net Dollar Reporting Rate 38% 31% 20% 20% 22% 13% 15% 16% 11%
Share of Individuals 5.5% 7.9% 8.7% 8.0% 8.4% 8.2% 7.3% 6.2% 39.8%
Income per Individual ($) 1305 5474 8782 12240 15505 18661 21959 25964 55973
Number of Household Observations 689 1045 1143 1000 1001 972 864 750 4682
Table 2
Survey and Administrative Amounts Received by Program, by Annual Reported Pre-Tax Money Income Divided by Poverty Line,
CPS NY Sample, 2008-2011
Categories of Annual Reported Income Relative to Poverty Line
Note: Estimation uses households with at least one PIKed member only, weights are adjusted for PIK rates. Income categories are defined based on pre-tax money income, poverty thresholds are the official poverty thresholds. Dollars received are 2012 dollars, but not adjusted for family size.
Food Stamps
Public Assistance
Housing Assistance
All Programs Combined

Survey Admin Difference
% of
Survey Survey Admin Difference
% of
Survey Survey Admin Difference
% of
Survey
All Programs Combined 2.48% 3.33% 0.85% 34.28% 2.79% 5.29% 2.50% 89.7% 1.18% 4.33% 3.14% 265.48%
SNAP 1.38% 1.57% 0.19% 13.68% 1.59% 2.09% 0.50% 31.2% 0.57% 1.06% 0.48% 84.10%
Public Assistance 0.42% 0.89% 0.47% 112.75% 0.19% 0.47% 0.28% 149.7% 0.15% 0.24% 0.09% 59.53%
Housing Assistance 0.76% 1.84% 1.08% 142.23% 0.86% 2.56% 1.71% 199.1% 0.31% 2.43% 2.12% 674.00%
Public Assistance and SNAP 1.85% 2.39% 0.54% 29.35% 1.89% 2.75% 0.86% 45.2% 0.74% 1.42% 0.67% 90.45%
Survey Admin Difference
% of
Survey Survey Admin Difference
% of
Survey Survey Admin Difference
% of
Survey
All Programs Combined 11.52% 15.93% 4.40% 38.23% 7.30% 18.34% 11.04% 151.20% 2.31% 11.43% 9.12% 394.07%
SNAP 6.59% 6.77% 0.17% 2.65% 3.47% 5.00% 1.52% 43.85% 1.42% 3.39% 1.97% 139.20%
Public Assistance 2.25% 4.71% 2.46% 109.46% 0.28% 1.81% 1.53% 548.28% 0.19% 1.04% 0.85% 436.21%
Housing Assistance 3.53% 9.72% 6.19% 175.09% 0.71% 7.68% 6.98% 986.70% 0.54% 4.89% 4.35% 811.13%
Public Assistance and SNAP 8.79% 10.98% 2.19% 24.92% 4.90% 8.32% 3.41% 69.62% 1.61% 4.59% 2.98% 184.73%
Table 3
Reduction in Poverty, Deep Poverty and Near Poverty due to Transfer Programs According to Survey and Administrative Data,
CPS NY Sample, 2008-2011
Poverty (baseline: 13.65%) Near Poverty (baseline: 22.3%)
Note: N=12,146 households for the entire population, 1072 for single mothers. Poverty rate is share of individuals in households with income below thresholds. The baseline poverty rates use pre-tax
cash income excluding public assistance as the income definition. Poverty thresholds are the official poverty thresholds, individuals in households below 50% of the threshold are in deep poverty,
those below 150% in near poverty.
Single Mother Headed Households
Entire Population
Deep Poverty (baseline: 21.4%) Poverty (baseline: 37.5%) Near Poverty (baseline: 51.5%)
Deep Poverty (baseline: 6.0% )

Included Programs Survey Admin
% Over-
statement Survey Admin
% Over-
statement
Public Assistance only 17.1% 12.8% 34% 22.8% 17.1% 33%
Public Assistance and Food Stamps 5.3% 3.2% 68% 7.4% 5.1% 46%
Public Assistance, Food Stamps and Housing 3.6% 1.7% 113% 5.1% 3.0% 71%
All Cash Transfers 5.4% 3.6% 50% 9.8% 7.0% 40%
All Cash Transfers and Food Stamps 3.5% 1.9% 82%
Table 4
Single Mother Headed Households without Program Receipt or Earnings According to Survey and Administrative Data, CPS NY
Sample, 2008-2011
No earnings and program receipt Low earnings and program receipt
Note: N=578. All definitions restrict the sample to households below twice the poverty line headed by an unmarried female age 18-54, not in school with at least
one own, grand, related or foster child present in the household. In column 2-4, we consider households that have no earnings and receive none of the programs in
the first 3 columns as left behind, columns 5-7 also include those with yearly earnings less than $2000 and combined program receipt of less than $1000 (2005
dollars). "All Cash Transfers" includes unemployment compensation, Social Security, SSI, PA, Education Assistance, Worker's compensation, Veteran's payments,
Survivor income, disability income, retirement income, child benefits, alimony and financial assistance. Estimation uses individuals in household with at least one
PIKed member only, weights are adjusted for PIK rates.
numbers too small to disclose

Transfer Receipt U.S. NY
Any Program Receipt Rate 13.06% 16.04%
Average Received ($) $432 $687
SNAP Receipt Rate 11.17% 12.43%
Average Received ($) $264 $344
Public Assistance Receipt Rate 2.12% 2.78%
Average Received ($) $49 $73
Housing Assistance Receipt Rate 3.67% 7.50%
Average Received ($) $118 $270
Demographics U.S. NY
Age under 18 24.42% 22.72%
Age 18-39 29.56% 30.28%
Age 40-64 33.06% 33.56%
Education Less than High School 34.52% 33.16%
Education High School 23.08% 23.19%
Education Some College 21.46% 19.55%
Black 12.75% 17.22%
Other Non-white 8.05% 9.79%
Hispanic 16.27% 17.37%
Poverty Rate 12.26% 13.85%
Note: Average received is unconditional annual dollars. Housing assistance
is CPS imputed market values of reduced rent and public housing. For the
demographics, the omitted category is "65 and older" for age, "college
degree or more" for education and "white" for ethnicity.
Table 5
Reported Transfer Program Receipt and Demographics,
U.S. v. NY, 2007-2012 CPS

Coefficients Marginal EffectsSingle, no children -0.4309*** -0.0672***
(0.0709) (0.0112)
Single, with children -0.0020 -0.0003
(0.0727) (0.0113)
Multiple adults, no children -0.2032*** -0.0317***
(0.0608) (0.0095)
Number of members under 18 0.0483* 0.0075*
(0.0268) (0.0042)
Number of members 18 or older 0.0614** 0.0096**
(0.0247) (0.0038)
Age 16-29 -0.0678 -0.0106
(0.0494) (0.0077)
Age 30-39 -0.1113*** -0.0174***
(0.0423) (0.0066)
Age 50-59 0.1672*** 0.0261***
(0.0451) (0.0070)
Age 60-69 0.3932*** 0.0613***
(0.0553) (0.0086)
Age 70 or more 0.3180*** 0.0496***
(0.0587) (0.0092)
Less than high school -0.1144** -0.0178**
(0.0481) (0.0075)
High School graduate -0.1637*** -0.0255***
(0.0379) (0.0059)
Complete graduate and beyond 0.0010 0.0002
(0.0410) (0.0064)
Hispanic -0.2106*** -0.0328***
(0.0380) (0.0059)
Black non-hispanic -0.1328*** -0.0207***
(0.0392) (0.0061)
Other non-hispanic -0.4917*** -0.0767***
(0.0454) (0.0070)
Unemployed 0.2085*** 0.0325***
(0.0761) (0.0119)
Not in Labor Force -0.1034*** -0.0161***
(0.0389) (0.0061)
Household income/poverty line 0.0214*** 0.0033***
(0.0062) (0.0010)
Anyone in household Disabled 0.1726 0.0269
(0.1281) (0.0200)
Rural 0.1042* 0.0163*
(0.0560) (0.0087)
Recipient of Housing assistance (CPS) 0.3103*** 0.0484***
(0.0553) (0.0086)
Linear trend in CPS survey year 0.0121 0.0019
(0.0081) (0.0013)
Constant 1.3505***
(0.0974)
Observations 19,852 19,852
Table A1 – The Determinants of a Household having a PIK, CPS New York, 2007-2012
Note: Dependent variable is a dummy whether anyone in the household was assigned a PIK.
All models use household weights. Robust standard errors in parentheses (using the delta
method in column 2). All analyses conducted using household weights. The unreported
omitted family type is multiple adults with children, the age category is 40-49, the education
category is some college, the race group is non-Hispanic white, the employment category is
employed. *** p<0.01, ** p<0.05, * p<0.1

< 50% 50-100% 100-150% 150-200% 200-250% 250-300% 300-350% 350-400% >400%
Dollars Received per Person Survey $1,909 $1,806 $1,028 $573 $232 $84 $47 $26 $8
Dollars Received per Person Admin $2,991 $2,850 $1,630 $970 $632 $429 $299 $189 $98
Dollars Missing per Person in Survey $1,082 $1,044 $602 $397 $401 $344 $253 $162 $90
... as Share of Reported Cash Income 82.9% 19.1% 6.9% 3.2% 2.6% 1.8% 1.1% 0.6% 0.2%
Net Dollar Reporting Rate 64% 63% 63% 59% 37% 20% 16% 14% 8%
Reported Non-cash Benefits (% of Cash Income) 131.3% 30.7% 11.1% 4.0% 1.4% 0.4% 0.2% 0.1% 0.0%
Dollars Received per Person Survey $780 $669 $337 $174 $92 $30 $28 $16 $6
Dollars Received per Person Admin $914 $884 $464 $306 $209 $101 $100 $63 $31
Dollars Missing per Person in Survey $135 $214 $127 $131 $117 $71 $72 $47 $25
... as Share of Reported Cash Income 10.3% 3.9% 1.4% 1.1% 0.8% 0.4% 0.3% 0.2% 0.0%
Net Dollar Reporting Rate 85% 76% 73% 57% 44% 30% 28% 25% 18%
Dollars Received per Person Survey $193 $119 $48 $78 $13 $8 $3 $7 $2
Dollars Received per Person Admin $567 $306 $91 $90 $30 $33 $21 $17 $11
Dollars Missing per Person in Survey $373 $187 $43 $12 $16 $25 $18 $10 $9
... as Share of Reported Cash Income 28.6% 3.4% 0.5% 0.1% 0.1% 0.1% 0.1% 0.0% 0.0%
Net Dollar Reporting Rate 34% 39% 53% 87% 45% 24% 16% 42% 19%
Dollars Received per Person Survey $933 $1,013 $634 $320 $126 $43 $16 $3 $0
Dollars Received per Person Admin $1,509 $1,660 $1,076 $574 $394 $294 $179 $109 $57
Dollars Missing per Person in Survey $576 $647 $442 $254 $268 $251 $163 $105 $57
... as Share of Reported Cash Income 44.1% 11.8% 5.0% 2.1% 1.7% 1.3% 0.7% 0.4% 0.1%
Net Dollar Reporting Rate 62% 61% 59% 56% 32% 15% 9% 3% 0%
Share of Individuals 5.5% 7.9% 8.7% 8.0% 8.4% 8.2% 7.3% 6.2% 39.8%
Income per Individual ($) 1305 5474 8782 12240 15505 18661 21959 25964 55973
Number of Household Observations 689 1045 1143 1000 1001 972 864 750 4682
Note: This table replicates Table 2, but using the imputed housing subsidy amounts from the experimental poverty measures file instead of the CPS ASEC variable. Since this variable is not available on the internal CPS file, we use the public use files for the housing subsidy numbers and the linked file for the remaining numbers. Estimates from the public use files use all households, while the remainder uses households with at least one PIKed member only, weights are adjusted for PIK rates. The differences between the statistics on SNAP and PA reports from the two files are negligible in substantive terms. The share of individuals and the number of households refer to the PIKed sample. Income categories are defined based on pre-tax money income, poverty thresholds are the official poverty thresholds. Dollars received are 2012 dollars, but not adjusted for family size.
Table A2
Survey and Administrative Amounts Received by Program, by Annual Reported Pre-Tax Money Income Divided by Poverty Line (with Housing Subsidy
from Experimental Poverty File),
CPS NY Sample, 2008-2011
Categories of Annual Reported Income Relative to Poverty Line
All Programs Combined
Food Stamps
Public Assistance
Housing Assistance

< 50% 50-100% 100-150% 150-200% 200-250% 250-300% 300-350% 350-400% >400%
Dollars Received per Person Survey $275 $721 $809 $546 $477 $407 $387 $256 $84
Dollars Received per Person Admin $954 $2,031 $1,674 $1,358 $1,230 $996 $899 $671 $251
Dollars Missing per Person in Survey $679 $1,310 $865 $812 $752 $589 $512 $415 $167
... as Share of Reported Cash Income 67.4% 23.2% 10.0% 6.8% 4.9% 3.1% 2.2% 1.6% 0.4%
Net Dollar Reporting Rate 29% 35% 48% 40% 39% 41% 43% 38% 33%
Reported Non-cash Benefits (% of Cash Income) 27.0% 11.3% 7.6% 4.1% 2.7% 1.8% 1.6% 0.9% 0.2%
Dollars Received per Person Survey $167 $383 $412 $299 $261 $179 $186 $108 $43
Dollars Received per Person Admin $335 $576 $542 $478 $389 $286 $238 $175 $75
Dollars Missing per Person in Survey $168 $193 $131 $179 $128 $107 $52 $67 $32
... as Share of Reported Cash Income 16.7% 3.4% 1.5% 1.5% 0.8% 0.6% 0.2% 0.3% 0.1%
Net Dollar Reporting Rate 50% 66% 76% 63% 67% 63% 78% 62% 58%
Dollars Received per Person Survey $3 $82 $146 $65 $56 $68 $16 $16 $5
Dollars Received per Person Admin $146 $293 $276 $172 $134 $110 $69 $39 $17
Dollars Missing per Person in Survey $143 $211 $129 $107 $78 $43 $53 $22 $13
... as Share of Reported Cash Income 14.2% 3.7% 1.5% 0.9% 0.5% 0.2% 0.2% 0.1% 0.0%
Net Dollar Reporting Rate 2% 28% 53% 38% 42% 61% 23% 42% 27%
Dollars Received per Person Survey $105 $256 $245 $182 $157 $154 $184 $132 $36
Dollars Received per Person Admin $473 $1,163 $856 $708 $706 $600 $592 $457 $159
Dollars Missing per Person in Survey $368 $906 $612 $526 $549 $446 $408 $325 $123
... as Share of Reported Cash Income 36.5% 16.0% 7.1% 4.4% 3.6% 2.4% 1.8% 1.2% 0.3%
Net Dollar Reporting Rate 22% 22% 29% 26% 22% 26% 31% 29% 23%
Share of Individuals 1.5% 2.1% 5.2% 8.4% 12.0% 10.8% 10.8% 9.3% 40.0%
Income per Individual ($) 1008 5654 8615 11885 15416 18810 23069 26429 45804
Number of Household Observations 217 270 600 972 1462 1309 1378 1182 4756Note: Estimation uses households with at least one PIKed member only, weights are adjusted for PIK rates. Income categories are defined based on SPM-type income (after taxes, including in-kind transfers), poverty thresholds are the official poverty thresholds. Dollars received are 2012 dollars, but not adjusted for family size.
Table A3
Survey and Administrative Amounts Received by Program, by Annual Reported SPM-type Income Divided by Poverty Line,
CPS NY Sample, 2008-2011
Categories of Annual Reported Income Relative to Poverty Line
All Programs Combined
Food Stamps
Public Assistance
Housing Assistance

Survey Admin Difference % of Survey Survey Admin Difference
% of
Survey Survey Admin Difference
% of
Survey
All Programs Combined 2.73% 3.33% 0.60% 21.97% 3.87% 5.29% 1.43% 36.94% 2.64% 4.33% 1.68% 63.70%
SNAP 1.38% 1.57% 0.19% 13.68% 1.59% 2.09% 0.50% 31.22% 0.57% 1.06% 0.48% 84.10%
Public Assistance 0.42% 0.89% 0.47% 112.75% 0.19% 0.47% 0.28% 149.68% 0.15% 0.24% 0.09% 59.53%
Housing Assistance 1.50% 1.84% 0.34% 22.34% 1.99% 2.56% 0.57% 28.76% 1.38% 2.43% 1.05% 76.32%
Public Assistance and SNAP 1.85% 2.39% 0.54% 29.35% 1.89% 2.75% 0.86% 45.24% 0.74% 1.42% 0.67% 90.45%
Survey Admin Difference % of Survey Survey Admin Difference
% of
Survey Survey Admin Difference
% of
Survey
All Programs Combined 12.78% 15.93% 3.14% 24.58% 12.35% 18.34% 5.99% 48.51% 5.51% 11.43% 5.92% 107.36%
SNAP 6.59% 6.77% 0.17% 2.65% 3.47% 5.00% 1.52% 43.85% 1.42% 3.39% 1.97% 139.20%
Public Assistance 2.25% 4.71% 2.46% 109.46% 0.28% 1.81% 1.53% 548.28% 0.19% 1.04% 0.85% 436.21%
Housing Assistance 7.46% 9.72% 2.26% 30.36% 6.14% 7.68% 1.54% 25.05% 2.18% 4.89% 2.71% 124.34%
Public Assistance and SNAP 8.79% 10.98% 2.19% 24.92% 4.90% 8.32% 3.41% 69.62% 1.61% 4.59% 2.98% 184.73%
Deep Poverty (baseline: 21.4%) Poverty (baseline: 37.5%) Near Poverty (baseline: 51.5%)
Note: This table replicates Table 3, but using the imputed housing subsidy amounts from the experimental poverty measures file instead of the CPS ASEC variable. Since this variable is not available on the
internal CPS file, we use the public use files for the housing subsidy numbers (and for all programs in the "All Programs Combined" rows), but the linked file for the remaining numbers. Estimates from the
public use files use all households, while the remainder uses households with at least one PIKed member only, weights are adjusted for PIK rates. The differences between the statistics on SNAP and PA
reports from the two files are negligible in substantive terms. N=12,146 households for the entire population, 1072 for single mothers. Poverty rate is share of individuals in households with income below
thresholds. The baseline poverty rates use pre-tax cash income excluding public assistance as the income definition. Poverty thresholds are the official poverty thresholds, individuals in households below
50% of the threshold are in deep poverty, those below 150% in near poverty.
Table A4
Reduction in Poverty, Deep Poverty and Near Poverty due to Transfer Programs According to Survey and Administrative Data (with Housing Subsidy from Experimental Poverty File),
CPS NY Sample, 2008-2011
Entire Population
Deep Poverty (baseline: 6.0% ) Poverty (baseline: 13.65%) Near Poverty (baseline: 22.3%)
Single Mother Headed Households

Survey Admin Difference
% of
Survey Survey Admin Difference % of Survey Survey Admin Difference
% of
Survey
All programs Combined 1.06% 1.28% 0.22% 20.71% 2.35% 3.84% 1.48% 62.89% 1.59% 5.69% 4.10% 257.55%
SNAP 0.50% 0.58% 0.08% 15.93% 1.50% 1.72% 0.22% 14.94% 0.86% 1.45% 0.59% 68.66%
Public Assistance 0.06% 0.29% 0.24% 429.45% 0.00% 0.16% 0.16%1)
0.05% 0.00% -0.05% -100.00%
Housing Assistance 0.60% 0.96% 0.36% 59.61% 1.27% 2.61% 1.34% 105.09% 0.40% 4.19% 3.79% 952.78%
Public Assistance and SNAP 0.58% 0.78% 0.20% 34.28% 1.53% 1.98% 0.44% 28.87% 0.90% 1.49% 0.58% 64.51%
Survey Admin Difference
% of
Survey Survey Admin Difference % of Survey Survey Admin Difference
% of
Survey
All programs Combined 3.93% 5.09% 1.16% 29.40% 5.86% 10.22% 4.37% 74.53% 2.44% 8.83% 6.39% 262.37%
SNAP 2.02% 2.39% 0.37% 18.17% 2.77% 3.84% 1.08% 38.89% 1.20% 1.71% 0.51% 42.82%
Public Assistance 0.63% 1.34% 0.71% 112.58% 0.24% 1.22% 0.98% 408.55% 0.09% 0.52% 0.43% 480.25%
Housing Assistance 1.13% 2.75% 1.63% 144.63% 3.02% 5.69% 2.67% 88.65% 0.73% 5.37% 4.64% 631.64%
Public Assistance and SNAP 2.69% 3.53% 0.83% 30.99% 3.26% 5.16% 1.91% 58.58% 1.29% 2.35% 1.06% 82.33%
Deep Poverty (baseline: 7.3%) Poverty (baseline: 19.8%) Near Poverty (baseline: 32.0%)
Note: N=2,919 households for the elderly, 2,168 for the disabled. Poverty rate is share of individuals in households with income below thresholds. The baseline poverty rates use pre-tax cash income
excluding public assistance as the income definition. Poverty thresholds are the official poverty thresholds, individuals in households below 50% of the threshold are in deep poverty, those below 150% in
near poverty.1)
The poverty reduction according to the survey is 0%, so the true reduction as a percentage of the survey reduction is not defined due to the required division by 0.
Table A5
Reduction in Poverty, Deep Poverty and Near Poverty due to Transfer Programs According to Survey and Administrative Data,
CPS NY Sample, 2008-2011, Households With an Elderly or Disabled Member
Households With an Elderly Member
Deep Poverty (baseline: 3.1% ) Poverty (baseline: 10.0%) Near Poverty (baseline: 21.0%)
Households With a Disabled Member
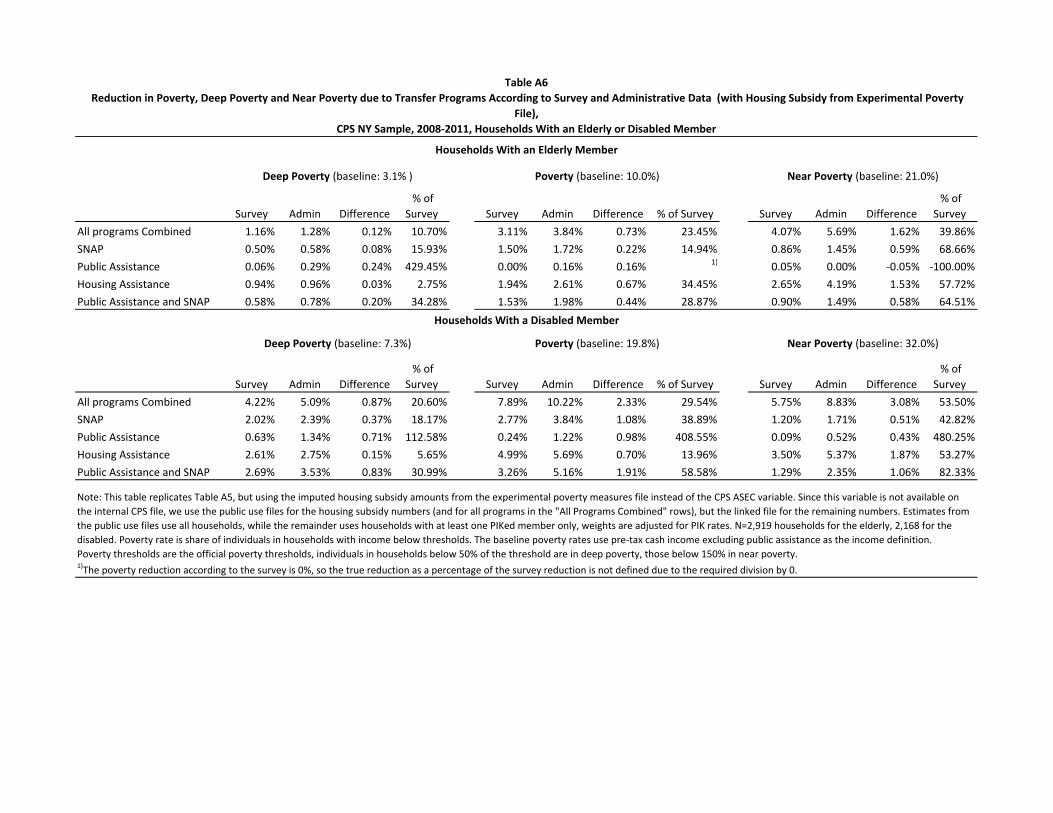
Survey Admin Difference
% of
Survey Survey Admin Difference % of Survey Survey Admin Difference
% of
Survey
All programs Combined 1.16% 1.28% 0.12% 10.70% 3.11% 3.84% 0.73% 23.45% 4.07% 5.69% 1.62% 39.86%
SNAP 0.50% 0.58% 0.08% 15.93% 1.50% 1.72% 0.22% 14.94% 0.86% 1.45% 0.59% 68.66%
Public Assistance 0.06% 0.29% 0.24% 429.45% 0.00% 0.16% 0.16%1)
0.05% 0.00% -0.05% -100.00%
Housing Assistance 0.94% 0.96% 0.03% 2.75% 1.94% 2.61% 0.67% 34.45% 2.65% 4.19% 1.53% 57.72%
Public Assistance and SNAP 0.58% 0.78% 0.20% 34.28% 1.53% 1.98% 0.44% 28.87% 0.90% 1.49% 0.58% 64.51%
Survey Admin Difference
% of
Survey Survey Admin Difference % of Survey Survey Admin Difference
% of
Survey
All programs Combined 4.22% 5.09% 0.87% 20.60% 7.89% 10.22% 2.33% 29.54% 5.75% 8.83% 3.08% 53.50%
SNAP 2.02% 2.39% 0.37% 18.17% 2.77% 3.84% 1.08% 38.89% 1.20% 1.71% 0.51% 42.82%
Public Assistance 0.63% 1.34% 0.71% 112.58% 0.24% 1.22% 0.98% 408.55% 0.09% 0.52% 0.43% 480.25%
Housing Assistance 2.61% 2.75% 0.15% 5.65% 4.99% 5.69% 0.70% 13.96% 3.50% 5.37% 1.87% 53.27%
Public Assistance and SNAP 2.69% 3.53% 0.83% 30.99% 3.26% 5.16% 1.91% 58.58% 1.29% 2.35% 1.06% 82.33%
Deep Poverty (baseline: 7.3%) Poverty (baseline: 19.8%) Near Poverty (baseline: 32.0%)
Note: This table replicates Table A5, but using the imputed housing subsidy amounts from the experimental poverty measures file instead of the CPS ASEC variable. Since this variable is not available on
the internal CPS file, we use the public use files for the housing subsidy numbers (and for all programs in the "All Programs Combined" rows), but the linked file for the remaining numbers. Estimates from
the public use files use all households, while the remainder uses households with at least one PIKed member only, weights are adjusted for PIK rates. N=2,919 households for the elderly, 2,168 for the
disabled. Poverty rate is share of individuals in households with income below thresholds. The baseline poverty rates use pre-tax cash income excluding public assistance as the income definition.
Poverty thresholds are the official poverty thresholds, individuals in households below 50% of the threshold are in deep poverty, those below 150% in near poverty.1)
The poverty reduction according to the survey is 0%, so the true reduction as a percentage of the survey reduction is not defined due to the required division by 0.
Table A6
Reduction in Poverty, Deep Poverty and Near Poverty due to Transfer Programs According to Survey and Administrative Data (with Housing Subsidy from Experimental Poverty
File),
CPS NY Sample, 2008-2011, Households With an Elderly or Disabled Member
Households With an Elderly Member
Deep Poverty (baseline: 3.1% ) Poverty (baseline: 10.0%) Near Poverty (baseline: 21.0%)
Households With a Disabled Member