using historical perspective of keynesian vs. neoclassical ......using historical perspective of...
TRANSCRIPT

Using Historical Perspective of Keynesian vs.Neoclassical Macro in Teaching Principles
14th Fed Prof Conference 2016
Max Gillman, U. of Missouri-St. Louis
Federal Reserve Bank of St. Louis
3-4 November 2016
Gillman (Federal Reserve Bank of St. Louis) With FRED and EconLowdown 3-4 November 2016 1 / 62

Evolutionary Approach to Teaching MacroPrinciples of Macroeconomics: An Evolutionary Approach; Jan. 2017
Great Depression to Great Recession
Fisher vs. Keynes
Neoclassical vs Keynesian
Lectures including Online FRED.
Homework including EconLowdown Modules.Using State of Art Econ Govt data & Online Modules.Without reliance on Proprietary Online Services.Adjust as FRED, EconLowdown Advance/Evolve.(In FRED We Trust).
Gillman (Federal Reserve Bank of St. Louis) With FRED and EconLowdown 3-4 November 2016 2 / 62

What We Teach Matters: Not Just How
What is an Economic Fallacy?
What is an Economic Fact?
What is a Macroeconomic Principle?
What Math can we use?
Can We Tell the Story of Macro?
Gillman (Federal Reserve Bank of St. Louis) With FRED and EconLowdown 3-4 November 2016 3 / 62
Fallacies: AS-AD derivation.
Keynesian Cross gives AS � AD analysis.
IS-LM gives AS � AD analysis.
Phillips curve gives AS � AD analysis.
Oil Price Theory of Stag�ation gives AS � AD analysis.
David Colander, 1995, "The Stories We Tell:
A Reconsideration of AS/AD Analysis."Journal of Economic Perspectives, 9(3): 169-188.
Gillman (Federal Reserve Bank of St. Louis) With FRED and EconLowdown 3-4 November 2016 4 / 62
Stylized Facts
Normal Real Business Cycle Stylized Facts
Solow Growth Facts of balanced growth path.
Phillips curves during Asset Market Booms & Busts
Bank Collapse Causing Crises of Grt Depress & Grt Rec.
US Lost Decades: 1929-1939 & 2007-2016.
Gillman (Federal Reserve Bank of St. Louis) With FRED and EconLowdown 3-4 November 2016 5 / 62
Macro Principles
S & D for capital depends on Real Interest Rate:
Fisher 1896 Model allows "Ramsey" RBC explanation.
Ramsey (1928) underlies Neoclassical & (New) Keynesian.
Ramsey World AS � AD underlies Dyn. Stoch. Gen Equil.
Ramsey World AS � AD depends on real price of Gds to Labor:1/w .
Ramsey World S&D in Labor market dependson real price of Labor to Goods: w/1.Real Interest Rate constant in Ramsey World
Gillman (Federal Reserve Bank of St. Louis) With FRED and EconLowdown 3-4 November 2016 6 / 62

Math We Can Use
Graphs of Data over time: FRED mainly.
Plus BLS graphs, NIPA Dpt Comm.& OECD tables.
Graphs of Functional Data, in time: Phillips Curve
Can Construct Using FRED data in Excell.
Graphs of Functions between 2 Variables:
eg. Price, Quantity; Output, Input.
Graphs of Functions Shifting:
Comparative Statics Change in one Parameter.
Tables.Equations: Simple Algebra Only
C + I + G = Y = GDP; R = r + π; GDP = GDI .Maybe: wl + rk � δ+ G � T = Y = GDI(A � B + C �D + E = F ).
Gillman (Federal Reserve Bank of St. Louis) With FRED and EconLowdown 3-4 November 2016 7 / 62

Story to be Told
Microeconomic to Macroeconomic Foundations
Comovement & Crises
Cycles & Growth
Policy
Gillman (Federal Reserve Bank of St. Louis) With FRED and EconLowdown 3-4 November 2016 8 / 62

Micro Principles Used in MacroMicroeconomic to Macroeconomic Foundations
PPC, Production Function, Indi¤erence Curve.Diminishing Marg Prod. & Marg Utility; Mrkt Structure.Supply & Demand as function of Relative PriceComparative Statics
Smith, Ricardo, Bentham, Jevons, Menger, Walras,Malthus, Darwin, & MarshallLabor Theory of Value vs Neoclassical Theory of Value
Application: Gasoline Prices & Loss of US World Auto MrktCurrent Dollar Gas Prices vs Real Dollar Gas Prices
Appendices: How Darwin Solved Shape of Production CurvePlus: Graphs & Data; Using FRED; y = a+ bx .
EconLowdown Module: Supply & DemandReview of S&D basics + Comp. Statics
Gillman (Federal Reserve Bank of St. Louis) With FRED and EconLowdown 3-4 November 2016 9 / 62

0.1 0.2 0.3 0.4 0.5 0.6 0.7 0.8 0.9 1.00.00
0.05
0.10
0.15
0.20
0.25
Input
Output
Figure: General Equilibrium Production Function (Blue) and Utility LevelExpressed as Indi¤erence Curve (Red).
Gillman (Federal Reserve Bank of St. Louis) With FRED and EconLowdown 3-4 November 2016 10 / 62

0 1 2 3 4 50
1
2
3
4
5
Quantity
Relative Price
Gillman (Federal Reserve Bank of St. Louis) With FRED and EconLowdown 3-4 November 2016 11 / 62
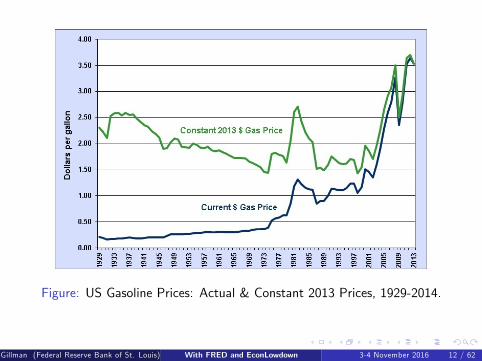
Figure: US Gasoline Prices: Actual & Constant 2013 Prices, 1929-2014.
Gillman (Federal Reserve Bank of St. Louis) With FRED and EconLowdown 3-4 November 2016 12 / 62

Figure: US Gasoline Index divided by All Items CPI, 1990:4 - 2016:3.
Gillman (Federal Reserve Bank of St. Louis) With FRED and EconLowdown 3-4 November 2016 13 / 62

Aggregate Output and IncomeMicroeconomic to Macroeconomic Foundations
National Output & Income Accounting
NIPA Tables for GDP & GDI4 Categories of Each GDP & GDIKuznets & Stone; Fisher (price index).Nominal vs Real: Using the Price Index
Production of Output from Input
General Function and GraphRepresentative Agent EconomyCircular Flow: GDP = GDIClassical Dichotomy: Nominal & Real Economy
Application: US Real & Nominal GDP Growth
Appendix: Nominal vs Real Interest Rate: Fisher eqtn.
EconLowdown Module: GDP & Pizza
Gillman (Federal Reserve Bank of St. Louis) With FRED and EconLowdown 3-4 November 2016 14 / 62

Macro Divergence from MicroMicroeconomic to Macroeconomic Foundations
Great Depression: Facts (FRED)
Real GDP, Unemployment, In�ation, Currency/Deposits.Govt Spending including Defense and not.Comparison to Great Recession Facts.
Bifurcation of Macro Theory
Neoclassical Approach: Fisher, Hayek Debt-De�ation.Keynes�s Approach: 1930 Cross, Thry of Bus Cycle.National Accounting and Keynesian CrossPro�t � I - S; Excess Savings Spent by Govt.Add Keynes 1936 Consumption FunctionStabilization Policy Arises.
Applic: Grt Depression using Keynes Cross.
Append: Keynes�s Price Theory vs. Marshall�s.
EconLowdown Module: Great Depression 1 & 2.
Gillman (Federal Reserve Bank of St. Louis) With FRED and EconLowdown 3-4 November 2016 15 / 62
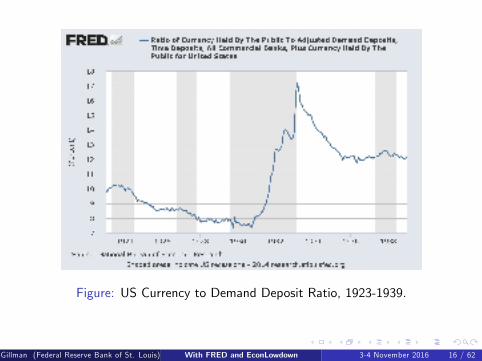
Figure: US Currency to Demand Deposit Ratio, 1923-1939.
Gillman (Federal Reserve Bank of St. Louis) With FRED and EconLowdown 3-4 November 2016 16 / 62

Busines Cycles, Crises & GrowthComovement & Crises
Facts of Cycle and Growth Trends (FRED)
Shares of GDP & GDI over Cycle
RBC Theory & Growth Theory & Crisis Theory
Friedman & Schwartz (1963) vs Kydland & Prescott (1982)
Applic: Equity Premium Puzzle.Append: Structural Transformation by Sector;
Why Doesn�t Capital Flow from Rich to Poor Neighborhoods?
EconLowdown Module: Unemployment.
Gillman (Federal Reserve Bank of St. Louis) With FRED and EconLowdown 3-4 November 2016 17 / 62

Figure: US 1930-2014, Growth Rate of Both Real Personal ConsumptionExpenditure (Red) and Real GDP (Blue) Minus 3.5% (trend growth rate).
Gillman (Federal Reserve Bank of St. Louis) With FRED and EconLowdown 3-4 November 2016 18 / 62

Money, Banking & PolicyComovement & Crises
Public Bank & Private Bank Money
Monetary Aggregates (FRED).Govt�s Central Bank: the Fed;Bank Panics Leading to Fed.Institutions & Mrkts.
Theory of Money Demand & Fisher.
Quantity Theory, In�ation Targeting, Taylor Rule.Temp & Permanent Liquidity E¤ects, & Wicksell.
Applic: Ex-Post US Real Interest Rates.
Append: Historical Money, In�ation & Debt;Fiscal Theory of the Price Level.
EconLowdown Module: Capital Markets.& Monetary Policy.
Gillman (Federal Reserve Bank of St. Louis) With FRED and EconLowdown 3-4 November 2016 19 / 62

Crises and In�ationComovement & Crises
Facts: WWI, WWII, Korean War & In�ation
Vietnam war In�ation: a period of "Peacetime".Granger Causality of Oil Prices by Money & In�ationKillian & coauthors on monetary causes of Oil prices.
Oil Price Shock Theory of Stag�ation: Mankiw (2015)
AS-AD with nominal prices vs Relative Prices.Monetary hypothesis of "OPEC Oil Shocks".In�ation Tax & Long run Growth.Phillips Curves: Theory, Evidence & Debt-De�ations.
Applic: Grt Depres. Turning Pt with �33 Banking Act & FDICAppend: US Banking Acts 1930�s and 2008.EconLowdown Module: Great In�ation, Grt Depres. 3 & 4.
Gillman (Federal Reserve Bank of St. Louis) With FRED and EconLowdown 3-4 November 2016 20 / 62

Figure: Real WTI Oil Prices, from Jan. 1947 to Dec. 1973: WTI US$ per barreldivided by US CPI index, in 1982 Constant Dollars.
Gillman (Federal Reserve Bank of St. Louis) With FRED and EconLowdown 3-4 November 2016 21 / 62

Figure: Real Oil Prices in 1982 US Dollars, 1947 -2016.
Gillman (Federal Reserve Bank of St. Louis) With FRED and EconLowdown 3-4 November 2016 22 / 62

InflationGrowth Relationship, OECD, Inflation <50%
0
1
2
3
4
5
6
7
8
9
1 9 19 29 39 49
Inflat ion
Gro
wth
growth
IVs
Spline
Figure: E¤ect of in�ation on real GDP Growth rate, OECD developed countrysample set; panel data estimation.
Gillman (Federal Reserve Bank of St. Louis) With FRED and EconLowdown 3-4 November 2016 23 / 62

Phillips Curves: During Bank Productivity ChangeAnd Corresponding Stock Market Change: Debt-De�ation & Credit-In�at.
Figure: Phillips Curve During US Stock Market Crash and the Great Recession
Gillman (Federal Reserve Bank of St. Louis) With FRED and EconLowdown 3-4 November 2016 24 / 62

July 2008-May 2009 Stock Crash with Bank Crash
Figure: S&P 500 Index During Great Recession.
Gillman (Federal Reserve Bank of St. Louis) With FRED and EconLowdown 3-4 November 2016 25 / 62

May 29-May 33: US Great Depression
Figure: US Phillips Curve During Great Depression
Gillman (Federal Reserve Bank of St. Louis) With FRED and EconLowdown 3-4 November 2016 26 / 62
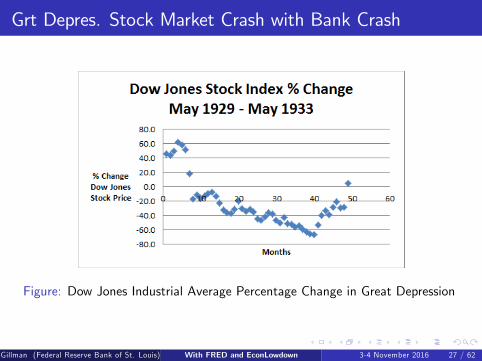
Grt Depres. Stock Market Crash with Bank Crash
Figure: Dow Jones Industrial Average Percentage Change in Great Depression
Gillman (Federal Reserve Bank of St. Louis) With FRED and EconLowdown 3-4 November 2016 27 / 62
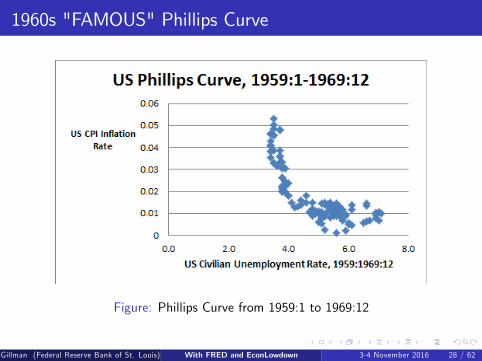
1960s "FAMOUS" Phillips Curve
Figure: Phillips Curve from 1959:1 to 1969:12
Gillman (Federal Reserve Bank of St. Louis) With FRED and EconLowdown 3-4 November 2016 28 / 62

Dawn of Multinational Corp & Global Finance: Bnk Prod.Boom
Figure: Dow Jones Industrial Average during the 1960�s.
Gillman (Federal Reserve Bank of St. Louis) With FRED and EconLowdown 3-4 November 2016 29 / 62

Savings, Investment & InterestCycles & Growth
Facts: Income Flow on Wealth; Savings & Investment data.Keynesian Analysis of Capital Market
IS: Supply shifts out by more than Demand, when Y " ;"Excess Savings" & Downward sloping IS.LM: D shifts out by more than S ; LM slopes up.Horizontal Lines on Solow Growth path: general case.Policy: Govt Spending & Money increases Good.
Fisherian Neoclass. 2-period Model of Sav & Invest.Business Cycle Explanation: just 2 joint Comparative Statics.TFP increase, and y0 endowment increase.Get Keynes (1936) only graph with y0 endowment increase.
Applic: Present Discounted Value.Append: Savings & Investment data on same basis (FRED).EconLowdown Module: Time Value of Money; & Soar toSavings.
Gillman (Federal Reserve Bank of St. Louis) With FRED and EconLowdown 3-4 November 2016 30 / 62

29 30 31 32 33 34 35 36 37 381.00
1.05
1.10
1.15
k Capital Investment, Savings
(1+r)/1
Figure: Shift Back in Supply and Upwards in Demand for Capital (Black), from aProductivity Increase Relative to Baseline (Red): Capital Investment (andSavings) Unchanged, but Interest Rate Higher.
Gillman (Federal Reserve Bank of St. Louis) With FRED and EconLowdown 3-4 November 2016 31 / 62

31 32 33 34 35 361.00
1.02
1.04
1.06
1.08
k Capital
(1+r)/1
Figure: An Increase in Current Income Endowment Shifts out the Supply ofCapital (Black Curve) and Lowers the Real Interest Rate.
Gillman (Federal Reserve Bank of St. Louis) With FRED and EconLowdown 3-4 November 2016 32 / 62

31 32 33 34 35 36 371.00
1.02
1.04
1.06
1.08
1.10
1.12
1.14
K1 Capital
1+r
Figure: Capital Market with 5% Increase in Goods Productivity and IncomeEndowment (Black) versus Baseline (Red).
Gillman (Federal Reserve Bank of St. Louis) With FRED and EconLowdown 3-4 November 2016 33 / 62

AS-AD & Business CyclesCycles & Growth
Facts
Monetary Prices Versus Relative PricesCapital to Goods Price & Debt-De�ationStylized Facts Of Cycles
Theory: Ramsey�s World with AS-AD
Ramsey Markets for Output, Labor and CapitalRBC Analysis: Goods & Time Endowment Changes
Application: Crisis from Fixed WageAppendix: Crisis from Bank Productivity Crash.EconLowdown Module: "The Great Depression 5".
Gillman (Federal Reserve Bank of St. Louis) With FRED and EconLowdown 3-4 November 2016 34 / 62

Figure: US Nominal Price of Goods (CPI) Divided by the Nominal Wage Rate(average weekly wage and salary, full time, 16 and over): P/W , 1979 to 2015
Gillman (Federal Reserve Bank of St. Louis) With FRED and EconLowdown 3-4 November 2016 35 / 62

Figure: Annual Growth Rate of Real Wage Rate and Trend-Adjusted Real GDP,US 1965:6-2014.
Gillman (Federal Reserve Bank of St. Louis) With FRED and EconLowdown 3-4 November 2016 36 / 62

Figure: Annual Average Growth Rates of US Civilian Labor Force ParticipationRate, 1957:7-2015.14, (Blue) and Normalized Real GDP (Red).
Gillman (Federal Reserve Bank of St. Louis) With FRED and EconLowdown 3-4 November 2016 37 / 62

0.14 0.16 0.18 0.20 0.22 0.24 0.26 0.28 0.30 0.320
5
10
15
Aggregate Output y
1/w
Figure: Business Cycle Expansion in Goods Market: AS � AD Equilibrium with5% Increase (in Black) in Both Productivity A and Time T as Compared to theOriginal (in Red).
Gillman (Federal Reserve Bank of St. Louis) With FRED and EconLowdown 3-4 November 2016 38 / 62

0.44 0.46 0.48 0.50 0.52 0.54 0.56 0.58 0.60 0.620.08
0.10
0.12
0.14
0.16
0.18
0.20
0.22
Labor Employment
w
Figure: Business Cycle Expansion: Labor Market has a Shift out in Demand(Black) and Pivoting of Supply (Black) as Compared to Original (Red).
Gillman (Federal Reserve Bank of St. Louis) With FRED and EconLowdown 3-4 November 2016 39 / 62

0 1 2 3 4 5
0.05
0.06
0.07
0.08
0.09
0.10
Capital Stock k
Real Interest Rate r
Figure: Capital Market Shows Shift Out of Demand for Capital (Black Curve)When both Factor Productivity A and Time Endowments T Increase by 5%relative to the Original Example Equilibrium (Red Curve).
Gillman (Federal Reserve Bank of St. Louis) With FRED and EconLowdown 3-4 November 2016 40 / 62

0.30 0.35 0.40 0.45 0.50 0.55 0.600.08
0.10
0.12
0.14
0.16
0.18
0.20
Labor Employment
w
Excess Supply
Figure: Excess Labor Supply with a Fixed Wage During Contraction (in Black)relative to the original example equilibrium (in Red).
Gillman (Federal Reserve Bank of St. Louis) With FRED and EconLowdown 3-4 November 2016 41 / 62

Growth, Progress and AS-ADCycles & Growth
Stylized Growth Rate Facts
Solow & Solow Plus Growth Facts
Theory: Growth Puzzle that Solow Solved
A Comparative Static Productivity IncreaseAS-AD with Solow GrowthSolow Growth from Ramsey WorldAS-AD with Continual Technological Progress
Application: Trend Down in TimeAppendix: Growth with Human CapitalEconLowdown Module ""Economic Growth".
Gillman (Federal Reserve Bank of St. Louis) With FRED and EconLowdown 3-4 November 2016 42 / 62

Figure: US Years of Education by Birth Cohort
Gillman (Federal Reserve Bank of St. Louis) With FRED and EconLowdown 3-4 November 2016 43 / 62

0.14 0.16 0.18 0.20 0.22 0.24 0.26 0.28 0.30 0.320
5
10
15
Aggregate Output y
1/w
Figure: AS � AD Equilibrium with Goods Productivity Increase (in Black) asCompared to the Original (in Red).
Gillman (Federal Reserve Bank of St. Louis) With FRED and EconLowdown 3-4 November 2016 44 / 62

0.3 0.4 0.5 0.6 0.70.05
0.10
0.15
0.20
0.25
0.30
Labor Employment
w
Figure: Increase in Productivity (Black Curves) Raises w and Leaves EmploymentUnchanged.
Gillman (Federal Reserve Bank of St. Louis) With FRED and EconLowdown 3-4 November 2016 45 / 62

0.23 0.24 0.25 0.26 0.27 0.285
6
7
8
9
10
Aggregate Output y
1/w
Figure: AS � AD Equilibria Over Time With 2% Exogenous Growth Example;Moving From Red to Black Curves over 4 years.
Gillman (Federal Reserve Bank of St. Louis) With FRED and EconLowdown 3-4 November 2016 46 / 62

0.590 0.595 0.600 0.605 0.610
0.135
0.140
0.145
0.150
0.155
0.160
Labor
Wage Rate w
Figure: Labor Market with 2% Exogenous Growth and Rising Real Wage,Constant Employment, Over Time.
Gillman (Federal Reserve Bank of St. Louis) With FRED and EconLowdown 3-4 November 2016 47 / 62

Policy as Social InsurancePolicy
Facts: British and American "Welfare States"Theory: Moral Hazard Danger of Social Insurance
Inequality and ConsumptionPermanent Income ConsumptionRamsey World�s Keynesian CrossSpanning Keynesian & Friedman ConsumptionSocial Insurance Examples
Application: FDIC Post-2010 Dodd-FrankAppendix: Taxes, Public Goods, InsuranceEconLowdown Modules "Government Budgets" & "FiscalPolicy".
Gillman (Federal Reserve Bank of St. Louis) With FRED and EconLowdown 3-4 November 2016 48 / 62

0 1 2 3
0.7
0.8
0.9
1.0
Y
C/Y = (a/Y)+ b
Figure: Consumption as a Fraction of Income: in the Keynesian Theory ofConsumption C = a+ bY .
Gillman (Federal Reserve Bank of St. Louis) With FRED and EconLowdown 3-4 November 2016 49 / 62

0.0 0.5 1.0 1.5 2.00.0
0.5
1.0
1.5
2.0
y_Perm
c/(y_Perm) = a
Figure: Consumption as a Fraction of Permanent Income: Ramsey-FriedmanTheory
Gillman (Federal Reserve Bank of St. Louis) With FRED and EconLowdown 3-4 November 2016 50 / 62

"Ramsey Cross"
0.00 0.01 0.02 0.03 0.04 0.05 0.06 0.07 0.08 0.09 0.10 0.11 0.120.00
0.02
0.04
0.06
0.08
0.10
0.12
w Full Income
c
Figure: Ramsey Consumption Theory and Busines Cycles: Increase in A.Gillman (Federal Reserve Bank of St. Louis) With FRED and EconLowdown 3-4 November 2016 51 / 62

The Great Recession and Lost DecadePolicy
Facts: Fed "Bailout" of US Bank System?Theory: Bagehot�s law of �nancial e¢ ciency
Tax on Capital Markets, Welfare Loss,Financial "Repression"Seeking Yield": Capital Market DistortionGovernment Capital FloodingInternationally Ine¢ cient Bank SubsidizationDeconstructing 3-Equation Keynesian Bank Model
Application: Normalizing PolicyAppendix: Being Earnest on BankingEconLowdown Module "The Great Depression 6".
Gillman (Federal Reserve Bank of St. Louis) With FRED and EconLowdown 3-4 November 2016 52 / 62

Figure: Great Recession and Post 9/11 Negative Real Interest Rates (Green) vs.FFR (Blue) and CPI in�ation at a monthly frequency (Red).
Gillman (Federal Reserve Bank of St. Louis) With FRED and EconLowdown 3-4 November 2016 53 / 62

Fed Caused Lost Decade?Purple line (Total Assets) - (MBS) follows Red (Excess Reserves)
Gillman (Federal Reserve Bank of St. Louis) With FRED and EconLowdown 3-4 November 2016 54 / 62

Fed�s Assets Minus MBS & Excess Res.= 0
Gillman (Federal Reserve Bank of St. Louis) With FRED and EconLowdown 3-4 November 2016 55 / 62

Interest on Excess Reserves Forces Down Real Interest Rt.
Figure: Loan Ratio (Blue) & Real Int.Rt (Red)Gillman (Federal Reserve Bank of St. Louis) With FRED and EconLowdown 3-4 November 2016 56 / 62

Figure: Loan to Demand Deposit Ratios: Consumer Loans Ratio in Red;Commercial and Industrial Loans Ratio in Blue.
Gillman (Federal Reserve Bank of St. Louis) With FRED and EconLowdown 3-4 November 2016 57 / 62

When E¤ective Ceiling Imposed On Real Interest Rate
31 32 33 34 35 361.00
1.02
1.04
1.06
1.08
K1 Capital
1+r
Excess Demand For Capital
Figure: Savings and Investment: Aggregate Supply and Demand for Capital kWith Real Interest Rate Ceiling
Gillman (Federal Reserve Bank of St. Louis) With FRED and EconLowdown 3-4 November 2016 58 / 62
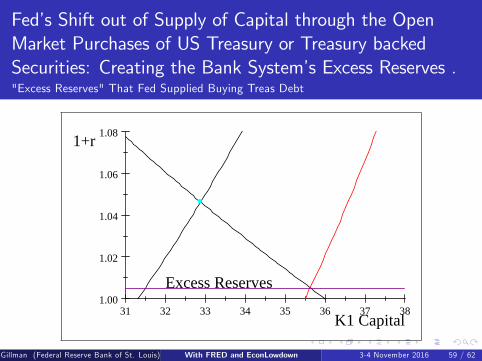
Fed�s Shift out of Supply of Capital through the OpenMarket Purchases of US Treasury or Treasury backedSecurities: Creating the Bank System�s Excess Reserves ."Excess Reserves" That Fed Supplied Buying Treas Debt
31 32 33 34 35 36 37 381.00
1.02
1.04
1.06
1.08
K1 Capital
1+r
Excess Reserves
Figure:Gillman (Federal Reserve Bank of St. Louis) With FRED and EconLowdown 3-4 November 2016 59 / 62

Capital Tax Wedge on Priv Invest. with High r forInvestmentLow r for Savings: Dead Weight Triangle Loss of Welfare
31 32 33 34 35 36 37 381.00
1.02
1.04
1.06
1.08
K1 Capital
1+r
Excess Reserves
Figure: "Deadweight Loss Triangle"Gillman (Federal Reserve Bank of St. Louis) With FRED and EconLowdown 3-4 November 2016 60 / 62

View of Wedge in Gen Equil CCAPMBrown Indi¤ Curve CUTS Prod Funct at Low Diversi�cation Level
0.0 0.2 0.4 0.6 0.8 1.00.00
0.05
0.10
0.15
0.20
0.25
Capital at Risk
Capital Yield
Figure: Optimal Portfolio Diversi�cation between Market Portfolio (Tangency)and "Risk-free" Government Debt.
Gillman (Federal Reserve Bank of St. Louis) With FRED and EconLowdown 3-4 November 2016 61 / 62

Economy�s Python Digestion of Prickly ProblemPorcupine Eaten?: Prickly Future In�ation
Figure: US Economy�s Python
Gillman (Federal Reserve Bank of St. Louis) With FRED and EconLowdown 3-4 November 2016 62 / 62