using fuzzy inference systems to optimize highway alignments · using fuzzy inference systems to...
TRANSCRIPT
44
USING FUZZY INFERENCE SYSTEMS TO OPTIMIZE HIGHWAY ALIGNMENTS
Gianluca Dell’Acqua1
1 Department of Transportation Engineering “Luigi Tocchetti”, University of Napoli Federico II, Via Claudio 21, I-80125 Naples, Italy
Received 13 October 2011; accepted 31 December 2011
Abstract: The general objective of the research project is to explore innovations in integrating infrastructure and land use planning for transportation corridors. In contexts with environmental impact, the choice of transportation routes must address the sensitivity of current and pre-existing conditions. Multi-criteria analyses are used to solve problems of this nature, but they do not define an objective approach on a quantitative basis taking into account some important, but often intrinsically unmeasurable parameters. Fuzzy logic becomes a more effective model as systems become more complex. During the preliminary design phase, fuzzy inference systems offer a contribution to decision-making which is much more complete than a benefits/and costs analysis. In this study, alternative alignment options are considered, combining engineering, social, environmental, and economic factors in the decision-making. The research formalizes a general method useful for analyzing different case studies. The method can be used to justify highway alignment choices in environmental impact study analysis.
Keywords: fuzzy logic, highway layout alternatives, environmental component, land sensitivity.
1 Corresponding author: [email protected]
1. Introduction
The typical multi-objective decision-making problem involves selecting one alternative from a range of possible alternatives given a set of criteria important for the road designer. For a new highway, a minimum cost route needs to be selected while at the same time satisfying a number of design constraints such as curvature, gradient, and sight distance requirements. Since a number of costs considered in highway design optimization are geography sensitive, a geographic information system may be used to obtain them. The geography-sensitive costs mainly concern right-of-way, earthwork, and environmental parameters ( Jha and Schonfeld, 2000).
The complexity of environmental impacts arising from the construction of a new transport infrastructure can be properly modeled using fuzzy logic.
Professor Lotfi Zadeh of U.C. Berkley developed fuzzy logic and set theory in 1965. Fuzzy logic and probabilistic logic are similar but differ in setting degrees of truth rather than probability of likelihood. Fuzzy logic becomes a more effective model as systems become more complex. During the preliminary design phase, fuzzy inference systems offer a contribution to decision-making which is much more complete than a benefits and costs analysis.
Fuzzy inference is the process of formulating mapping from a given input to an output using
UDC: 625.721:510.644 Dell’Acqua G. Using Fuzzy Inference Systems to Optimize Highway Alignments
45
fuzzy logic. This mapping then provides a basis for decision-making, or for discerning patterns. The fuzzy inference process involves all the elements of Membership Functions, Logical Operations, and If-Then Rules. This study uses Mamdani-type FIS rules (Mamdani and Assilian, 1975).
Fuzzy inference systems have been successfully applied in fields such as automatic control, data classification, decision analysis, expert systems, and computer vision. Because of their multidisciplinary nature, fuzzy inference systems have a number of names, such as fuzzy-rule-based systems, fuzzy expert systems, fuzzy modeling, fuzzy associative memory, fuzzy logic controllers, and simply (and ambiguously) fuzzy systems.
The best known and most often applied fuzzy systems are Mamdani approach systems with the max-min or max-product type of inference. The max operation refers to the aggregation of the inferred fuzzy sets. The min and product operators are T-norm operators, used as inference rules (Mamdani and Assilian, 1975). The min operator is very convenient from the point of view of mathematical form. Therefore, it has been chosen to represent the IF-THEN rules in the fuzzy systems based on the Mamdani type of inference.
2. Problem Statement
Many simple decision-making processes are based on a single objective, such as minimizing cost. Often decisions must be made in an environment where more than one objective function imposes constraints on the problem. The process of developing a highway usually consists of five stages: planning, preliminary design, detailed design, right-of-way acquisition, and construction. Some models proposed in the past offer a radical conceptual step towards optimal decision-making in highway engineering, especially for highway
expansion and rehabilitation decisions that are essential in highway systems subject to uncertainties (Zhao et al. 2004).
The two main limitations of the classic cost benefit analysis in the case of transport infrastructure are: a) that all the effects of a project are evaluated in monetary terms, so that when social and environmental aspects prevail, the method is completely inadequate, and b) that the maximization of the total net benefit does not show the effects of a decision on the different objectives and the different social groups involved (Colorini et al. 1999).
There is an interconnection between transportation and land use that the public and local decision-makers do not often recognize. They frequently hold Agencies responsible for solving transportation problems resulting from local and regional land use decisions and preferred development patterns. However, several States have already made forays into integrating land use and transportation decisions, and collaborating with local and regional agencies. The objective of a recent research project is to identify and explore successful innovations in integrating transportation and land use planning for transportation corridors, focusing on specific practices that could be transferred to other locations (Rooney et al. 2010).
The growing need for designers to recognize the importance of sustainable development within civil engineering has been identified from a regulatory standpoint (Willetts et al. 2010). Environmental indicators are increasingly being used to assess the sustainability of transport and facilitate decision-making. However, potential users of indicators are faced with a wealth of indicator sets, differing greatly in their scientific basis and applicability in practice. There seems
International Journal for Traffic and Transport Engineering, 2012, 2(1): 44 – 59
46
to be a need to develop approaches to help decision-makers choose suitable indicator sets for different purposes ( Joumard et al. 2011).
In a number of previous studies, the approach focused on avoiding adverse impacts, perceiving roads as contributing to economic developments. In this study, alternative alignment options are considered, combining engineering, social, environmental, and economic factors in the decision-making. Candidate road layouts are screened to select the alignments best able to provide optimum returns in passenger and goods transportation, as well as associated economic development potential, while minimizing adverse social and environmental impact (Corbett and Gaviria, 2003).
3. Methodology
An important application of fuzzy logic is synthetic evaluation. The term synthetic is used to connote the process of evaluation whereby several elements and components of an evaluation are synthesized into an aggregate form. The various elements can be numeric or non-numeric, and the process of fuzzy synthesis is naturally accommodated using synthetic evaluation.
Decisions are sometimes made on the basis of rank, or ordinal ranking. For deterministic actions, there is no ambiguity in the ranking. In situations where the actions are associated with uncertainty, rank ordering may be ambiguous. Land and environmental sensitivity analysis requires the formalization of an interpretative model for environmental values. Applied to road design, this method makes it possible to produce different layout alternatives, identified by the system of environmental ties and the degree of vulnerability of the territory.
So, the study area which the method has to address must be divided into areolas, called
“Land Units” (L. U.), with homogeneous environmental features, related to the various environmental aspects that have to be taken into consideration.
A grid is applied to divide the design map, inside which the spacing must be fixed in two directions. Generally, the grid is in squares of fixed dimensions established on the basis of various factors, such as the degree of homogeneity of the territory, the intensity and significance of the information available, and the level of precision required. In the applications, the territory has been broken down into L.U’s. using a grid of 250m x 250m.
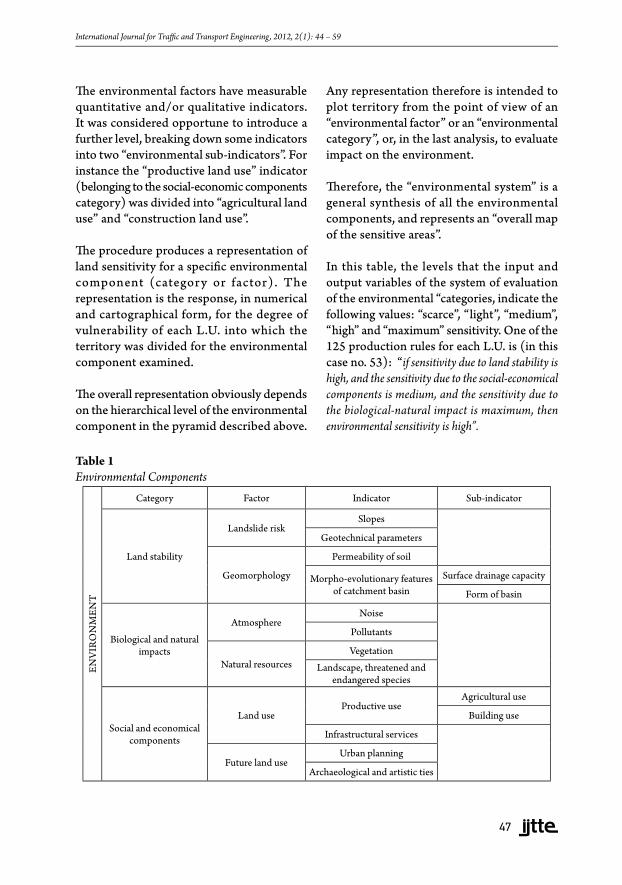
The FIS allows the logical aggregation of the information coming from the basic thematic cartography to construct progressively more complex informative systems rather than a single representation of the sensitivity of the environmental system in question. These were then compared with the proposed alternative layouts for design infrastructure. How the significant environmental features were identified is summarized in Table 1, which may be useful for rural highways.
The “Environmental System” was divided into “components”, using a structure that presents the aggregate aspects at the top and the disaggregated ones at the bottom. The hierarchical levels of the tree of environmental components, from the highest to the lowest, are “environmental categories”, “environmental factors”, and “environmental indicators”. The environmental system was first divided into the following categories: “land stability”, “biological natural impact” and “social and economic components”. Each category was sub-divided into environmental factors. For instance the “land stability” category is sub-divided into “landslide risk” and “geomorphological aspects”.
Dell’Acqua G. Using Fuzzy Inference Systems to Optimize Highway Alignments
47
The environmental factors have measurable quantitative and/or qualitative indicators. It was considered opportune to introduce a further level, breaking down some indicators into two “environmental sub-indicators”. For instance the “productive land use” indicator (belonging to the social-economic components category) was divided into “agricultural land use” and “construction land use”.
The procedure produces a representation of land sensitivity for a specific environmental component (category or factor). The representation is the response, in numerical and cartographical form, for the degree of vulnerability of each L.U. into which the territory was divided for the environmental component examined.
The overall representation obviously depends on the hierarchical level of the environmental component in the pyramid described above.
Any representation therefore is intended to plot territory from the point of view of an “environmental factor” or an “environmental category”, or, in the last analysis, to evaluate impact on the environment.
Therefore, the “environmental system” is a general synthesis of all the environmental components, and represents an “overall map of the sensitive areas”.
In this table, the levels that the input and output variables of the system of evaluation of the environmental “categories, indicate the following values: “scarce”, “light”, “medium”, “high” and “maximum” sensitivity. One of the 125 production rules for each L.U. is (in this case no. 53): “if sensitivity due to land stability is high, and the sensitivity due to the social-economical components is medium, and the sensitivity due to the biological-natural impact is maximum, then environmental sensitivity is high”.
Table 1 Environmental Components
ENv
iRo
NM
ENT
Category Factor indicator Sub-indicator
Land stability
Landslide riskSlopes
Geotechnical parameters
Geomorphology
Permeability of soil
Morpho-evolutionary features of catchment basin
Surface drainage capacity
Form of basin
Biological and natural impacts
AtmosphereNoise
Pollutants
Natural resourcesvegetation
Landscape, threatened and endangered species
Social and economical components
Land useProductive use
Agricultural use
Building use
infrastructural services
Future land useUrban planning
Archaeological and artistic ties
International Journal for Traffic and Transport Engineering, 2012, 2(1): 44 – 59
48
Twelve sub-systems have been formalized in this study, of which ten are “primary” (six for the environmental factors, three for the environmental categories and one for the general environmental overview), and two are “secondary”, to evaluate the environmental indicators divided into sub-indicators.
The quantification of the vulnerability of each L.U. is represented in a traditional way (the degree of sensitivity represented within the interval [0;1]), grouping the L. U. into five classes of sensitivity: “scarce”, “light”, “medium”, “high” and “maximum” ([0;0.2], [0.2;0.4], [0.4;0.6], [0.6;0.8] or [0.8;1]). Obviously the description of land vulnerability is more uniform therefore less precise, but more legible.
In the proposed study, inputs and outputs are crisp and the fuzzy inference system implements a nonlinear mapping from its input space to output space.
Fuzzy inference is a computer paradigm based on fuzzy set theory, fuzzy if-then-rules and fuzzy reasoning. The structure of the Fuzzy Inference System is:
• Rule base ← selects the set of fuzzy rules• Database (or dictionary) ← defines the
membership functions used in the fuzzy rules• A reasoning mechanism ← performs the
inference procedure • Defuzzification: extraction of a crisp
value that best represents a fuzzy set.
The proposed FIS applies Tnorm operator min to represent the fuzzy IF-THEN rules:
Rk: IF x is AK AND y is BK THEN z is CK (1)
where x, y and z are linguistic variables, Ak, Bk and Ck are antecedent and consequent fuzzy sets, characterized by the membership
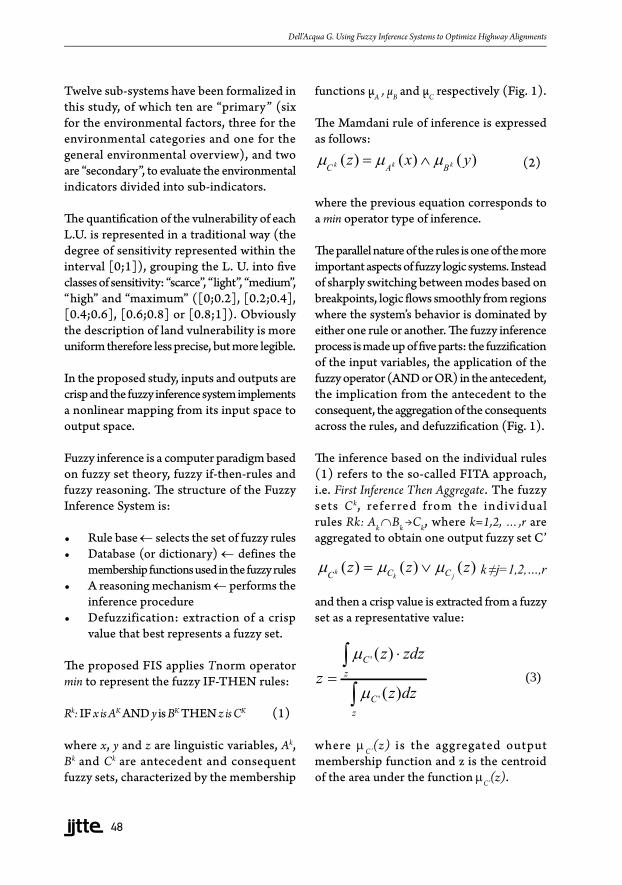
functions µA , µB and µC respectively (Fig. 1).
The Mamdani rule of inference is expressed as follows:
(2)
where the previous equation corresponds to a min operator type of inference.
The parallel nature of the rules is one of the more important aspects of fuzzy logic systems. Instead of sharply switching between modes based on breakpoints, logic flows smoothly from regions where the system’s behavior is dominated by either one rule or another. The fuzzy inference process is made up of five parts: the fuzzification of the input variables, the application of the fuzzy operator (AND or OR) in the antecedent, the implication from the antecedent to the consequent, the aggregation of the consequents across the rules, and defuzzification (Fig. 1).
The inference based on the individual rules (1) refers to the so-called FITA approach, i.e. First Inference Then Aggregate. The fuzzy sets Ck, referred from the indiv idual rules Rk: Ak ∩Bk →Ck, where k=1,2, …,r are aggregated to obtain one output fuzzy set C’
k ≠j=1,2,…,r
and then a crisp value is extracted from a fuzzy set as a representative value:
(3)
where mC’(z) is the aggregated output membership function and z is the centroid of the area under the function mC’(z).
Dell’Acqua G. Using Fuzzy Inference Systems to Optimize Highway Alignments
49
4. Case Study
The procedure proposed was applied to verify the effectiveness and representativeness of the comparison of alternative layouts and the search for the environmentally optimal solution for a road section of the major S.S. 106 “Jonica” highway between the small urban communities of Squillace and Simeri Crichi in the south of Italy.
The results were compared with the results of an “environmental impact study” by the ANAS Department (Italian State Highway Administrator) for the Calabria road network in the South of Italy, using traditional methodology.
The “preferred” layout of the Environmental Assessment Study and the alternative layouts proposed by ANAS and the Local Administrations were assessed using the procedure.
The Jonica S.S. 106 is the highway covering the long-distance interregional coastal traffic route through Calabria, Basilicata and Puglia (three Southern Italian regions), from Reggio Calabria to Taranto (two important cities in the South of Italy). Some adjustment is planned to give this important highway some of the geometric characteristics required for its functional level.
A square grid with sides of 250 m was laid over the area under examination and subdivided into 1,340 Land Units, each of which is identified by an alphanumeric code.
The first layout alternative to assess (Solution D) is characterized by reduced length in comparison with the subsequent ones, and its alignment with the coastline. For this reason, it involves heavily urbanized areas and only partially manages to separate
Fig. 1. Reasoning Scheme
International Journal for Traffic and Transport Engineering, 2012, 2(1): 44 – 59
50
the transit and internal traffic flows crossing the built up land context.
The second alternative, drawn up by the municipal administration of the city of Catanzaro (Solution C), has a longer alignment than the previous one and is rather more difficult in terms of grade and alignment: it is used as a bypass around the urban area of Catanzaro Marina, crossing environmentally sensitive territories, and is far from the coastline.
In the Calabria Region, the Catanzaro Civic Authorities and the ANAS Department set up a “Program Agreement”. It proposes a third solution for modernizing the S.S. 106 (Solution B). The layout is shorter and less difficult than the one proposed by Catanzaro, and functions as an external bypass for the inhabited area of Catanzaro Marina. Finally, the environmental insertion study presented by ANAS developed the preferred alternative, Solution A, a layout similar to Solution B, but with less serious impact.
For comparison, the inferential procedure of this study proposed an alternative alignment, Solution E, with reduced length and aligned with the coastline but running outside the inhabited center of Catanzaro Lido. In addition, the new alternative route makes it possible to avoid crossing Land Units with a degree of sensitivity greater than 0.6 and would be more cost effective.
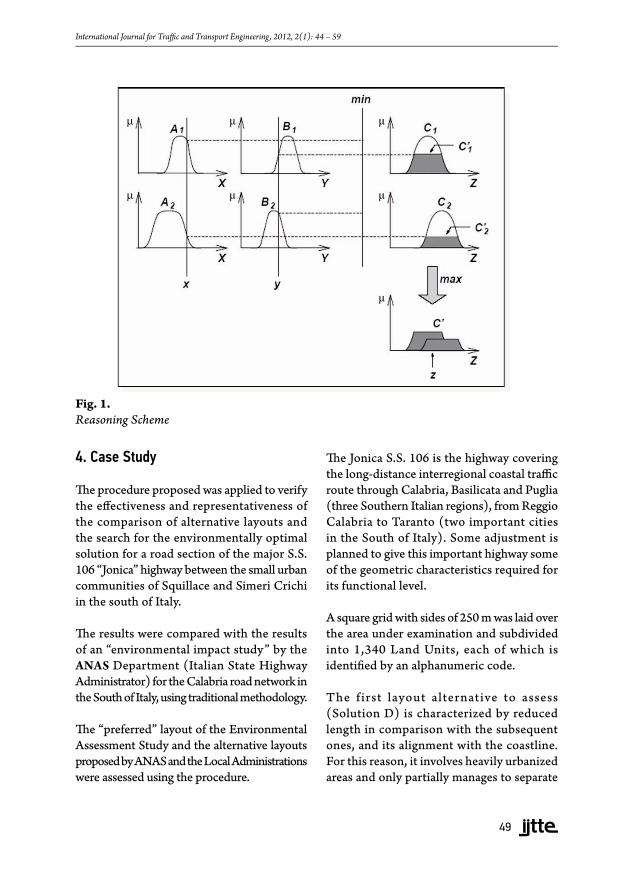
From the general map of the sensitive areas, the useful corridor is easily identifiable, and it is only constrained in the initial section (in the South-Northbound direction). The five described layouts are represented graphically in Fig. 2.
These were compared using a general parameter, called “Global Environmental Impact” I = Sumi (li x gi) where gi is the degree
of sensitivity of the i L.U. crossed and li is the length of the portion of layout on the same L.U.
The five proposed layout alternatives were compared (Table 2) according to the values of parameter I in relation to each of them, the maximum value of the degree of sensitivity among those of all the areolas crossed (gmax), and the mean weight of the degrees of sensitivity in relation to the length L = Sumi (li) of the proposed layout: G = I / L.
Setting aside Solution D, technically not suited to the functional limits stressed, of the remaining four layouts - comparable in terms of their practically identical start and end points - the solution that gives the minimum value for parameter I is the one produced applying the proposed procedure (Solution E).
The longest layout (Solution C), which is also very difficult, would produce the greatest general environmental impact, also producing the lowest value of mean damage G. Solutions B and A have intermediary characteristics among the different alternatives with a best general output of A.
It is important to note that this solution - considered the best of those proposed is, however, the result of an analysis of land sensitivity, even if it was developed using traditional methodologies. Table 2 Layout Evaluation Index
Layout L [m] gmax I [m] G
A 16,585 0.635 9,373 0.565
B 16,842 0.678 9,647 0.573
C 18,493 0.732 10,309 0.557
D 12,073 0.649 6,875 0.569
E 15,022 0.600 8,666 0.577
Dell’Acqua G. Using Fuzzy Inference Systems to Optimize Highway Alignments
51
Solution A is the preferred alternative developed by the ANAS environmental study. Solution E is the alignment with the least global impact and the maximum sensitivity, having an L.U. value not greater than 0.6.
5. Back Analysis
The layout of Solution E was subsequently submitted to a “back analysis” identifying relationships among environmental aspects and taking into consideration the possible defining mitigation measures.
5.1. Land Stability
The Land Stability category is derived from the synthesis of the landslide risk and geomorphology factors. The landslide risk
factor is derived from the slope environmental indicators and geotechnical parameters.
The acclivity (steepness) indicator was quantified using the average slope value p [0 %; 100%] of the slopes found in each of the Land Units. The interval was then divided into seven fuzzy sets ranging from slight to very steep slope.
The geotechnical characteristics indicator was measured by fuzzifying the values of angle of internal friction (φ) of the terrain variable within the interval [20°; 50°] and the values of the Rock Quality Designation (R.Q.D.) for compact rocks variable within the interval [0; 100]. Three fuzzy numbers (poor, medium and good geotechnical characteristics) characterize the indicator.
Fig. 2. Sensitive Areas: Design Alternatives
International Journal for Traffic and Transport Engineering, 2012, 2(1): 44 – 59
52
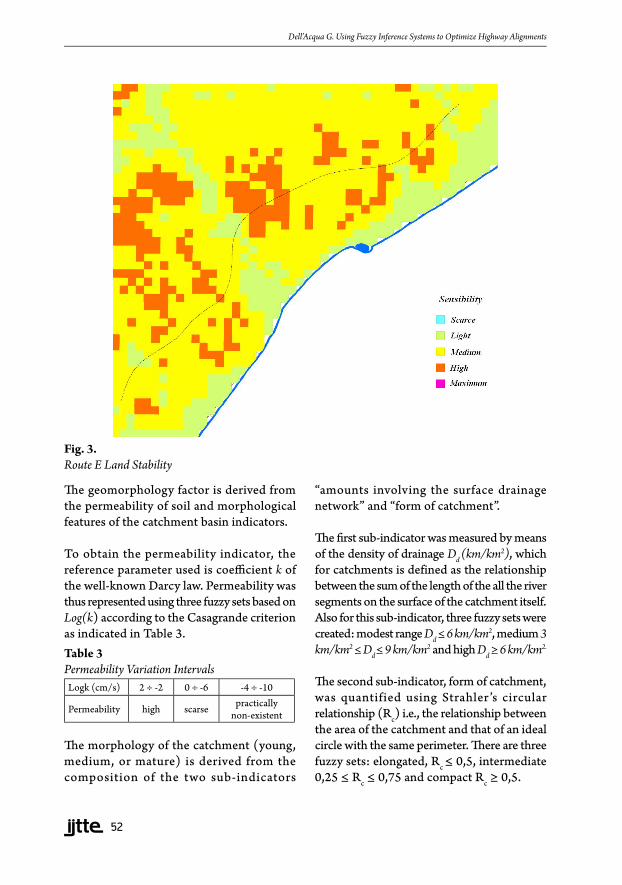
The geomorphology factor is derived from the permeability of soil and morphological features of the catchment basin indicators.
To obtain the permeability indicator, the reference parameter used is coefficient k of the well-known Darcy law. Permeability was thus represented using three fuzzy sets based on Log(k) according to the Casagrande criterion as indicated in Table 3.Table 3 Permeability Variation IntervalsLogk (cm/s) 2 ÷ -2 0 ÷ -6 -4 ÷ -10
Permeability high scarse practically non-existent
The morphology of the catchment (young, medium, or mature) is derived from the composition of the two sub-indicators
“amounts involving the surface drainage network” and “form of catchment”.
The first sub-indicator was measured by means of the density of drainage Dd (km/km2), which for catchments is defined as the relationship between the sum of the length of the all the river segments on the surface of the catchment itself. Also for this sub-indicator, three fuzzy sets were created: modest range Dd ≤ 6 km/km2, medium 3 km/km2 ≤ Dd ≤ 9 km/km2 and high Dd ≥ 6 km/km2.
The second sub-indicator, form of catchment, was quantified using Strahler’s circular relationship (Rc) i.e., the relationship between the area of the catchment and that of an ideal circle with the same perimeter. There are three fuzzy sets: elongated, Rc ≤ 0,5, intermediate 0,25 ≤ Rc ≤ 0,75 and compact Rc ≥ 0,5.
Fig. 3. Route E Land Stability
Dell’Acqua G. Using Fuzzy Inference Systems to Optimize Highway Alignments
53
Concerning the environmental category “Land Stability ” (Fig. 3), it is to be ob ser ved that the propo sed layout crosses Land Units characterized by medium sensitivity. For the middle road section, where there are areas with high vulnerability on hilly terrain, specific geological and geotechnical investigation needs to be carried out and choices adopted for vertical alignment, while technological studies need to be carried out for the road (tunnels, excavation, slant stabilization, etc) to minimize risks.
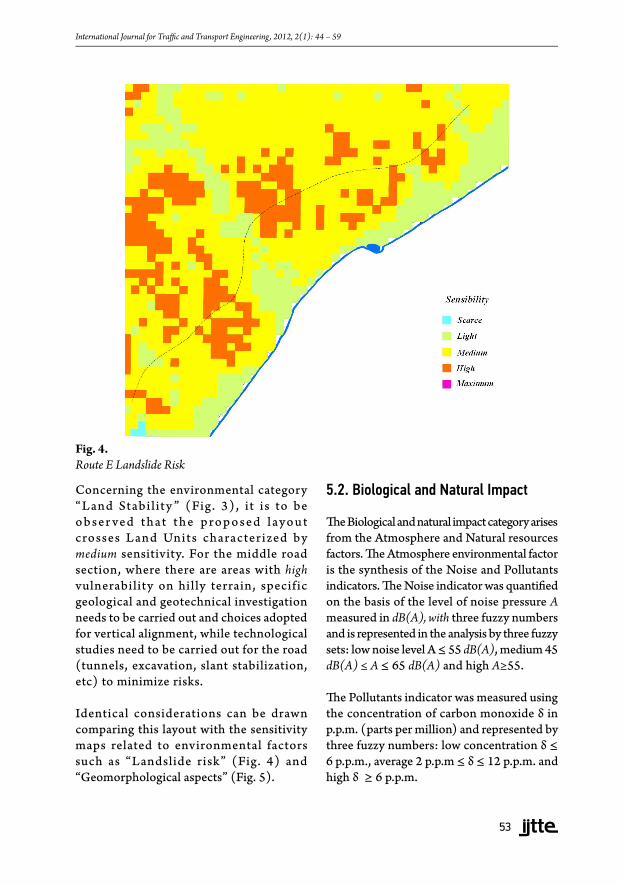
Identical considerations can be drawn comparing this layout with the sensitivity maps related to environmental factors such as “Landslide risk” (Fig. 4) and “Geomorphological aspects” (Fig. 5).
5.2. Biological and Natural Impact
The Biological and natural impact category arises from the Atmosphere and Natural resources factors. The Atmosphere environmental factor is the synthesis of the Noise and Pollutants indicators. The Noise indicator was quantified on the basis of the level of noise pressure A measured in dB(A), with three fuzzy numbers and is represented in the analysis by three fuzzy sets: low noise level A ≤ 55 dB(A), medium 45 dB(A) ≤ A ≤ 65 dB(A) and high A≥55.
The Pollutants indicator was measured using the concentration of carbon monoxide δ in p.p.m. (parts per million) and represented by three fuzzy numbers: low concentration δ ≤ 6 p.p.m., average 2 p.p.m ≤ δ ≤ 12 p.p.m. and high δ ≥ 6 p.p.m.
Fig. 4. Route E Landslide Risk
International Journal for Traffic and Transport Engineering, 2012, 2(1): 44 – 59
54
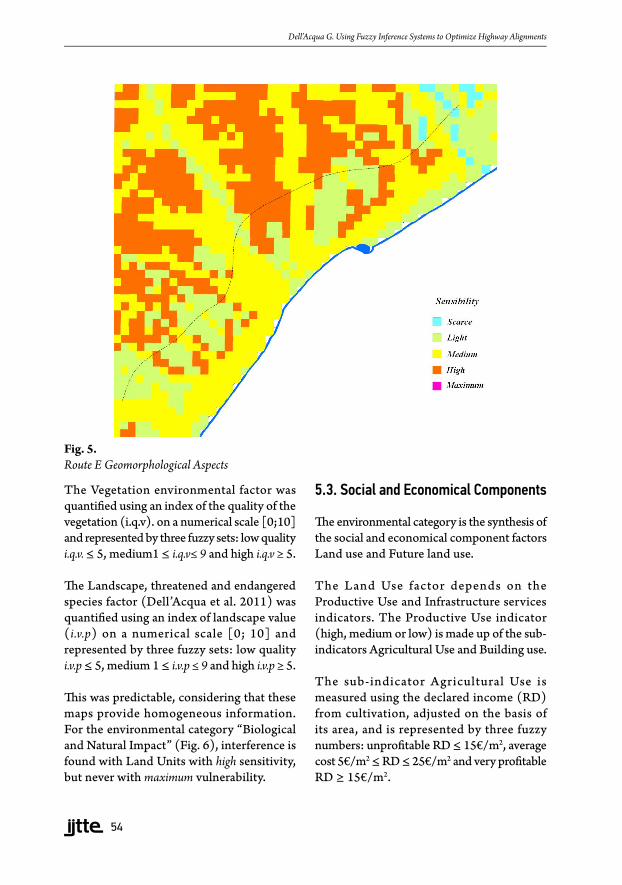
The Vegetation environmental factor was quantified using an index of the quality of the vegetation (i.q.v). on a numerical scale [0;10] and represented by three fuzzy sets: low quality i.q.v. ≤ 5, medium1 ≤ i.q.v≤ 9 and high i.q.v ≥ 5.
The Landscape, threatened and endangered species factor (Dell’Acqua et al. 2011) was quantified using an index of landscape value (i.v.p) on a numerical scale [0; 10] and represented by three fuzzy sets: low quality i.v.p ≤ 5, medium 1 ≤ i.v.p ≤ 9 and high i.v.p ≥ 5.
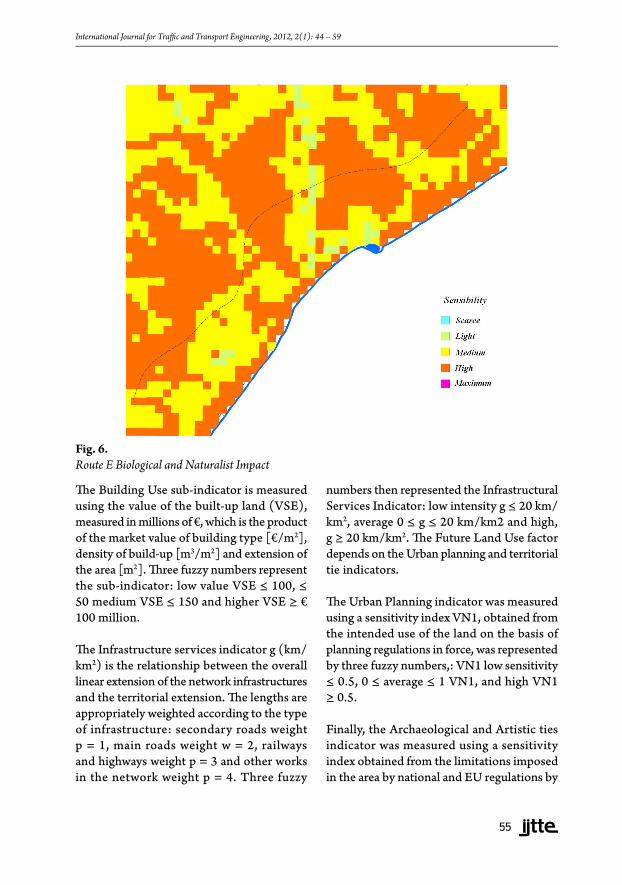
This was predictable, considering that these maps provide homogeneous information. For the environmental category “Biological and Natural Impact” (Fig. 6), interference is found with Land Units with high sensitivity, but never with maximum vulnerability.
5.3. Social and Economical Components
The environmental category is the synthesis of the social and economical component factors Land use and Future land use.
The Land Use factor depends on the Productive Use and Infrastructure services indicators. The Productive Use indicator (high, medium or low) is made up of the sub-indicators Agricultural Use and Building use.
The sub-indicator Agricultural Use is measured using the declared income (RD) from cultivation, adjusted on the basis of its area, and is represented by three fuzzy numbers: unprofitable RD ≤ 15€/m2, average cost 5€/m2 ≤ RD ≤ 25€/m2 and very profitable RD ≥ 15€/m2.
Fig. 5. Route E Geomorphological Aspects
Dell’Acqua G. Using Fuzzy Inference Systems to Optimize Highway Alignments
55
The Building Use sub-indicator is measured using the value of the built-up land (VSE), measured in millions of €, which is the product of the market value of building type [€/m2], density of build-up [m3/m2] and extension of the area [m2]. Three fuzzy numbers represent the sub-indicator: low value VSE ≤ 100, ≤ 50 medium VSE ≤ 150 and higher VSE ≥ € 100 million.
The Infrastructure services indicator g (km/km2) is the relationship between the overall linear extension of the network infrastructures and the territorial extension. The lengths are appropriately weighted according to the type of infrastructure: secondary roads weight p = 1, main roads weight w = 2, railways and highways weight p = 3 and other works in the network weight p = 4. Three fuzzy
numbers then represented the Infrastructural Services Indicator: low intensity g ≤ 20 km/km2, average 0 ≤ g ≤ 20 km/km2 and high, g ≥ 20 km/km2. The Future Land Use factor depends on the Urban planning and territorial tie indicators.
The Urban Planning indicator was measured using a sensitivity index VN1, obtained from the intended use of the land on the basis of planning regulations in force, was represented by three fuzzy numbers,: VN1 low sensitivity ≤ 0.5, 0 ≤ average ≤ 1 VN1, and high VN1 ≥ 0.5.
Finally, the Archaeological and Artistic ties indicator was measured using a sensitivity index obtained from the limitations imposed in the area by national and EU regulations by
Fig. 6. Route E Biological and Naturalist Impact
International Journal for Traffic and Transport Engineering, 2012, 2(1): 44 – 59
56
means of the planning regulations in force and was represented by three fuzzy numbers: low sensitivity VN2 ≤ 0, 5, average 0 ≤ VN2≤ 1 and VN2 high ≥ 0.5.
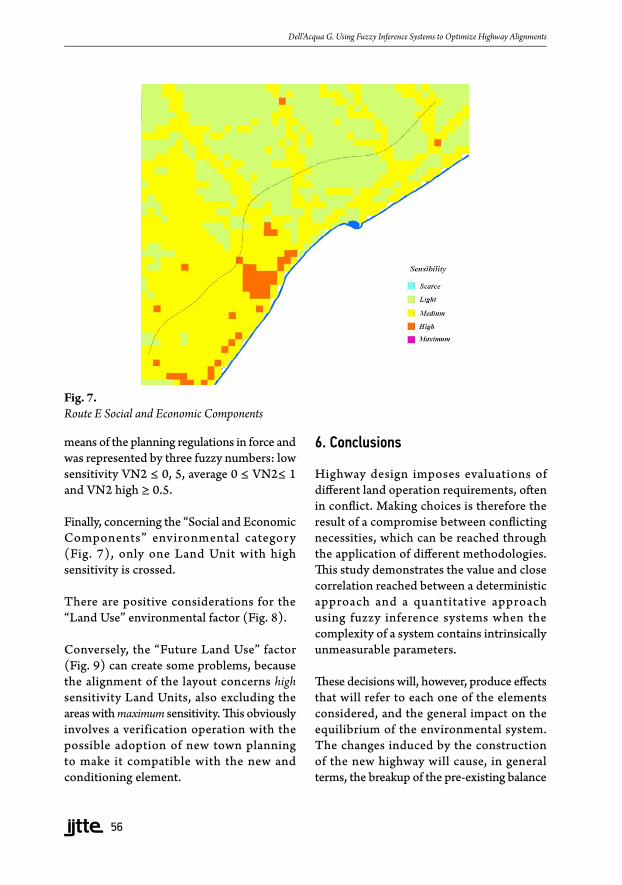
Finally, concerning the “Social and Economic Components” environmental category (Fig. 7), only one Land Unit with high sensitivity is crossed.
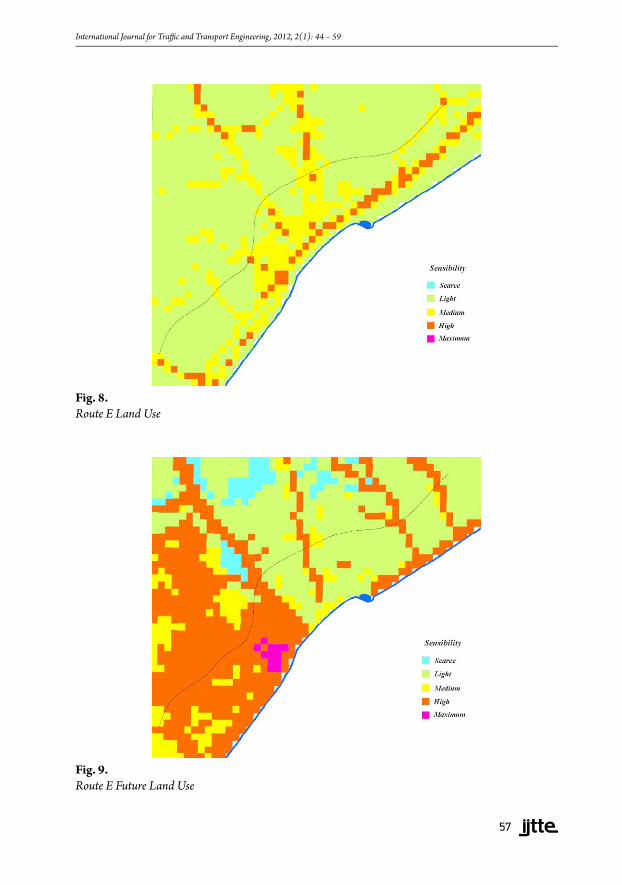
There are positive considerations for the “Land Use” environmental factor (Fig. 8).
Conversely, the “Future Land Use” factor (Fig. 9) can create some problems, because the alignment of the layout concerns high sensitivity Land Units, also excluding the areas with maximum sensitivity. This obviously involves a verification operation with the possible adoption of new town planning to make it compatible with the new and conditioning element.
6. Conclusions
Highway design imposes evaluations of different land operation requirements, often in conflict. Making choices is therefore the result of a compromise between conflicting necessities, which can be reached through the application of different methodologies. This study demonstrates the value and close correlation reached between a deterministic approach and a quantitative approach using fuzzy inference systems when the complexity of a system contains intrinsically unmeasurable parameters.
These decisions will, however, produce effects that will refer to each one of the elements considered, and the general impact on the equilibrium of the environmental system. The changes induced by the construction of the new highway will cause, in general terms, the breakup of the pre-existing balance
Fig. 7. Route E Social and Economic Components
Dell’Acqua G. Using Fuzzy Inference Systems to Optimize Highway Alignments
57
Fig. 8. Route E Land Use
Fig. 9. Route E Future Land Use
International Journal for Traffic and Transport Engineering, 2012, 2(1): 44 – 59
58
and the creation of new and very different ones more consistent with the value of the infrastructure within the system, and more sensitive to the context. Prudence in selection means identifying corridors of least impact through an analysis of the sensitivity of the territory. Elements of environmental impact can be ordered hierarchically within the tree of environmental components, used to establish logical and functional links, and which allow coordinated evaluation.
The ultimate objective is the definition of criteria for the most complete evaluation possible of the hypotheses, thus giving the best design alternatives. This paper proposes a method for estimating the sensitivity of the territory for measuring the consequences, which each of the alternatives can have on the natural and human environment, as well as a procedure for the analysis, planning and environmental assessment of road infrastructures. This methodology affects the way new highways are constructed according to the tree of environmental components.
The proposed procedure is a system for the “global evaluation” of all the useful elements for an accurate sensitivity analysis of the territory. The elements are implemented separately with different levels of assessment: 1) the degree of vulnerability of the macro area in which the road infrastructure is to be situated, 2) the demands of homogenization, 3) the combination and comparison of different factors such as geomorphological aspects and landslide risk.
The use of techniques based on non-traditional logics shows itself to be particularly suitable for quantifying using linguistic variables. The use of the procedure has led to the identification, in this case study, of a lower impact corridor, suitable for highway design layout.
The proposed methodology is an algorithm, which implies making specific adaptations to the different case studies to mitigate the normalization effect of the degree of global sensitivity, which the overlap determines on the single Land Units. Back analysis, referred to in this paper, recommends the reiteration of the process in the real applications.
References
Colorini, A.; Laniado, E.; Muratori, S. 1999. Decision support systems for environmental impact assessment of transport infrastructures. Transportation Research Part D, No. 4. 1-11.
Corbett, M.; Gaviria, J. 2003. Integration of Comprehensive Environmental and Social Measures into Low-Volume Road Design for the Hills of Nepal. In Transportation Research Record: Journal of the Transportation Research Board, No. 1819. Transportation Research Board of the National Academies, Washington, D.C. 118-126.
Dell’Acqua, G.; Mauro, R.; Russo, F. 2011. Descriptors in Scenic Highway Analysis: a Test Study along Italian Road Corridors. International Journal for Traffic and Transport Engineering 1(2): 73-88.
Joumard, R.; Gudmundsson, H.; Folkeson, L. 2011. Framework for assessing indicators of environmental impacts in the transport sector. In Transportation Research Record: Journal of the Transportation Research Board. Transportation Research Board of the National Academies, Washington, D.C.
Mamdani, E. H.; Assilian, S. 1975. An experiment in linguistic synthesis with a fuzzy logic controller. International Journal of Man-Machine Studies 7(1): 1-13.
Manoj, K. Jha.; Schonfeld, P. 2000. Integrating Genetic Algorithms and Geographic Information System to Optimize Highway Alignments. In Transportation Research Record: Journal of the Transportation Research Board, No. 1719. Transportation Research Board of the National Academies, Washington, D.C. 233-240.
Dell’Acqua G. Using Fuzzy Inference Systems to Optimize Highway Alignments
59
Rooney, K.; Savage, K.; Rue, H.; Toth, G.; Venner, M. 2010. Corridor Approaches to Integrating Transportation and Land Use. In Transportation Research Record: Journal of the Transportation Research Board, No. 2176. Transportation Research Board of the National Academies, Washington, D.C. 42-49.
Willetts, R.; Burdon, J.; Glass, J.; Frost, M. 2010. Environmental and Sustainability Impact Assessment of Infrastructure in the United Kingdom. In Transportation Research Record: Journal of the Transportation Research Board, No. 2158. Transportation Research Board of the National Academies, Washington, D.C. 143-150.
Zhao, T.; Sundararajan, S. K.; Tseng, C. 2004. Highway development Decision-Making under Uncertainty: A Real Options Approach. Journal of Infrastructure Systems 10(1): 23-32.
OPTIMIZACIJA PUTNE TRASE AUTOPUTA PRIMENOM FAZI LOGIČKIH SISTEMAGianluca Dell’Acqua
Sažetak: Osnovni cilj ovog istraživanja jeste da istraži inovacije na polju integrisanja infrastrukture i prostornog planiranja u pogledu saobraćajnih koridora. Imajući u vidu ekološke uticaje, izbor transportnih ruta je neophodno bazirati na postojećim i trenutnim uslovima. U cilju rešavanja ovih problema, koriste se metode višekriterijumske analize, međutim one ne daju objektivan pristup u kvantitativnoj oceni parametara koji često imaju nemerljiv značaj. Primena fazi logike je posebno efikasna kod kompleksnih sistema. Tokom izrade idejnog projekta, višekriterijumska analiza zasnovana na fazi logici omogućava kompletnije rezultate od onih zasnovanih na principu Cost Benefit analize. U ovom radu, u cilju višekriterijumskog odlučivanja razmatrano je više alternativa zasnovanih na inženjerskim, društvenim, ekološkim i ekonomskim faktorima. Prikazano istraživanje predstavlja opšti metod za analizu različitih studija slučaja. Prikazani metod se može koristiti u cilju izbora trase autoputa u pogledu zaštite životne sredine.
Ključne reči: fazi logika, alternative trase autoputa, ekološki faktori, stanje zemljišta.
International Journal for Traffic and Transport Engineering, 2012, 2(1): 44 – 59