using functions in models and decision making: cyclical ... · using functions in models and...
TRANSCRIPT
Student: Class: Date:
Using Functions in Models and Decision Making: Cyclical Functions V.B Student Activity Sheet 4: Length of Daylight
Charles A. Dana Center at The University of Texas at Austin
Advanced Mathematical Decision Making (2010) Activity Sheet 4, 18 pages
16
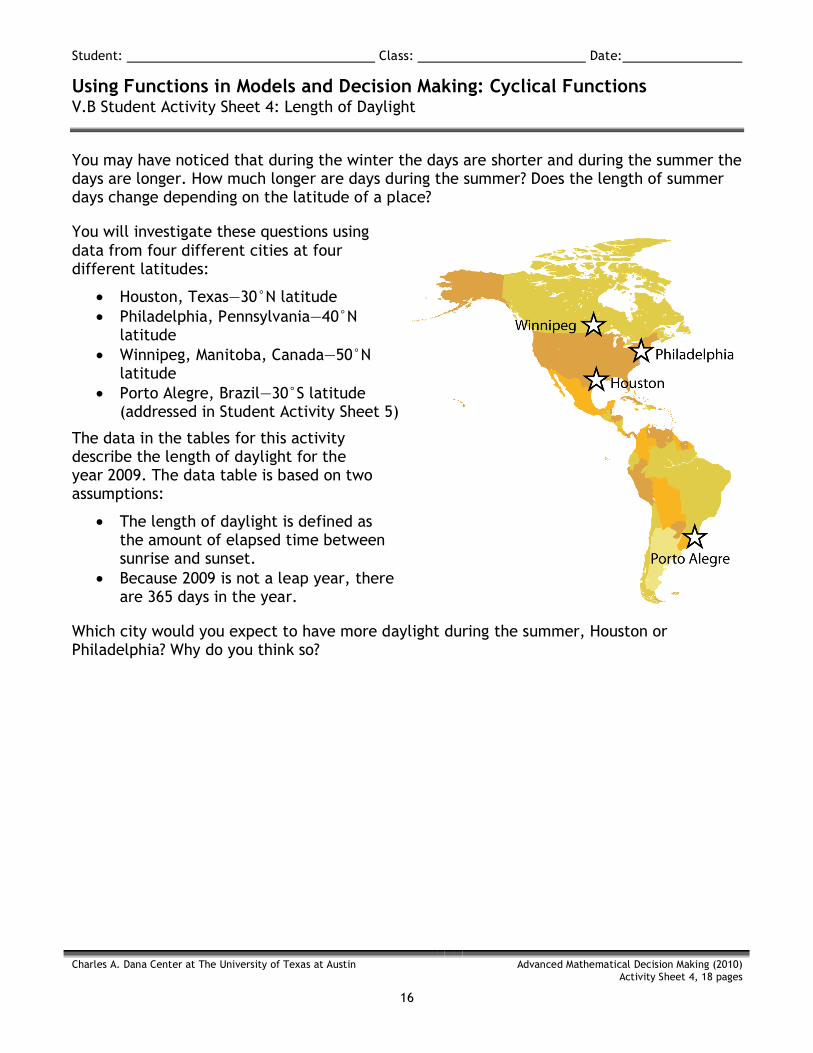
You may have noticed that during the winter the days are shorter and during the summer the days are longer. How much longer are days during the summer? Does the length of summer days change depending on the latitude of a place?
You will investigate these questions using data from four different cities at four different latitudes:
• Houston, Texas—30°N latitude • Philadelphia, Pennsylvania—40°N
latitude • Winnipeg, Manitoba, Canada—50°N
latitude • Porto Alegre, Brazil—30°S latitude
(addressed in Student Activity Sheet 5)
The data in the tables for this activity describe the length of daylight for the year 2009. The data table is based on two assumptions:
• The length of daylight is defined as the amount of elapsed time between sunrise and sunset.
• Because 2009 is not a leap year, there are 365 days in the year.
Which city would you expect to have more daylight during the summer, Houston or Philadelphia? Why do you think so?

Student: Class: Date:
Using Functions in Models and Decision Making: Cyclical Functions V.B Student Activity Sheet 4: Length of Daylight
Charles A. Dana Center at The University of Texas at Austin
Advanced Mathematical Decision Making (2010) Activity Sheet 4, 18 pages
17
Part A: Houston
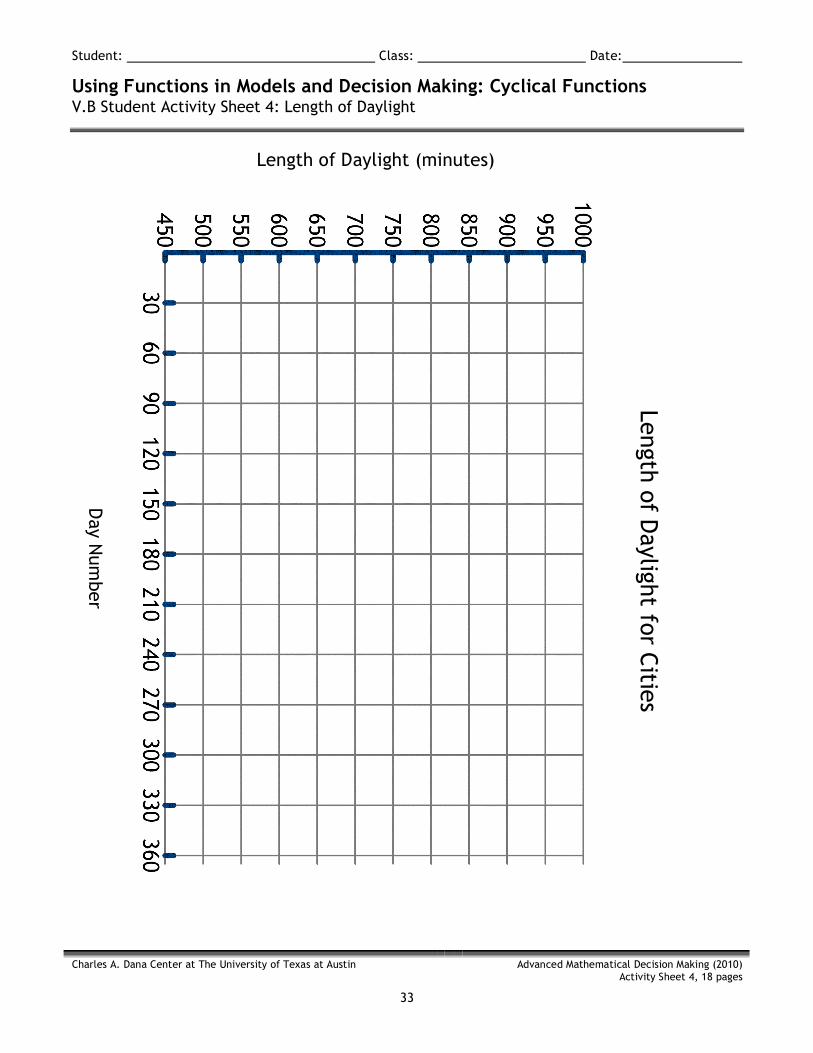
1. Make a scatterplot of the length of daylight by day number for Houston on the blank grid provided at the end of this activity sheet (Length of Daylight for Cities). To make the graph easier, make January 1 = Day 1 and December 31 = Day 365. In addition, graph the length of daylight in terms of minutes.
2. Enter the data into the stat lists of your graphing calculator. Use the calculator to make a scatterplot of the length of daylight by day number for Houston. Sketch your graph and describe your axes and scaling.
Houston Date Day
Number HH:MM Min.
Jan. 1 1 10:17 617
Feb. 1 32 10:48 648
March 1 60 11:34 694
Apr. 1 91 12:29 749
May 1 121 13:20 800
June 1 152 13:57 837
July 1 182 14:01 841
Aug. 1 213 13:33 813
Sept. 1 244 12:45 765
Oct. 1 274 11:52 712
Nov. 1 305 11:00 660
Dec. 1 335 10:23 623
Source: U.S. Naval Observatory, www.usno.navy.mil

Student: Class: Date:
Using Functions in Models and Decision Making: Cyclical Functions V.B Student Activity Sheet 4: Length of Daylight
Charles A. Dana Center at The University of Texas at Austin
Advanced Mathematical Decision Making (2010) Activity Sheet 4, 18 pages
18
3. Use your calculator to generate a sinusoidal regression model. Record the equation (round values to the nearest hundredth) in the Summary Table at the end of this activity sheet. Factor the value of b from the quantity (bx – c) and include that form of the equation as well.
4. Graph your model over your scatterplot. How well does the model fit your data?
5. Connect the points on your paper scatterplot with a smooth curve to represent the regression model.
6. Use your calculator to determine the maximum and minimum values for the length of daylight by day in Houston. Record these ordered pairs in your Summary Table and label them on your scatterplot. To which dates do these values correspond?

Student: Class: Date:
Using Functions in Models and Decision Making: Cyclical Functions V.B Student Activity Sheet 4: Length of Daylight
Charles A. Dana Center at The University of Texas at Austin
Advanced Mathematical Decision Making (2010) Activity Sheet 4, 18 pages
19
Part B: Philadelphia
1. Make a scatterplot of the length of daylight by day number for Philadelphia. Plot the points on the same grid that you used for the Houston scatterplot.
2. Enter the data for Philadelphia into a third list and graph the scatterplots for Houston
and Philadelphia on the same screen. Sketch your graph and describe your axes and scaling.
Philadelphia Date Day
Number HH:MM Min.
Jan. 1 1 9:23 563
Feb. 1 32 10:11 611
March 1 60 11:19 679
Apr. 1 91 12:41 761
May 1 121 13:56 836
June 1 152 14:46 886
July 1 182 14:57 897
Aug. 1 213 14:15 855
Sept. 1 244 13:03 783
Oct. 1 274 11:46 706
Nov. 1 305 10:28 628
Dec. 1 335 9:33 573
Source: U.S. Naval Observatory, www.usno.navy.mil

Student: Class: Date:
Using Functions in Models and Decision Making: Cyclical Functions V.B Student Activity Sheet 4: Length of Daylight
Charles A. Dana Center at The University of Texas at Austin
Advanced Mathematical Decision Making (2010) Activity Sheet 4, 18 pages
20
3. Use your calculator to generate a sinusoidal regression model for the Philadelphia data. Record the equation (round values to the nearest hundredth) on the Summary Table. Factor the value of b from the quantity (bx – c) and include that form of the equation as well. Graph your model over your scatterplot. How well does the model fit your data?
4. Connect the points on your paper scatterplot with a smooth curve to represent the regression model for Philadelphia.
5. How do the regression models compare for Houston and Philadelphia?
Similarities:
Differences:

Student: Class: Date:
Using Functions in Models and Decision Making: Cyclical Functions V.B Student Activity Sheet 4: Length of Daylight
Charles A. Dana Center at The University of Texas at Austin
Advanced Mathematical Decision Making (2010) Activity Sheet 4, 18 pages
21
6. Use your calculator or graph to determine the maximum and minimum values for the length of daylight in Philadelphia. Record these ordered pairs in the Summary Table and label them on your paper scatterplot. To which dates do these values correspond?
7. How does the maximum length of daylight for Philadelphia compare to the maximum length of daylight for Houston?
8. REFLECTION: How does your answer to Question 7 compare to the prediction you made
at the beginning of this activity?

Student: Class: Date:
Using Functions in Models and Decision Making: Cyclical Functions V.B Student Activity Sheet 4: Length of Daylight
Charles A. Dana Center at The University of Texas at Austin
Advanced Mathematical Decision Making (2010) Activity Sheet 4, 18 pages
22
9. Determine the intersection points of the regression models for Houston and Philadelphia. Record these ordered pairs in the Summary Table and label them on your scatterplot.
10. What do the intersection points mean in the context of this situation? Hint: Recall that your scatterplot shows the ordered pairs (Day Number, Length of Daylight) for Houston and Philadelphia.
11. REFLECTION: When is there more daylight in Houston than in Philadelphia? Is this what you expected? Why or why not?
When is there less daylight in Houston than in Philadelphia? Is this what you expected? Why or why not?
Student: Class: Date:
Using Functions in Models and Decision Making: Cyclical Functions V.B Student Activity Sheet 4: Length of Daylight
Charles A. Dana Center at The University of Texas at Austin
Advanced Mathematical Decision Making (2010) Activity Sheet 4, 18 pages
23
12. What is the difference in latitude between Houston and Philadelphia?
13. What is the difference in latitude between Philadelphia and Winnipeg?
14. What would you expect a scatterplot of length of daylight by day number for Winnipeg to look like? Why?

Student: Class: Date:
Using Functions in Models and Decision Making: Cyclical Functions V.B Student Activity Sheet 4: Length of Daylight
Charles A. Dana Center at The University of Texas at Austin
Advanced Mathematical Decision Making (2010) Activity Sheet 4, 18 pages
24
Part C: Winnipeg
1. Make a scatterplot of the length of daylight by day for Winnipeg. Plot the points on the same grid that you used for the other two scatterplots.
2. Enter the data for Winnipeg into a fourth list and graph all three scatterplots on the
same screen. Sketch your graph and describe your axes and scaling.
Winnipeg Date Day
Number HH:MM Min.
Jan. 1 1 8:12 492
Feb. 1 32 9:23 563
March 1 60 11:01 661
Apr. 1 91 12:56 776
May 1 121 14:43 883
June 1 152 16:04 964
July 1 182 16:15 975
Aug. 1 213 15:11 911
Sept. 1 244 13:28 808
Oct. 1 274 11:37 697
Nov. 1 305 9:46 586
Dec. 1 335 8:25 505
Source: U.S. Naval Observatory, www.usno.navy.mil

Student: Class: Date:
Using Functions in Models and Decision Making: Cyclical Functions V.B Student Activity Sheet 4: Length of Daylight
Charles A. Dana Center at The University of Texas at Austin
Advanced Mathematical Decision Making (2010) Activity Sheet 4, 18 pages
25
3. Use your calculator to generate a sinusoidal regression model for the Winnipeg data. Record the equation in your Summary Table (round values to the nearest hundredth). Factor the value of b from the quantity (bx – c) and include that form of the equation as well. Graph your model over your scatterplot. How well does the model fit your data?
4. Connect the points on your paper scatterplot with a smooth curve to represent the regression model for Winnipeg.
5. How do the regression models compare for all three cities?
Similarities:
Differences:

Student: Class: Date:
Using Functions in Models and Decision Making: Cyclical Functions V.B Student Activity Sheet 4: Length of Daylight
Charles A. Dana Center at The University of Texas at Austin
Advanced Mathematical Decision Making (2010) Activity Sheet 4, 18 pages
26
6. Use your calculator to determine the maximum and minimum values for the length of daylight in Winnipeg. Record these ordered pairs in your Summary Table and label them on the paper scatterplot. To which dates do these values correspond?
7. Use your scatterplot to compare the points of intersection for all three graphs. What do they mean in the context of this situation?
8. The town of Seward, Alaska, is at 60°N latitude, just south of Anchorage, Alaska. What
would you expect the length of daylight during the summer months to be in Seward compared to Winnipeg? The winter months?
Student: Class: Date:
Using Functions in Models and Decision Making: Cyclical Functions V.B Student Activity Sheet 4: Length of Daylight
Charles A. Dana Center at The University of Texas at Austin
Advanced Mathematical Decision Making (2010) Activity Sheet 4, 18 pages
27
9. What relationship do you think there is between a city’s latitude and the amount of daylight it receives throughout the year?
10. REFLECTION: Describe how this application of sinusoidal regression and latitude as
related to length of daylight is similar to the model of the Singapore Flyer. Compare and contrast the two situations with regard to similarities and differences of the model, scatterplot(s), and the functional relationship.

Student: Class: Date:
Using Functions in Models and Decision Making: Cyclical Functions V.B Student Activity Sheet 4: Length of Daylight
Charles A. Dana Center at The University of Texas at Austin
Advanced Mathematical Decision Making (2010) Activity Sheet 4, 18 pages
28
Part D: Connections to Sinusoidal Functions
The parent function y = sin(x) can be transformed using four parameters. Each parameter describes a certain characteristic of the graph.
y = Asin[B(x – C)] + D
• A represents the amplitude of the graph. The amplitude is the vertical distance from the horizontal axis of the graph to the maximum value or the minimum value of the graph. The amplitude is also equal to half of the difference between the maximum and minimum values.
• B represents the angular frequency of the graph. The angular frequency describes how many crests or troughs of the graph are present within a 360°or 2π portion of the domain of the graph. The angular frequency is also found by dividing 2π by the period, which is the horizontal distance between two consecutive maximum or minimum values.
• C represents the phase shift, or horizontal translation of a sine function. • D represents a vertical translation of the graph. The line y = D is the equation of the
sinusoidal axis, which is the horizontal line representing the distance that is midway between the crests and troughs of the graph.
1. Look at the Houston row on the Summary Table. Subtract the maximum value of daylight from the minimum value of daylight, and then divide the difference by 2. How does this value compare to the amplitude (A) in the regression model?
2. Repeat the process of subtraction and division from Question 1 for Philadelphia and Winnipeg. What does this value suggest about the relationship between the maximum/minimum values and the amplitude for all three cities?

Student: Class: Date:
Using Functions in Models and Decision Making: Cyclical Functions V.B Student Activity Sheet 4: Length of Daylight
Charles A. Dana Center at The University of Texas at Austin
Advanced Mathematical Decision Making (2010) Activity Sheet 4, 18 pages
29
3. Divide 2π by the number of days in a year. How does the result compare to the angular frequency (B) for all three cities?
4. If the period of a sine function is the number of units before the cycle begins to repeat, why would the period of the regression model include a quotient with the number of days in a year?
5. How does the value for C (phase shift) in the factored form of your regression equations compare to the x-coordinate of the first intersection points?

Student: Class: Date:
Using Functions in Models and Decision Making: Cyclical Functions V.B Student Activity Sheet 4: Length of Daylight
Charles A. Dana Center at The University of Texas at Austin
Advanced Mathematical Decision Making (2010) Activity Sheet 4, 18 pages
30
6. How many minutes are there in 12 hours? Why would the vertical translation (D) be a number that is close to this value?
7. Why did the values of B, C, and D remain close to the same for the regression models for all three cities? Why did the value of A change for the models?
Student: Class: Date:
Using Functions in Models and Decision Making: Cyclical Functions V.B Student Activity Sheet 4: Length of Daylight
Charles A. Dana Center at The University of Texas at Austin
Advanced Mathematical Decision Making (2010) Activity Sheet 4, 18 pages
31
8. EXTENSION: Sun path diagrams show the path of the sun as it travels across the sky from sunrise to sunset at a given point on the surface of Earth. Because the sun’s path varies each day, a sun path diagram reveals the part of the sky where the sun would be located for an observer on the ground at that point.
Investigate cities at other latitudes, including those closer to the poles and the equator. Prepare a short presentation for the class.
Some cities whose data can be obtained via the Internet (www.gaisma.com) include the following:
• 80°N: Longyearbyen, Norway (78°N) • 70°N: Barrow, Alaska (71°N) • 60°N: Seward, Alaska; St. Petersburg, Russia; Anchorage, Alaska (61°N) • 20°N: Guadalajara, Mexico; Mexico City (19°N); Honolulu, Hawaii (21°N) • 10°N: Caracas, Venezuela; San Jose, Costa Rica • 0°: Quito, Ecuador; Kampala, Uganda; Pontianak, Indonesia • 10°S: Rio Branco, Brazil; Lima, Perú • 20°S: Belo Horizonte, Brazil; Port Hedland, Australia • 30°S: Durban, South Africa; Perth, Australia • 40°S: Valdivia, Chile; San Carlos de Bariloche, Argentina • 50°S: Stanley, Falkland Islands • 60°S: Villa Las Estrellas, Chilean Antarctic Territory

Student: Class: Date:
Using Functions in Models and Decision Making: Cyclical Functions V.B Student Activity Sheet 4: Length of Daylight
Charles A. Dana Center at The University of Texas at Austin
Advanced Mathematical Decision Making (2010) Activity Sheet 4, 18 pages
32
Summary Table for Length of Daylight
City Regression Model Maximum Minimum First Intersection
Second Intersection
Hou
ston
Calculator form:
Factored B:
Ordered pair:
Date:
Length of day:
Ordered pair:
Date:
Length of day:
Phila
delp
hia
Calculator form:
Factored B:
Ordered pair:
Date:
Length of day:
Ordered pair:
Date:
Length of day:
Ordered pair:
Date:
Length of day:
Ordered pair:
Date:
Length of day:
Win
nipe
g
Calculator form:
Factored B:
Ordered pair:
Date:
Length of day:
Ordered pair:
Date:
Length of day:
Ordered pair:
Date:
Length of day:
Ordered pair:
Date:
Length of day:
Port
o A
legr
e
Calculator form:
Factored B:
Ordered pair:
Date:
Length of day:
Ordered pair:
Date:
Length of day:
Ordered pair:
Date:
Length of day:
Ordered pair:
Date:
Length of day:
Student: Class: Date:
Using Functions in Models and Decision Making: Cyclical Functions V.B Student Activity Sheet 4: Length of Daylight
Charles A. Dana Center at The University of Texas at Austin
Advanced Mathematical Decision Making (2010) Activity Sheet 4, 18 pages
33
Length of Daylight (minutes)
Day N
umber
Length of Daylight for Cities