using expert models in human reliability analysis - a
TRANSCRIPT

HAL Id: hal-00610494https://hal-supelec.archives-ouvertes.fr/hal-00610494
Submitted on 26 Jul 2012
HAL is a multi-disciplinary open accessarchive for the deposit and dissemination of sci-entific research documents, whether they are pub-lished or not. The documents may come fromteaching and research institutions in France orabroad, or from public or private research centers.
L’archive ouverte pluridisciplinaire HAL, estdestinée au dépôt et à la diffusion de documentsscientifiques de niveau recherche, publiés ou non,émanant des établissements d’enseignement et derecherche français ou étrangers, des laboratoirespublics ou privés.
Using Expert Models in Human Reliability Analysis - ADependence Assessment Method Based on Fuzzy Logic
L. Podofillini, V.N. Dang, Enrico Zio, Piero Baraldi, Massimo Librizzi
To cite this version:L. Podofillini, V.N. Dang, Enrico Zio, Piero Baraldi, Massimo Librizzi. Using Expert Models in HumanReliability Analysis - A Dependence Assessment Method Based on Fuzzy Logic. Risk Analysis, Wiley,2010, 30 (8), pp.1277-1297. �10.1111/j.1539-6924.2010.01425.x�. �hal-00610494�
1
USING EXPERT MODELS IN HUMAN RELIABILITY ANALYSIS
– A DEPENDENCE ASSESSMENT METHOD BASED
ON FUZZY LOGIC
L. Podofillini, V.N. Dang, E. Zio, P. Baraldi, M. Librizzi
Abstract In Human Reliability Analysis (HRA), dependence analysis refers to assessing the
influence of the failure of the operators to perform one task on the failure probabilities
of subsequent tasks. A commonly used approach is the Technique for Human Error
Rate Prediction (THERP). The assessment of the dependence level in THERP is a highly
subjective judgment based on general rules for the influen ce of five main factors. A
frequently used alternative method extends the THERP model with decision trees.
Such trees should increase the repeatability of the assessments but they simplify the
relationships among the factors and the dependence level. Moreover, the basis for
these simplifications and the resulting tree is d ifficult to trace. The aim of this work is a
method for dependence assessment in HRA that captures the rules used by experts to
assess dependence levels and incorporates this knowledge into an algorithm and
software tool to be used by HRA analysts. A Fuzzy Expert System (FES) underlies the
method. The method and the associated expert elicitation process are demonstrated
with a working model. The expert rules are elicited systematically and converted into a
traceable, explicit, and computable model. Anchor situations are provided as guidance
for the HRA analyst’s judgment of the input factors. The expert model and the FES-
based dependence assessment method make the expert rules accessible to the analyst
in a usable and repeatable means, with an explicit and traceable basis.
Keywords: human reliability analysis; human action dependence; expert
judgment; fuzzy expert system; expert elicitation.
Acronyms / Abbreviations
DT – decision tree FES – fuzzy expert system
FL – fuzzy logic HFE – human failure events
HRA – Human Reliability Analysis MF – membership function
PSA – Probabilistic Safety Assessment THERP – Technique for Human Error Rate
Prediction

2
1 Introduction Expert judgment is required in many areas of risk analysis, where the relevant factors
and their relationships are complex and the data are insufficient as a basis for either a
statistical estimate or for constructing an empirical model with which estimates may be
obtained . Two ways of using expert judgment can be distinguished. The first way
relates to collecting and aggregating the judgment of experts on the variables of
interest, e.g. a failure probability or a seismic hazard curve (e.g. Cooke, 1991). Formal
approaches for this exist, which are very useful to bring out the assumptions and
reasoning underlying the judgments and to document them so that they can be
appraised by others (Cooke, 1991; O’Hagan et al., 2006). However, some disadvantages
are the cost and time they require and the potential presence of biases in the expert
estimates (for a complete d iscussion see: Otway & von Winterfeld t, 1992). A second
way of using expert judgment is based on collecting information from experts to build
a computable model (called the expert model) with which the desired value may be
obtained . Examples include the computerized diagnostic aids used in nuclear p ower
plants, e.g. Chang et al. (1995), and clinical decision support systems used in medicine,
e.g. Kawamoto et al. (2005).
The work reported here addresses an application of expert judgment in HRA, the part
of PSAs that deals with human performance and its impact on risk. In HRA,
dependence analysis refers to assessing the influence of the failure of the operators to
perform one task on the failure probabilities of subsequent tasks (Swain & Guttman,
1983). In qualitative terms, a dependence is said to exist between two tasks, that is two
Human Failure Events (HFEs) if the failure of the second HFE is more likely given that
the operators have failed in their performance of the first HFE than following success
of the first HFE.
The assessment of dependence has a significant impact on the overall results of a PSA,
since the dependent failure probability may be an order of magnitude or more larger
than the independent one. An appropriate assessment of dependence is thus essential
to avoid underestimation of the risk and to ensure a realistic risk profile from the PSA
results. In identifying the HFEs for which dependence should be considered , i.e. the
scenarios in which multiple HFEs appear, a common practice is to use large screening
probabilities for the HFEs. If the probabilities estimated without accounting for
dependence are used , the relevant sequences (with multiple HFEs) may be truncated.
A quantification of the scenarios without consideration of dependencies may miss
candidates for potential dependencies (NUREG-1792, 2005).

3
The development of an expert model for HRA dependence assessment and an
assessment method based on this model is aimed at increasing the repeatability of
these assessments. The expert model can systematically and transparently represent
the assumptions and rules underlying the assessment ; at the same time, it can
represent relatively complex assessment rules that account for the interactions among
the input factors. The attractiveness of a method based on an expert model is that it
makes the expert knowledge and rules accessible to an HRA analyst. Since dependence
assessments are needed within each HRA (each PSA study), such a method can
circumvent the need to convene an expert or experts in a formal elicitation for each
study.
This work focuses on dependencies among post-initiator HFEs. In current PSAs, the
dependence model from the Technique for Human Error Rate Prediction (THERP)
HRA method (Swain & Guttman, 1983) is commonly used . It has two parts: a
qualitative assessment of a dependence level, ranging in d iscrete steps from zero
(independent tasks or actions) to com plete dependence, and the quantification of the
impact of the assessed dependence level on the conditional probability of the
subsequent task based on a set of formulas. The THERP model refers to five main
factors: spatial relatedness, time relationship , functional relatedness, stress, and the
similarities among the personnel performing the tasks. While the THERP dependence
model provides general guidelines for the influence of these factors on the dependence
level (cf. Table 10-1 in Swain & Guttman, 1983), the assignment of the level is
essentially a direct expert judgment, a highly subjective process that can be weak in
terms of transparency and repeatibility. The ASME Standard for Probabilistic Risk
Assessment notes that ―the state of the art in HRA is such that the assessment of
dependency is largely based on the analyst’s judgement.‖ (Note (1) to HR-G7, ASME,
2005).
To address these issues and reduce the subjectivity inherent in judging the dependence
level d irectly, the assignment of the dependence level is frequently supported with
decision trees (DTs), for instance, in the SPAR-H (Gertman et al., 2005) method, in the
EPRI HRA ―calculator‖(Julius et al., 2005), as well as in the recently presented method
DEPEND-HRA (Cepin, 2006, 2008a, 2008b). However, the decision tree representation
frequently very much simplifies the relationships among the input factors and the
dependence level. In addition, the basis for the decision tree is d ifficult to trace. It
should be noted that although the mentioned methods have been specifically
developed for nuclear power plants applications, human failure dependence
assessment is an important part of the HRA for any technical system (Kennedy et al.,
2007).

4
Current practice has a number of weaknesses. The absence of specific guidance makes
the use of the THERP dependence method d ifficult and the results may lack
traceability and repeatability. This also makes the review of the assessment by a second
person d ifficult (e.g. in peer or regulatory reviews). The use of DTs improves the
situation: the analyst has to give judgments on the input factors, but is not required to
draw conclusions on the dependence level, which the DT yields. The central idea is
that the input factors should be less subjective quantities than the dependence level
(optimally, they should be ―measurable‖). Yet, DTs are not flexible in the sense that the
analyst judgments are typically constrained to rigid options, which refer to extreme
situations (Yes/ No, High/ Low). Moving away from binary options also increases the
number of branches and the combinations of factors to evaluate. Moreover, d ifferent
implementations of DTs exist, which may produce significantly d ifferent results
(Cepin, 2008c): since DTs are often not built from a traceable process of expert
elicitation, it is difficult to understand the reasons if two DTs give d ifferent results.
Section 2 d iscusses these shortcomings in more detail.
Note that another recent subject of research related to dependence assessment is on
how dependent HFEs should be incorporated in large system fault tree analysis
(Vaurio, 2000). This subject relates to dependencies among pre-initiator HFEs and a
more detailed d iscussion is outside the scope of the present paper . Also related to
dependence assessment is the idea of the existence of human performance limiting
values (HPLV) (Kirwan, 2008). It may be the case that accident sequences have very
low joint human error probability (e.g. 10-4 or 10-5), even after dependence is evaluated:
the idea is that HPLV should be applied to include for possibly overlooked error
mechanisms or error-inducing conditions.
The aim of this work is a method for dependence assessment in HRA that captures the
rules used by experts to assess dependence levels and incorporates this knowledge into
an algorithm and software tool to be used by HRA analysts. The Fuzzy Expert System
(FES) formalism underlies the method. A FES collects the experts’ knowledge as a set
of Fuzzy Logic (FL) rules that are mathematically manipulated by Fuzzy Set theory
(Zadeh, 1965). Fuzzy set theory has been exploited for HRA in a number of
applications (Terano et al., 1983; Onisawa, 1988a, 1988b; Liang & Wang, 1993; Kim &
Bishu, 1996; Suresh et al., 1996; Huang et al., 1996; Richei et al., 2001; Konstandinidou et
al., 2006; Marseguerra et al., 2006). In most of these, the focus is on using FL to convert
human error context descriptions into inputs for existing HRA methods, with the aim
of accounting for ambiguity and subjectivity of the descriptions. For example, in
Konstandinidou et al. (2006) and Marseguerra et al. (2006), fuzzy logic is applied to

5
compute HEPs via the CREAM method, by converting the characterization of the
performance shaping factors into fuzzy numbers. Only in Richei et al. (2001) is the
problem of build ing a FES from the expert knowledge also addressed .
At this stage, the focus of the work has been to investigate the suitability and
practicality of the FES representation for an HRA dependence assessment method for
post-initiator HFEs. This paper presents the basic concepts of the proposed method
and demonstrates the approach using a working model of the dependence
relationships. The working model is intended to represent a set of moderately complex
relationships among the input factors and the dependence level, which could be
expected from an expert elicitation. These relationships represent one possible
interpretation of the THERP dependence guidelines, but one with more detail. It
admitted ly does not include all relevant factors but its complexity is sufficient for the
purpose of demonstrating the methodology. The details of the FES model are reported
in a companion paper (Zio et al., 2009).
To illustrate its use, the FES-based has been applied for dependence assessment of a
pair of operator actions in response to an accident scenario in a Boiling Water Reactor.
The FES-based method for assessing dependence has the advantage of being able to
represent fully the experts’ rules (in this case, the rules of the working model),
including rules for the interaction of the dependence (input) factors. With anchor
situations provided as guidance for the HRA analyst’s judgment of the input factors,
the method yields the dependence level based on the expert rules. An expert elicitation
to obtain a comprehensive set of rules to replace the working model is planned for
future work.
The paper is organized as follows. Section 2 gives an overview of the problem of
dependence assessment, of the current practice and limitations. Section 3 presents the
features of the proposed dependence assessment method . The approach for building
the underlying FES-based model is presented in Section 4. Section 5 presents an
application of the method . Section 6 d iscusses traceability, repeatability, verification
and valid ity issues.
2 Dependence assessment in HRA: practice and limitations
2.1 The dependence assessment method in THERP
The dependence assessment method in the THERP HRA method (Swain & Guttman,
1983) is one of the most widely used in the PSA practice. Referred to as the ―THERP

6
method‖ in this paper, this dependence assessment method has the following main
components:
Use of conditional human error probabilities (HEPs) to model the effect of
dependence: the THERP approach amounts to evaluate the probability of
failure of one task, when it is known that the previous task has failed .
Discretization of the conditional HEP into five ranges representing different
levels of dependence: zero, low, moderate, high, complete.
A formula for computing the dependent, conditional p robability for each
dependence level. For a low level of dependence, the formula produces for low
values of the independent HEP (i.e. <0.01) a nominal conditional probability
value of 0.05 with lower and upper bounds of 0.015 and 0.15, respectively.
Guidelines for assessing the level of dependence (summarized in Table 10-1 of
Swain & Guttman (1983)).
The user of the method must analyze the pair of successive tasks and assess the level of
dependence. To support the analysis of the tasks dependence, the THERP guidelines
suggest the factors that should be considered (THERP Table 10-1 of Swain & Guttman
(1983)): closeness in time and space, functional relatedness (e.g. tasks related to the
same subsystem), stress, similarity of the performers (status, training, responsibility,
and „many social and psychological factors―).
For example, for the factor closeness in time and space, the guideline reads (item 3 of
Table 10-1 of Swain & Guttman (1983)):
―Evaluate the spatial and time relationship among all events. Dependence
between any two events increases as the events occur closer in space and
time. For example, d isplays or controls that are physically close to each
other or that must be manipulated at about the same time have a higher
level of dependence than items that are widely separated either spatially or
as to the time of their manipulation.‖
These guidelines cannot be used systematically and consistently as a basis for assessing
the dependence level because a lot of room is left to interpretation. This makes the
assessment a rather d ifficult task, requiring a considerable amount of expert judgment,
which may lack transparency and traceability and leads to low repeatability of the
results. Another problem with the d irect elicitation of probability is the presence of
biases, of many types (Cooke, 1991; Otway, H. & von Winterfeld t, D., 1992).

7
2.2 Supporting the THERP model with decision trees
The expert judgment assessment of the level of dependence is in practice often
supported with a decision tree (DT). In these cases, the quantitative impact of the
assessed dependence level is still modeled with the THERP dependence assessment
method.
Repeatability should improve when expert judgment is structured and supported by a
DT. The analyst has to give judgments on the input factors, but is not required to draw
conclusions on the dependence level, which comes from the model. An example is
shown in Figure 1, which reports the SPAR-H DT for post-initiator HFEs (Gertman et
al., 2005). The input factors of the model are (Figure 1):
Crews (Same/ Different)
Time (Close in time/ Not close in time)
Location (Same/ Different)
Cues (Additional cues/ No additional cues).
Different implementations of DTs exist. Cepin (2008b) shows that this can lead to
significant d ifferences in the result of the HRA and in the evaluation of the risk
contributors. Since a traceable process of expert elicitation is often missing , it is d ifficult
to understand the reasons if two DTs give d ifferent results.
Another limitation is that DTs are not flexible and may not allow assessments to be
representative of the context under analysis. The need to avoid an excessive branching
of the tree usually limits the number of branches per factor to two to three values
(labels). These labels represent extreme Yes/ No conditions (see Figure 1 for example),
which may be d ifficult to match to a particular context. Indeed, there may be consensus
on considering a separation by 5 minutes as ―close in time‖ and one of hours as ―not
close in time‖. However, a separation of 20 minutes may be d ifficult to match to any of
the two options, thus requiring a more intermediate judgment that would better
represent the context.
INSERT Figure 1. The SPAR-H dependence decision tree
INSERT Table 1. The EPRI HRA Calculator ® dependence
decision tree (Grobbelaar et al., 2005).

8
3 Basic concepts of the dependence assessment method
Figure 2 shows a high-level overview of the dependence assessment method. The
underlying FES model and the expert elicitation process for its construction are
presented in the next Section 4. The mathematical details of the FES can be found in a
companion paper (Zio et al., 2009). The d ifferent components of the method are
described next.
INSERT Figure 2. Overview of the dependence model. Different
models are needed for pre-initiators, and different types of post-
initiators.
3.1 Input factors
Similarly to the DTs approach, each of the input factors is represented by a linguistic
variable, qualified in terms of linguistic labels (Figure 3). For example: input factor
―similarity of performers‖ may be qualified in terms of a linguistic variable with
linguistic labels: None - Low – Medium … - Very high. Unlike with DTs, the number of
linguistic labels for each input factor is higher than two, thus giving more flexibility to
the input judgments.
At the same time, the use of a higher number of linguistic labels may become a source
of variability in the inputs, so that concrete guidance is needed for the analyst
judgments. As shown in Figure 3, this is provided through anchor points that represent
prototype conditions of the input factors for a typology of tasks . Different dependence
models and thus d ifferent sets of anchors may be used for pre-initiators, different types
of post initiators, etc. The selection of the proper anchors and their characterization in
terms of the linguistic labels is one of the outputs of the expert elicitation process.
Note that numerous studies on expert judgment elicitation have shown that the use of
anchors may be counterproductive and bias the judgments if the underling scale is
continuous (see Brewer & Chapman, 2002 for an example, among many others, of a
paper d iscussing the anchor effect, and Stevens, 1946, for the definitions of the
measurement scales). However, in our case the anchors are essential because the scale
on which they are placed is very abstract for the analyst (what does high ―similarity of
cues‖ mean? or what does a similarity of performers of 0.33 mean?). Anchors therefore
are necessary to provide reference situations that can orient an analyst.

9
With respect to the context characterization, the analyst can provide judgments on the
input factors in d ifferent ways, for example on a scale (Figure 3). Four anchors are
shown in the figure: the analyst may provide a point inpu t on the scale (input 1), or
the range where his/ her belief belongs (input 2).
A feature of FES is that they allow overlapping of the linguistic labels (overlapping
horizontal bars in Figure 3) to represent the fact that in the common perception, the
transition between the linguistic concepts associated to the labels (e.g. between
―medium‖ and ―high‖) is not crisp, but often uncertain and ambiguous. This can be
formally accounted for by introducing overlapping fuzzy sets to represent the input
variables. Figure 4 shows a possible association of fuzzy sets and trapezoidal
membership functions. Note that the association is not shown to the analyst who
interfaces only with anchor points and linguistic labels.
Indeed, the natural scale for the input factors is continuous and the d iscretization
introduced by the overlapping labels is a simplification. Yet, this does not seem to be a
limitation. The five-level scale is actually attractive because experts and analysts are
already very familiar with it from the five THERP levels. Furthermore, as it will be
presented in the next Section 3.2, the basis of the fuzzy logic model is a set o f rules.
This is a concept with which experts and analysts should be already familiar with,
since rules (although much coarser) are at the basis of DTs as well.
Insert Figure 3. Analyst elicitation on anchored scale; two analyst
input types are shown: as a point value (arrow) and as an interval
(horizontal bar).
Insert Figure 4. Possible association of fuzzy sets and membership
functions (trapezoids) to the input qualitative variable.
3.2 The underlying model
The inference model represents the relations between the input factors and the
dependence level. This represents the expert knowledge, which in FES is modeled into
a set of rules capturing the relationships between the d ifferent values of the input and
output variables. An example rule reads as follows:
IF
―Factor 1‖ is ―Low‖ AND ―Factor 2‖ is ―Medium‖ AND … ―Factor N‖ is

10
―High‖
THEN
Dependence is ―High‖
The next Section presents the expert elicitation process to convert the expert
knowledge into fuzzy rules.
The input judgments of the analysts are converted into fuzzy numbers, which
represent the degree to which the judgments match each of the qualitative labels. The
fact that a judgment can match, with d ifferent degrees, multiple labels allows FES to
handle uncertain and ambiguous statements. Multiple rules are then activated , with a
degree that follows from the degree to which each input statement matches the labels
involved in the rule. The degree of activation of the rules is then the basis for the
derivation of the output of the model, which, as described in the next Section 3.3, is
represented by degrees of belief in the d ifferent dependence levels. The FL procedure
used in this work to associate the output of the model to a given input assessment is
based on the Mamdami fuzzy logic (Zio et al., 2009). Accordingly, the degree to which
an input assessment matches a label involved in a rule is computed as the maximum
value of the intersection of the input assessment and label fuzzy sets (Figure 5, left), the
degree of activation of a rule is computed as the minimum value of the degree to which
each input assessment matches the labels involved in the rules (Figure 5, right) and the
contribution to the output of a given rule is the minimum value between the rule
degree of activation and the fuzzy set in the rule output (Figure 5, right). Finally the
output fuzzy set is obtained by taking the union of all the involved rule output s.
Insert Figure 5. Left: example of computation of the degree to
which the Factor 1 input assessment matches the label “Low ” and
the Factor 2 input assessment the label “High” . Right:
computation of the degree of activation of the rule If “Factor 1” is
“Low” and “Factor 2” is “High” THEN “Dependence” is
“Medium” as minimum value between the degrees to which
Factor 1 and Factor 2 input assessments match the corresponding
labels in the rule.
3.3 Outputs
From the input factors describing the context of two successive actions with respect to
their failure dependence, the method produces two outputs. The first consists in the
degrees of belief (expressed in terms of possibility) for the d ifferent dependence levels.
The THERP dependence levels are used (None, Low, Medium, High, Complete). This
output shows how the analysts’ judgments translate into a possibilistic distribution of
the dependence levels.

11
The second type of output gives quantitative figures to the dependence level. This
output is the expected value of the conditional probability and its associated
uncertainty. These are the figures that are included into the PSA.
The operation that allows passing from the first type of output to the second is called
defuzzification (Zadeh, 1965) and, to be formalized , entails associating fuzzy sets and
degrees of membership to the levels of dependence.
In the method proposed in this paper, this is done by eliciting information from the
THERP handbook. In particular, Table 20-21 of (Swain & Guttman, 1983) suggests
nominal values and uncertainty bounds for the conditional probability associated to
each dependence level. A possible association of fuzzy sets to the THERP dependence
levels consists in taking membership functions with triangular shape in log10 scale
centered on the associated dependence level nominal values and with supports given
by the lower and upper confidence bounds, as reported in Figure 6.
Note that the presented method is still based on the five THERP dependence levels,
although a finer characterization of the dependence level could have been obtained
with more levels or by adopting a continuous dependence scale (for example, using
Bayesian belief nets). However, it was decided to use the THERP dependence levels
and the THERP relationships between the levels and the conditional HEPs because
these are familiar to experts and analysts. This is an important point for the acceptance
of the method.
Insert Figure 6. Fuzzy sets and membership functions associated
to the THERP dependence levels. Elicited from THERP guidelines
(Swain & Guttman, 1983).
4 Building the dependence model: example on a working model
The concepts of the elicitation process are here illustrated on a working model of
dependence, applicable for post-initiator HFEs of a nuclear power plant for full-power
scenarios. The actual expert elicitation exercise will be performed in subsequent work.
The information that needs to be provided by the expert is:
The important factor relevant to dependence and how they relate
Selection and positioning of the anchors

12
Impact of the factors on the dependence level
4.1 Determining input factors and anchors
The first information to elicit from the expert concerns the important factors for
dependence and how they relate. An influence diagram like the one in Figure 7 is the
result: it shows the working model used to explore the methodology.
Table 2 lists the input factors, the qualitative labels and the anchor points used in the
working model. The expert has to locate the anchors on the input scale, so as to build
the input interface of Figure 3.
According to the working model, three factors d irectly impact the dependence level
(Figure 7): ―closeness in time‖, ―task relatedness‖ and ―similarity of performers‖.
―Tasks relatedness‖ is further specified in terms of the ―similarity of cues‖ and
―similarity of functions/ goals‖ , as Figure 7 shows. These factors include most, but not
all, of the relevant factors. For example, the use of the same procedures may also have
influence on the dependence between two tasks. On the other hand, this working
model was considered to be of enough complexity for this illustrative application of
the methodology.
Note that the scale for factor ―closeness in time‖ does not relate to an absolute time
scale (Figure 3). For example, the anchor point ―5 minutes‖ is meant to be an example
of the concept of closeness in time, rather than a time mea surement: a judgment of ―8
minutes‖ could be also placed on the ―5 minutes‖ anchor position if the analyst feels
that the situations are not d ifferent. Alternative anchors for ―closeness in time‖ are
under evaluation, relating to typical tasks in NPP. In this way, as for example it was
done in Kirwan (1997c), the judgement is not only connected w ith the numeric time
separation.
Figure 8 shows the results of the expert elicitation of the input factors and of the
anchors. The Figure shows the input interface of the model as seen by the analyst.
Insert Figure 7. Influence diagram of the working model.
Insert Figure 8. Results from elicitation of the input factors and
the anchors: the dependence model as seen by the analyst.

13
4.2 Relationship between the input factors and dependence level
The expert knowledge on dependence is converted into the FES rules. This is done by:
1) using statements given by the experts to fill some of the rules of the fuzzy expert
system, and 2) filling the rest of the fuzzy rules via a rules interpolation approach.
The statements from the expert can be of d ifferent forms. In this paper each statement
evaluates particular combinations of the input labels. When the expert is asked to
evaluate the selected contexts, he/ she is also shown the relative positioning of the
anchors on the scale, so as to help him / her to contextualize his/ her statements (Figure
9). These evaluations allow partially filling the Table of rules, as shown in Figure 9 for
―task relatedness‖.
Then, the missing ―relationships‖ are filled in by an automatic ―interpolation‖
procedure which smoothly spreads the consequent labels over the fuzzy rules
(Marseguerra et al., 2004; Zio et al., 2009) (Figure 10).
Insert Figure 9. Table of rules for the intermediate variable Task
relatedness (partial fill from the expert statements)
Insert Figure 10. Table of rules for the intermediate variable Task
relatedness (complete fill by rules interpolation)
5 Use of the working model: dependence in operators’ early response to ATWS
5.1 Scenario description
The case study considered refers to a set of operator actions required to avoid excessive
boron d ilution in the reactor cooling system in case of an Anticipated Transient
Without Scram (ATWS) scenario in a nuclear Boiling Water Reactor (BWR).
In the considered scenario, the operators have successfully initiated the Standby Liquid
Control System (SLCS) to shut the reactor down. To facilitate the reactor shut down,
the operators are d irected by the procedures to increase the void ing by reducing the
level in the reactor to the Top of Active Fuel (TAF). Additionally, they are required to
inhibit the actuation of the Automatic Depressurization System (ADS), which is
activated by the signal of low water level in the reactor, generated while lowering the
reactor water level to TAF. In case of failure to inhibit the ADS, the reactor pressure
would be automatically decreased and low pressure injection systems (Core Spray

14
System, CSS), would be activated. The injected water could dilute the boron injected by
the SLCS and the consequential failure to control reactivity. In case of failure to inhibit
ADS actuation, the operators are called to control the level in the reactor using low
pressure injection, tripping one of the CSS pumps and controlling the other pump.
The signal to activate the ADS is generated about 7 minutes after the event of failure to
scram. At that point, the operators have about 15 minutes to take actions to limit the
low pressure injection flow.
The pair of operator tasks involved in the dependence assessment are 1) inhibit the
ADS and 2) control the reactor vessel level in order to prevent d iluting boron
concentration after failure to inhibit the ADS. Both actions are d irected by the same
emergency procedure.
5.2 Five cases of analyst judgment
At first, three judgment cases are presented , corresponding to different possible
interpretations of the context by the analyst. The last two cases show how the model
responds to the variation of one input from cases 2 and 3.
Case 1 – input judgments as point values on anchors
Figure 11 shows an example of this type of input on the model interface and Figure 12
shows the corresponding fuzzification of the judgments by means of trapezoidal MFs.
―Time‖ (upper left corner of Figure 11 and Figure 12): as said in the scenario
description of Section 5.1, the separation in time of the two actions is expected
to be around 15 minutes. The most reasonable anchor representing this context
is ―5 minutes‖, the conservative judgment closest to the real context.
―Cues‖ (upper right corner of Figure 11 and Figure 12): the initial cues for ADS
inhibition are related to high reactor power level due to the failure to scram.
The cues for control of low pressure injection are related to the reactor vessel
level, which has to be manually maintained . This situation matches the anchor
―different indicators for d ifferent parameters‖.
―Goals‖ (lower right corner of Figure 11 and Figure 12): the two actions relate to
the same function (shut down the reactor by boron control), carried out via
d ifferent systems. This situation matches the anchor ―same function by
d ifferent systems‖ .
―Performers‖ (lower left corner of Figure 11 and Figure 12): the action is carried
out by the same team. This matches the anchor ―same team‖.
15
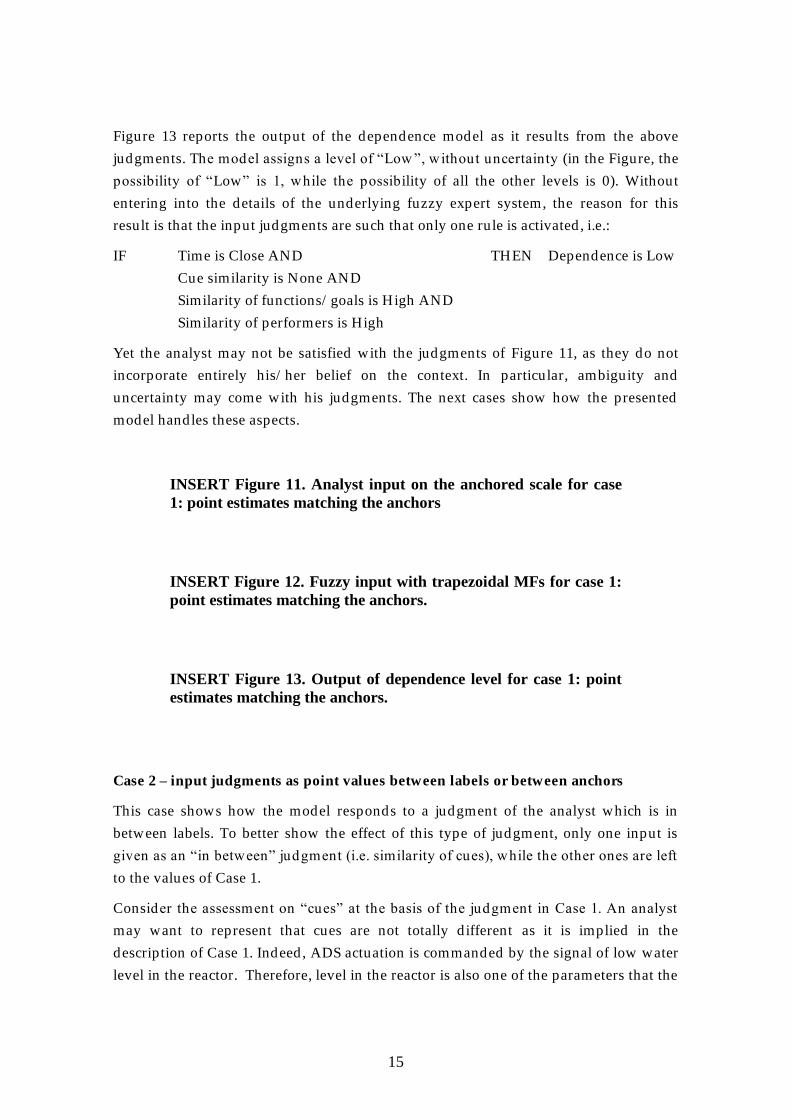
Figure 13 reports the output of the dependence model as it results from the above
judgments. The model assigns a level of ―Low ‖, without uncertainty (in the Figure, the
possibility of ―Low‖ is 1, while the possibility of all the other levels is 0). Without
entering into the details of the underlying fuzzy expert system, the reason for this
result is that the input judgments are such that only one rule is activated , i.e.:
IF Time is Close AND
Cue similarity is None AND
Similarity of functions/ goals is High AND
Similarity of performers is High
THEN Dependence is Low
Yet the analyst may not be satisfied with the judgments of Figure 11, as they do not
incorporate entirely his/ her belief on the context. In particular, ambiguity and
uncertainty may come with his judgments. The next cases show how the presented
model handles these aspects.
INSERT Figure 11. Analyst input on the anchored scale for case
1: point estimates matching the anchors
INSERT Figure 12. Fuzzy input with trapezoidal MFs for case 1:
point estimates matching the anchors.
INSERT Figure 13. Output of dependence level for case 1: point
estimates matching the anchors.
Case 2 – input judgments as point values between labels or between anchors
This case shows how the model responds to a judgment of the analyst which is in
between labels. To better show the effect of this type of judgment, only one input is
given as an ―in between‖ judgment (i.e. similarity of cues), while the other ones are left
to the values of Case 1.
Consider the assessment on ―cues‖ at the basis of the judgment in Case 1. An analyst
may want to represent that cues are not totally d ifferent as it is implied in the
description of Case 1. Indeed, ADS actuation is commanded by the signal of low water
level in the reactor. Therefore, level in the reactor is also one of the parameters that the

16
operators have to monitor while inhibiting ADS. The context is therefore more
ambiguous than that represented in Case 1. The analyst may therefore feel more
confident to assign a point assessment somewhere in between the label ―NONE‖,
representing ―different indicators for d ifferent parameters‖ and the label ―LOW‖,
representing a somewhat higher level of dependence.
Figure 14 shows the input of the analyst on the model interface and Figure 15 shows
the corresponding fuzzification of the judgments by means of trapezoidal MFs.
Figure 16 reports the output of the dependence model in form of the possibility values
of the d ifferent levels of dependence. It can be seen that the ambiguity of the judgment
reflects in the model output, which assigns possibility to both levels of ―low‖ and
―medium‖ (in particular, 0.8 to LOW and 0.2 to MEDIUM). The relative possibilities
values of the low and medium labels depend on the location of the input assessment
arrow of the analysis in Figure 14.
The reason for this output is that as a result of the input judgments, two rules are
activated, i.e.:
IF Time is Close AND
Cue similarity is None AND
Similarity of functions/ goals is High AND
Similarity of performers is High
THEN Dependence is Low
IF Time is Close AND
Cue similarity is Low AND
Similarity of functions/ goals is High AND
Similarity of performers is High
THEN Dependence is
MEDIUM
INSERT Figure 14. Analyst input on the anchored scale for case
2: point estimates between anchors.
INSERT Figure 15. Fuzzy input with trapezoidal MFs for case 2:
point estimates between anchors.
INSERT Figure 16. Output of dependence level for case 2: point
estimates between anchors.
Case 3 – range assessments (uncertainty)

17
This case shows how uncertainty in the context can be represented in the jud gment and
how this reflects in the output dependence assessment. Again, only one input is varied
from the judgments at the basis of Case 2 to show this effect.
Consider the judgment on the input factor ―closeness in time‖. According to the
scenario description, the operators have about 15 minutes to take actions to limit the
low pressure injection flow. In Case 1, in order to have the input matching an anchor,
the conservative judgment of 5 minutes was made. However, more realistically an
analyst may want to represent the uncertainty in the ―about 15 minutes‖ as an interval
range between 5 and 20 minutes (Figure 17 and Figure 18).
Figure 19 reports the output of the dependence model in form of the possibility values
of the d ifferent levels of dependence. It can be seen that as a consequence of the varied
input judgment, the output assessment is spread on the three values of ZERO, LOW,
and MEDIUM, peaked on the LOW level. The activated rules are in fact:
IF Time is Neither AND
Cue similarity is None AND
Similarity of functions/ goals is High AND
Similarity of performers is High
THEN Dependence is Zero
IF Time is Neither AND
Cue similarity is Low AND
Similarity of functions/ goals is High AND
Similarity of performers is High
THEN Dependence is Low
IF Time is Close AND
Cue similarity is None AND
Similarity of functions/ goals is High AND
Similarity of performers is High
THEN Dependence is Low
IF Time is Close AND
Cue similarity is Low AND
Similarity of functions/ goals is High AND
Similarity of performers is High
THEN Dependence is
Medium
Insert Figure 17. Analyst input on the anchored scale for case 3:
range assessment

18
Insert Figure 18. Fuzzy input with trapezoidal MFs for case 3:
range assessment.
Insert Figure 19. Output of dependence level for case 3: range
assessment.
Cases 4 and 5 – response of the model to judgment variation on one input
This cases show how the model responds to the variation of one input from the values
that were used in cases 2 and 3. Note, these last two cases do not correspond to a
specific dependence analysis assessment, but they are presented here as examples of
sensitivity analysis.
The inputs for cases 4 and 5 are the same as those of cases 2 and 3, respectively, except
for the judgment on factor ―similarity of cues‖, which is now centered on the anchor
―single indicator for the same parameter‖ (with falls on the input label HIGH, without
overlapping to any other label).
The output of the dependence model is reported in Figure 20: as expected , both output
assessments are shifted towards higher dependence levels, as a consequence that the
input judgment has been moved towards higher similarity of cues. In case 4, the level
of HIGH is assigned without uncertainty (Figure 20, left), because the input assessment
is such to activate only one rule:
IF Time is Close AND
Cue similarity is High AND
Similarity of functions/ goals is High AND
Similarity of performers is High
THEN Dependence is
High
Instead , the output d istribution of case 5 is spread over two levels (MEDIUM and
HIGH), as an effect of the uncertainty in the ―closeness in time‖ judgment, which is
expressed as an interval range (Figure 20, right). For brevity, the rules activated in case
5 are not reported .
Insert Figure 20. Output of dependence level for cases 4 (left) and
5 (right).

19
6 Discussion
6.1 Repeatability and traceability
The motivation behind the development of the presented method has been to give
repeatability and traceability to the dependence assessment among successive human
actions affecting safety of installation .
Repeatability comes from the fact that the proposed method is based on an explicit,
computable model. Indeed, as with DTs, the judgments are given on the input factors
and the applicable dependence level follows from the model and not from direct expert
judgment. With respect to the judgments to be provided on the input factors,
repeatability benefits from provid ing anchor situations to the analyst: the more
representative and defined the anchors are, the less controversial, and therefore
variable, the input judgments are.
Unlike DTs, traceability of the dependence model is assured by a systematic expert
elicitation approach, made up of two traceable steps (first fill and interpolation of the
fuzzy logic rules relating the input to the dependence level). Once the dependence
model is built, it is easy to go back and verify the base expert’s statements that
originated the model. In principle, the traceability of the process to build DTs could be
potentially improved by provid ing better documentation, but this has been rarely the
case.
6.2 Verification and validation issues
Model verification and validation are two essential steps in the development of any
method and are being taken into consideration in the development of the present
dependence method .
Verification is intended as the process to make sure that the model represents correctly
the experts’ knowledge (O’Keefe & Smith, 1987). After construction, the expert model
has to be assessed (verified) by the experts whose expertise is captured in the model. In
this phase, feedback needs to be provided to the experts to allow them to determine
whether the expert system model is a good representation of their knowledge, and if
not, to modify the model appropriately. Techniques for provid ing this feedback are
currently under investigation by the authors: they include visualization techniques as
well as importance measures. Some preliminary results can be found in Podofillini et
al. (2008).
A fundamental step for the acceptance of the dependence model is its validation. Yet,
the empirical validation of a human error dependence model is a very d ifficult task. In
what follows, the status of HRA validation generally and as it regards dependence is

20
outlined . The most significant HRA validation efforts have addressed mostly failure
probabilities for ―execution‖, that is, carrying out a series of actions or steps on a
system. A review of validation efforts for a number of HRA methods can be found in
Kirwan (1997b). These sources note the d ifficulty of validating the failure probabilities
for decision or d iagnosis that are predicted with HRA methods. This is due in
particular to the lack of reference data, which in turn is caused by the sensitivity of
decision failures to a broad range of variables (contextual factors). Indeed, data
collection efforts have addressed mostly failure probabilities for ―execution‖, as, for
example, in Kirwan, et al. (2008), where the focus is on communication errors.
There are on-going efforts that should improve the state of HRA data in the future.
One of these is an attempt to analyze operating experience and to obtain in this way
empirical relationships between the factors and the observed human failure events: the
Human Error Repository and Analysis (HERA) project and database sponsored by the
U.S. Nuclear Regulatory Commission (Hallbert et al., 2006). A second effort is the
International HRA Empirical Study being performed by an international group of
organizations jointly with the OECD Halden Reactor Project, in which the predictions
of HRA methods are being compared with simulator data (Lois et al., 2008 and Dang et
al., 2007). While both quantitative predictions (the HEPs) and qualitative predictions
(the ―driving‖ or most important input factors identified in the Human Reliability
Analysis) will be addressed in this work, the number of data points will not be
sufficient to validate comprehensively the relationship between the input variables and
the predicted failure probabilities, a relationship represented by each HRA method.
Concerning the validation of a dependence model, the basis or mechanisms that
potentially lead to dependence within a series of actions relate strongly to the decision -
making of the personnel associated with these actions. Therefore, one may anticipate
that data will be very d ifficult to collect. A major reason is that the action and failure
probability of interest are conditioned on a previous personnel failure. Given the
expected performance levels, this initial failure is relatively d ifficult to ―provoke‖
systematically and realistically such that the subsequent performance can be examined.
In case the validation strategy would be to test the model’s predictions against
simulator data, this poses challenges also as to how the simulator experiments should
be designed (e.g. what accident scenarios should be simulated).
This suggests that a model of dependence for HRA cannot be based on (built from) a
set of data from which the overall relationship between the input variables and the
output variable of interest can be quantitatively estimated . For the same reason, it can
be expected that the validation of such a model cannot be done against a

21
comprehensive set of data that is able to explore extensively the range of the model
response.
However, these d ifficulties should not d iscourage and some way of test ing the
empirical basis of the model should be pursued. Three concept alternatives can be
anticipated here:
Validation of the model against a limited set of data, thus validating only some
of the input-output relationships, only those that cover the considered data.
Validation of the effect of individual factors. This would address the question if
/ how the effect of variations in one input factor (averaging the effect of the
other factors or keeping these at fixed values) as anticipated by the model
compares with the empirical data.
Validation of the relative strength of the factors and of their interactions. This
would address the question if the factors that are predicted as being important
by the model result as being important also from the data.
It is expected that the experience with the mentioned International HRA Empirical
Study will help in defining how to go about the above concept alternatives.
While validation against empirical data has the mentioned challenges, alternative
approaches to validation are being considered for the short term.
Indeed, there is a significant history working with the THERP dependence approach,
in its original formulation or supported by DTs. This can be used to draw some
conclusions on the reasonableness of the numbers produced for dependence
calculations, i.e. on its so-called face valid ity (Kirwan, 1997a).
Data from experts can also be used to replace empirical data for a validation exercise.
This can be done in two ways (which are not exclusive). The first is to give case studies
to the experts and partition the cases in two sets: one set is used to inform the
relationships and build the model and the rest is used to test the prediction capability
of the model. The other way is to test the predictions against those from ano ther set of
experts. These options will be considered in the design of the expert elicitation process.
6.3 Additional discussion
It is worth noting that other expert modelling approaches exist that can handle
dependence among the input factors. Probabilistic models such as influence d iagrams
and Bayesian belief networks (Phillips et al., 1990) and connectionism networks

22
(Sträder, 2000) are some examples. Research is also being performed by the authors to
compare the performance of these probabilistic approaches with Fuzzy approaches.
Finally, note that the so-called second-generation HRA methods (ATHEANA (Cooper
et al., 1996), MERMOS (Le Bot et al., 1998), CREAM (Hollnagel, 1998)) do not quantify
dependence based on conditional HFEs probabilities as the presented method assumes.
Their common notion is that the likelihood of HFEs is driven by performance
conditions determined by the context where the action takes place, rather than by
intrinsic human error probabilities associated with the task. Following this notion, the
context must include preceding HFEs and the failure probability estimated for any
action should reflect a) the effect of preceding HFEs on the scenario and on the
operators’ situation assessment, and b) the relationships between the actions, which
would include many of the dependence factors. In this way, a model of dependence
remains essential in a second -generation analysis even if the proposed dependence
assessment method may not be applicable. As second-generation methods have not yet
been extensively applied , improving dependence assessment and quantifying
conditional probabilities remain issues of major concern.
Another way of handling dependence is through the use of dynamic PSA tools, see e.g.
(Chang & Mosleh, 2007), which allow to d irectly simulate the evolution of the system
after each human intervention and therefore, in principle, to better define the context in
which the dependent actions are carried out.
7 Conclusions and Outlook Human failure dependence assessment is a highly subjective part of HRA and efforts
to improve the transparency and repeatability of the assessments are needed. This
paper proposes a dependence method that is based on an expert model, built from a
transparent expert elicitation process. The expert model is a Fuzzy Expert system. This
representation has been selected since it is suitable for models mostly built from expert
judgment, as opposed to empirical data. A working model of dependence has been
developed to investigate the concepts underlying the proposed method; its internal
relationships have been set by the authors. The expert elicitation exercise will be
performed in the future. The model has been applied for dependence assessment of
two operator actions in response to an anticipated transient without scram in a nuclear
boiling water reactor.
Improving the transparency and repeatability of human reliability dependence
assessment, while keeping the method practical to use h ave been the goals of the
research. The features of the model to achieve these goals are as follows.

23
The proposed method is based on an explicit, computable model. As in a decision tree,
an analyst is required to give judgments on the input factors of the model, and not
d irectly on the dependence level (which is the output of the model). While improving
the repeatability of the assessment, this is also expected to reduce its uncertainty,
compared to the case of giving judgments d irectly on the dependence level. Indeed,
uncertainty on input judgments exists as well, but with anchors to provide references
for the scale, the inputs can be made less subjective than the dependence level.
The computable model is built from a systematic expert elicitation approach, made up
of two traceable steps. This is important because, in connection with what said above,
the accuracy of the results produced by the method depends on the accuracy of the
computable model. Given that empirical validation of the model accuracy is extremely
challenging, it is important that the build ing process is traceable, to allow scrutinizing
the experts’ statements contained in the expert model.
With the use of the expert model, the analyst’s input judgments are d irectly and
formally converted into the output, the (d iscrete) dependence level. Compared to a
decision tree-based approach, the result gives a dependence assessment that can more
closely reflect the analysts’ understanding of the dependence factors for a given set of
tasks.
Anchor situations are provided as guidance for the analyst’s assessment of the input
factors. Using up to five input linguistic labels for the factors, compared to the typical
two of (binary) decision trees, may be perceived as subject to more subjectivity as well
as cumbersome by analysts and experts. However, the anchor points may counteract
the effect of having more labels for each factor , by provid ing concrete references for
determining the input factor for the specific case under analysis.
Neither the HRA analysts nor the experts whose knowledge is represented by the
expert model need to be familiar with Fuzzy Expert systems: no aspect of the Fuzzy
formalism is shown to analysts and experts and they interface only with the input
linguistic labels and with the anchor points. This is very similar to the interface of
decision trees commonly used (e.g. SPAR-H and the EPRI HRA Calculator ®).
Once the model is finally built, verification and validation are also important aspects.
In particular, validation of the depend ence model against empirical data is
significantly challenging, due to the d ifficulty of collecting failure probability data.
However, it is expected that it will be possible to draw some conclusions on the model
face valid ity. Indeed, although the currently used THERP-based approaches may suffer
from a number of limitations, there is a significant experience in working with these

24
and this can be used to check the reasonableness of the results produced by the
proposed method.
References American Society of Mechanical Engineers, ASME Standard for Probabilistic Risk
Assessment for Nuclear Power Plant Applications, ASME RA-S-2002 (with
addenda, RA-Sb-2005), New York: ASME, 2005.
Brewer, N. T. & Chapman, G. B. (2002). The fragile basic anchoring effect. Journal of
Behavioral Decision Making, 7, 223-242.
Cepin, M. (2006). Development of a method for consideration of dependence between
human failure events. Proceedings of ESREL 2006 – Safety and Reliability for
managing risk, Estoril, Portugal, 18-22 September 2006.
Cepin, M. (2008a). DEPEND-HRA - A method for consideration of dependency in
human reliability analysis. Reliability Engineering & System Safety, 93(10), 1452-
1460.
Cepin, M. (2008b). Importance of human contribution within the human reliability
analysis (IJS-HRA). Journal on loss prevention in process industries, 21(3), 268-
276.
Cepin, M. (2008c). Comparison of methods for dependency determination between
human failure events within human reliability analysis, Science and technology of
nuclear installations, Vol. 2008, 1-7.
Chang, S.H., Kang, K.S., Choi, S.S., Jeong, H.K., & Yi, C.U. (1995). Development of
the Online Operator Aid System Oasys Using a Rule-Based Expert-System and
Fuzzy-Logic for Nuclear-Power-Plants. Nuclear Technology 112 (2), 266-294.
Chang, Y.H.J., Mosleh, A. (2007). Cognitive modeling and dynamic probabilistic
simulation of operating crew response to complex system accidents: Part 1:
Overview of the IDAC Model. Reliability Engineering & System Safety, 92(8),
997-1013.
Cheok, M.C., Parry, G. W. & Sherry, R. R. (1998). Use of importance measures in risk-
informed regulatory applications. Reliability Engineering & System Safety, 60,
213–26.
Cooke, R.M. (1991). Experts in uncertainty, New York: Oxford university press.
Cooper, S. E., Ramey-Smith, A. M., Wreathall, J., Parry, G.W., Bley, D.C., Luckas,
W.J., Taylor, H.J., & Barriere, M.T. (1996). A Technique for Human Error
Analysis (ATHEANA). NUREG/CR-6350. Washington, DC: U.S. Nuclear
Regulatory Commission.
Dang, V.N., Bye, A., Lois, E., Forester, J., Kolaczowski, A.M. & Braarud, P.O. (2007)
An Empirical Study of HRA Methods – Overall Design and Issues, Proc. 2007
IEEE 8th Human Factors and Power Plants (HFPP) and 13th Annual HPRCT
Meeting, August 26-31, 2007, Monterey, CA, USA.
Gertman, D., Blackman, H., Marble, J., Byers, J., Haney, L., & Smith, C. (2005). The
SPAR-H Human Reliability Analysis Method. NUREG/CR-6883. Washington,
DC: US Nuclear Regulatory Commission.
Hollnagel, E. (1998) Cognitive reliability and error analysis method (CREAM). Oxford:
Elsevier Science Ltd.

25
Huang, D., Chen, T., & Wang, M.J.J. (2001). A fuzzy set approach for event tree
analysis. Fuzzy Sets and Systems 118(1), 153-165.
Grobbelaar, J., Julius, J. & Rahn, F. (2005). Analysis of Dependent Human Failure
Events Using the EPRI HRA Calculator. Proc. of the ANS Topical Meeting on
Probabilistic Safety Assessment (PSA'05), San Francisco, CA, USA, Sept 11-15,
2005.
Kawamoto, K., Houlihan, C.A., Balas, E.A., & Lobach, D.F. (2005). Improving clinical
practice using clinical decision support systems: a systematic review of trials to
identify features critical to success. British Medical Journal (BMJ),
doi:10.1136/bmj.38398.500764.8F (published 14 March 2005).
Kennedy, G.A.L., Siemieniuch, C.E., Sinclair, M.A, Kirwan, B.A. & Gibson, H.W.
(2007). Proposal for a sustainable framework process for the generation,
validation, and application of human reliability assessment within the engineering
design lifecycle. Reliability Engineering & System Safety, 92(6), 755-770.
Kim, B., & Bishu, R.R. (1996). On assessing operator response time in human
reliability analysis (HRA) using a possibilistic fuzzy regression model.
Reliability Engineering & System Safety 52(1), 27-34.
Kirwan, B. (1997a). Validation of human reliability assessment techniques: part 1 –
validation issues. Safety Science 27(1), 25-41.
Kirwan, B. (1997b). Validation of human reliability assessment techniques: part 2 –
validation results. Safety Science 27(1), 43-75.
Kirwan, B. (1997c). The development of a nuclear chemical plant human reliability
management approach: HRMS and JEDI. Reliability Engineering and System
Safety 56, 107-133.
Kirwan, B., Gibson, W. H. & Hickling, B. (2008). Human error data collection as a
precursor to the development of a human reliability assessment capability in air
traffic management. Reliability Engineering & System Safety, 93(2), 217-233.
Kirwan, B., Umbers, I., Edmunds, J. and Gibson, H. (2008). Quantifying the
Unimaginable – the Case for Human Performance Limiting Values. Proc. of the
9th Int. Conf. on Probabilistic Safety Assessment and Management (PSAM9),
Hong Kong, China, 18-23 May 2008.
Konstandinidou, M., Nivolianitou, Z., Kiranoudis, C., & Markatos, N. (2006). A fuzzy
modeling application of CREAM methodology for human reliability analysis.
Reliability Engineering and System Safety 91(6), 706-716.
Hallbert, B., Boring, R., Gertman, D., Dudenhoeffer, D., Whaley, A., Marble, J.,Joe, J.,
Lois, E. (2006), Human Event Repository and Analysis (HERA) System, Overview,
NUREG/CR-6903, Vol. 1 Washington, DC: US Nuclear Regulatory Commission.
Le Bot, P., Desmares, E., Bieder, C., Cara, F., & Bonnet, J-L. (1998). MERMOS:
unprojet d’EDF pour la mise à jour de la méthodologie EPFH. Revue Generale
Nucleaire, 1998, 1.
Liang, G.S., & Wang, M.J.J. (1993). Evaluating human reliability using fuzzy relation.
Microelectronics and Reliability, 33(1), 63-80.
Lois, E., Dang, V.N., Forester, J., Broberg, H., Massaiu, S., Hildebrandt, M., Braarud,
P.O., Parry, G., Julius, J., Boring, R.L., Männistö, I., Bye, A. (2008). International
HRA Empirical Study – Description of Overall Approach and First Pilot Results

26
from Comparing HRA Methods to Simulator Data, Halden Reactor Project Work
Report HWR-844, Apr. 2008.
Marseguerra, M., Zio, E., & Bianchi, M. (2004). A fuzzy modelling approach to road
transport with application to a case of spent nuclear fuel transport. Nuclear
Technology 146(3), 290-302.
Marseguerra, M., Zio, E. & Librizzi, M. (2006). Quantitative Developments in the
Cognitive Reliability and Error Analysis Method (CREAM) for the Assessment of
Human Performance. Annals of Nuclear Energy, 33(10), 894-910.
O'Hagan, A., Buck, C. H., Daneshkhah, A., Eiser, J. R., Garthwaite, P. H., Jenkinson,
D. J., Oakley, J. E., Rakow, T. (2006). Uncertain Judgments: Eliciting Experts'
Probabilities, Chichester, England: John Wiley & Sons.
O’Keefe, R.M., Smith, E.P. (1987). ―Validating Expert System Performance‖. IEEE
Expert, 2, pp. 81-89.
Onisawa, T. (1988a). Fuzzy concepts in human reliability. In: Fuzzy Logic in
Knowledge-Based Systems, Decision and Control. North-Holland, New York: M.
M. Gupta, T. Yamakawa.
Onisawa, T. (1988b). A representation of human reliability using fuzzy concepts.
Information Sciences 45 (2), 153-173.
Otway, H., von Winterfeldt, D. (1992). Expert Judgment in Risk Analysis and
Management: Process, Context, and Pitfalls. Risk Analysis, 12, 83-93.
Phillips, L. D., Humphreys, P., Embrey, D. E. & Selby, D. L. (1990). A Socio-Technical
Approach to Assessing Human Reliability. In: Influence Diagrams, Belief Nets
and Decision Analysis, New York: R. M. Oliver & J. Q. Smith. Wiley.
Podofillini, L., Dang, V.N., Zio, E., Baraldi, P. & Librizzi, M. (2008). Techniques for
verification of expert models for dependence assessment in human reliability
analysis. Proc. of the 9th Int. Conf. on Probabilistic Safety Assessment and
Management (PSAM9), Hong Kong, China, 18-23 May 2008.
Richei, A., Hauptmanns, U., & Unger H. (2001). The human error rate assessment and
optimizing system HEROS — a new procedure for evaluating and optimizing the
man–machine interface in PSA. Reliability Engineering & System Safety 72 (2),
153-164.
Suresh, P.V., Babar, A.K., & Raj, V.V. (1996). Uncertainty in fault tree analysis: A
fuzzy approach. Fuzzy Sets and Systems 83, 135-141.
Swain, A.D., & Guttman, H.E. (1983). Handbook of human reliability analysis with
emphasis on nuclear power plant applications. NUREG/CR-1278. Washington,
DC: US Nuclear Regulatory Commission.
Stevens, S. S. (1946). On the Theory of Scales of Measurement. Science, 103, 677-680.
Sträter, O. (2000). Evaluation of the human reliability based on human experience. PhD
dissertation of Oliver Sträter, GRS-107, GRS - Gesellschaft für Anlagen- und
Reaktorsicherheit.
Terano, T., Murayama, Y., & Akiyama, N. (1983). Human reliability and safety
evaluation of man-machine systems. Automatica, 19 (6), 719-722.
US Nuclear Regulatory Commission (2005). Good Practices for Implementing Human
Reliability Analysis, NUREG-1792, US Nuclear Regulatory Commission,
Washington DC, USA.

27
Vaurio, J.K. (2001). Modelling and quantification of dependent repeatable human errors
in system analysis and risk assessment. Reliability Engineering and System Safety
71, 79-188.
Whaley, A.M., Boring, R. L., Blackman, H. S., McCabe, P. H. & Hallbert, B. P. (2007).
Lessons Learned from Dependency Usage in HERA: Implications for THERP-
Related HRA Methods, In: Proc. of 8-th IEEE Conference on Human Factors and
Power Plants, Monterrey, California, 26-31 August 2007.
Zadeh, L.A. (1965). Fuzzy sets. Inform. And Control 8, 338-353.
Zio, E., Baraldi, P., Librizzi, M., Podofillini, L. & Dang, V.N. (2009). A Fuzzy Expert
System for modeling dependence among human errors. Submitted to Fuzzy Sets
and Systems.

28
Table 1. The EPRI HRA Calculator ® dependence decision tree (Grobbelaar et al.,
2005).
Time between cues Adequate
resources Stress Level
Simultaneous
No High
CD Low
Yes High CD
Low HD
0-15 min Yes High CD
Low HD
15-30 min Yes High HD
Low MD
30-60 min Yes High MD
Low LD
> 60 min Yes High LD
Low ZD NOTE: The above table from the EPRI HRA Calculator ® applies for two actions performed by the same
crew, at the same location (the control room) and guided by different cues

29
Table 2. Linguistic variables, qualitative labels and anchor points for the working
model
Linguistic variable Qualitative labels Anchors1 (provided by the
expert)
Closeness in time close in time, widely
separated in time,
neither
24 h
8 h
1 h
30 min
20 min
5 min
Cue similarity None/very low, low, medium,
high, very high/complete
Different sets of indicators for different
parameters
Different sets of indicators for the
same parameter
Single indicator for the same parameter
Different sets of indicators for the
same physical quantity
Same sets of indicators for the same
sets of parameters
Function/goal similarity None/very low, low, medium,
high, very high/complete
Different functions by different
systems
Different functions by the same system
Same function by different systems
Same function by the same system
Similarity of performers None/very low, low, medium,
high, very high/complete
TSC vs control room shift
Different teams
Different individuals (same
qualification)
Same team
Same person
1 It is expected that multiple sets of time anchors will be distinguished in the final model. For example,
time anchors should be placed in different locations on the scale for short and long term actions: a time
separation of 20 minutes between the two actions, can be considered as wide if the first action is to be
performed few minutes after the annunciation of the related cues: on the other hand, the same separation
of 20 minutes can be considered as ―very small‖ if the first action is to be performed within hours from
the annunciation of the related cues.

30
Dependency Condition Table Condition
number
Crew
(same or
different)
Time
(close in time
or not close in
time)
Location
(same or
different)
Cues
(additional
or no
additional)
Dependency Number of Human Action Failures Rule
□ - Not Applicable.
Why?_________________
1 s c s na Complete When considering recovery in a series
e.g., 2nd, 3rd, or 4th checker
If this error is the 3rd error in the
sequence, then the dependency is at
least moderate.
If this error is the 4th error in the
sequence, then the dependency is at
least high.
2 a Complete
3 d na High
4 a High
5 nc s na High
6 a Moderate
7 d na Moderate
8 a Low
9 d c s na Moderate
10 a Moderate
11 d na Moderate
12 a Moderate
13 nc s na Low
14 a Low
15 d na Low
16 a Low
17 Zero
Figure 1. The SPAR-H dependence decision tree (Gertman et al., 2005).
Figure 2. Overview of the dependence model. Different models are needed for pre-
initiators, and different types of post-initiators.
Closeness in time
Similarity of performers
Input assessments
Expert model Output distribution
Closeness
in time
Task
relatedness
Similarity of
performers
Dependence
level
Similarity of
functions /
goals
Similarity of
cues
0 0.1 0.2 0.3 0.4 0.5 0.6 0.7 0.8 0.9 10
0.2
0.4
0.6
0.8
1
Dependence
Degre
e o
f m
em
bers
hip
ZERO LOW MEDIUM HIGH COMPLETE

31
Figure 3. Analyst elicitation on anchored scale; two analyst input types are shown:
as a point value (arrow) and as an interval (horizontal bar).
Figure 4. Possible association of fuzzy sets and membership functions (trapezoids)
to the input qualitative variable.
None Low Medium
m High
0 1.0
Very high
Degree of
Membership
1
0
None Low Medium
m High
0 1.0
Very high
Analyst
Input 1
Analyst
Input 2
Anchor B Anchor D Anchor C Anchor A

32
Figure 5. Left: example of computation of the degree to which the Factor 1 input
assessment matches the label “Low ” and the Factor 2 input assessment the label
“High” . Right: computation of the degree of activation of the rule If “Factor 1” is
“Low” and “Factor 2” is “High” THEN “Dependence” is “Medium” as minimum
value between the degrees to which Factor 1 and Factor 2 input assessments match
the corresponding labels in the rule.
Figure 6. Fuzzy sets and membership functions associated to the THERP
dependence levels. Elicited from THERP guidelines (Swain & Guttman, 1983).
1 0.5 0.25 0.15 0.05
CD HD MD LD ZD
Conditional probabilty
0
1
Degree of
membership
0.015

33
Figure 7. Influence diagram of the working model.
Closeness
in time
Task
relatedness
Similarity of
performers
Dependence
level
Similarity of
functions /
goals
Similarity of
cues

34
Figure 8. Results from elicitation of the input factors and the anchors: the dependence model as seen by the analyst. Anchors may change
for different typologies of tasks.
Closeness in time Similarity of performers
Similarity of cues Similarity of functions/goals

35
Figure 9. Table of rules for the intermediate variable Task relatedness (partial fill from
the expert statements).
Figure 10. Table of rules for the intermediate variable Task relatedness (complete fill by
rules interpolation).

36
Figure 11. Analyst judgments on input factors for failure to control low pressure
injection given failure to inhibit ADS - case 1: judgments given as point values matching
the anchors.
Figure 12. Fuzzy input with trapezoidal MFs for case 1: point estimates matching the
anchors.
Closeness in time
Similarity of functions/goals Similarity of performers
Similarity of cues

37
Figure 13. Output of dependence level for case 1: point estimates matching the anchors.

38
Figure 14. Analyst input on the anchored scale for case 2: point estimates between
anchors and labels.
Figure 15. Fuzzy input with trapezoidal MFs for case 2: point estimates between anchors
and labels.
Closeness in time
Similarity of functions/goals Similarity of performers
Similarity of cues

39
Figure 16. Output of dependence level for case 2: point estimates between anchors and
labels.

40
Figure 17. Analyst input on the anchored scale for case 3: range assessment.
Figure 18. Fuzzy input with trapezoidal MFs for case 3: range assessment.
Closeness in time
Similarity of functions/goals Similarity of performers
Similarity of cues

41
Figure 19. Output of dependence level for case 3: range assessment.

42
0 0.1 0.2 0.3 0.4 0.5 0.6 0.7 0.8 0.9 10
0.2
0.4
0.6
0.8
1
Dependence
Degre
e o
f m
em
bers
hip
ZERO LOW MEDIUM HIGH COMPLETE
0 0.1 0.2 0.3 0.4 0.5 0.6 0.7 0.8 0.9 10
0.2
0.4
0.6
0.8
1
Dependence
Degre
e o
f m
em
bers
hip
ZERO LOW MEDIUM HIGH COMPLETE
Figure 20. Output of dependence level for cases 4 (left) and 5 (right).