using data analytics to improve government · the mayor’s office of data analytics ......
TRANSCRIPT

#gltrain
USING DATA ANALYTICS TO IMPROVE GOVERNMENT
BROUGHT TO YOU BY:

#gltrain
§ Tweet with us: #gltrain
§ Ask a question: Submit a question using the “ask a question" box on the console.
§ Help: If you have any technical difficulties during the training click on the “help” button located below the slide window.
§ CPE: To receive credit, you must be logged in for the full 50 minutes, participate in the 3 interactive polls and complete the post-training evaluation. The evaluation can be found under “resources”.
§ VIP: By attending today’s Government Innovators Virtual Summit you will be enrolled in the GovLoop VIP program and receive 1 credit.
§ On-Demand: On Friday we will email you a link to the on-demand version of the entire Virtual Summit so you can view all of the trainings (including this one), the slide decks and resources.
HOUSEKEEPING
#gltrain
ALAN FORD Director of Presales Consulting, Teradata Government Systems
USING DATA ANALYTICS TO IMPROVE GOVERNMENT
AMEN RA MASHARIKI Chief Analytics Officer,
New York
RORY SCHULTZ Client Executive, US
Department of Agriculture
!
What Is MODA? The Mayor’s Office of Data Analytics (MODA) is led by NYC’s Chief Analytics Officer, Dr. Amen Ra Mashariki. As part of the Mayor’s Office of Operations, MODA partners with agencies to translate data-driven insight into action.
Mission: Actionable Insight for NYC Government1. Support more effective delivery of services to New Yorkers
for greater equity, safety, and quality of life
2. Grow and advance analytics throughout the City 4
Analytics In Action
• Measuring Success
• Providing Situational Awareness
• Data Driven Enforcement
5
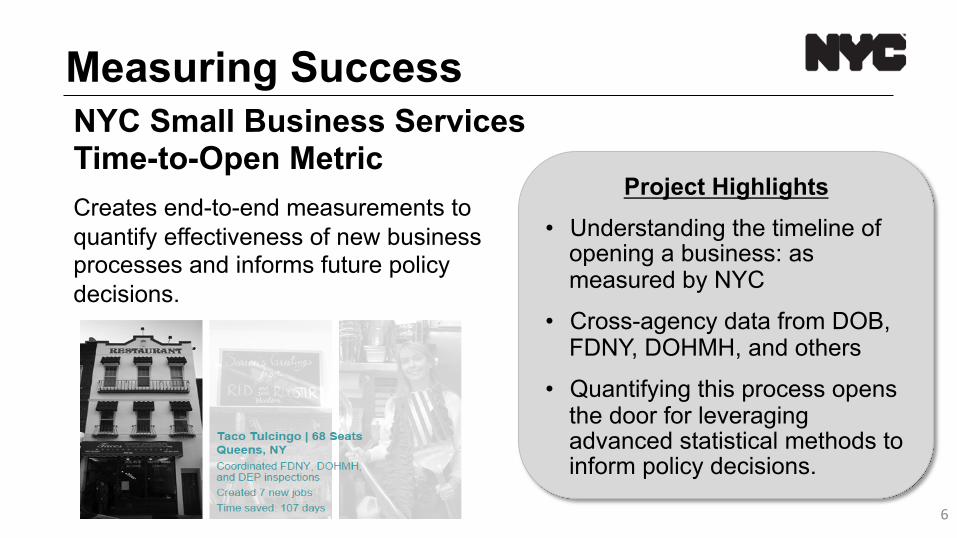
Measuring Success NYC Small Business Services Time-to-Open Metric
Creates end-to-end measurements to quantify effectiveness of new business processes and informs future policy decisions.
Project Highlights • Understanding the timeline of
opening a business: as measured by NYC
• Cross-agency data from DOB, FDNY, DOHMH, and others
• Quantifying this process opens the door for leveraging advanced statistical methods to inform policy decisions.
6

Providing Situational Awareness
7
Project Highlights • Using city data to build
situational awareness
• Cross-agency data from ECB, DCA, DOHMH, and others
• Allows Small Business Services to proactively target outreach by leveraging NYC violations data
NYC Small Business Services Proactive Education
Inform on the ground operations completed by SBS in order to educate small business owners regarding compliance.
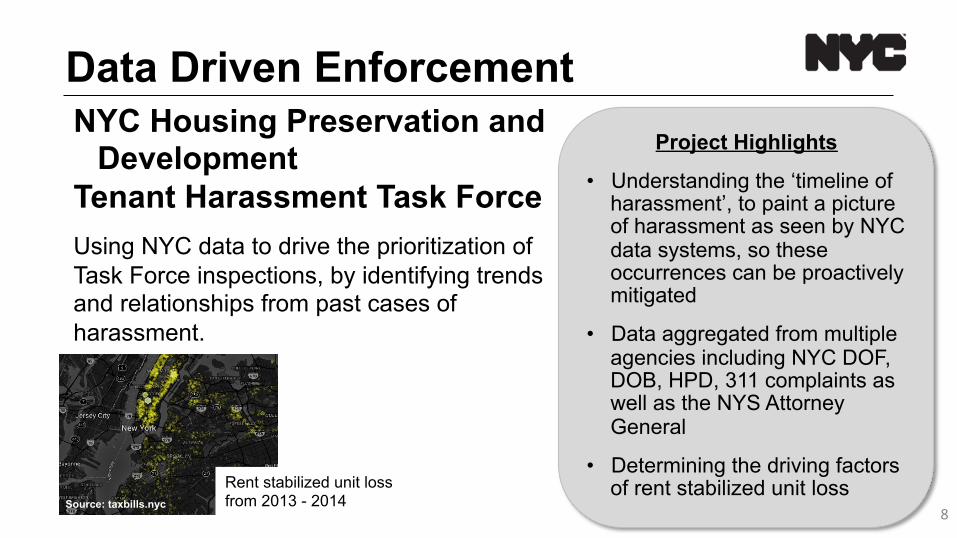
Data Driven Enforcement NYC Housing Preservation and
Development Tenant Harassment Task Force
Using NYC data to drive the prioritization of Task Force inspections, by identifying trends and relationships from past cases of harassment.
8
Project Highlights
• Understanding the ‘timeline of harassment’, to paint a picture of harassment as seen by NYC data systems, so these occurrences can be proactively mitigated
• Data aggregated from multiple agencies including NYC DOF, DOB, HPD, 311 complaints as well as the NYS Attorney General
• Determining the driving factors of rent stabilized unit loss Rent stabilized unit loss
from 2013 - 2014 Source: taxbills.nyc

Growing Citywide Analytics
• DataBridge
• Datashare
• Open Data for All
9
Why DataBridge?
Achieving the City’s goals requires coordination and sharing information across agencies.
• Complex problems are not single agency issues.
• DataBridge integrates agency collected information about people, places and businesses, and enables citywide analysis and coordinated action.
• Greater and deeper use expands City capabilities while increasing efficiencies.
10
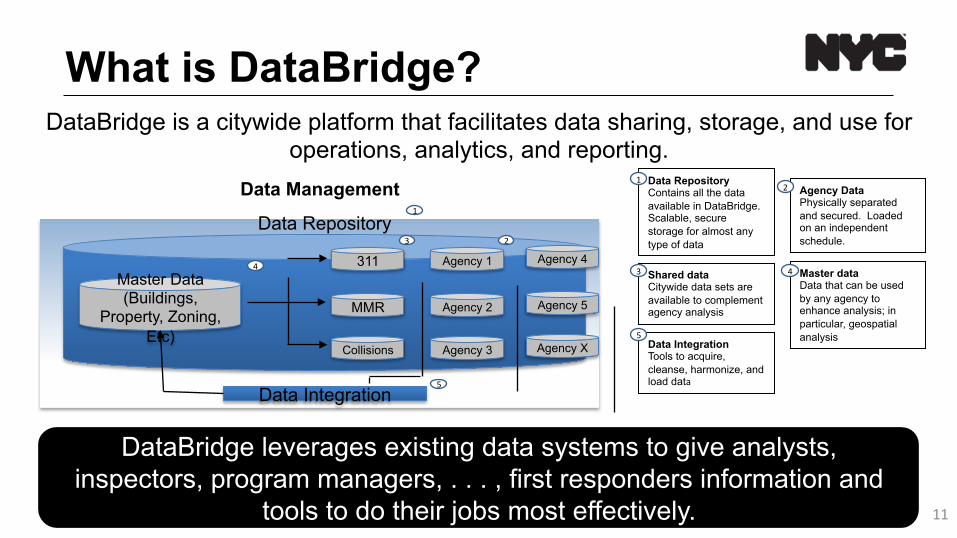
What is DataBridge? DataBridge is a citywide platform that facilitates data sharing, storage, and use for
operations, analytics, and reporting.
DataBridge leverages existing data systems to give analysts, inspectors, program managers, . . . , first responders information and
tools to do their jobs most effectively.
Shared data Citywide data sets are available to complement agency analysis
Data Repository Contains all the data available in DataBridge. Scalable, secure storage for almost any type of data
3 Master data Data that can be used by any agency to enhance analysis; in particular, geospatial analysis
Agency Data Physically separated and secured. Loaded on an independent schedule.
2 1
4
Data Integration Tools to acquire, cleanse, harmonize, and load data
5
Data Management
Data Repository
Data Integration
1
4
Master Data (Buildings,
Property, Zoning, Etc)
311
MMR
Collisions
Agency 1
Agency 2
Agency 3
Agency 4
Agency 5
Agency X
2
5
3
11

Open Data for All“The promise of Open Data is transparent, free, accessible data. Data is more than just numbers – it’s information that can create new opportunities and level the playing field for New Yorkers. It’s the illumination that changes frameworks, the insight that turns impenetrable issues into solvable problems. It’s the invitation for more voices to join critical conversations. Open Data is the commitment that all of these benefits are not confined to only a select few who are in the know, or who can pay for information – they are for everyone. New York City is dedicated to putting this power into the hands of all New Yorkers.”
How are we getting there?§ Increase Availability§ Increase Usability§ Expand Access§ Increase Quality

Analytics and Open Data Applying the MODA philosophy to Open Data:
§ Engage§ Demonstrate Value§ Translate insight into action
High quality Open Data provides opportunity.
Applying analytics to Open Data lowers the barrier for accessing information and encourages action.
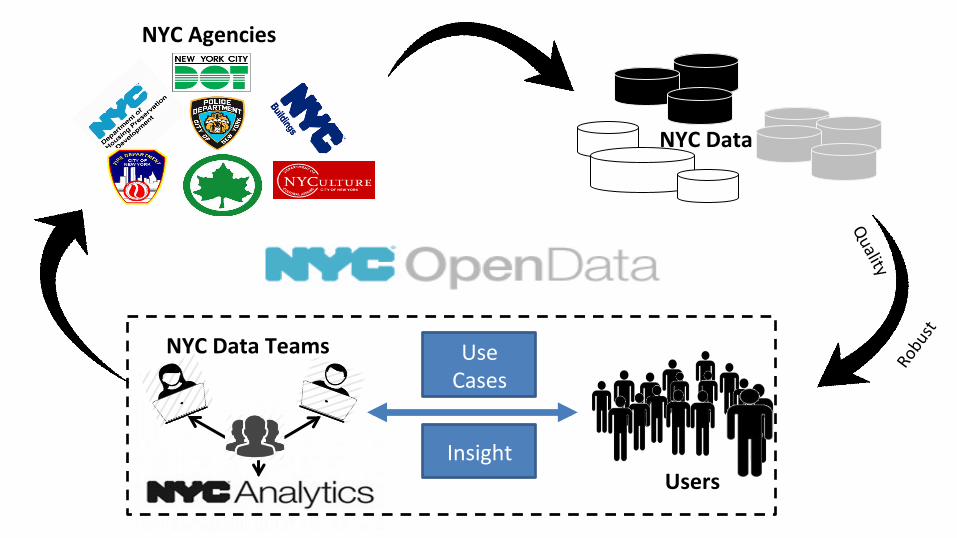
NYC Data
NYC Agencies
Users
NYC Data Teams
Insight
Use Cases
Insight
#gltrain
USING DATA ANALYTICS TO IMPROVE GOVERNMENT
RORY SCHULTZ Client Executive US Department of Agriculture
#gltrain
ALAN FORD Director of Presales Consulting, Teradata Government Systems
USING DATA ANALYTICS TO IMPROVE GOVERNMENT
!
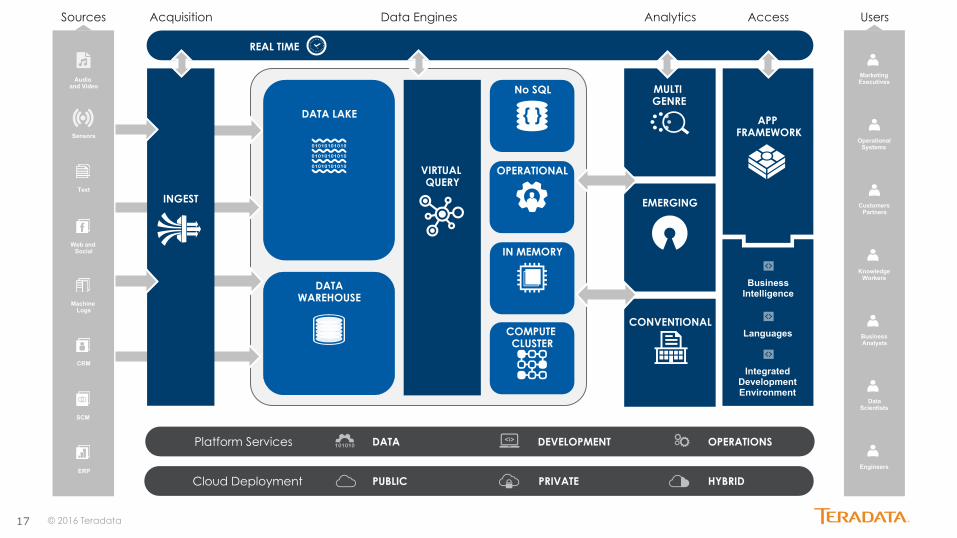
17
REAL TIME
© 2016 Teradata
Acquisition Analytics Access
EMERGING
Data Engines
CONVENTIONAL
MULTI GENRE
DATA WAREHOUSE
IN MEMORY
DATA LAKE
No SQL
COMPUTE CLUSTER
OPERATIONAL
Business Intelligence
Languages
Integrated Development Environment
INGEST
Users
Operational Systems
Customers Partners
Engineers
Data Scientists
Business Analysts
Knowledge Workers
Marketing Executives
Platform Services DEVELOPMENT DATA OPERATIONS
PRIVATE HYBRID Cloud Deployment PUBLIC
Sources
ERP
SCM
CRM
Sensors
Audio and Video
Machine Logs
Text
Web and Social
APP FRAMEWORK
VIRTUAL QUERY

18
REAL TIME
© 2016 Teradata
Acquisition Analytics Access
EMERGING
Data Engines
MULTI GENRE
Aster Analytics
R, Spark, Giraph
SAS, SPSS, KXEN
DATA WAREHOUSE
Teradata Database
IN MEMORY
Hadoop Teradata Database
DATA LAKE
No SQL
COMPUTE CLUSTER
OPERATIONAL
INGEST
Listener
Users
Operational Systems
Customers Partners
Engineers
Data Scientists
Business Analysts
Knowledge Workers
Marketing Executives
Platform Services DEVELOPMENT DATA OPERATIONS
PRIVATE HYBRID Cloud Deployment PUBLIC
Sources
ERP
SCM
CRM
Sensors
Audio and Video
Machine Logs
Text
Web and Social
AppCenter
QueryGrid
VIRTUAL QUERY
Business Intelligence
Languages
Integrated Development Environment
CONVENTIONAL
APP FRAMEWORK

#gltrain
ALAN FORD Director of Presales Consulting, Teradata Government Systems
ASK US YOUR QUESTIONS
AMEN RA MASHARIKI Chief Analytics Officer,
New York
RORY SCHULTZ Client Executive, US
Department of Agriculture
!

#gltrain
TODAY’S SCHEDULE – WHAT’S NEXT? 12:00 PM - 12:50 PM ET Don’t Risk IT: Secure Collaboration Tools for Government 1:00 PM - 1:20 PM ET Virtual Booth Crawl (Break) 1:30 PM - 2:20 PM ET The 3 Most Common Pitfalls to Cloud Migration 2:30 PM - 3:20 PM ET What Does the Future of the Federal Data Center Look Like?
3:30 PM - 4:20 PM ET Connecting Data Silos Inside and Outside Your Agency Virtual Booth Crawl Don’t forget to visit all the booths in the Innovation Center and download resources to qualify for swag. The more active you are the more you’ll get! 4:30 PM ET Career Chat with Steve Ressler, GovLoop’s Founder and President Virtual Summit closes at 5:00 PM ET