using corn stover for ethanol production: a look at the ...aimag/pubs/cornstover.pdf · appendix b:...
TRANSCRIPT
Prepared by Burton English, Jamey Menard, Daniel De La Torre Ugarte Partially Funded by Oak Ridge National Laboratory Contract Number: 4500010956
Using Corn Stover for Ethanol Production: A Look at the Regional Economic Impacts for
Selected Midwestern States
University of Tennessee, Department of Agricultural Economics Knoxville, TN
AIM-AG Agri-Industry Modeling Analysis Group
- - ii
Table of Contents Table of Contents........................................................................................................................ ii List of Tables.............................................................................................................................. iii List of Figures ............................................................................................................................. v Section I. Introduction .............................................................................................................. 1 Section II. Methodology ............................................................................................................ 3
Models Employed in the Analysis ............................................................................... 5 Spreadsheets on Alternative Plant Size.................................................................... 5 POLYSYS................................................................................................................ 5 Determining the Quantity of Corn Stover Available for Ethanol Production ......... 6 ORIBAS................................................................................................................... 7 IMPLAN .................................................................................................................. 7
Total Project Investment (Plant Construction) .................................................... 7 Annual Operating Costs (Variable and Fixed)..................................................... 8 Annual Variable Operating Costs ........................................................................ 9 Annual Fixed Operating Costs............................................................................. 9 Agriculture and Transportation Costs................................................................ 11
Initial Plant Analysis.................................................................................................. 11 State Analysis............................................................................................................. 12
Section III. Results .................................................................................................................. 13 Section IV. Conclusions .......................................................................................................... 18 Section V. Literature Cited...................................................................................................... 20 APPENDICES .......................................................................................................................... 23 APPENDIX A: Information from the Spreadsheets on Alternative Plant Sizes ................ 24
Ethanol Production Process Engineering Analysis................................................ 25 APPENDIX B: Input-Output Analysis.................................................................................. 27
APPENDIX B: Initial Plant Analysis By State......................................................... 28 APPENDIX B: State Impacts Under Full Adoption Assumptions by State for Selected Ethanol Price Scenarios............................................................................... 39
APPENDIX C: Top Ten Sectors Impacted Through Plant Investment, and Annual Operating, Agricultural, and Transportation Expenditures, by State .............................. 101
- - iii
List of Tables
Table 1. Estimated Corn Stover Quantities that can be Collected for Use ..................... 6 Table 2. Project Investment Costs .................................................................................. 8 Table 3. Ethanol Raw Material Input Requirements and IMPLAN Sector Assigned .... 9 Table 4. Annual Variable Operating Costs ................................................................... 10 Table 5. Annual Fixed Operating Costs........................................................................ 10 Table 6. Ethanol Break-Even Corn Stover 2005 Prices................................................ 12 Table 8. Number economically feasible plants by state for selected ethanol price
scenarios, farmer profit scenarios, and two different plant sizes........................... 15 Table 9. Quantity of Stover Required (Thousand MT/year) by state for selected ethanol
price scenarios, farmer profit scenarios, and two different plant sizes.................. 16 Table 10. Quantity of Ethanol Produced (MM Gallons/year) by state for selected
ethanol price scenarios, farmer profit scenarios, and two different plant sizes ..... 17 Appendix Table C1. Top ten sectors impacted through investment expenditures for two
sized plants, Illinois ............................................................................................. 102 Appendix Table C2. Top ten sectors impacted through investment expenditures for two
sized plants, Indiana............................................................................................. 103 Appendix Table C3. Top ten sectors impacted through investment expenditures for two
sized plants, Iowa................................................................................................. 104 Appendix Table C4. Top ten sectors impacted through investment expenditures for two
sized plants, Kansas ............................................................................................. 105 Appendix Table C5. Top ten sectors impacted through investment expenditures for two
sized plants, Illinois ............................................................................................. 106 Appendix Table C6. Top ten sectors impacted through investment expenditures for two
sized plants, Missouri........................................................................................... 107 Appendix Table C7. Top ten sectors impacted through investment expenditures for two
sized plants, Nebraska.......................................................................................... 108 Appendix Table C8. Top ten sectors impacted through investment expenditures for two
sized plants, Ohio................................................................................................. 109 Appendix Table C9. Top ten sectors impacted through investment expenditures for two
sized plants, South Dakota................................................................................... 110 Appendix Table C10. Top ten sectors impacted through investment expenditures for
two sized plants, Wisconsin................................................................................. 111 Appendix Table C11. IMPLAN aggregated sectors for estimating operating cost
impacts ................................................................................................................. 112 Appendix Table C13. Top ten sectors impacted through operating cost expenditures for
two sized plants, Indiana...................................................................................... 117 Appendix Table C14. Top ten sectors impacted through operating cost expenditures for
two sized plants, Iowa.......................................................................................... 118 Appendix Table C15. Top ten sectors impacted through operating cost expenditures for
two sized plants, Illinois Kansas......................................................................... 119 Appendix Table C16. Top ten sectors impacted through operating cost expenditures for
two sized plants, Minnesota................................................................................. 120 Appendix Table C17. Top ten sectors impacted through operating cost expenditures for
two sized plants, Missouri.................................................................................... 121
- - iv
Appendix Table C18. Top ten sectors impacted through operating cost expenditures for two sized plants, Nebraska................................................................................... 122
Appendix Table C19. Top ten sectors impacted through operating cost expenditures for two sized plants, Ohio.......................................................................................... 123
Appendix Table C20. Top ten sectors impacted through operating cost expenditures for two sized plants, South Dakota............................................................................ 124
Appendix Table C21. Top ten sectors impacted through operating cost expenditures for two sized plants, Wisconsin................................................................................. 125
Appendix Table C22. IMPLAN Aggregated Sectors for Agricultural and Transportation Costs..................................................................................................................... 126
Appendix Table C23. Top ten sectors impacted through agricultural cost expenditures for two sized plants, Illinois................................................................................. 128
Appendix Table C24. Top ten sectors impacted through agricultural cost expenditures for two sized plants, Indiana ................................................................................ 129
Appendix Table C25. Top ten sectors impacted through agricultural cost expenditures for two sized plants, Iowa .................................................................................... 130
Appendix Table C26. Top ten sectors impacted through agricultural cost expenditures for two sized plants, Kansas................................................................................. 131
Appendix Table C27. Top ten sectors impacted through agricultural cost expenditures for two sized plants, Minnesota ........................................................................... 132
Appendix Table C28. Top ten sectors impacted through agricultural cost expenditures for two sized plants, Missouri.............................................................................. 133
Appendix Table C29. Top ten sectors impacted through agricultural cost expenditures for two sized plants, Nebraska ............................................................................. 134
Appendix Table C30. Top ten sectors impacted through agricultural cost expenditures for two sized plants, Ohio .................................................................................... 135
Appendix Table C31. Top ten sectors impacted through agricultural cost expenditures for two sized plants, South Dakota ...................................................................... 136
Appendix Table C32. Top ten sectors impacted through agricultural cost expenditures for two sized plants, Wisconsin............................................................................. 137
Appendix Table C33. Top ten sectors impacted through transportation expenditures for two sized plants, Illinois ....................................................................................... 138
Appendix Table C34. Top ten sectors impacted through transportation expenditures for two sized plants, Indiana...................................................................................... 139
Appendix Table C35. Top ten sectors impacted through transportation expenditures for two sized plants, Iowa.......................................................................................... 140
Appendix Table C36. Top ten sectors impacted through transportation expenditures for two sized plants, Kansas ...................................................................................... 141
Appendix Table C37. Top ten sectors impacted through transportation expenditures for two sized plants, Minnesota................................................................................. 142
Appendix Table C38. Top ten sectors impacted through transportation expenditures for two sized plants, Missouri.................................................................................... 143
Appendix Table C39. Top ten sectors impacted through transportation expenditures for two sized plants, Nebraska................................................................................... 144
Appendix Table C40. Top ten sectors impacted through transportation expenditures for two sized plants, Ohio.......................................................................................... 145

- - v
Appendix Table C41. Top ten sectors impacted through transportation expenditures for two sized plants, South Dakota............................................................................ 146
Appendix Table C42. Top ten sectors impacted through transportation expenditures for two sized plants, Wisconsin................................................................................. 147
List of Figures
Figure 1. Number of U.S. Ethanol Plants in Production & Under Construction, 1999.. 3 Figure 2. Methodology Used to Estimate Corn Stover to Ethanol Feasibility ............... 4 Figure 3. Stover Demand for the 1000 MT/Day Plant and the Alternative Pricing
Scenarios ................................................................................................................ 14
Section I. Introduction
Two major themes in Rural America today involve adding value to basic agricultural commodities and increasing farm income. Currently, the agricultural sector is in the midst of decreased farm income caused by reduced export demand and increased production levels. Crop receipts, according to the Economic Research Service, are forecast at $94.1 billion for the year 2000, or $900 million above 1999. While crop receipts are forecasted to increase in 2000, during the previous two years crop income declined by $18 billion. The Economic Research Service has forecasted net farm income to increase $2.2 billion from $43.4 billion in 1999 and $400 million dollars above the 1990-99 average of $45.2 billion. Government assistance of close to $2.7 billion over 1999 payments is primarily the causal factor for this increase (Economic Research Service, 2000).
As agricultural incomes decline, public pressure has increased toward establishing value-added operations in the rural areas. Interest in economic development of rural areas has traditionally focused on manufacturing opportunities and has neglected agricultural value-added prospects. Thus, rural communities either shipped raw commodities out or fed the raw agricultural commodities and shipped livestock from the region.
In a study conducted by the National Renewable Energy Lab (NREL), a review of several reports that analyzed the economic impacts of fuel ethanol was conducted. In this analysis, if was found that “These assessments all predicted substantial economic benefits from increased production of fuel ethanol” (Energetics, Incorporated). For instance, Energetics, Inc. reports that:
• A 1993 United States Department of Agriculture study estimated that increasing ethanol production to 2 billion gallons would create 28,000 new jobs.
• The National Corn Growers Association estimated that currently projected expansion of the ethanol industry through 2000 would create over 273,000 jobs throughout the U.S.
• The U.S. General Accounting Office estimated that an increase of ethanol production to the 2-5 billion gallon level would increase net farm income by 1.3 percent per year or an average of $415 million over the 8-year period of GAO's analysis.
Biomass feedstocks, such as corn fiber, corn stover, bagasse, and rice straw
contain cellulose, which can be converted to sugars that are then fermented to ethanol. New technologies are in process of development that will convert corn stover to ethanol more efficiently. In this process, the agricultural producer harvests the corn and windrows the residues. Following the harvest, the residues are baled, wrapped in a plastic mesh, and transported to the edge of the field. Once at the fields edge, the stover is transported to the ethanol production facility in such a manner that there is 10 days of inventory kept at the ethanol plant. This process creates a byproduct for the farmers to market. The total costs of harvesting and transporting the crop, plus an

- - 2
incentive payment, will be required to entice the producer’s participation. The cost of harvesting and transporting the residue depends on the per acre residue yield.
Recent world oil prices have increased from $9.93 to $30.21 per barrel, a 204% increase, from January 1999 to October 2000. According to the Department of Energy’s Energy Information Administration, today’s prices at the pump, which have approached $1.70/gallon for regular unleaded, are less than the prices experienced in the first half of the 1980’s. However, this lack of stability in oil prices contributes greatly to the difficulty for consumers and businesses to plan and budget (Department of Energy, 2000 and 2001).
Ethanol is a fuel substitute produced from renewable feedstocks. The number of ethanol-fueled vehicles has increased from 1,527 in 1995 to 22,359 in 1999. In terms of fuel combustion, one and a half gallons of ethanol has the same combustion energy as one gallon of gasoline. Ethanol has an octane rating of 110 and is used directly as fuel or as an octane-enhancing gasoline additive. Twelve percent of all U.S. gasoline contains ethanol at a blending percentage of 10%. Blends of 10% ethanol with gasoline can be used in all gasoline-powered automobiles without engine or carburetor modification (Department of Energy, 1999).
The use of ethanol itself, or blended with other automotive fuels, would result in less polluting carbon monoxide and the need of toxic compounds to enhance automotive fuel octane levels. The potential for global warming would decrease because of lower hydrocarbon emissions in the air. Less dependency on foreign oil to satisfy U.S. consumption needs would increase energy and economic security. In addition, as a renewable feedstock, potential benefits from expanded market and additional economic opportunities for farmers and Rural America could be realized (Ontario Corn Producers’ Association, 2000).
To be competitive with existing subsidized fuels, ethanol facilities need to be efficient and economical. Once the corn stover enters the plant it must be handled and pretreated. More specifically, the stover must go through a hydrolysis, fermentation, and distillation process in order to produce ethanol. Next, the stover must pass through an ethanol fermentation and enzyme production process. The product is then purified and the wastewater is treated. One solid by product of the conversion process is lignin, which can be burned to produce steam or electricity. To reduce costs, further research to improve existing separation and conversion technologies and process systems are required. In addition, genetic engineering of agricultural crops, such as corn, to increase carbohydrate levels, is a potential option (Wooley, et al., 1999).
Figure 1 shows the number of ethanol plants throughout the U.S. as of 1999. The majority of the plants, close to 83%, are small facilities producing ethanol at the rate of 0.6 to 42 million gallons annually. Close to 13% of the plants are medium in size with production capacities ranging from 75 to 140 million per year. Large plants, those producing over 200 million gallons per year, comprise 4.3% of the number of plants in the U.S. (Renewable Fuels Association, 1999).

- - 3
Figure 1. Number of U.S. Ethanol Plants in Production & Under Construction, 1999.
The objectives of this research are to provide estimates of economic impacts if ethanol plants are established in the current corn producing states of the United States. The economic impact indicators used in the analysis include total industry output, employment, and value-added. Analysis includes both the impacts that occur with the first most likely plant is constructed and in operation and when all feasible plants are in operation.
Section II. Methodology
There are numerous levels of impacts to a state’s economy as a result of developing a stover to ethanol industry. This section reports the methodologies used to estimate these impacts at two levels. Economic impact analyses for ten single plants (one in each state) are initially conducted. Using this information and information from a GIS system, a statewide economic analysis is conducted. The study generates a lot of information. Consequently, results are summarized in the manuscripts with a complete set of results displayed in Appendices. The estimated economic impacts include those that occur as a result of changes in agriculture, transportation, and plant operation. In addition, impacts that occur as a result of the construction of the plant are examined.
To evaluate the economic impacts of establishing a stover to ethanol industry for this report, both the Policy Analysis System (POLYSYS) and Oak Ridge Integrated Bioenergy Analysis System (ORIBAS) models were used to develop estimates of stover costs both at the farm and plant (Figure 2). Specifically, ORIBAS supplied, for each state and each stover conversion plant, data on harvesting costs, transportation costs, plant location, and quantity of stover supplied from each county. Final data was received in September 2000 from Oak Ridge National Laboratory (ORNL) with a review of that data occurring in October 2000.

4
Figure 2. Methodology Used to Estimate Corn Stover to Ethanol Feasibility
IMPLAN
Plant Construction
Phase
Plant Operation
Phase
National Renewable Energy Lab Report on
Lignocellulosic Conversion
National Renewable Energy Lab Spreadsheet on
Alternative Plant Size
Oak Ridge National Lab Cost of Harvesting
Production Agriculture
Phase
TransportationPhase
ORIBAS Estimates on feedstock and transportation POLYSYS
Estimates on Available Residues

5
Models Employed in the Analysis Four major models were incorporated into the analysis. The models include:
1. Spreadsheets on alternative plant size,
2. POLYSYS,
3. ORIBAS, and
4. IMPLAN.
A summary of each of these models follows.
Spreadsheets on Alternative Plant Size Ethanol plant needs for six different alternatives were provided by NREL. These
alternatives were constructed for a 2000 MT/day plant for the years 2000, 2005, 2010, and 2015 and a 5000 MT/day plant for 2005 and 2010. Based on discussions with ORNL personnel, a scenario for 1000 MT/day was constructed by NREL. After an initial analysis, it was decided that 1000 and 2000 MT/day plant sizes for the year 2005 would be used. Appendix A provides examples of the summary spreadsheet for plants capable of consuming 1000 and 2000 metric ton of corn stover per day. These spreadsheets were used in several ways. First, they provided the necessary information required to model the investment and operating impacts within IMPLAN. In addition, the spreadsheets determined the output ethanol price for pre-specified prices of the feedstock corn stover. Thus, the spreadsheets were used to estimate the amount that the plant could afford to pay for stover under assumed ethanol price scenarios.
POLYSYS
The Policy Analysis System (POLYSYS) modeling framework was developed to simulate changes in policy, economic, or resource conditions, and estimate the resulting impacts for the U.S. agricultural sector. At its core, POLYSYS is structured as a system of interdependent modules simulating (a) crop supply for the continental U.S. divided into 305 production regions, (b) national crop demands and prices, (c) national livestock supply and demand, and (d) agricultural income. The POLYSYS modeling framework is capable of endogenously considering a wide variety of region-specific crop rotations and management practices. POLYSYS anchors its analyses to a published baseline of projections for the agriculture sector. Generally, the benchmark baseline projections and related assumptions for a POLYSYS simulation is one of the following baselines: U.S. Department of Agriculture (USDA), Food and Agriculture Policy Research Institute (FAPRI), or U.S. Congressional Budget Office (CBO). While these baselines generally embody ten-year projection periods, procedures have been developed to expand the baseline up to twenty-five years, allowing POLYSYS to generate simulation results for each year of the projection period (Ray, et al., 1998; Ray D.E., Tiller K.H., De La Torre Ugarte D.G., 1999a; De La Torre Ugarte D.G., Tiller K.H., Ray D.E., 1999b).
Crops endogenously considered in POLYSYS include corn, grain sorghum, oats, barley, wheat, soybeans, cotton, rice, and hay. Endogenous livestock commodities include beef, pork, lamb and mutton, broilers, turkeys, eggs, and milk. For model crop and livestock commodities, POLYSYS simulates the impacts of changes from the baseline upon a variety of national crop
6
and livestock supply and demand variables including planted and harvested acreage, yield, production, exports, costs of production, demand by use, farm price, cash receipts, government program outlays, and net realized income. In addition to estimation of national level variables, POLYSYS also estimates model crops planted and harvested acreage, production, prices, government program participation and payments, production expenses, and net returns for 305 geographic regions with relatively homogeneous production characteristics (corresponding to Agricultural Statistics Districts). Regional POLYSYS variables may also be aggregated to 48 individual states or ten USDA production regions.
In each simulation period (year), the regional crop supply module calculates the expected net returns for each of the rotations available in the region. Regional linear programming models then simultaneously allocate available acreage in each region to model crops and rotations based on expected returns in that region. POLYSYS is capable of handling dry and irrigated land including up to 40 rotational activities per region. This regional crop rotation supply module requires a significant level of region-specific crop, rotation, management practice, and cost of production data.
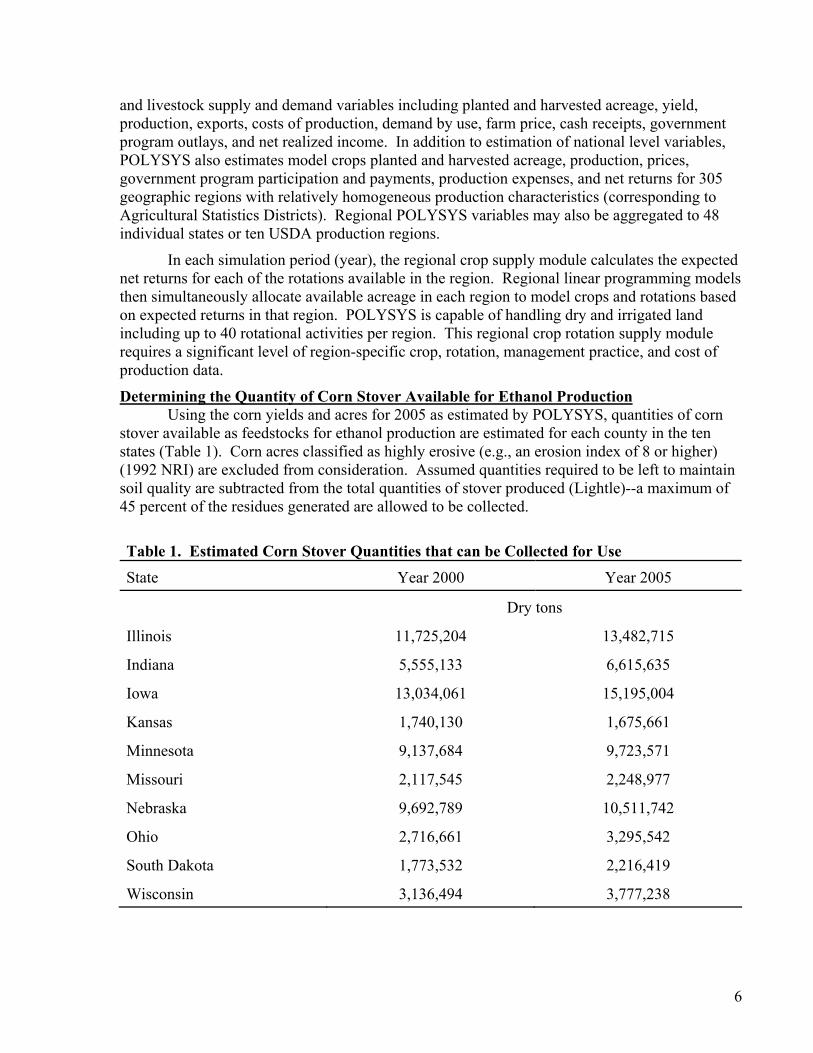
Determining the Quantity of Corn Stover Available for Ethanol Production Using the corn yields and acres for 2005 as estimated by POLYSYS, quantities of corn
stover available as feedstocks for ethanol production are estimated for each county in the ten states (Table 1). Corn acres classified as highly erosive (e.g., an erosion index of 8 or higher) (1992 NRI) are excluded from consideration. Assumed quantities required to be left to maintain soil quality are subtracted from the total quantities of stover produced (Lightle)--a maximum of 45 percent of the residues generated are allowed to be collected.
Table 1. Estimated Corn Stover Quantities that can be Collected for Use
State Year 2000 Year 2005
Dry tons
Illinois 11,725,204 13,482,715
Indiana 5,555,133 6,615,635
Iowa 13,034,061 15,195,004
Kansas 1,740,130 1,675,661
Minnesota 9,137,684 9,723,571
Missouri 2,117,545 2,248,977
Nebraska 9,692,789 10,511,742
Ohio 2,716,661 3,295,542
South Dakota 1,773,532 2,216,419
Wisconsin 3,136,494 3,777,238
7
ORIBAS The Oak Ridge Integrated Bioenergy Analysis System (ORIBAS), a GIS-based
transportation model, is used to estimate the delivered costs of biomass to hypothetical ethanol facilities. ORIBAS includes a complete road network for each state. Corn stover quantities are evenly distributed across each county. ORIBAS locates facilities based on delivered feedstock costs with the first plant having the lowest delivered costs for quantities sufficient to meet its feedstock demands. Subsequent facilities have increasing costs as they must either purchase feedstocks from areas that are more expensive and/or transport feedstocks farther to satisfy their feedstock needs. The cost of delivering residues is estimated along with the location of the stover.
IMPLAN The study relied heavily on input-output analysis to derive economic impacts for
constructing and operating various ethanol production facilities, including farm level stover production and transportation costs, for selected Midwestern states. Input-output analysis creates a picture of a regional economy to describe flows to and from industries and institutions. Input-output analysis is a useful tool to predict changes in overall economic activity as a result of some marginal change. Impacts estimated include total industry output (i.e., the annual value of the production by the industry examined), employment (i.e., total wage and salary employees, both full and part-time, as well as self-employed), and total value added (i.e., employee compensation, proprietary income, other property type income, and indirect business taxes). For each impact category, direct (i.e., changes in the demand for a sector’s product), indirect (i.e., inter-industry purchases resulting from changes in demand for a sector’s product), and induced (i.e., changes in household spending power resulting from changes in demand for a sector’s product) are estimated.
The analyses for the study were based on the IMPLAN ProfessionalTM version 2.0 model using 1996 data. Where appropriate, all data values for the report where deflated to 1996 values. IMPLAN provides economic activity information for approximately 528 industry sectors based on the Standard Industrial Classification (SIC) code system and the Bureau of Economic Analysis Input-Output Sectoring. The ten states chosen for the study were Illinois, Indiana, Iowa, Kansas, Minnesota, Missouri, Nebraska, Ohio, South Dakota, and Wisconsin. The breakeven macroeconomic impacts of the first ethanol facility in each state are estimated. Breakeven costs assume no premium is paid to the farmers to ensure participation (only the cost of collection and transport are included in the feedstock costs) and that the value of the ethanol is the production cost.
Two ethanol prototype facilities were chosen for the analysis based on corn stover feed rates. Analyzed were two ethanol production process technology plants with stover feeds rates of 1,000 MT/day for one plant and 2,000 MT/day for the other. Assumed for the plants are levels of technology expected to exist by the year 2005. The process engineering design and economic information to provide input data for the input-output model were obtained from the NREL’s report entitled, “Lignocellulosic Biomass to Ethanol Process Design and Economics Utilizing Co-Current Dilute Acid Prehydrolysis and Enzymatic Hydrolysis Current and Futuristic Scenarios” (NREL/TP-580-26157). Total Project Investment (Plant Construction)
Based on the NREL report, project investment is comprised of total equipment cost, total installed cost (equipment cost plus warehouse and site development), indirect costs (field

8
expenses, home office and construction fees, and project contingencies), and total capital investment. Proper assignment of these cost categories and their corresponding values to the appropriate IMPLAN industry sectors in the model were required. Warehouse, site development, field expenses, home office and construction fees, including other costs detailed by the report, were assigned to IMPLAN sector 49 – New Industrial/Commercial Buildings. Total equipment costs were assigned to IMPLAN sector 311 – Construction Machinery and Equipment. IMPLAN sector 456, Banking, was selected to account for project contingency and other startup and permit costs. Finally, plant construction utility expenses were assigned to IMPLAN sector 511 – State and Local Electric Utilities.
Project investment costs for the two-ethanol production facilities and the appropriate IMPLAN sectors assigned are presented in Table 2. Project investment costs are considered a one-time start-up expense for constructing the ethanol production facility, not an annual reoccurring economic impact. Each state’s baseline economy from the IMPLAN model was used to generate the economic impacts for this cost category. Impact results are presented in Appendix B. Annual Operating Costs (Variable and Fixed)
The ethanol operating costs for the facilities in the study also required the identification of the IMPLAN industry sectors to capture ethanol production. The SIC category for industrial ethanol production falls in the Industrial Organic Chemicals, Not Elsewhere Classified category, or SIC code 2869. The corresponding IMPLAN industry sector for SIC 2869 is 190 – Cyclic Crudes and Industrial Organic Chemicals. In order to identify the inputs, or commodity goods and services purchased by sector 190 in the baseline IMPLAN model (no ethanol plant), the production function’s gross absorption coefficients were analyzed. Gross absorption coefficients, for IMPLAN analysis, represent a listing of the various commodity inputs required for an industry to produce its final product. Next, input modification adjustments of the gross absorption coefficients were required to account for the new input requirements for the ethanol plant.
Table 2. Project Investment Costs
IMPLAN Code
IMPLAN Sector Value
($ Millions) Year 2005, Feed Rate 1,000 metric tons/day 49 New Industrial & Commercial Buildings $33.83 311 Construction Machinery & Equipment $58.46 456 Banking $9.41 511 State & Local Electric Utilities $2.20 Total $103.90 Year 2005, Feed Rate 2,000 metric tons/day 49 New Industrial & Commercial Buildings $55.70 311 Construction Machinery & Equipment $96.28 456 Banking $15.51 511 State & Local Electric Utilities $3.70 Total $171.19

9
Annual Variable Operating Costs The NREL supplied a detailed listing of raw material input requirements and expenses
for each of the production facilities. The sequence for running the operating cost models consisted of, first, aggregating the model and then adjusting sector 190 for changes in value added, labor, and increases in total industry output (detailed in next section). Next, the gross absorption coefficients were changed to complete the operating cost analysis. The raw material input requirements and the appropriate IMPLAN sectors in which they were assigned are presented in Table 3.
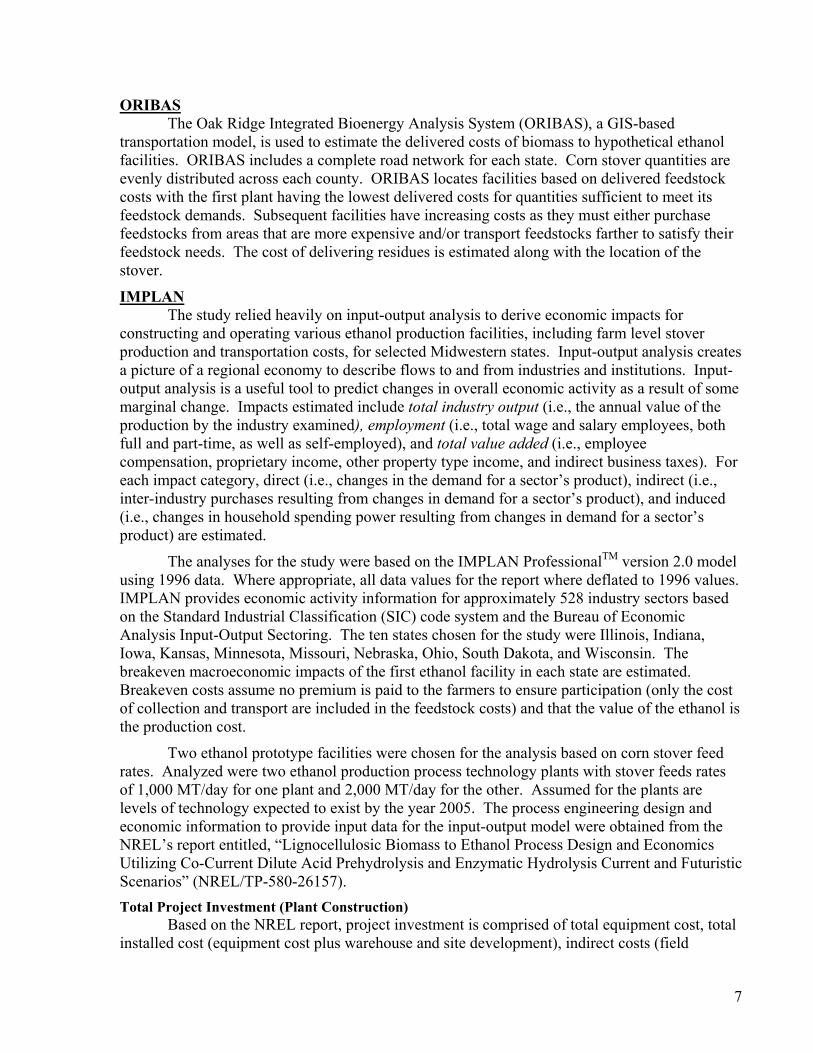
The annual variable operating costs for the ethanol facilities are presented in Table 4. In addition, numerous sectors in the IMPLAN model were aggregated to simplify data entry and for ease of reporting study results. Impact analysis was conducted next. Values to conduct the impact analysis for each production scenario were derived by multiplying ethanol production costs ($/gallon) and quantity of ethanol produced (million gallons/year). The ethanol production process engineering analysis sheets in Appendix A provides this information. Annual Fixed Operating Costs
Fixed annual operating expenses required adjustments for personnel salaries, plus insurance and tax expenses. Modifications for these costs were adjusted in IMPLAN’s sector 190 value added categories for employee compensation and indirect business taxes, respectively. Physical plant maintenance costs were assigned to IMPLAN sector 56 – Maintenance and Repair Other Facilities. Overhead and maintenance costs, a financial expense, were equally divided between sector 459, Insurance Carriers, and 507, Accounting, Auditing and Bookkeeping. For each ethanol producing facility in the study, an additional 53 employees were also assigned to the model to reflect plant personnel requirements. Sector 190’s total industrial output was adjusted for the additional revenue generated from ethanol production (ethanol production costs × ethanol production in MM gallons/year) for each of the prototype plants. Annual fixed operating costs for each of the production facilities are presented in Table 5. Impact results for the annual operating costs (variable and fixed) are presented in Appendix B.
Table 3. Ethanol Raw Material Input Requirements and IMPLAN Sector Assigned Raw Material IMPLAN Sector
Feedstock 524-Rest of the World Industry* H2SO4, Other Chemical and Nutrients 189-Inorganic Chemicals N.E.C. Lime 245-Lime NH3, Nutrients, Ammonium Sulfate 202-Nitrogenous and Phosphatic Fertilizers Corn Steep Liquor, Antifoam 76-Wet Corn Milling Diesel 210-Petroleum Refining Makeup Water 445-Water Supply and Sewerage Systems Solid Disposal 446-Sanitary Services and Steam Supply Electricity (credit) 443-Electrical Services *Feedstock was assigned to Sector 524 to alleviate potential double counting of inputs from other industry sectors.
10
Table 4. Annual Variable Operating Costs
IMPLAN Code
IMPLAN Sector Value
($ Millions) Year 2005, Feed Rate 1,000 metric tons/day: 76 Wet Corn Milling $1.50 189 Inorganic Chemicals N.E.C. $0.46 202 Nitrogenous & Phosphatic Fertilizers $0.23 210 Petroleum Refining $0.29 245 Lime $0.92 443 Electric Services (Credit) -$4.06 445 Water Supply & Sewerage Systems $0.17 446 Sanitary Services and Steam Supply $1.09 524 Feedstock $9.49 Total $10.09 190 (Direct Impact) Cyclic Crude $32.20 Year 2005, Feed Rate 2,000 metric tons/day: 76 Wet Corn Milling $3.05 189 Inorganic Chemicals N.E.C. $0.94 202 Nitrogenous & Phosphatic Fertilizers $0.46 210 Petroleum Refining $0.58 245 Lime $1.89 443 Electric Services (Credit) -$8.08 445 Water Supply & Sewerage Systems $0.35 446 Sanitary Services and Steam Supply $2.15 524 Feedstock $18.89 Total $20.23 190 (Direct Impact) Cyclic Crude $57.80
Table 5. Annual Fixed Operating Costs
IMPLAN Code
IMPLAN Sector Value
($ Millions) Year 2005, Feed Rate 1,000 metric tons/day: 56 Maintenance and Repair Other Facilities $1.20 459 Insurance Carriers $.08 507 Accounting, Auditing and Bookkeeping $.08 VA Adjustment Employee Compensation $.28 VA Adjustment Indirect Business Taxes $.95 Total $2.59 Year 2005, Feed Rate 2,000 metric tons/day: 56 Maintenance and Repair Other Facilities $1.97 459 Insurance Carriers $0.46 507 Accounting, Auditing and Bookkeeping $0.46 VA Adjustment Employee Compensation $1.64 VA Adjustment Indirect Business Taxes $1.56 Total $6.09 VA=Value Added

11
Agriculture and Transportation Costs To properly allocate the agricultural costs for the production of corn stover the quantity
demanded for each of the prototype plants had to be determined. The ORNL provided this information, including farm-gate prices and transportation costs from the farm-gate to the plant-gate for each state. The term Total Farm Value (TFV) was calculated by multiplying the farm-gate price (deflated) and the quantity of tonnes demanded. The agricultural, or collection cost percentages, for corn stover was a percentage of the TFV. Again, this information was provided by ORNL. The collection costs and their corresponding distribution percentages are Capital Costs (depreciation-24 %), Nonland Capital Costs (opportunity cost of ownership-7%), Repair Costs (34%), Fuel/Lube Costs (7%), Labor (13%), and Mesh Wrap (15%).
Similar to the ethanol production facility analysis, proper allocation of agricultural costs to the appropriate IMPLAN industry sector for corn production was required. The SIC category for corn production is 0115. The corresponding industry in IMPLAN is sector 12 – Feed Grains. Likewise, the gross absorption coefficients for sector 12’s production function required adjusting. Mesh wrap was assigned to IMPLAN sector 220 – Miscellaneous Plastic Products, capital costs (depreciation) to sector 309 – Farm Machinery and Equipment, fuel/lube costs to sector 451 – Automotive Dealers and Service Stations, and repair costs to sector 482 – Miscellaneous Repair Shops. Labor and nonland capital cost values were assigned to IMPLAN’s total value added categories employee compensation and other property income categories, respectively.
The sequence for running the agricultural and transportation cost models consisted of, first, aggregating a state baseline model and then adjusting total industry output values. Next, gross absorption coefficient adjustments for sector 12 were required. After the above procedures, impact analysis was conducted for labor and nonland capital costs. Once these impacts were conducted a transportation cost impact analysis was performed. Transportation costs were assigned to sector 435 – Motor Freight Transport and Warehousing. Appendix B contains both agriculture and transportation impact results.
Initial Plant Analysis The ORIBAS model provided two data sets for both ethanol production process scenarios
analyzed (year 2005 and 1,000/2,000 MT/day feed rates). The first data set contained pixel information including cost of harvesting biomass, cost of transporting the biomass to the plant, and the quantity of biomass harvested. The second set of data identified the county location of the plant. This data set contains the average cost of the biomass delivered to the plant and the state-county FIPS location code.
Average and marginal costs of supplying biomass to the plant from both the farm and the transportation firm were estimated for each plant and scenario combination. Total farm gate costs (TFGC) for plant (j) were estimated using a weighted sum of the farm gate break-even price (FGP) for each pixel (i) provided by ORIBAS multiplied by the quantity (QCS) supplied at each pixel (i) to plant (j) (equation 1).
∑=i
jiij QCSFGPTFGC ,* 1
Total transportation costs (TTC) were established in a similar manner. Transportation costs (TC) from pixel (i) to plant (j) were multiplied by the amount transported (QCS) to plant (j) from pixel (i) (equation 2).

12
∑=i
jijij QCSTCTC ,, * 2
State Analysis For state analysis, the pixel data for each of the ten states provided from ORIBAS was
converted to a comma separated data set using SAS. These files were then imported into Access and a set of queries were constructed to estimate total cost of the residues to the farm and transportation sector, along with the total quantity supplied from each county to given plant. These data files were then exported into Excel. SAS was then used to import the Excel spreadsheet to develop total impact estimates for each plant size, three ethanol price scenarios ($1.15, $1.25, and $1.35/gallon), and three farmer profit scenarios (0%, 15%, and 30% of the breakeven corn stover price).
Information provided by NREL (Table 6) was used to determine the amount the two different 2005 plant sizes could afford to pay for corn stover. Prices were then compared to GIS generated and the adjusted average stover price delivered to the plant. If the plant-average stover price was less than the break-even corn stover price, the plant was included. Agriculture and operating impacts for a single plant were multiplied by the number of plants. These impacts were added to transportation sector impacts adjusted to reflect the increase in transportation costs
and economic activity as more plants are incorporated.
Once the number of plants was estimated, the amount of corn stover required, along with the amount of ethanol produced on a yearly basis, was determined for each state in the analysis. This was achieved by multiplying the appropriate factor listed in Table 7 by the number of plants. The state analysis results are reported in Appendix B.
Table 6. Ethanol Break-Even Corn Stover 2005 Prices Ethanol Price ($/gallon)
Plant Size $1.15 $1.25 $1.35 1,000 $28.67 $36.40 $44.10 2,000 $39.50 $47.20 $54.91
Table 7. Parameters Used to Estimate Corn Stover Requirements and Ethanol Production Levels
Plant Size Parameter 1,000 MT/day 2,000 MT/day Stover (MT/year) 363,000 726,000 Production (MM gallons/plant/year) 30.4 60.8

13
Section III. Results
Appendix A contains the ethanol production process engineering analysis summary sheets from NREL for each of the production scenarios analyzed in the study. Ethanol production, feed rates, and capital/operating costs were all important variables included in the IMPLAN model and/or impact runs.
Appendix B contains estimated impact results for both initial plant and state level analyses for all states and for each production scenario. More specifically, for the initial plant analysis, estimated economic impact results for project investment, operating, agricultural, and transportation are given. Direct, indirect, and induced impacts for total industry output, employment, and total value added are the economic variables measured. For the state level of analysis, estimated economic impact results for each plant size and both ethanol price and farmer profit scenarios on an annual operating basis. Annual operating impacts are the sum of the estimated individual impacts for agricultural, transportation, and operating.
The top ten IMPAN sectors impacted based on total industry output for each state and production scenario is presented in Appendix C. The top ten impacted sectors are given for investment, operating, agriculture, and transportation impacts. In addition, for those sectors that were aggregated (noted with an asterisk), the aggregation scheme is also included for ease of reference. Agricultural and transportation have the same aggregation scheme, whereas for operating, the aggregation scheme is difference.
For investment in each of the ten states, the predominant sectors impacted were construction machinery and equipment, new industrial and commercial buildings, banking, wholesale trade, owner-occupied dwellings, real estate, engineering and architectural services, motor freight transport and warehousing, state and local electric utilities, plus eating and drinking. For operating, the predominant sectors impacted were cyclic crudes and industrial organic chemicals, wholesale trade, retail trade, chemical and allied, professional services, business services, real estate, petroleum refining, owner-occupied dwellings, and wet corn milling. Likewise, for agriculture, feed grains, real estate, chemical and allied, owner-occupied dwellings, petroleum and related products, motor freight transport and warehouse, utility services, maintenance/repair other facilities, and state and local governments were the predominant sectors impacted. Finally, for transportation, the predominant sectors impacted were motor freight transport and warehouse, petroleum and related products, automobile repair and services, real estate, owner-occupied dwellings, utility services, transportation services, business services, eating and drinking, and state and local governments.
When using an ethanol price of $1.35 and 30% profit level for the agricultural producer, a total of 118 plants are feasible with Iowa constructing 31, followed by Illinois (26) and Minnesota and Nebraska (19), 1000 MT/day corn stover to ethanol processing plants (Table 8). Slightly more than one-half of the plants (67) are estimated constructed under the 2000 MT/day plant size assumption since a larger quantity of stover is demanded for each plant constructed.
Under each stover ethanol-price scenario combination, more stover is processed under the 2000 MT/day processing facility compared to the 1000 MT/day processing facility (Table 9). For the 1000 MT/day processing facility, more than twice as much stover is demanded under the $1.35/gallon ethanol price and 30% profit level compared to the same profit level for the $1.25/gallon ethanol price. Increasing farmer profits significantly reduces stover demand as

14
show in Figure 3. Analysis is similar for the 2000 MT/day plant. More plants are feasible in the $1.15 price scenario and 15% and 30% increase in revenue to the farmers’ solutions for the 2000 MT/day than the 1000 MT/day. Ethanol production follows stover use patterns. Over 1 billion gallons can be produced in Iowa under the $1.35 ethanol price breakeven scenario for the 1000 MT/day plant. Likewise, for the 2000 MT/day plant, Iowa is estimated to produce over 1 billion gallons of ethanol under the $1.35 ethanol price for the breakeven, 15%, and 30% profit level scenarios (Table 10).
Figure 3. Stover Demand for the 1000 MT/Day Plant and the Alternative Pricing Scenarios
0
20
40
60MT/day
1.15 1.25 1.35Ethanol Price Scenario
Average 15% 30%
Million
0
20
40
60MT/day
1.15 1.25 1.35Ethanol Price Scenario
Average 15% 30%Average 15% 30%
Million

15
Table 8. Number economically feasible plants by state for selected ethanol price scenarios, farmer profit scenarios, and two different plant sizes
State Ethanol Price = $1.15 and
profit level at: Ethanol Price = $1.25 and
profit level at: Ethanol Price = $1.35 and
profit level at: Ave. + 15% + 30% Ave. + 15% + 30% Ave. + 15% + 30%
Plant Size = 1,000 MT/day: Illinois 3 0 0 23 19 14 29 28 26 Indiana 0 0 0 10 7 1 13 11 10 Iowa 7 0 0 27 25 18 33 32 31 Kansas 0 0 0 2 0 0 2 2 2 Minnesota 3 0 0 17 14 10 20 19 19 Missouri 0 0 0 2 1 1 2 2 2 Nebraska 4 0 0 18 16 9 22 22 19 Ohio 0 0 0 4 1 0 6 5 4 S. Dakota 0 0 0 1 1 0 2 2 1 Wisconsin 0 0 0 4 2 0 7 5 4
Total 17 0 0 108 86 53 136 128 118 Plant Size = 2,000 MT/day Illinois 12 11 7 13 13 12 15 14 14 Indiana 5 3 1 6 6 5 7 7 6 Iowa 14 13 10 16 16 15 18 18 17 Kansas 0 0 0 0 0 0 1 1 0 Minnesota 8 7 5 10 9 9 10 10 10 Missouri 0 0 0 0 0 0 2 1 1 Nebraska 9 7 5 11 10 9 11 11 11 Ohio 2 1 0 3 2 2 3 3 3 S. Dakota 1 0 0 1 1 1 1 1 1 Wisconsin 1 1 0 3 3 2 4 4 4
Total 52 43 28 63 60 55 72 70 67

16
Table 9. Quantity of Stover Required (Thousand MT/year) by state for selected ethanol price scenarios, farmer profit scenarios, and two different plant sizes
State Ethanol Price = $1.15 and
profit level at: Ethanol Price = $1.25 and
profit level at: Ethanol Price = $1.35 and profit
level at: Average + 15% + 30% Average + 15% + 30% Average + 15% + 30%Plant Size = 1,000 MT/day with Stover Requirements = 363,000 MT/year: Illinois 1,089 0 0 8,349 6,897 5,082 10,527 10,164 9,438Indiana 0 0 0 3,630 2,541 363 4,719 3,993 3,630Iowa 2,541 0 0 9,801 9,075 6,534 11,979 11,616 11,253Kansas 0 0 0 726 0 0 726 726 726Minnesota 1,089 0 0 6,171 5,082 3,630 7,260 6,897 6,897Missouri 0 0 0 726 363 363 726 726 726Nebraska 1,452 0 0 6,534 5,808 3,267 7,986 7,986 6,897Ohio 0 0 0 1,452 363 0 2,178 1,815 1,452S. Dakota 0 0 0 363 363 0 726 726 363Wisconsin 0 0 0 1,452 726 0 2,541 1,815 1,452
Total 6,171 0 0 39,204 31,218 19,239 49,368 46,464 42,834
Plant Size = 2,000 MT/day with Stover Requirements = 726,000 MT/year: Illinois 8,712 7,986 5,082 9,438 9,438 8,712 10,890 10,164 10,164Indiana 3,630 2,178 726 4,356 4,356 3,630 5,082 5,082 4,356Iowa 10,164 9,438 7,260 11,616 11,616 10,890 13,068 13,068 12,342Kansas 0 0 0 0 0 0 726 726 0Minnesota 5,808 5,082 3,630 7,260 6,534 6,534 7,260 7,260 7,260Missouri 0 0 0 0 0 0 1,452 726 726Nebraska 6,534 5,082 3,630 7,986 7,260 6,534 7,986 7,986 7,986Ohio 1,452 726 0 2,178 1,452 1,452 2,178 2,178 2,178S. Dakota 726 0 0 726 726 726 726 726 726Wisconsin 726 726 0 2,178 2,178 1,452 2,904 2,904 2,904
Total 37,752 31,218 20,328 45,738 43,560 39,930 52,272 50,820 48,642

17
Table 10. Quantity of Ethanol Produced (MM Gallons/year) by state for selected ethanol price scenarios, farmer profit scenarios, and two different plant sizes
State Ethanol Price = $1.15 and
profit level at: Ethanol Price = $1.25 and
profit level at: Ethanol Price = $1.35 and profit
level at: Average + 15% + 30% Average + 15% + 30% Average + 15% + 30%Plant Size = 1,000 MT/day with Stover Requirements = 363,000 MT/year: Illinois 91.2 0 0 699.2 577.6 425.6 881.6 851.2 790.4Indiana 0.0 0 0 304.0 212.8 30.4 395.2 334.4 304.0Iowa 212.8 0 0 820.8 760.0 547.2 1,003.2 972.8 942.4Kansas 0.0 0 0 60.8 0 0 60.8 60.8 60.8Minnesota 91.2 0 0 516.8 425.6 304.0 608.0 577.6 577.6Missouri 0.0 0 0 60.8 30.4 30.4 60.8 60.8 60.8Nebraska 121.6 0 0 547.2 486.4 273.6 668.8 668.8 577.6Ohio 0.0 0 0 121.6 30.4 0 182.4 152.0 121.6S. Dakota 0.0 0 0 30.4 30.4 0 60.8 60.8 30.4Wisconsin 0.0 0 0 121.6 60.8 0 212.8 152.0 121.6
Total 516.8 0 0 3,283.2 2,614.4 1,611.2 4,134.4 3,891.2 3,587.2
Plant Size = 2,000 MT/day with Stover Requirements = 726,000 MT/year: Illinois 729.6 668.8 425.6 790.4 790.4 729.6 912.0 851.2 851.2Indiana 304.0 182.4 60.8 364.8 364.8 304.0 425.6 425.6 364.8Iowa 851.2 790.4 608.0 972.8 972.8 912.0 1,094.4 1,094.4 1,033.6Kansas 0 0 0 0 0 0 60.8 60.8 0Minnesota 486.4 425.6 304.0 608.0 547.2 547.2 608.0 608.0 608.0Missouri 0 0 0 0 0 0 121.6 60.8 60.8Nebraska 547.2 425.6 304.0 668.8 608.0 547.2 668.8 668.8 668.8Ohio 121.6 60.8 0 182.4 121.6 121.6 182.4 182.4 182.4S. Dakota 60.8 0 0 60.8 60.8 60.8 60.8 60.8 60.8Wisconsin 60.8 60.8 0 182.4 182.4 121.6 243.2 243.2 243.2
Total 3,161.6 2,614.4 1,702.4 3,830.4 3,648.0 3,344.0 4,377.6 4,256.0 4,073.6

18
Section IV. Conclusions
This study responds to two major current themes in Rural America, adding value to basic agricultural commodities and increasing farm income. A mean to complement the economic needs of rural areas with the need for a more reliable and steady source of energy is the increase production of ethanol. Economic analyses of increased ethanol production have indicated the potential for substantial benefits (Energetics, Incorporated). Moreover, new technologies that will convert corn stover to ethanol more efficiently are in the horizon.
The objectives of this research were to estimate the economic impacts if ethanol plants were established in the current corn producing states of the United Sates. These impacts include the construction and operation phase of the plants, and relate to the total industry output, number of new jobs, and value-added generated in each of the states.
The results of the study indicate that in every state analyzed the construction and operation of an ethanol plant provides substantial estimated economic impacts for total industry output, employment, and value-added. For example, the number of new jobs generated in the construction phase ranges from 1,712 to 2,117 in a plant processing 1000 MT of corn stover a day. The corresponding number of jobs generated in the annual operation phase ranges from 576 to 910. In the case of an ethanol plant processing 2000 MT/day, the number of jobs created ranges from 2,820 to 3,489, and from 1,104 to 2,107 respectively.
The study also showed that the number of feasible ethanol plants in each state could vary substantially based on the prices of ethanol and corn stover and plant size. The smaller plant size, 1000 MT/day of corn stover, is much more sensitive to the prices of ethanol than to the price of the corn stover. While 17 plants are feasible if the ethanol price is at $1.15/gallon and the corn stover is at the breakeven price, 136 plants are feasible if the price of ethanol is $1.35/gallon at a breakeven stover price. Furthermore, if the corn stover is priced 30% above the breakeven price, the number of feasible plants changes from 0 to 118, as the price of ethanol increases from $1.15 to $1.35/gallon. The economies of size present in the larger plant, 2000 MT/day, make this plant less sensitive to the changes in prices as the number of plants ranges from 52 to 72, and from 28 to 67 in the corresponding two price scenarios outlined above for the 1000 MT/day plant.
Finally, the economic potential of increased ethanol production can be better summarized when considering the case where producers are guaranteed $1.35/gallon at a breakeven price scenario for a 1000 MT/day plant. For this scenario, an estimated 136 plants would be constructed, 4,134 million gallons of ethanol would be produced, $963 million in gross income to agricultural producers would occur, and an estimated economic impact of $11 billion in rural economies of the ten state region would be realized. In addition, there would be more than 261,000 new jobs generated in the region during the construction phase, and 96,650 new jobs will be sustained by the operation of these plants.

19

20
Section V. Literature Cited
De La Torre Ugarte D.G., Tiller K.H., Ray D.E. 1999b. The POLYSYS Modeling Framework: A Guide for Users. Staff paper, Agricultural Policy Analysis Center, Dept. of Agricultural Economics, The University of Tennessee, Knoxville.
Energetics, Incorporated. Fuel Ethanol "Special Studies". Available at http://rredc.nrel.gov/ biomass/doe/rbep/ethanol.
Lightle, D.T. 1997. U.S. Department of Agriculture, Natural Resources Conservation Service. Personal communication with Marie Walsh.
Micro Implan User's Guide. 1999. Minnesota Implan Group. Stillwater, MN, Version 2.0.
Ontario Corn Producers’ Association. 2000. Available at http://www.ontariocorn.org/ ethahome.html.
Ray D.E., De La Torre Ugarte D.G., Dicks M.R., Tiller K.H. 1998. The POLYSYS Modeling Framework: A Documentation. Staff paper, Agricultural Policy Analysis Center, Dept. of Agricultural Economics, The University of Tennessee, Knoxville.
Ray D.E., Tiller K.H., De La Torre Ugarte D.G. 1999a. The POLYSYS Modeling Framework: An Overview. Staff paper, Agricultural Policy Analysis Center, Dept. of Agricultural Economics, The University of Tennessee, Knoxville.
Renewable Fuels Association. 1999. The Ethanol Industry Outlook – 1999 and Beyond, Available at http://www.ethanolrfa.org/.
U.S. Department of Agriculture, Economic Research Service. 2000. Agriculture Income and Finance – Summary. ERS-AIS-75. Available at http://usda.mannlib.cornell.edu/reports/ erssor/economics/ais-bb/2000/ais75s.asc.
U.S. Department of Agriculture, Natural Resource Conservation Service. 1997 National Resource Inventory. Available at http://www.nhq.nrcs.usda.gov/land/index/ nri97maps.html.
U.S. Department of Energy. 1999. Health and Environmental Assessment of the Use of Ethanol as a Fuel Oxygenate, UCRL-AR-135949. Alternative-Fueled Vehicles and Fuel Consumption by Type, 1992-1999. Available at http://www.eia.doe.gov/ emeu/aer/renew.html.
U.S. Department of Energy. 2000. Gasoline Prices in Inflation-Adjusted Terms. Available at http://www.eia.doe.gov/pub.oil_gas/petroleum/presentations/2000.
U.S. Department of Energy. 2001. World Crude Oil Prices. Available at http//www.eia.doe.gov/ oil_gas/petroleum/info_glance/prices.html.

21
Wooley, Ruth, Sheehan, Ibsen, Majdeski, and Galvez. 1999. Lignocellulosic Biomass to Ethanol Process Design and Economics Utilizing Co-Current Dilute Acid Prehydrolysis and Enzymatic Hydrolysis Current and Futuristic Scenarios. National Renewable Energy Laboratory, NREL/TP-580-26157.

22

23
APPENDICES

24
APPENDIX A: Information from the Spreadsheets on Alternative Plant Sizes

25
Appendix A. Exhibit 1
Ethanol Production Process Engineering Analysis Year 2005 Case Co-Current Pretreatment & Enzymatic Hydrolysis
All Values in 1997$ Revised Corn Stover Composition Ethanol Production Cost $1.07
Feed Rate (MT/day): 1,000 Ethanol Production (MM Gal./Year): 30.4 Ethanol at 68 degrees F Ethanol Yield (Gal/Dry US Ton Feedstock: 79 Feedstock Cost $/Dry US Ton: 25 Capital Costs Operating Costs (cents/gal ethanol) Feed Handling $2,800,000 Feedstock 31.8Pretreatment/Detox $6,300,000 CSL 4.3SSCF $6,800,000 Other Raw Materials 7.7Cellulase $3,000,000 Waste Disposal 3.6Distillation $9,800,000 Electricity -13.6WWT $3,500,000 Fixed Costs 8.9Storage $900,000 Capital Recovery 64.3Boiler/Turbogen $25,800,000 Utilities $2,200,000 Operating Costs ($/yr) Feedstock $9,700,000Total Equip. Cost $61,100,000 CSL $1,300,000 Other Raw Matl. Costs $2,300,000Added Costs $44,100,000 Waste Disposal $1,100,000 (% of TPI) 42% Electricity Credit -$4,100,000 Fixed Costs $2,600,000Total Project Inv. $105,200,000 Capital Recovery $19,600,000 Cap. Recovery Factor 0.186 Excess Electricity (KWH/gal) 16.696Total Maximum (MM Gal/yr) Maximum Yield (Gal/ton) Boiler Feed--LHV (Btu/lb) 3,518Current Yield (Actual/Theor) Boiler Feed--Water Fraction 0.524

26
Appendix A. Exhibit 2
Ethanol Production Process Engineering Analysis Year 2005 Case Co-Current Pretreatment & Enzymatic Hydrolysis
All Values in 1997$ Revised Corn Stover Composition
Ethanol Production Cost $0.96 Feed Rate (MT/day): 2,000 Ethanol Production (MM Gal./Year): 60.8 Ethanol at 68 degrees F Ethanol Yield (Gal/Dry US Ton Feedstock: 79 Feedstock Cost $/Dry US Ton: 25 Capital Costs Operating Costs (cents/gal ethanol) Feed Handling $5,000,000 Feedstock 31.8Pretreatment/Detox $10,100,000 CSL 4.3SSCF $9,300,000 Other Raw Materials 7.7Cellulase $6,200,000 Waste Disposal 3.6Distillation $16,500,000 Electricity -13.4WWT $5,400,000 Fixed Costs 10.3Storage $1,600,000 Capital Recovery 52Boiler/Turbogen $42,900,000 Utilities $3,700,000 Operating Costs ($/yr) Feedstock $19,300,000Total Equip. Cost $100,700,000 CSL $2,600,000 Other Raw Matl. Costs $4,700,000Added Costs $72,600,000 Waste Disposal $2,200,000 (% of TPI) 42% Electricity Credit -$8,100,000 Fixed Costs $6,200,000Total Project Inv. $173,300,000 Capital Recovery $31,600,000 Cap. Recovery Factor 0.182 Excess Electricity (KWH/gal) 3.298Total Maximum (MM Gal/yr) 87.6 Maximum Yield (Gal/ton) 113.4 Boiler Feed--LHV (Btu/lb) 3,535Current Yield (Actual/Theor) 69% Boiler Feed--Water Fraction 0.522

27
APPENDIX B: Input-Output Analysis

28
APPENDIX B: Initial Plant Analysis By State

29
Initial Ethanol Plant Impacts - Illinois
Year 2005; MT/day 1,000 Year 2005; MT/day 2,000 Direct Indirect Induced Total Direct Indirect Induced Total Project Investment TIO ($ millions) 103.90 36.87 71.42 212.18 171.19 60.74 117.67 349.60 Jobs (number) 576 367 918 1,861 948 605 1,513 3,066 TVA ($ millions) 43.50 21.14 44.74 109.37 71.68 34.83 73.71 180.21 Operating TIO ($ millions) 32.20 17.37 19.99 69.56 57.80 31.06 35.72 124.57 Jobs (number) 62 124 257 443 110 221 460 791 TVA ($ millions) 10.06 8.85 12.51 31.42 17.97 15.79 22.36 56.13 Agriculture TIO ($ millions) 6.53 2.80 4.21 13.54 13.13 5.64 8.47 27.24 Jobs (number) 59 21 54 134 119 43 109 271 TVA ($ millions) 2.60 1.50 2.63 6.73 5.22 3.01 5.29 13.53 Transportation TIO ($ millions) 3.43 2.29 3.03 8.76 8.57 5.74 7.57 21.88 Jobs (number) 31 21 38 90 77 53 97 228 TVA ($ millions) 1.52 1.17 1.90 4.59 3.78 2.95 4.74 11.47
Annual Impacts (Operating + Agriculture + Transportation) TIO ($ millions) 79.50 42.44 51.75 173.69 42.16 22.47 27.24 91.86 Jobs (number) 152 166 349 667 306 318 666 1,289 TVA ($ millions) 14.18 11.52 17.05 42.74 26.98 21.75 32.40 81.13

30
Initial Ethanol Plant Impacts - Indiana
Year 2005; MT/day 1,000 Year 2005; MT/day 2,000 Direct Indirect Induced Total Direct Indirect Induced Total Project Investment TIO ($ millions) 103.90 33.00 54.69 191.59 171.19 54.37 90.12 315.69 Jobs (number) 675 377 820 1,872 1,112 621 1,351 3,084 TVA ($ millions) 35.39 17.48 32.87 85.74 58.33 28.80 54.16 141.28 Operating TIO ($ millions) 32.20 14.39 17.17 63.76 57.80 25.31 30.12 113.23 Jobs (number) 63 115 255 433 110 203 447 760 TVA ($ millions) 9.61 7.10 10.20 26.91 16.94 12.32 17.92 47.17 Agriculture TIO ($ millions) 6.99 2.31 3.89 13.19 14.04 4.66 7.80 26.49 Jobs (number) 81 22 58 161 162 44 116 322 TVA ($ millions) 2.58 1.26 2.33 6.17 5.17 2.54 4.67 12.38 Transportation TIO ($ millions) 3.66 2.13 2.69 8.48 9.01 5.25 6.65 20.90 Jobs (number) 35 22 40 97 86 55 99 241 TVA ($ millions) 1.52 1.04 1.62 4.18 3.77 2.55 4.00 10.32
Annual Impacts (Operating + Agriculture + Transportation) TIO ($ millions) 80.85 35.21 44.56 160.62 42.85 18.83 23.74 85.42 Jobs (number) 179 158 354 691 358 302 663 1,323 TVA ($ millions) 13.71 9.40 14.15 37.26 25.87 17.41 26.59 69.87
31
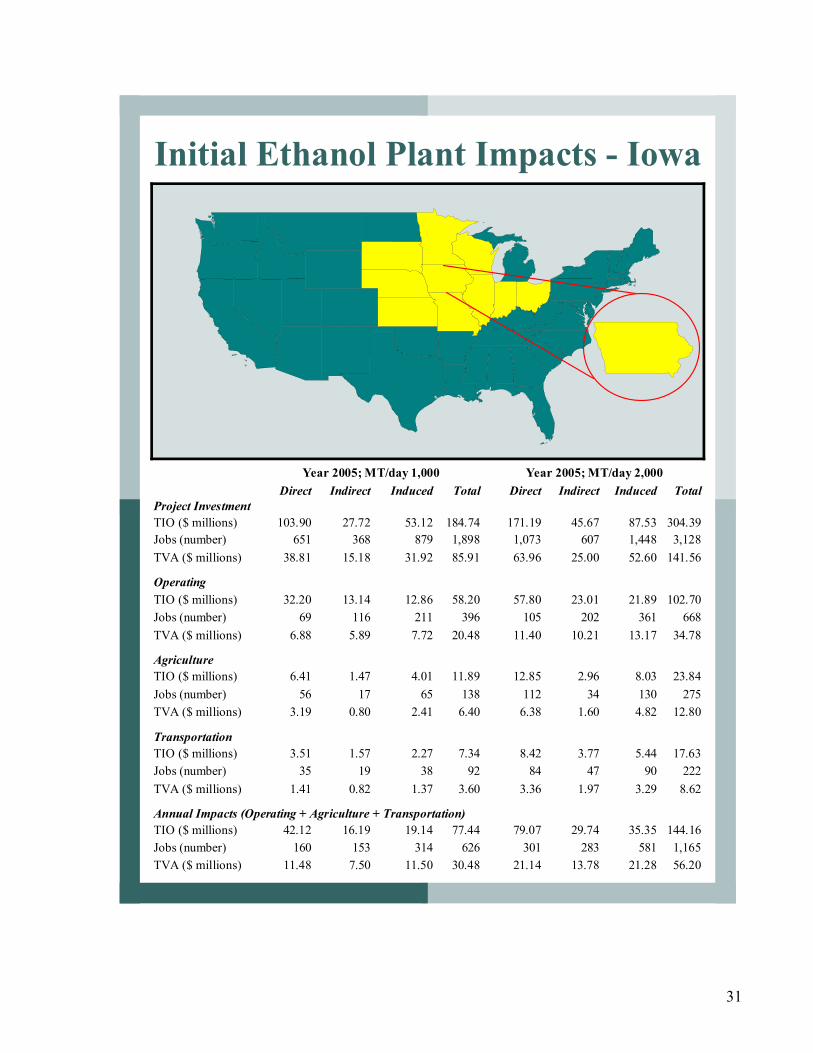
Initial Ethanol Plant Impacts - Iowa
Year 2005; MT/day 1,000 Year 2005; MT/day 2,000 Direct Indirect Induced Total Direct Indirect Induced Total Project Investment TIO ($ millions) 103.90 27.72 53.12 184.74 171.19 45.67 87.53 304.39 Jobs (number) 651 368 879 1,898 1,073 607 1,448 3,128 TVA ($ millions) 38.81 15.18 31.92 85.91 63.96 25.00 52.60 141.56 Operating TIO ($ millions) 32.20 13.14 12.86 58.20 57.80 23.01 21.89 102.70 Jobs (number) 69 116 211 396 105 202 361 668 TVA ($ millions) 6.88 5.89 7.72 20.48 11.40 10.21 13.17 34.78 Agriculture TIO ($ millions) 6.41 1.47 4.01 11.89 12.85 2.96 8.03 23.84 Jobs (number) 56 17 65 138 112 34 130 275 TVA ($ millions) 3.19 0.80 2.41 6.40 6.38 1.60 4.82 12.80 Transportation TIO ($ millions) 3.51 1.57 2.27 7.34 8.42 3.77 5.44 17.63 Jobs (number) 35 19 38 92 84 47 90 222 TVA ($ millions) 1.41 0.82 1.37 3.60 3.36 1.97 3.29 8.62
Annual Impacts (Operating + Agriculture + Transportation) TIO ($ millions) 79.07 29.74 35.35 144.16 42.12 16.19 19.14 77.44 Jobs (number) 160 153 314 626 301 283 581 1,165 TVA ($ millions) 11.48 7.50 11.50 30.48 21.14 13.78 21.28 56.20

32
Initial Ethanol Plant Impacts - Kansas
Year 2005; MT/day 1,000 Year 2005; MT/day 2,000 Direct Indirect Induced Total Direct Indirect Induced Total Project Investment TIO ($ millions) 103.90 31.26 60.28 195.44 171.19 51.52 99.34 322.04 Jobs (number) 675 391 957 2,023 1,113 645 1,577 3,335 TVA ($ millions) 35.67 17.53 37.25 90.46 58.79 28.89 61.39 149.07 Operating TIO ($ millions) 32.20 17.16 19.10 68.46 57.80 29.92 32.92 120.63 Jobs (number) 66 143 300 509 111 251 518 880 TVA ($ millions) 8.47 8.16 11.71 28.34 14.59 13.99 20.21 48.78 Agriculture TIO ($ millions) 5.99 2.27 3.95 12.21 12.70 4.82 8.37 25.89 Jobs (number) 62 22 62 147 132 48 131 311 TVA ($ millions) 2.25 1.17 2.43 5.85 4.76 2.48 5.15 12.39 Transportation TIO ($ millions) 6.29 3.94 5.32 15.55 23.03 14.44 19.44 56.91 Jobs (number) 61 42 84 188 224 151 306 681 TVA ($ millions) 2.57 1.94 3.30 7.81 9.44 7.11 12.06 28.60
Annual Impacts (Operating + Agriculture + Transportation) TIO ($ millions) 93.53 49.18 60.73 203.44 44.48 23.37 28.37 96.22 Jobs (number) 190 207 446 843 467 450 955 1,872 TVA ($ millions) 13.29 11.27 17.44 42.00 28.78 23.58 37.42 89.78

33
Initial Ethanol Plant Impacts - Minnesota
Year 2005; MT/day 1,000 Year 2005; MT/day 2,000 Direct Indirect Induced Total Direct Indirect Induced Total Project Investment TIO ($ millions) 103.90 34.29 64.99 203.18 171.19 56.50 107.09 334.78 Jobs (number) 632 409 913 1,954 1,042 674 1,504 3,220 TVA ($ millions) 37.43 19.89 39.38 96.69 61.68 32.77 64.88 159.33 Operating TIO ($ millions) 32.20 14.32 15.21 61.73 57.80 25.21 26.31 109.32 Jobs (number) 72 123 213 408 117 214 369 700 TVA ($ millions) 6.44 7.15 9.24 22.83 10.97 12.43 16.01 39.41 Agriculture TIO ($ millions) 6.48 2.37 4.30 13.15 13.00 4.76 8.62 26.39 Jobs (number) 77 24 60 160 153 48 119 320 TVA ($ millions) 2.54 1.30 2.60 6.44 5.09 2.61 5.21 12.90 Transportation TIO ($ millions) 3.50 2.19 2.95 8.64 8.74 5.47 7.39 21.60 Jobs (number) 35 24 41 99 85 58 103 246 TVA ($ millions) 1.44 1.13 1.80 4.36 3.59 2.82 4.49 10.90
Annual Impacts (Operating + Agriculture + Transportation) TIO ($ millions) 79.54 35.44 42.32 157.30 42.18 18.88 22.46 83.52 Jobs (number) 183 170 314 667 354 320 592 1,266 TVA ($ millions) 10.42 9.57 13.64 33.63 19.64 17.86 25.71 63.21
34
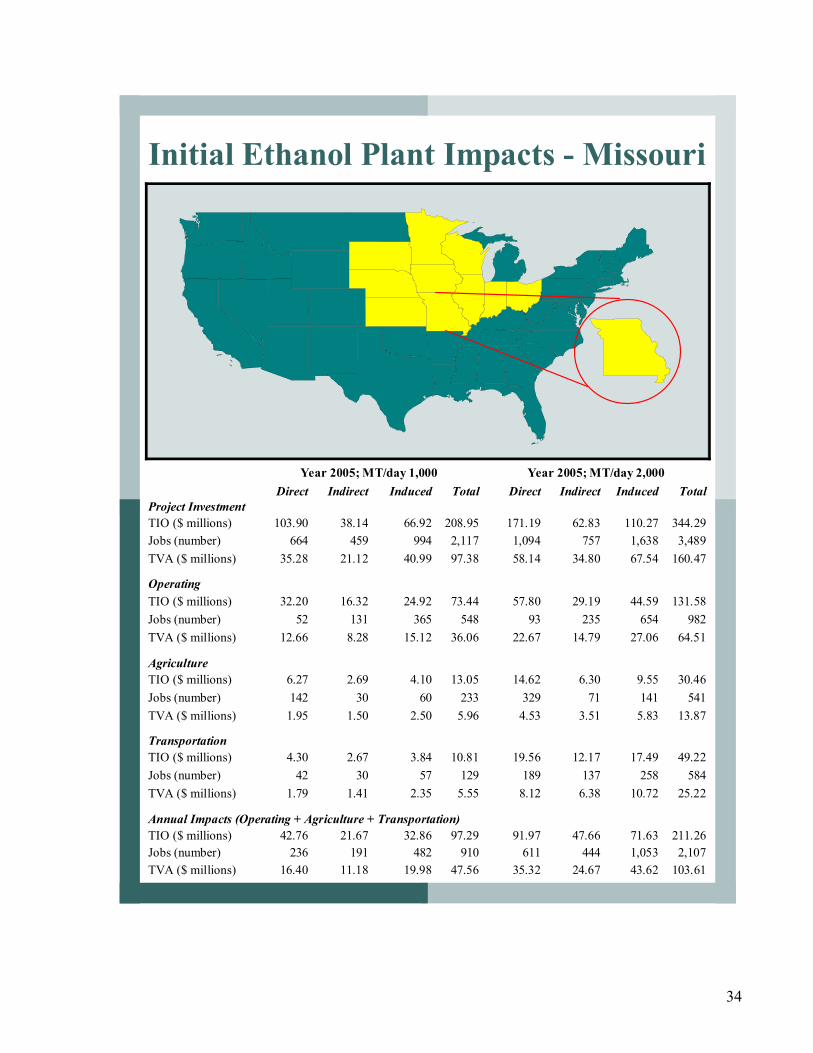
Initial Ethanol Plant Impacts - Missouri
Year 2005; MT/day 1,000 Year 2005; MT/day 2,000 Direct Indirect Induced Total Direct Indirect Induced Total Project Investment TIO ($ millions) 103.90 38.14 66.92 208.95 171.19 62.83 110.27 344.29 Jobs (number) 664 459 994 2,117 1,094 757 1,638 3,489 TVA ($ millions) 35.28 21.12 40.99 97.38 58.14 34.80 67.54 160.47 Operating TIO ($ millions) 32.20 16.32 24.92 73.44 57.80 29.19 44.59 131.58 Jobs (number) 52 131 365 548 93 235 654 982 TVA ($ millions) 12.66 8.28 15.12 36.06 22.67 14.79 27.06 64.51 Agriculture TIO ($ millions) 6.27 2.69 4.10 13.05 14.62 6.30 9.55 30.46 Jobs (number) 142 30 60 233 329 71 141 541 TVA ($ millions) 1.95 1.50 2.50 5.96 4.53 3.51 5.83 13.87 Transportation TIO ($ millions) 4.30 2.67 3.84 10.81 19.56 12.17 17.49 49.22 Jobs (number) 42 30 57 129 189 137 258 584 TVA ($ millions) 1.79 1.41 2.35 5.55 8.12 6.38 10.72 25.22
Annual Impacts (Operating + Agriculture + Transportation) TIO ($ millions) 91.97 47.66 71.63 211.26 42.76 21.67 32.86 97.29 Jobs (number) 236 191 482 910 611 444 1,053 2,107 TVA ($ millions) 16.40 11.18 19.98 47.56 35.32 24.67 43.62 103.61

35
Initial Ethanol Plant Impacts - Nebraska
Year 2005; MT/day 1,000 Year 2005; MT/day 2,000 Direct Indirect Induced Total Direct Indirect Induced Total Project Investment TIO ($ millions) 103.90 30.49 55.81 190.20 171.19 50.23 91.98 313.40 Jobs (number) 684 428 911 2,023 1,127 705 1,501 3,333 TVA ($ millions) 34.10 17.15 33.72 84.98 56.20 28.26 55.57 140.04 Operating TIO ($ millions) 32.20 14.10 14.08 60.37 57.80 24.85 24.32 106.97 Jobs (number) 74 131 228 433 118 228 395 741 TVA ($ millions) 6.07 6.55 8.52 21.13 10.34 11.37 14.75 36.46 Agriculture TIO ($ millions) 6.19 1.41 4.38 11.98 12.95 2.97 9.15 25.08 Jobs (number) 52 18 70 141 109 38 146 293 TVA ($ millions) 3.06 0.78 2.64 6.49 6.39 1.65 5.52 13.56 Transportation TIO ($ millions) 3.36 1.75 2.61 7.73 8.10 4.23 6.30 18.62 Jobs (number) 32 21 42 95 77 50 101 227 TVA ($ millions) 1.42 0.91 1.58 3.91 3.42 2.18 3.81 9.42
Annual Impacts (Operating + Agriculture + Transportation) TIO ($ millions) 78.85 32.05 39.77 150.67 41.75 17.26 21.07 80.08 Jobs (number) 159 170 340 668 304 315 642 1,261 TVA ($ millions) 10.54 8.24 12.74 31.53 20.15 15.20 24.08 59.43

36
Initial Ethanol Plant Impacts - Ohio
Year 2005; MT/day 1,000 Year 2005; MT/day 2,000 Direct Indirect Induced Total Direct Indirect Induced Total Project Investment TIO ($ millions) 103.90 28.63 49.69 182.22 171.19 47.18 81.88 300.25 Jobs (number) 643 333 736 1,712 1,059 549 1,212 2,820 TVA ($ millions) 38.21 14.95 30.10 83.25 62.96 24.63 49.60 137.19 Operating TIO ($ millions) 32.20 15.95 15.02 63.17 57.80 28.57 26.87 113.24 Jobs (number) 66 122 220 408 118 218 394 730 TVA ($ millions) 8.99 7.55 9.01 25.55 16.08 13.50 16.12 45.70 Agriculture TIO ($ millions) 7.08 2.77 3.53 13.38 14.16 5.57 7.04 26.77 Jobs (number) 94 23 52 169 186 46 103 335 TVA ($ millions) 2.61 1.37 2.13 6.11 5.19 2.75 4.25 12.19 Transportation TIO ($ millions) 4.46 2.69 2.94 10.09 11.13 6.71 7.35 25.19 Jobs (number) 42 29 44 115 106 70 109 285 TVA ($ millions) 1.87 1.31 1.79 4.97 4.66 3.26 4.48 12.40
Annual Impacts (Operating + Agriculture + Transportation) TIO ($ millions) 83.09 40.84 41.26 165.19 43.74 21.41 21.49 86.64 Jobs (number) 202 174 315 692 410 334 606 1,351 TVA ($ millions) 13.47 10.23 12.93 36.63 25.92 19.51 24.86 70.29

37
Initial Ethanol Plant Impacts - S. Dakota
Year 2005; MT/day 1,000 Year 2005; MT/day 2,000 Direct Indirect Induced Total Direct Indirect Induced Total Project Investment TIO ($ millions) 103.90 29.33 47.14 180.37 171.19 48.32 77.69 297.20 Jobs (number) 710 404 843 1,957 1,169 665 1,390 3,224 TVA ($ millions) 32.63 15.30 28.43 76.36 53.78 25.21 46.86 125.84 Operating TIO ($ millions) 32.20 11.19 7.62 51.01 57.80 19.47 12.95 90.22 Jobs (number) 72 100 140 312 90 168 239 497 TVA ($ millions) 3.31 4.11 4.67 12.09 5.77 6.75 7.98 20.50 Agriculture TIO ($ millions) 7.30 1.50 3.99 12.79 15.44 3.19 8.42 27.04 Jobs (number) 53 19 71 144 111 42 150 303 TVA ($ millions) 3.06 0.86 2.41 6.33 6.45 1.83 5.08 13.35 Transportation TIO ($ millions) 4.28 2.18 2.88 9.34 10.79 5.48 7.25 23.51 Jobs (number) 43 27 51 120 106 69 129 304 TVA ($ millions) 1.74 1.11 1.75 4.60 4.39 2.79 4.40 11.58
Annual Impacts (Operating + Agriculture + Transportation) TIO ($ millions) 84.03 28.13 28.61 140.77 43.78 14.87 14.48 73.14 Jobs (number) 168 146 262 576 307 279 518 1,104 TVA ($ millions) 8.11 6.08 8.83 23.02 16.60 11.37 17.46 45.43
38
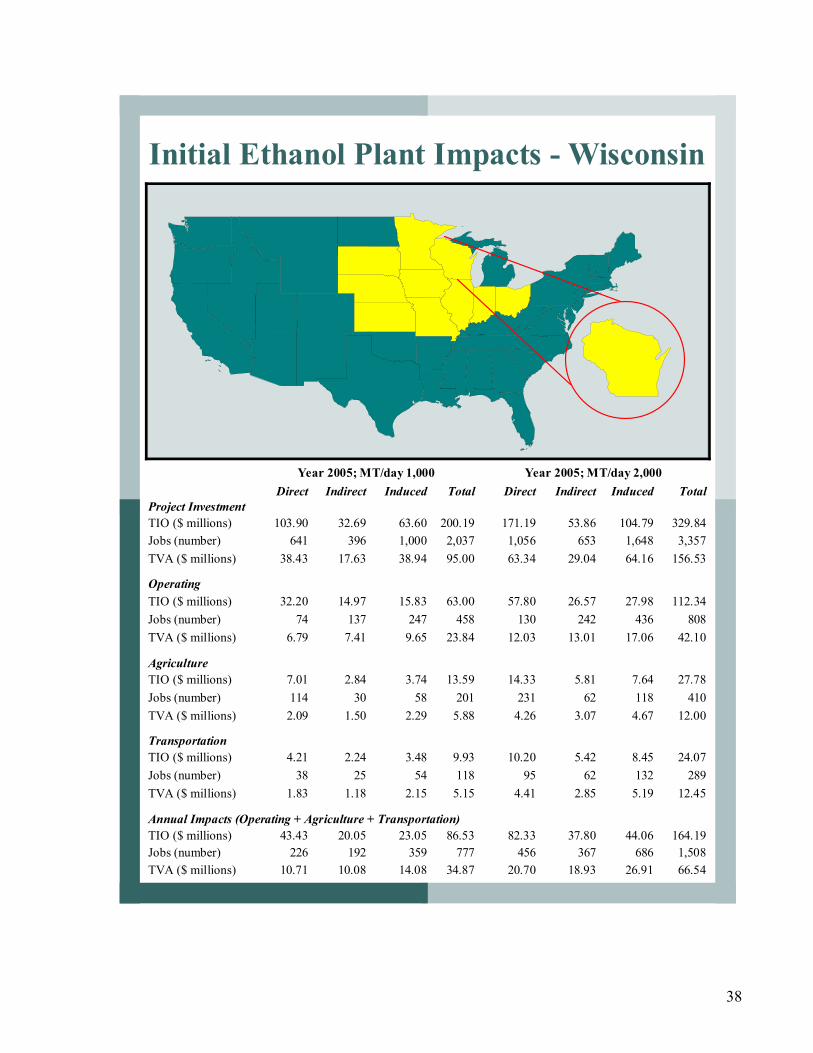
Initial Ethanol Plant Impacts - Wisconsin
Year 2005; MT/day 1,000 Year 2005; MT/day 2,000 Direct Indirect Induced Total Direct Indirect Induced Total Project Investment TIO ($ millions) 103.90 32.69 63.60 200.19 171.19 53.86 104.79 329.84 Jobs (number) 641 396 1,000 2,037 1,056 653 1,648 3,357 TVA ($ millions) 38.43 17.63 38.94 95.00 63.34 29.04 64.16 156.53 Operating TIO ($ millions) 32.20 14.97 15.83 63.00 57.80 26.57 27.98 112.34 Jobs (number) 74 137 247 458 130 242 436 808 TVA ($ millions) 6.79 7.41 9.65 23.84 12.03 13.01 17.06 42.10 Agriculture TIO ($ millions) 7.01 2.84 3.74 13.59 14.33 5.81 7.64 27.78 Jobs (number) 114 30 58 201 231 62 118 410 TVA ($ millions) 2.09 1.50 2.29 5.88 4.26 3.07 4.67 12.00 Transportation TIO ($ millions) 4.21 2.24 3.48 9.93 10.20 5.42 8.45 24.07 Jobs (number) 38 25 54 118 95 62 132 289 TVA ($ millions) 1.83 1.18 2.15 5.15 4.41 2.85 5.19 12.45
Annual Impacts (Operating + Agriculture + Transportation) TIO ($ millions) 82.33 37.80 44.06 164.19 43.43 20.05 23.05 86.53 Jobs (number) 226 192 359 777 456 367 686 1,508 TVA ($ millions) 10.71 10.08 14.08 34.87 20.70 18.93 26.91 66.54

39
APPENDIX B: State Impacts Under Full Adoption Assumptions by State for Selected Ethanol Price Scenarios

40

41
Estimated Economic Impacts from Using Corn Stover to Establish an Ethanol Industry in Illinois (Breakeven Stover Price)
In 1997, Illinois farmers planted 10.7 million acres in corn or 45 percent of their cropland. POLYSYS pro-jected 12.1 million corn acres for 2005. The stover from these acres are sufficient enough to supply an estimated 29 1000 MT/day plants or 15 2000 MT/day plants with ethanol price set at $1.35 per gallon. Total state-level economic impacts if 29 1000 MT/day corn stover-ethanol plants are constructed is estimated at $2.75 billion in increased economic activity and 20,208 new jobs.
05
1015202530
1.15 1.25 1.35Ethano l P rice $ / gallo n
10002000
Plant Size
$0.00
$20.00
$40.00
$60.00
$80.00
0 2,000 4,000 6,000 8,000 10,000 12,000Thousand Metric tons per year
Dol
lars
per
met
ric
ton
1000 MT/day 2000 MT/day

42
Total Annual Impacts (Operating + Agriculture + Transportation)
$1.15 Ethanol Price Assumption Direct Indirect Induced Total Year 2005; MT/day 1,000
TIO ($ millions) 127.72 68.24 82.82 278.78 Jobs (number) 467 506 1,062 2,034 TVA ($ millions) 43.08 35.00 51.84 129.91
Year 2005; MT/day 2,000
TIO ($ millions) 981.99 528.11 645.80 2,155.90 Jobs (number) 3,925 3,985 8,309 16,220 TVA ($ millions) 336.16 270.67 404.32 1,011.16 $1.25 Ethanol Price Assumption Direct Indirect Induced Total Year 2005; MT/day 1,000
TIO ($ millions) 991.31 531.28 645.64 2,168.23 Jobs (number) 3,686 3,950 8,273 15,909 TVA ($ millions) 335.64 272.43 404.11 1,012.18
Year 2005; MT/day 2,000
TIO ($ millions) 1,065.95 573.55 701.50 2,340.99 Jobs (number) 4,271 4,330 9,026 17,628 TVA ($ millions) 365.12 293.96 439.19 1,098.27 $1.35 Ethanol Price Assumption Direct Indirect Induced Total Year 2005; MT/day 1,000
TIO ($ millions) 1,255.59 673.67 819.10 2,748.36 Jobs (number) 4,699 5,015 10,495 20,208 TVA ($ millions) 425.72 345.44 512.67 1,283.83
Year 2005; MT/day 2,000
TIO ($ millions) 1,240.08 668.58 818.38 2,727.04 Jobs (number) 5,020 5,060 10,530 20,609 TVA ($ millions) 425.77 342.67 512.37 1,280.81

43
Estimated Economic Impacts from Using Corn Stover to Establish an Ethanol Industry in Illinois (15% Increase in Stover Price)
With a 15% increase in the cost of stover, no 1000 MT/day plants were economically feasible with an ethanol price of $1.15/gallon. However, at that same ethanol price, 11 2000 MT/day plants appear to be feasible. Under a $1.35/gallon ethanol price, 28 1000 MT/day or 14 2000 MT/day plants are estimated to be economically feasible. The largest impacts in the state occur with the 1000 MT/day plant. If 28 plants were constructed, an increase of $2.65 billion in economic activity is estimated for the state of Illinois. This increase in economic activity would result in more than 21,000 jobs being created. Under the same pricing scenario, an estimated $2.53 billion in economic activity would be generated if 14 2000 MT/day plants were constructed in the state.
0
5
10
15
20
25
30
No.
of P
lant
s
1.15 1.25 1.35
Ethanol Price $/gallon
10002000
Plant Size
44
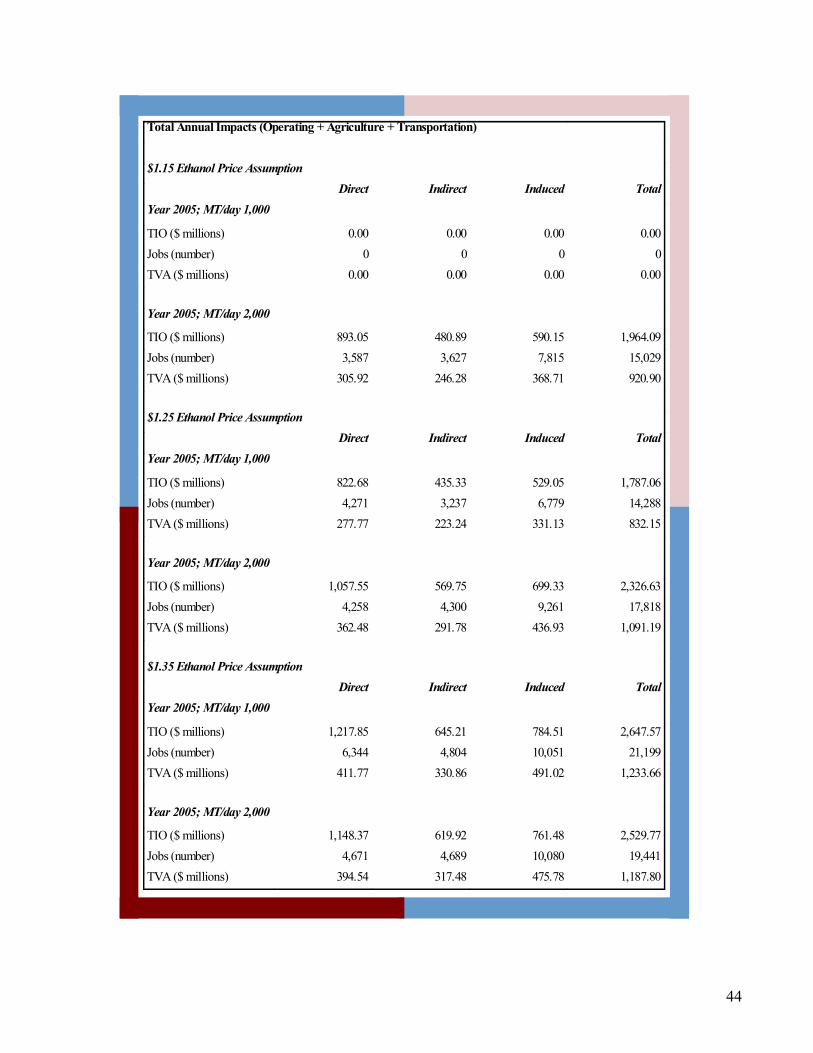
Total Annual Impacts (Operating + Agriculture + Transportation)
$1.15 Ethanol Price Assumption Direct Indirect Induced Total Year 2005; MT/day 1,000
TIO ($ millions) 0.00 0.00 0.00 0.00 Jobs (number) 0 0 0 0 TVA ($ millions) 0.00 0.00 0.00 0.00
Year 2005; MT/day 2,000
TIO ($ millions) 893.05 480.89 590.15 1,964.09 Jobs (number) 3,587 3,627 7,815 15,029 TVA ($ millions) 305.92 246.28 368.71 920.90 $1.25 Ethanol Price Assumption Direct Indirect Induced Total Year 2005; MT/day 1,000
TIO ($ millions) 822.68 435.33 529.05 1,787.06 Jobs (number) 4,271 3,237 6,779 14,288 TVA ($ millions) 277.77 223.24 331.13 832.15
Year 2005; MT/day 2,000
TIO ($ millions) 1,057.55 569.75 699.33 2,326.63 Jobs (number) 4,258 4,300 9,261 17,818 TVA ($ millions) 362.48 291.78 436.93 1,091.19 $1.35 Ethanol Price Assumption Direct Indirect Induced Total Year 2005; MT/day 1,000
TIO ($ millions) 1,217.85 645.21 784.51 2,647.57 Jobs (number) 6,344 4,804 10,051 21,199 TVA ($ millions) 411.77 330.86 491.02 1,233.66
Year 2005; MT/day 2,000
TIO ($ millions) 1,148.37 619.92 761.48 2,529.77 Jobs (number) 4,671 4,689 10,080 19,441 TVA ($ millions) 394.54 317.48 475.78 1,187.80

45
Estimated Economic Impacts from Using Corn Stover to Establish an Ethanol Industry in Illinois (30% Increase in Stover Price)
With a 30% increase in the cost of stover, no 1000 MT/day plants were economically feasible with an ethanol price of $1.15/gallon. However, at that same ethanol price, seven 2000 MT/day plants appear to be feasible. Under a $1.35/gallon ethanol price, 26 1000 MT/day or 14 2000 MT/day plants are estimated to be economically feasible. The largest impacts in the state occur with the 2000 MT/day plant. If 14 plants were constructed, an increase of $2.51 billion in economic activity is estimated for the state of Illinois. This increase in economic activity would result in close to 20,000 jobs being created. Under the same pricing scenario, an estimated $2.45 billion in economic activity would be generated if 26 1000 MT/day plants were constructed in the state.
0
5
10
15
20
25
30
No.
of P
lant
s
1.15 1.25 1.35
Ethanol Price $/gallon
10002000
Plant Size

46
Total Annual Impacts (Operating + Agriculture + Transportation)
$1.15 Ethanol Price Assumption Direct Indirect Induced Total Year 2005; MT/day 1,000
TIO ($ millions) 0.00 0.00 0.00 0.00 Jobs (number) 0 0 0 0 TVA ($ millions) 0.00 0.00 0.00 0.00
Year 2005; MT/day 2,000
TIO ($ millions) 563.80 303.98 374.39 1,242.17 Jobs (number) 2,275 2,292 5,100 9,667 TVA ($ millions) 193.26 155.55 233.42 582.23 $1.25 Ethanol Price Assumption Direct Indirect Induced Total Year 2005; MT/day 1,000
TIO ($ millions) 608.98 318.16 386.67 1,313.81 Jobs (number) 4,051 2,366 4,955 11,372 TVA ($ millions) 205.05 163.17 242.01 610.23
Year 2005; MT/day 2,000
TIO ($ millions) 968.48 522.43 643.54 2,134.46 Jobs (number) 3,918 3,941 8,765 16,624 TVA ($ millions) 332.17 267.34 401.24 1,000.74 $1.35 Ethanol Price Assumption Direct Indirect Induced Total Year 2005; MT/day 1,000
TIO ($ millions) 1,136.06 594.28 722.61 2,452.94 Jobs (number) 7,569 4,426 9,258 21,253 TVA ($ millions) 383.06 304.76 452.28 1,140.10
Year 2005; MT/day 2,000
TIO ($ millions) 1,139.36 615.85 759.16 2,514.37 Jobs (number) 4,657 4,657 10,333 19,647 TVA ($ millions) 391.71 315.15 473.35 1,180.21

47
Estimated Economic Impacts from Using Corn Stover to Establish an Ethanol Industry in Indiana (Breakeven Stover Price)
In 1997, Indiana farmers planted 5.5 million acres in corn or 43 percent of their cropland. POLYSYS pro-jected 6.3 million corn acres for 2005. The stover from these acres are sufficient enough to supply an estimated 13 1000 MT/day plants or seven 2000 MT/day plants with ethanol price set at $1.35 per gallon. Total state-level economic impacts if 13 1000 MT/day corn stover-ethanol plants are constructed is estimated at $1.15 billion in in-creased economic activity and 9,494 new jobs. Under the 2000 MT/day, an estimated $1.20 billion in economic ac-tivity is created.
02468
101214
1.15 1.25 1.35Ethano l P rice $ / gallo n
10002000
Plant Size
$0.00
$20.00$40.00
$60.00
0 1,000 2,000 3,000 4,000 5,000 6,000Thousand Metric tons per year
Dol
lars
per
met
ric
ton
1000 MT/day 2000 MT/day

48
Total Annual Impacts (Operating + Agriculture + Transportation)
$1.15 Ethanol Price Assumption Direct Indirect Induced Total Year 2005; MT/day 1,000
TIO ($ millions) 0.00 0.00 0.00 0.00 Jobs (number) 0 0 0 0 TVA ($ millions) 0.00 0.00 0.00 0.00
Year 2005; MT/day 2,000
TIO ($ millions) 419.01 184.61 233.68 837.29 Jobs (number) 1,931 1,602 3,476 7,009 TVA ($ millions) 135.53 91.23 139.48 366.25 $1.25 Ethanol Price Assumption Direct Indirect Induced Total Year 2005; MT/day 1,000
TIO ($ millions) 436.63 193.10 243.45 873.18 Jobs (number) 1,871 1,633 3,626 7,131 TVA ($ millions) 140.54 96.27 145.14 381.95
Year 2005; MT/day 2,000
TIO ($ millions) 507.08 224.01 283.56 1,014.64 Jobs (number) 2,359 1,948 4,218 8,525 TVA ($ millions) 164.42 110.69 169.27 444.38 $1.35 Ethanol Price Assumption Direct Indirect Induced Total Year 2005; MT/day 1,000
TIO ($ millions) 576.03 255.93 322.69 1,154.65 Jobs (number) 2,514 2,174 4,806 9,494 TVA ($ millions) 186.21 127.53 192.41 506.15
Year 2005; MT/day 2,000
TIO ($ millions) 596.90 264.44 334.73 1,196.07 Jobs (number) 2,803 2,305 4,980 10,088 TVA ($ millions) 194.05 130.64 199.85 524.53
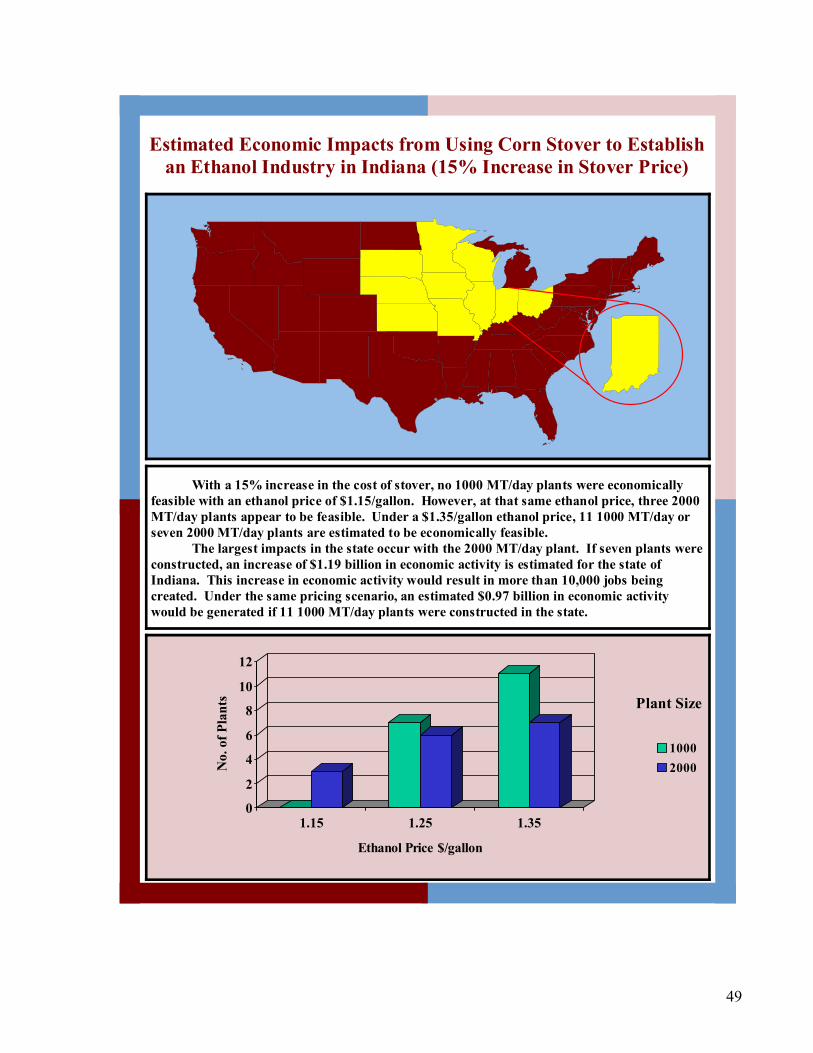
49
Estimated Economic Impacts from Using Corn Stover to Establish an Ethanol Industry in Indiana (15% Increase in Stover Price)
With a 15% increase in the cost of stover, no 1000 MT/day plants were economically feasible with an ethanol price of $1.15/gallon. However, at that same ethanol price, three 2000 MT/day plants appear to be feasible. Under a $1.35/gallon ethanol price, 11 1000 MT/day or seven 2000 MT/day plants are estimated to be economically feasible. The largest impacts in the state occur with the 2000 MT/day plant. If seven plants were constructed, an increase of $1.19 billion in economic activity is estimated for the state of Indiana. This increase in economic activity would result in more than 10,000 jobs being created. Under the same pricing scenario, an estimated $0.97 billion in economic activity would be generated if 11 1000 MT/day plants were constructed in the state.
0
2
4
6
8
10
12
No.
of P
lant
s
1.15 1.25 1.35
Ethanol Price $/gallon
10002000
Plant Size

50
Total Annual Impacts (Operating + Agriculture + Transportation)
$1.15 Ethanol Price Assumption Direct Indirect Induced Total Year 2005; MT/day 1,000
TIO ($ millions) 0.00 0.00 0.00 0.00 Jobs (number) 0 0 0 0 TVA ($ millions) 0.00 0.00 0.00 0.00
Year 2005; MT/day 2,000
TIO ($ millions) 249.47 110.05 139.71 499.23 Jobs (number) 1,157 955 2,145 4,256 TVA ($ millions) 80.74 54.35 83.25 218.35 $1.25 Ethanol Price Assumption Direct Indirect Induced Total Year 2005; MT/day 1,000
TIO ($ millions) 307.10 134.08 169.06 610.25 Jobs (number) 2,000 1,135 2,518 5,652 TVA ($ millions) 98.51 66.86 100.79 266.15
Year 2005; MT/day 2,000
TIO ($ millions) 503.21 222.59 282.56 1,008.36 Jobs (number) 2,354 1,936 4,337 8,626 TVA ($ millions) 163.27 109.91 168.40 441.59 $1.35 Ethanol Price Assumption Direct Indirect Induced Total Year 2005; MT/day 1,000
TIO ($ millions) 489.71 214.86 270.90 975.47 Jobs (number) 3,211 1,826 4,035 9,072 TVA ($ millions) 157.76 107.08 161.53 426.37
Year 2005; MT/day 2,000
TIO ($ millions) 592.39 262.77 333.58 1,188.74 Jobs (number) 2,797 2,290 5,118 10,206 TVA ($ millions) 192.71 129.73 198.83 521.27
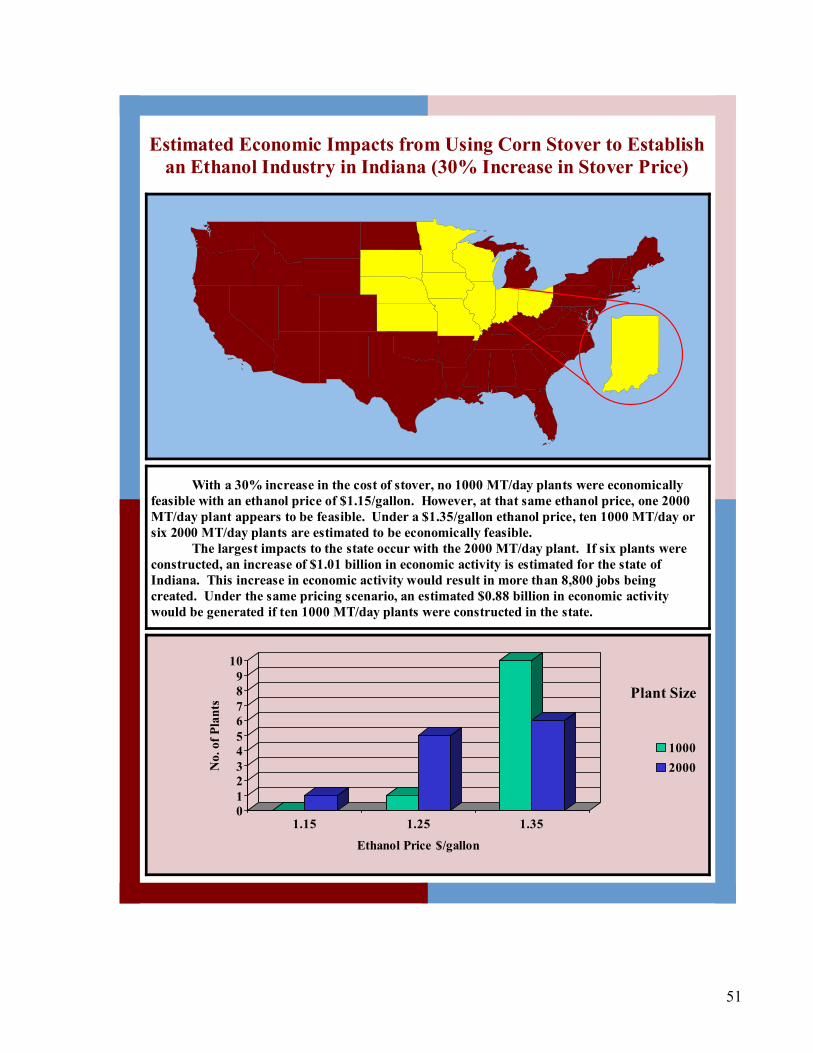
51
Estimated Economic Impacts from Using Corn Stover to Establish an Ethanol Industry in Indiana (30% Increase in Stover Price)
With a 30% increase in the cost of stover, no 1000 MT/day plants were economically feasible with an ethanol price of $1.15/gallon. However, at that same ethanol price, one 2000 MT/day plant appears to be feasible. Under a $1.35/gallon ethanol price, ten 1000 MT/day or six 2000 MT/day plants are estimated to be economically feasible. The largest impacts to the state occur with the 2000 MT/day plant. If six plants were constructed, an increase of $1.01 billion in economic activity is estimated for the state of Indiana. This increase in economic activity would result in more than 8,800 jobs being created. Under the same pricing scenario, an estimated $0.88 billion in economic activity would be generated if ten 1000 MT/day plants were constructed in the state.
0123456789
10
No.
of P
lant
s
1.15 1.25 1.35
Ethanol Price $/gallon
10002000
Plant Size

52
Total Annual Impacts (Operating + Agriculture + Transportation)
$1.15 Ethanol Price Assumption
Direct Indirect Induced Total
Year 2005; MT/day 1,000
TIO ($ millions) 0.00 0.00 0.00 0.00
Jobs (number) 0 0 0 0
TVA ($ millions) 0.00 0.00 0.00 0.00
Year 2005; MT/day 2,000
TIO ($ millions) 84.09 37.35 47.46 168.90
Jobs (number) 387 359 797 1,544
TVA ($ millions) 27.15 18.37 28.13 73.66
$1.25 Ethanol Price Assumption
Direct Indirect Induced Total
Year 2005; MT/day 1,000
TIO ($ millions) 44.08 19.00 23.96 87.04
Jobs (number) 384 161 357 902
TVA ($ millions) 14.09 9.48 14.28 37.85
Year 2005; MT/day 2,000
TIO ($ millions) 416.13 184.31 234.65 835.08
Jobs (number) 1,958 1,602 3,713 7,273
TVA ($ millions) 135.11 90.95 139.61 365.67
$1.35 Ethanol Price Assumption
Direct Indirect Induced Total
Year 2005; MT/day 1,000
TIO ($ millions) 447.29 193.78 244.34 885.42
Jobs (number) 3,905 1,648 3,639 9,192
TVA ($ millions) 143.60 96.59 145.70 385.89
Year 2005; MT/day 2,000
TIO ($ millions) 503.91 223.82 284.94 1,012.66
Jobs (number) 2,393 1,951 4,506 8,850
TVA ($ millions) 164.03 110.43 169.55 444.01
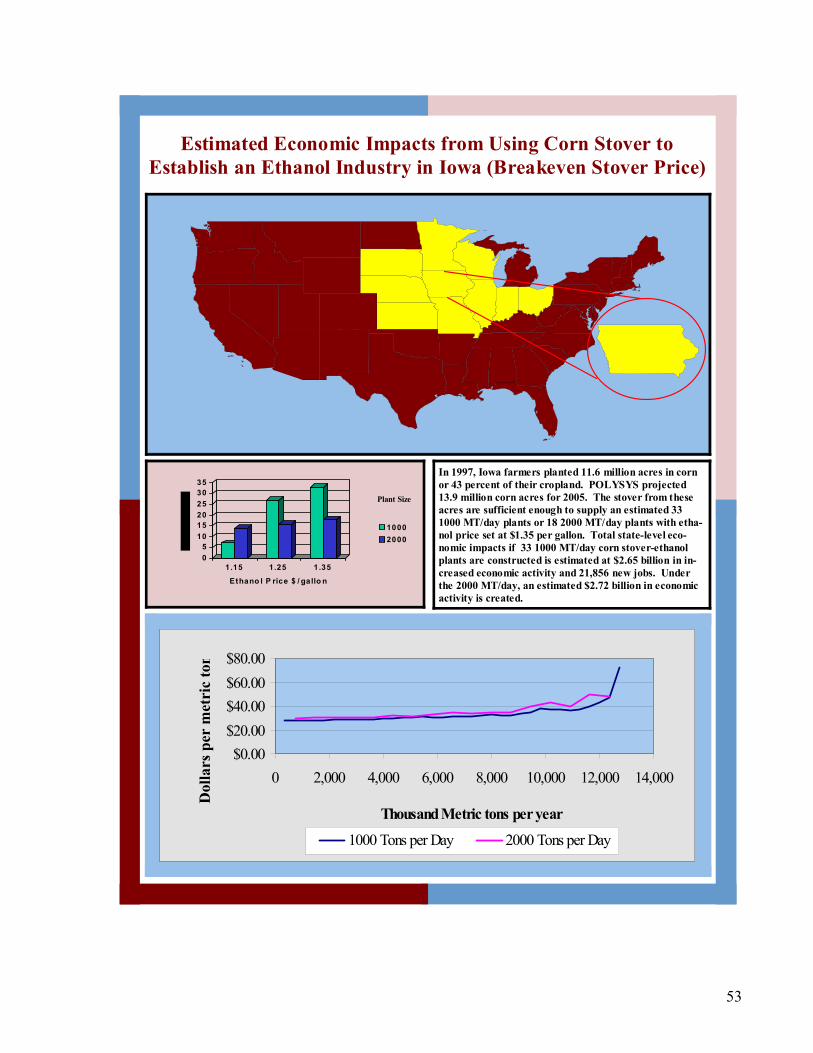
53
Estimated Economic Impacts from Using Corn Stover to Establish an Ethanol Industry in Iowa (Breakeven Stover Price)
In 1997, Iowa farmers planted 11.6 million acres in corn or 43 percent of their cropland. POLYSYS projected 13.9 million corn acres for 2005. The stover from these acres are sufficient enough to supply an estimated 33 1000 MT/day plants or 18 2000 MT/day plants with etha-nol price set at $1.35 per gallon. Total state-level eco-nomic impacts if 33 1000 MT/day corn stover-ethanol plants are constructed is estimated at $2.65 billion in in-creased economic activity and 21,856 new jobs. Under the 2000 MT/day, an estimated $2.72 billion in economic activity is created.
05
101520253035
1.15 1.25 1.35Ethano l P rice $ / gallo n
10002000
Plant Size
$0.00$20.00$40.00$60.00$80.00
0 2,000 4,000 6,000 8,000 10,000 12,000 14,000
Thousand Metric tons per year
Dol
lars
per
met
ric
ton
1000 Tons per Day 2000 Tons per Day

54
Total Annual Impacts (Operating + Agriculture + Transportation)
$1.15 Ethanol Price Assumption
Direct Indirect Induced Total Year 2005; MT/day 1,000
TIO ($ millions) 298.29 114.85 136.18 549.32 Jobs (number) 1,154 1,088 2,232 4,474
TVA ($ millions) 81.76 53.31 81.83 216.90
Year 2005; MT/day 2,000
TIO ($ millions) 1,146.22 434.02 520.32 2,100.56
Jobs (number) 4,612 4,184 8,550 17,346 TVA ($ millions) 311.64 202.12 313.23 826.98 $1.25 Ethanol Price Assumption
Direct Indirect Induced Total Year 2005; MT/day 1,000
TIO ($ millions) 1,166.44 450.07 535.52 2,152.04 Jobs (number) 4,608 4,285 8,780 17,673
TVA ($ millions) 321.74 209.32 321.84 852.90
Year 2005; MT/day 2,000
TIO ($ millions) 1,320.59 500.78 601.51 2,422.89
Jobs (number) 5,377 4,842 9,885 20,104 TVA ($ millions) 360.40 233.48 362.12 956.00 $1.35 Ethanol Price Assumption
Direct Indirect Induced Total Year 2005; MT/day 1,000
TIO ($ millions) 1,435.43 554.45 660.84 2,650.72 Jobs (number) 5,729 5,291 10,836 21,856
TVA ($ millions) 397.18 258.10 397.19 1,052.47
Year 2005; MT/day 2,000
TIO ($ millions) 1,485.67 563.38 676.70 2,725.75
Jobs (number) 6,049 5,447 11,120 22,617 TVA ($ millions) 405.45 262.66 407.38 1,075.50
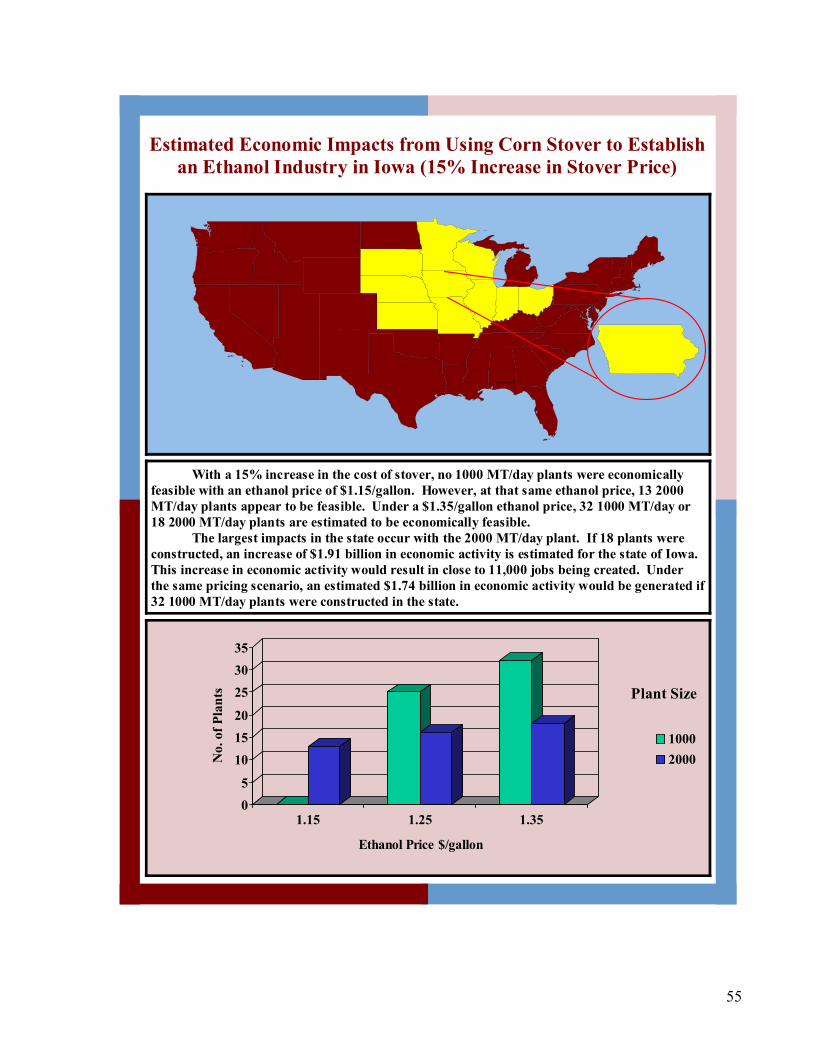
55
Estimated Economic Impacts from Using Corn Stover to Establish an Ethanol Industry in Iowa (15% Increase in Stover Price)
05
101520
253035
No.
of P
lant
s
1.15 1.25 1.35
Ethanol Price $/gallon
10002000
Plant Size
With a 15% increase in the cost of stover, no 1000 MT/day plants were economically feasible with an ethanol price of $1.15/gallon. However, at that same ethanol price, 13 2000 MT/day plants appear to be feasible. Under a $1.35/gallon ethanol price, 32 1000 MT/day or 18 2000 MT/day plants are estimated to be economically feasible. The largest impacts in the state occur with the 2000 MT/day plant. If 18 plants were constructed, an increase of $1.91 billion in economic activity is estimated for the state of Iowa. This increase in economic activity would result in close to 11,000 jobs being created. Under the same pricing scenario, an estimated $1.74 billion in economic activity would be generated if 32 1000 MT/day plants were constructed in the state.
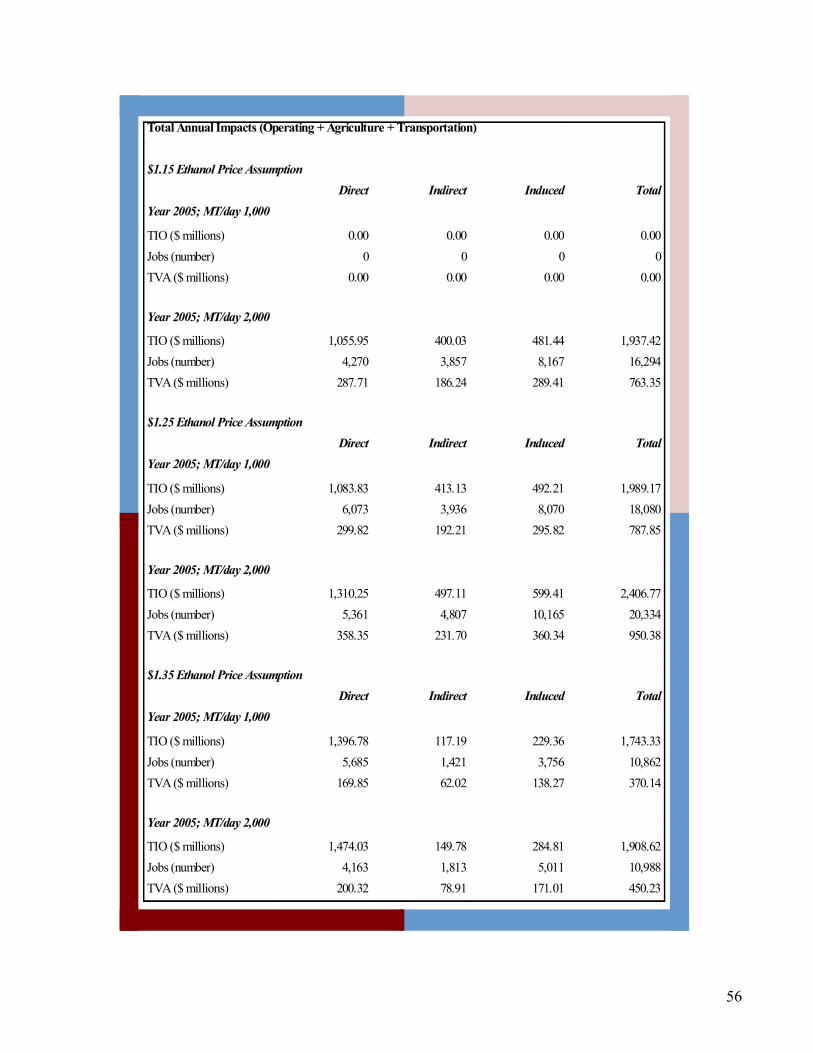
56
Total Annual Impacts (Operating + Agriculture + Transportation)
$1.15 Ethanol Price Assumption Direct Indirect Induced Total Year 2005; MT/day 1,000
TIO ($ millions) 0.00 0.00 0.00 0.00 Jobs (number) 0 0 0 0 TVA ($ millions) 0.00 0.00 0.00 0.00
Year 2005; MT/day 2,000
TIO ($ millions) 1,055.95 400.03 481.44 1,937.42 Jobs (number) 4,270 3,857 8,167 16,294 TVA ($ millions) 287.71 186.24 289.41 763.35 $1.25 Ethanol Price Assumption Direct Indirect Induced Total Year 2005; MT/day 1,000
TIO ($ millions) 1,083.83 413.13 492.21 1,989.17 Jobs (number) 6,073 3,936 8,070 18,080 TVA ($ millions) 299.82 192.21 295.82 787.85
Year 2005; MT/day 2,000
TIO ($ millions) 1,310.25 497.11 599.41 2,406.77 Jobs (number) 5,361 4,807 10,165 20,334 TVA ($ millions) 358.35 231.70 360.34 950.38 $1.35 Ethanol Price Assumption Direct Indirect Induced Total Year 2005; MT/day 1,000
TIO ($ millions) 1,396.78 117.19 229.36 1,743.33 Jobs (number) 5,685 1,421 3,756 10,862 TVA ($ millions) 169.85 62.02 138.27 370.14
Year 2005; MT/day 2,000
TIO ($ millions) 1,474.03 149.78 284.81 1,908.62 Jobs (number) 4,163 1,813 5,011 10,988 TVA ($ millions) 200.32 78.91 171.01 450.23
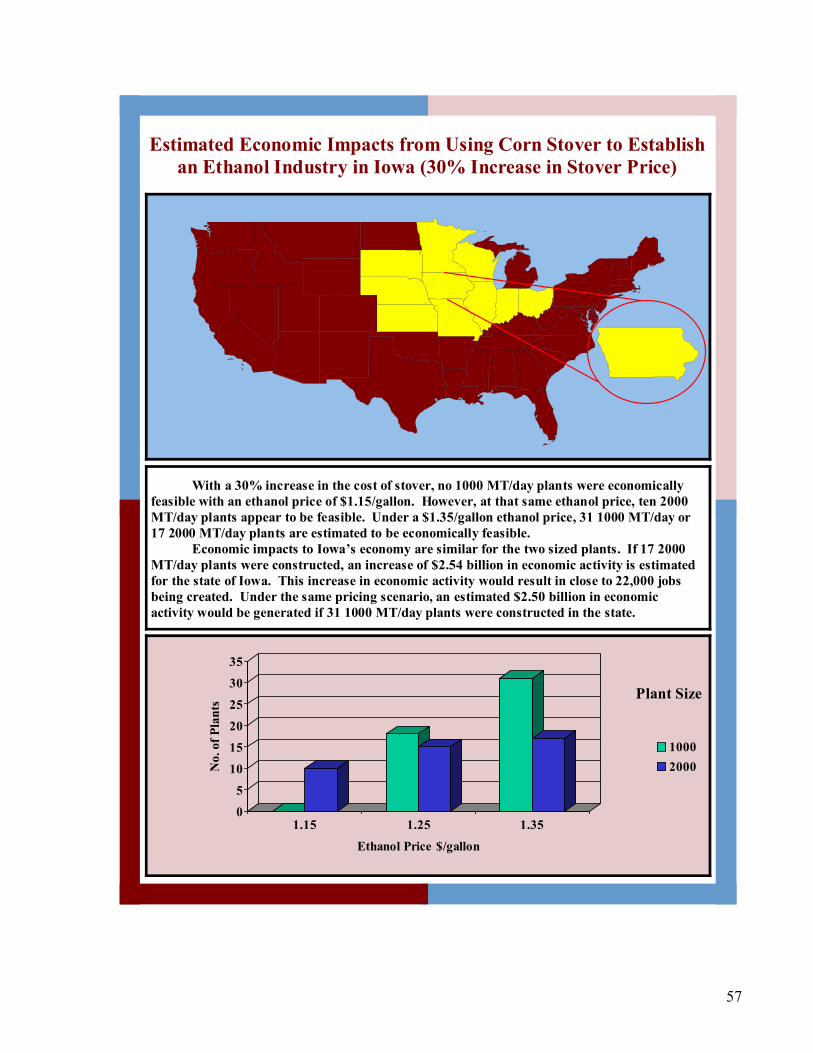
57
Estimated Economic Impacts from Using Corn Stover to Establish an Ethanol Industry in Iowa (30% Increase in Stover Price)
With a 30% increase in the cost of stover, no 1000 MT/day plants were economically feasible with an ethanol price of $1.15/gallon. However, at that same ethanol price, ten 2000 MT/day plants appear to be feasible. Under a $1.35/gallon ethanol price, 31 1000 MT/day or 17 2000 MT/day plants are estimated to be economically feasible. Economic impacts to Iowa’s economy are similar for the two sized plants. If 17 2000 MT/day plants were constructed, an increase of $2.54 billion in economic activity is estimated for the state of Iowa. This increase in economic activity would result in close to 22,000 jobs being created. Under the same pricing scenario, an estimated $2.50 billion in economic activity would be generated if 31 1000 MT/day plants were constructed in the state.
0
5
10
15
20
25
30
35
No.
of P
lant
s
1.15 1.25 1.35
Ethanol Price $/gallon
10002000
Plant Size

58
Total Annual Impacts (Operating + Agriculture + Transportation)
$1.15 Ethanol Price Assumption Direct Indirect Induced Total Year 2005; MT/day 1,000
TIO ($ millions) 0.00 0.00 0.00 0.00 Jobs (number) 0 0 0 0 TVA ($ millions) 0.00 0.00 0.00 0.00
Year 2005; MT/day 2,000
TIO ($ millions) 805.83 305.43 369.03 1,480.29 Jobs (number) 3,275 2,945 6,458 12,678 TVA ($ millions) 220.03 142.15 221.51 583.70 $1.25 Ethanol Price Assumption Direct Indirect Induced Total Year 2005; MT/day 1,000
TIO ($ millions) 783.10 294.87 351.78 1,429.75 Jobs (number) 5,674 2,812 5,768 14,253 TVA ($ millions) 217.25 137.24 211.42 565.91
Year 2005; MT/day 2,000
TIO ($ millions) 1,218.70 462.61 559.98 2,241.29 Jobs (number) 5,012 4,474 9,792 19,279 TVA ($ millions) 334.03 215.56 336.16 885.74 $1.35 Ethanol Price Assumption Direct Indirect Induced Total Year 2005; MT/day 1,000
TIO ($ millions) 1,357.86 511.93 611.77 2,481.56 Jobs (number) 9,863 4,893 10,031 24,788 TVA ($ millions) 377.84 238.50 367.70 984.04
Year 2005; MT/day 2,000
TIO ($ millions) 1,381.19 524.29 634.65 2,540.13 Jobs (number) 5,680 5,071 11,098 21,849 TVA ($ millions) 378.57 244.30 380.98 1,003.84

59
Estimated Economic Impacts from Using Corn Stover to Establish an Ethanol Industry in Kansas (Breakeven Stover Price)
In 1997, Kansas farmers planted 2.5 million acres in corn or 8 percent of their cropland. POLYSYS projected 2.5 million corn acres for 2005. The stover from these acres are sufficient enough to supply an estimated two 1000 MT/day plants or one 2000 MT/day plants with ethanol price set at $1.35 per gallon. Total state-level economic impacts if two 1000 MT/day corn stover-ethanol plants are constructed is estimated at $0.21 billion in increased economic activity and 1,840 new jobs. Under the 2000 MT/day, an estimated $0.22 billion in economic activity is created.
0
0.5
1
1.5
2
1.15 1.25 1.35
Ethano l P rice $ / gallo n
10002000
Plant Size
$0.00
$20.00
$40.00
$60.00
$80.00
$100.00
0 200 400 600 800 1,000 1,200 1,400 1,600Thousand Metric tons per year
Dol
lars
per
met
ric
ton
1000 MT/day 2000 MT/day

60
Total Annual Impacts (Operating + Agriculture + Transportation)
$1.15 Ethanol Price Assumption Direct Indirect Induced Total Year 2005; MT/day 1,000
TIO ($ millions) 0.00 0.00 0.00 0.00 Jobs (number) 0 0 0 0 TVA ($ millions) 0.00 0.00 0.00 0.00
Year 2005; MT/day 2,000
TIO ($ millions) 0.00 0.00 0.00 0.00 Jobs (number) 0 0 0 0 TVA ($ millions) 0.00 0.00 0.00 0.00 $1.25 Ethanol Price Assumption Direct Indirect Induced Total Year 2005; MT/day 1,000
TIO ($ millions) 94.10 49.97 61.09 205.16 Jobs (number) 430 449 962 1,840 TVA ($ millions) 28.69 24.12 37.57 90.38
Year 2005; MT/day 2,000
TIO ($ millions) 0.00 0.00 0.00 0.00 Jobs (number) 0 0 0 0 TVA ($ millions) 0.00 0.00 0.00 0.00 $1.35 Ethanol Price Assumption Direct Indirect Induced Total Year 2005; MT/day 1,000
TIO ($ millions) 94.10 49.97 61.09 205.16 Jobs (number) 430 449 962 1,840 TVA ($ millions) 28.69 24.12 37.57 90.38
Year 2005; MT/day 2,000
TIO ($ millions) 102.57 54.85 68.36 225.78 Jobs (number) 555 509 1,075 2,139 TVA ($ millions) 32.49 26.37 42.15 101.01

61
Estimated Economic Impacts from Using Corn Stover to Establish an Ethanol Industry in Kansas (15% Increase in Stover Price)
With a 15% increase in the cost of stover, no 1000 or 2000 MT/day plants were economically feasible with an ethanol price of $1.15/gallon. Under a $1.35/gallon ethanol price, two 1000 MT/day or one 2000 MT/day plants are estimated to be economically feasible. The largest impacts in the state occur with the 2000 MT/day plant although the impacts are similar for the 1000 MT/day plant size. If one 2000 MT/day plant was constructed, an increase of $0.22 billion in economic activity is estimated for the state of Kansas. This increase in economic activity would result in more than 2,000 jobs being created. Under the same pricing scenario, an estimated $0.20 billion in economic activity would also be generated if two 1000 MT/day plants were constructed in the state.
0
0.5
1
1.5
2
No.
of P
lant
s
1.15 1.25 1.35
Ethanol Price $/gallon
10002000
Plant Size
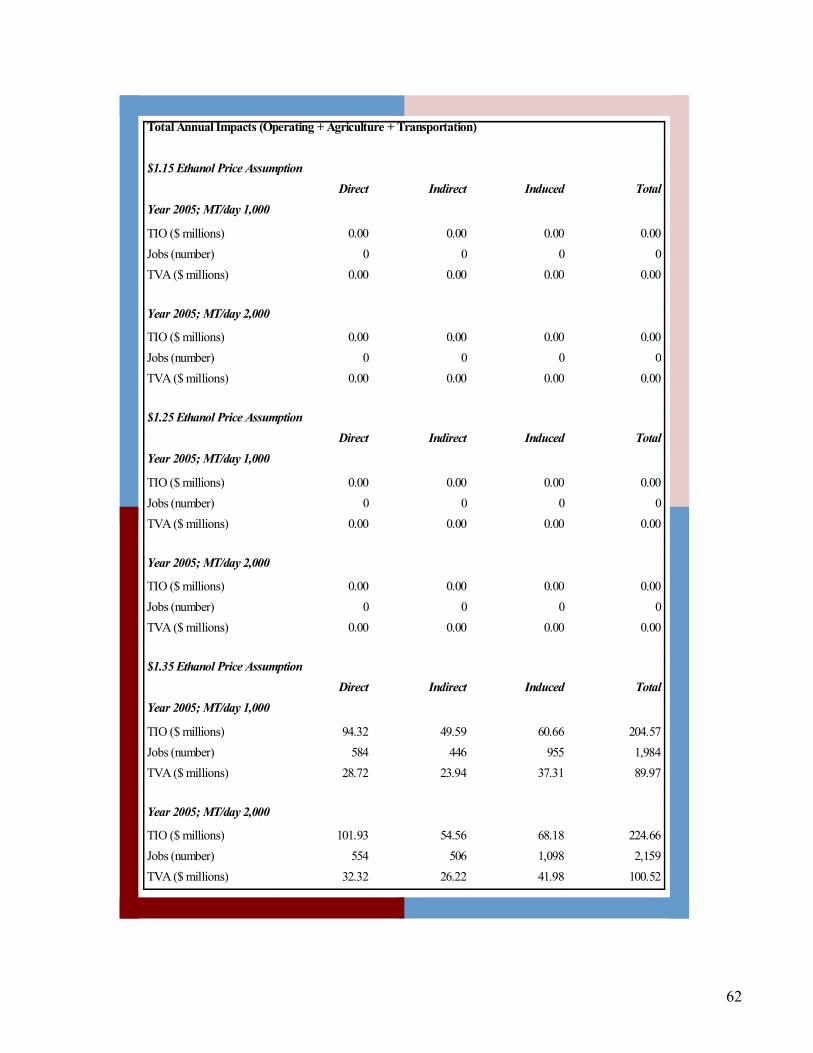
62
Total Annual Impacts (Operating + Agriculture + Transportation)
$1.15 Ethanol Price Assumption Direct Indirect Induced Total Year 2005; MT/day 1,000
TIO ($ millions) 0.00 0.00 0.00 0.00 Jobs (number) 0 0 0 0 TVA ($ millions) 0.00 0.00 0.00 0.00
Year 2005; MT/day 2,000
TIO ($ millions) 0.00 0.00 0.00 0.00 Jobs (number) 0 0 0 0 TVA ($ millions) 0.00 0.00 0.00 0.00 $1.25 Ethanol Price Assumption Direct Indirect Induced Total Year 2005; MT/day 1,000
TIO ($ millions) 0.00 0.00 0.00 0.00 Jobs (number) 0 0 0 0 TVA ($ millions) 0.00 0.00 0.00 0.00
Year 2005; MT/day 2,000
TIO ($ millions) 0.00 0.00 0.00 0.00 Jobs (number) 0 0 0 0 TVA ($ millions) 0.00 0.00 0.00 0.00 $1.35 Ethanol Price Assumption Direct Indirect Induced Total Year 2005; MT/day 1,000
TIO ($ millions) 94.32 49.59 60.66 204.57 Jobs (number) 584 446 955 1,984 TVA ($ millions) 28.72 23.94 37.31 89.97
Year 2005; MT/day 2,000
TIO ($ millions) 101.93 54.56 68.18 224.66 Jobs (number) 554 506 1,098 2,159 TVA ($ millions) 32.32 26.22 41.98 100.52

63
Estimated Economic Impacts from Using Corn Stover to Establish an Ethanol Industry in Kansas (30% Increase in Stover Price)
With a 30% increase in the cost of stover, no 2000 MT/day plants were economically feasible with an ethanol price of $1.15/gallon, $1.25/gallon, or $1.35/gallon. This holds true for the 1000 MT/day plants except with an ethanol price of $1.35/gallon. At this price, two 1000 MT/day plants are estimated to be economically feasible. If two 1000 MT/day plants were constructed, an increase of $0.20 billion in economic activity is estimated for the state of Kansas. This estimated increase in economic activity would result in more than 2,000 jobs being created.
00.20.40.60.8
11.21.41.61.8
2
No.
of P
lant
s
1.15 1.25 1.35
Ethanol Price $/gallon
10002000
Plant Size

64
Total Annual Impacts (Operating + Agriculture + Transportation)
$1.15 Ethanol Price Assumption Direct Indirect Induced Total Year 2005; MT/day 1,000
TIO ($ millions) 0.00 0.00 0.00 0.00 Jobs (number) 0 0 0 0 TVA ($ millions) 0.00 0.00 0.00 0.00
Year 2005; MT/day 2,000
TIO ($ millions) 0.00 0.00 0.00 0.00 Jobs (number) 0 0 0 0 TVA ($ millions) 0.00 0.00 0.00 0.00 $1.25 Ethanol Price Assumption Direct Indirect Induced Total Year 2005; MT/day 1,000
TIO ($ millions) 0.00 0.00 0.00 0.00 Jobs (number) 0 0 0 0 TVA ($ millions) 0.00 0.00 0.00 0.00
Year 2005; MT/day 2,000
TIO ($ millions) 0.00 0.00 0.00 0.00 Jobs (number) 0 0 0 0 TVA ($ millions) 0.00 0.00 0.00 0.00 $1.35 Ethanol Price Assumption Direct Indirect Induced Total Year 2005; MT/day 1,000
TIO ($ millions) 94.55 49.22 60.22 203.99 Jobs (number) 738 443 948 2,128 TVA ($ millions) 28.75 23.77 37.04 89.55
Year 2005; MT/day 2,000
TIO ($ millions) 0.00 0.00 0.00 0.00 Jobs (number) 0 0 0 0 TVA ($ millions) 0.00 0.00 0.00 0.00

65
Estimated Economic Impacts from Using Corn Stover to Establish an Ethanol Industry in Minnesota (Breakeven Stover Price)
In 1997, Minnesota farmers planted 6.2 million acres in corn or 29 percent of their cropland. POLYSYS pro-jected 7.8 million corn acres for 2005. The stover from these acres are sufficient enough to supply an estimated 20 1000 MT/day plants or ten 2000 MT/day plants with ethanol price set at $1.35 per gallon. Total state-level economic impacts if 20 1000 MT/day corn stover-ethanol plants are constructed is estimated at $1.73 billion in in-creased economic activity and 14,002 new jobs. Under the 2000 MT/day, an estimated $1.65 billion in economic activity is created.
0
5
10
15
20
1.15 1.25 1.35
Ethano l P rice $ / gallo n
10002000
Plant Size
$0.00
$20.00
$40.00
$60.00
$80.00
0 1,000 2,000 3,000 4,000 5,000 6,000 7,000 8,000 9,000
Thousand Metric tons per year
Dol
lars
per
met
ric
ton
1000 MT/day 2000 MT/day

66
Total Annual Impacts (Operating + Agriculture + Transportation)
$1.15 Ethanol Price Assumption Direct Indirect Induced Total Year 2005; MT/day 1,000
TIO ($ millions) 127.35 57.14 68.07 252.56 Jobs (number) 558 517 950 2,025 TVA ($ millions) 31.59 28.97 41.33 101.89
Year 2005; MT/day 2,000
TIO ($ millions) 656.07 295.89 355.27 1,307.23 Jobs (number) 3,025 2,695 4,967 10,687 TVA ($ millions) 165.26 149.24 215.81 530.32 $1.25 Ethanol Price Assumption Direct Indirect Induced Total Year 2005; MT/day 1,000
TIO ($ millions) 733.70 331.38 395.90 1,460.98 Jobs (number) 3,282 3,010 5,527 11,819 TVA ($ millions) 183.99 168.05 240.41 592.45
Year 2005; MT/day 2,000
TIO ($ millions) 825.10 373.00 448.33 1,646.43 Jobs (number) 3,830 3,402 6,268 13,500 TVA ($ millions) 208.64 188.17 272.34 669.16 $1.35 Ethanol Price Assumption Direct Indirect Induced Total Year 2005; MT/day 1,000
TIO ($ millions) 866.61 392.02 468.66 1,727.29 Jobs (number) 3,896 3,564 6,542 14,002 TVA ($ millions) 217.87 198.81 284.61 701.29
Year 2005; MT/day 2,000
TIO ($ millions) 825.10 373.00 448.33 1,646.43 Jobs (number) 3,830 3,402 6,268 13,500 TVA ($ millions) 208.64 188.17 272.34 669.16
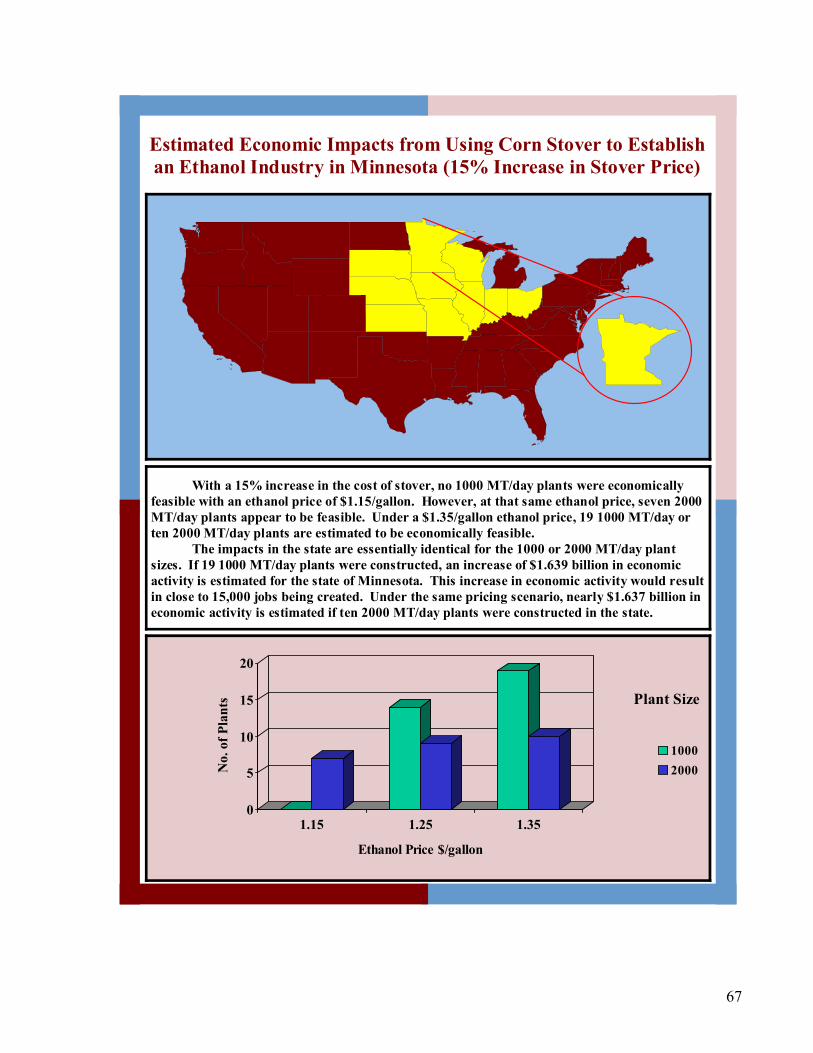
67
Estimated Economic Impacts from Using Corn Stover to Establish an Ethanol Industry in Minnesota (15% Increase in Stover Price)
With a 15% increase in the cost of stover, no 1000 MT/day plants were economically feasible with an ethanol price of $1.15/gallon. However, at that same ethanol price, seven 2000 MT/day plants appear to be feasible. Under a $1.35/gallon ethanol price, 19 1000 MT/day or ten 2000 MT/day plants are estimated to be economically feasible. The impacts in the state are essentially identical for the 1000 or 2000 MT/day plant sizes. If 19 1000 MT/day plants were constructed, an increase of $1.639 billion in economic activity is estimated for the state of Minnesota. This increase in economic activity would result in close to 15,000 jobs being created. Under the same pricing scenario, nearly $1.637 billion in economic activity is estimated if ten 2000 MT/day plants were constructed in the state.
0
5
10
15
20
No.
of P
lant
s
1.15 1.25 1.35
Ethanol Price $/gallon
10002000
Plant Size

68
Total Annual Impacts (Operating + Agriculture + Transportation)
$1.15 Ethanol Price Assumption Direct Indirect Induced Total Year 2005; MT/day 1,000
TIO ($ millions) 0.00 0.00 0.00 0.00 Jobs (number) 0 0 0 0 TVA ($ millions) 0.00 0.00 0.00 0.00
Year 2005; MT/day 2,000
TIO ($ millions) 569.54 257.26 310.21 1,137.00 Jobs (number) 2,641 2,342 4,516 9,500 TVA ($ millions) 143.74 129.68 188.04 461.46 $1.25 Ethanol Price Assumption Direct Indirect Induced Total Year 2005; MT/day 1,000
TIO ($ millions) 607.10 270.76 323.62 1,201.48 Jobs (number) 3,999 2,460 4,518 10,977 TVA ($ millions) 152.39 137.33 196.52 486.25
Year 2005; MT/day 2,000
TIO ($ millions) 736.78 333.58 402.66 1,473.02 Jobs (number) 3,440 3,042 5,860 12,342 TVA ($ millions) 186.66 168.19 244.09 598.94 $1.35 Ethanol Price Assumption Direct Indirect Induced Total Year 2005; MT/day 1,000
TIO ($ millions) 827.18 369.51 441.95 1,638.65 Jobs (number) 5,460 3,361 6,169 14,990 TVA ($ millions) 208.16 187.43 268.39 663.98
Year 2005; MT/day 2,000
TIO ($ millions) 818.64 370.65 447.40 1,636.69 Jobs (number) 3,822 3,380 6,511 13,713 TVA ($ millions) 207.40 186.88 271.21 665.49

69
Estimated Economic Impacts from Using Corn Stover to Establish an Ethanol Industry in Minnesota (30% Increase in Stover Price)
With a 30% increase in the cost of stover, no 1000 MT/day plants were economically feasible with an ethanol price of $1.15/gallon. However, at that same ethanol price, five 2000 MT/day plants appear to be feasible. Under a $1.35/gallon ethanol price, 19 1000 MT/day or ten 2000 MT/day plants are estimated to be economically feasible. The impacts in the state are very similar for both the 1000 and 2000 MT/day plants. If 19 1000 MT/day plants were constructed, an increase of $1.64 billion in economic activity is estimated. For 2000 MT/day plants, an estimated $1.63 billion in increased economic activity would occur if ten plants were constructed in the state. This increase in economic activity would result in an estimated increase of more than 16,600 new jobs for the 1000 MT/day plants and close to 14,000 new jobs for the 2000 MT/day plants.
0
5
10
15
20
No.
of P
lant
s
1.15 1.25 1.35
Ethanol Price $/gallon
10002000
Plant Size

70
Total Annual Impacts (Operating + Agriculture + Transportation)
$1.15 Ethanol Price Assumption Direct Indirect Induced Total Year 2005; MT/day 1,000
TIO ($ millions) 0.00 0.00 0.00 0.00 Jobs (number) 0 0 0 0 TVA ($ millions) 0.00 0.00 0.00 0.00
Year 2005; MT/day 2,000
TIO ($ millions) 403.59 182.58 221.12 807.30 Jobs (number) 1,882 1,662 3,348 6,892 TVA ($ millions) 102.05 91.98 133.75 327.79 $1.25 Ethanol Price Assumption Direct Indirect Induced Total Year 2005; MT/day 1,000
TIO ($ millions) 435.71 191.88 229.44 857.03 Jobs (number) 3,782 1,745 3,203 8,730 TVA ($ millions) 109.48 97.34 139.33 346.14
Year 2005; MT/day 2,000
TIO ($ millions) 730.98 331.47 401.83 1,464.29 Jobs (number) 3,432 3,022 6,079 12,533 TVA ($ millions) 185.55 167.03 243.07 595.65 $1.35 Ethanol Price Assumption Direct Indirect Induced Total Year 2005; MT/day 1,000
TIO ($ millions) 831.11 366.61 438.69 1,636.42 Jobs (number) 7,219 3,337 6,123 16,679 TVA ($ millions) 209.35 186.00 266.40 661.75
Year 2005; MT/day 2,000
TIO ($ millions) 812.21 368.30 446.48 1,626.99 Jobs (number) 3,813 3,358 6,755 13,926 TVA ($ millions) 206.17 185.59 270.08 661.83

71
Estimated Economic Impacts from Using Corn Stover to Establish an Ethanol Industry in Missouri (Breakeven Stover Price)
In 1997, Missouri farmers planted 2.5 million acres in corn or 13 percent of their cropland. POLYSYS pro-jected 2.5 million corn acres for 2005. The stover from these acres are sufficient enough to supply an estimated two 1000 MT/day plants or two 2000 MT/day plants with ethanol price set at $1.35 per gallon. Total state-level economic impacts if two 1000 MT/day corn stover-ethanol plants are constructed is estimated at $0.21 bil-lion in increased economic activity and 1,975 new jobs. Under the 2000 MT/day, an estimated $0.47 billion in economic activity is created.
0
0.5
1
1.5
2
1.15 1.25 1.35
Ethano l P rice $ / gallo n
10002000
Plant Size
$0.00
$20.00
$40.00
$60.00
$80.00
0 200 400 600 800 1,000 1,200 1,400 1,600 1,800 2,000
Thousand Metric tons per year
Dol
lars
per
met
ric
ton
1000 MT/day 2000 MT/day

72
Total Annual Impacts (Operating + Agriculture + Transportation)
$1.15 Ethanol Price Assumption Direct Indirect Induced Total Year 2005; MT/day 1,000
TIO ($ millions) 0.00 0.00 0.00 0.00 Jobs (number) 0 0 0 0 TVA ($ millions) 0.00 0.00 0.00 0.00
Year 2005; MT/day 2,000
TIO ($ millions) 0.00 0.00 0.00 0.00 Jobs (number) 0 0 0 0 TVA ($ millions) 0.00 0.00 0.00 0.00 $1.25 Ethanol Price Assumption Direct Indirect Induced Total Year 2005; MT/day 1,000
TIO ($ millions) 88.74 45.34 68.58 202.65 Jobs (number) 504 406 1,006 1,916 TVA ($ millions) 34.13 23.41 41.72 99.26
Year 2005; MT/day 2,000
TIO ($ millions) 0.00 0.00 0.00 0.00 Jobs (number) 0 0 0 0 TVA ($ millions) 0.00 0.00 0.00 0.00 $1.35 Ethanol Price Assumption Direct Indirect Induced Total Year 2005; MT/day 1,000
TIO ($ millions) 90.73 46.57 70.36 207.66 Jobs (number) 523 420 1,032 1,975 TVA ($ millions) 34.96 24.07 42.81 101.83
Year 2005; MT/day 2,000
TIO ($ millions) 203.39 107.42 160.64 471.45 Jobs (number) 1,409 1,024 2,362 4,795 TVA ($ millions) 78.71 55.69 97.89 232.29

73
Estimated Economic Impacts from Using Corn Stover to Establish an Ethanol Industry in Missouri (15% Increase in Stover Price)
With a 15% increase in the cost of stover, no 1000 or 2000 MT/day plants were economically feasible with an ethanol price of $1.15/gallon. If ethanol price increases to $1.35/gallon, two 1000 MT/day or one 2000 MT/day plants are estimated to be economically feasible. The largest impacts in the state occur with the 2000 MT/day plant although the impacts are similar for the 1000 MT/day plant size. If one 2000 MT/day plant was constructed, an increase of nearly $0.23 billion in economic activity is estimated for the state of Missouri. This increase in economic activity would result in more than 2,400 jobs being created. Under the same pricing scenario, an estimated $0.21 billion in economic activity would be generated if two 1000 MT/day plants were constructed in the state.
0
0.5
1
1.5
2
No.
of P
lant
s
1.15 1.25 1.35
Ethanol Price $/gallon
10002000
Plant Size

74
Total Annual Impacts (Operating + Agriculture + Transportation)
$1.15 Ethanol Price Assumption Direct Indirect Induced Total Year 2005; MT/day 1,000
TIO ($ millions) 0.00 0.00 0.00 0.00 Jobs (number) 0 0 0 0 TVA ($ millions) 0.00 0.00 0.00 0.00
Year 2005; MT/day 2,000
TIO ($ millions) 0.00 0.00 0.00 0.00 Jobs (number) 0 0 0 0 TVA ($ millions) 0.00 0.00 0.00 0.00 $1.25 Ethanol Price Assumption Direct Indirect Induced Total Year 2005; MT/day 1,000
TIO ($ millions) 44.53 22.50 34.01 101.03 Jobs (number) 427 201 499 1,127 TVA ($ millions) 17.02 11.62 20.69 49.33
Year 2005; MT/day 2,000
TIO ($ millions) 0.00 0.00 0.00 0.00 Jobs (number) 0 0 0 0 TVA ($ millions) 0.00 0.00 0.00 0.00 $1.35 Ethanol Price Assumption Direct Indirect Induced Total Year 2005; MT/day 1,000
TIO ($ millions) 91.04 46.23 69.79 207.06 Jobs (number) 874 417 1,024 2,315 TVA ($ millions) 34.87 23.89 42.47 101.23
Year 2005; MT/day 2,000
TIO ($ millions) 101.05 53.45 80.07 234.56 Jobs (number) 704 510 1,216 2,430 TVA ($ millions) 39.10 27.70 48.73 115.52

75
Estimated Economic Impacts from Using Corn Stover to Establish an Ethanol Industry in Missouri (30% Increase in Stover Price)
With a 30% increase in the cost of stover, no 1000 or 2000 MT/day plants appear to be economically feasible at an ethanol price of $1.15/gallon. However, at an ethanol price of a $1.35/gallon, two 1000 MT/day or one 2000 MT/day plants are estimated to be economically feasible. Although the economic impacts are very similar for both plant sizes, the largest impacts in the state would occur with the operation of a single 2000 MT/day plant. If this plant was constructed, an increase of nearly $0.23 billion in economic activity is estimated for the state of Missouri. This increase in economic activity would result in more than 2,400 jobs being created. Under the same pricing scenario, an estimated $0.21 billion in economic activity would be generated if two 1000 MT/day plants were constructed in the state.
0
0.5
1
1.5
2
No.
of P
lant
s
1.15 1.25 1.35
Ethanol Price $/gallon
10002000
Plant Size

76
Total Annual Impacts (Operating + Agriculture + Transportation)
$1.15 Ethanol Price Assumption Direct Indirect Induced Total Year 2005; MT/day 1,000
TIO ($ millions) 0.00 0.00 0.00 0.00 Jobs (number) 0 0 0 0 TVA ($ millions) 0.00 0.00 0.00 0.00
Year 2005; MT/day 2,000
TIO ($ millions) 0.00 0.00 0.00 0.00 Jobs (number) 0 0 0 0 TVA ($ millions) 0.00 0.00 0.00 0.00 $1.25 Ethanol Price Assumption Direct Indirect Induced Total Year 2005; MT/day 1,000
TIO ($ millions) 44.69 22.32 33.73 100.73 Jobs (number) 602 200 495 1,297 TVA ($ millions) 16.98 11.53 20.52 49.03
Year 2005; MT/day 2,000
TIO ($ millions) 0.00 0.00 0.00 0.00 Jobs (number) 0 0 0 0 TVA ($ millions) 0.00 0.00 0.00 0.00 $1.35 Ethanol Price Assumption Direct Indirect Induced Total Year 2005; MT/day 1,000
TIO ($ millions) 91.36 45.88 69.23 206.47 Jobs (number) 1,224 414 1,016 2,654 TVA ($ millions) 34.78 23.72 42.13 100.63
Year 2005; MT/day 2,000
TIO ($ millions) 100.41 53.18 79.82 233.41 Jobs (number) 704 507 1,252 2,463 TVA ($ millions) 38.84 27.55 48.51 114.90
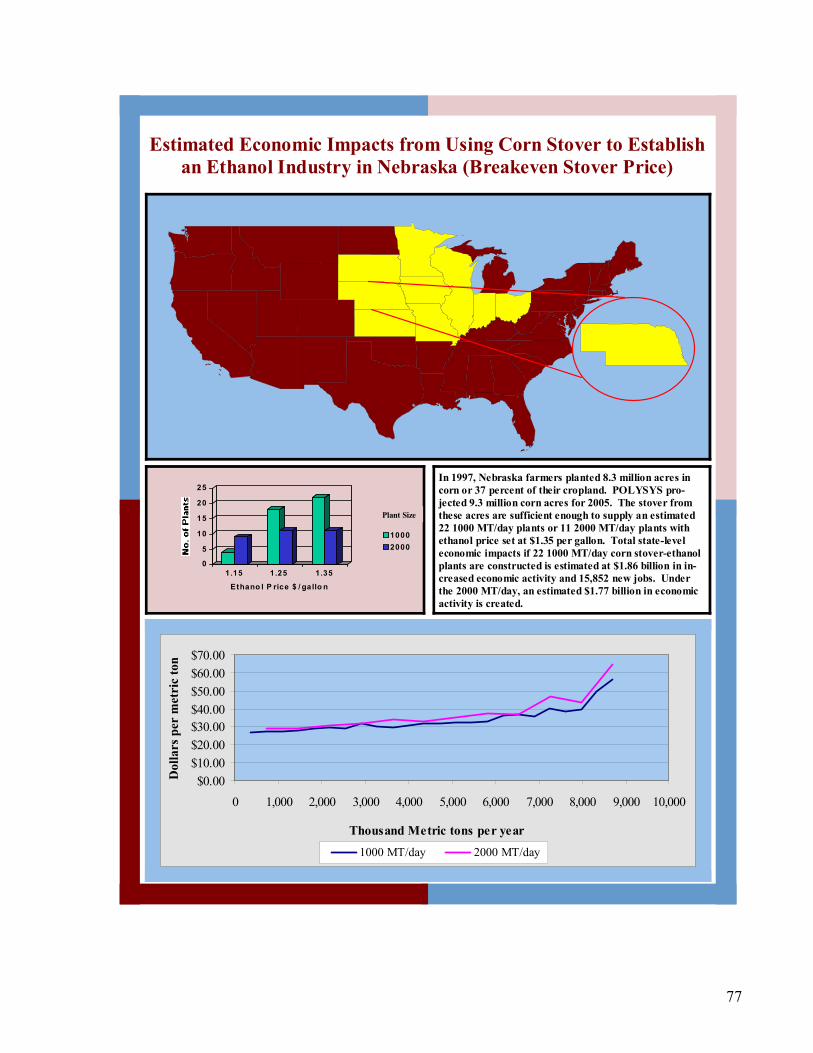
77
Estimated Economic Impacts from Using Corn Stover to Establish an Ethanol Industry in Nebraska (Breakeven Stover Price)
In 1997, Nebraska farmers planted 8.3 million acres in corn or 37 percent of their cropland. POLYSYS pro-jected 9.3 million corn acres for 2005. The stover from these acres are sufficient enough to supply an estimated 22 1000 MT/day plants or 11 2000 MT/day plants with ethanol price set at $1.35 per gallon. Total state-level economic impacts if 22 1000 MT/day corn stover-ethanol plants are constructed is estimated at $1.86 billion in in-creased economic activity and 15,852 new jobs. Under the 2000 MT/day, an estimated $1.77 billion in economic activity is created.
0
5
10
15
20
25
1.15 1.25 1.35
Ethano l P rice $ / gallo n
10002000
Plant Size
$0.00$10.00$20.00$30.00$40.00$50.00$60.00$70.00
0 1,000 2,000 3,000 4,000 5,000 6,000 7,000 8,000 9,000 10,000
Thousand Metric tons per year
Dol
lars
per
met
ric
ton
1000 MT/day 2000 MT/day

78
Total Annual Impacts (Operating + Agriculture + Transportation)
$1.15 Ethanol Price Assumption Direct Indirect Induced Total Year 2005; MT/day 1,000
TIO ($ millions) 169.40 70.30 86.13 325.84 Jobs (number) 658 694 1,389 2,741 TVA ($ millions) 43.18 33.62 52.11 128.91
Year 2005; MT/day 2,000
TIO ($ millions) 738.99 303.83 380.74 1,423.56 Jobs (number) 3,013 3,017 6,142 12,173 TVA ($ millions) 193.79 144.69 230.57 569.05 $1.25 Ethanol Price Assumption Direct Indirect Induced Total Year 2005; MT/day 1,000
TIO ($ millions) 777.56 324.31 399.45 1,501.32 Jobs (number) 3,108 3,218 6,440 12,766 TVA ($ millions) 200.73 155.41 241.67 597.81
Year 2005; MT/day 2,000
TIO ($ millions) 917.84 379.00 476.73 1,773.57 Jobs (number) 3,822 3,778 7,689 15,288 TVA ($ millions) 243.03 180.79 288.70 712.52 $1.35 Ethanol Price Assumption Direct Indirect Induced Total Year 2005; MT/day 1,000
TIO ($ millions) 959.19 400.98 495.07 1,855.23 Jobs (number) 3,884 3,988 7,980 15,852 TVA ($ millions) 249.05 192.33 299.54 740.92
Year 2005; MT/day 2,000
TIO ($ millions) 917.84 379.00 476.73 1,773.57 Jobs (number) 3,822 3,778 7,689 15,288 TVA ($ millions) 243.03 180.79 288.70 712.52
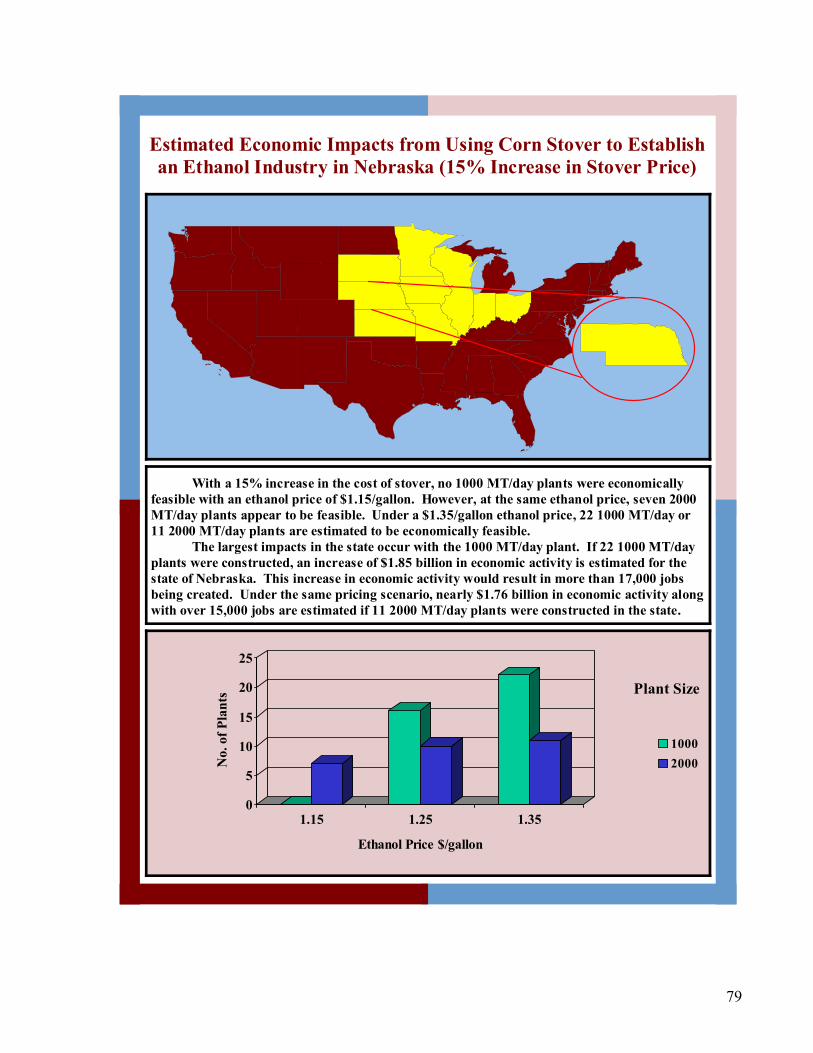
79
Estimated Economic Impacts from Using Corn Stover to Establish an Ethanol Industry in Nebraska (15% Increase in Stover Price)
With a 15% increase in the cost of stover, no 1000 MT/day plants were economically feasible with an ethanol price of $1.15/gallon. However, at the same ethanol price, seven 2000 MT/day plants appear to be feasible. Under a $1.35/gallon ethanol price, 22 1000 MT/day or 11 2000 MT/day plants are estimated to be economically feasible. The largest impacts in the state occur with the 1000 MT/day plant. If 22 1000 MT/day plants were constructed, an increase of $1.85 billion in economic activity is estimated for the state of Nebraska. This increase in economic activity would result in more than 17,000 jobs being created. Under the same pricing scenario, nearly $1.76 billion in economic activity along with over 15,000 jobs are estimated if 11 2000 MT/day plants were constructed in the state.
0
5
10
15
20
25
No.
of P
lant
s
1.15 1.25 1.35
Ethanol Price $/gallon
10002000
Plant Size

80
Total Annual Impacts (Operating + Agriculture + Transportation)
$1.15 Ethanol Price Assumption Direct Indirect Induced Total Year 2005; MT/day 1,000
TIO ($ millions) 0.00 0.00 0.00 0.00 Jobs (number) 0 0 0 0 TVA ($ millions) 0.00 0.00 0.00 0.00
Year 2005; MT/day 2,000
TIO ($ millions) 570.24 234.56 295.11 1,099.91 Jobs (number) 2,336 2,330 4,927 9,593 TVA ($ millions) 149.91 111.68 178.46 440.05 $1.25 Ethanol Price Assumption Direct Indirect Induced Total Year 2005; MT/day 1,000
TIO ($ millions) 694.17 285.79 352.51 1,332.47 Jobs (number) 3,937 2,838 5,683 12,458 TVA ($ millions) 179.96 137.00 213.27 530.23
Year 2005; MT/day 2,000
TIO ($ millions) 827.94 342.04 431.92 1,601.90 Jobs (number) 3,464 3,410 7,204 14,077 TVA ($ millions) 219.78 163.12 261.21 644.11 $1.35 Ethanol Price Assumption Direct Indirect Induced Total Year 2005; MT/day 1,000
TIO ($ millions) 963.31 397.57 491.56 1,852.44 Jobs (number) 5,499 3,957 7,923 17,378 TVA ($ millions) 251.17 190.76 297.41 739.33
Year 2005; MT/day 2,000
TIO ($ millions) 910.73 376.24 475.12 1,762.09 Jobs (number) 3,810 3,751 7,924 15,485 TVA ($ millions) 241.75 179.43 287.33 708.52

81
Estimated Economic Impacts from Using Corn Stover to Establish an Ethanol Industry in Nebraska (30% Increase in Stover Price)
With a 30% increase in the cost of stover, no 1000 MT/day plants were economically feasible with an ethanol price of $1.15/gallon. However, at that same ethanol price, five 2000 MT/day plants appear to be feasible. Under a $1.35/gallon ethanol price, 19 1000 MT/day or 11 2000 MT/day plants are estimated to be economically feasible. The largest impacts in the state occur with the 2000 MT/day plant. If 11 plants were constructed, an increase of $1.75 billion in economic activity is estimated for the state of Nebraska. This increase in economic activity would result in more than 15,000 jobs being created. Under the same pricing scenario, an estimated $1.60 billion in economic activity would be generated if 19 1000 MT/day plants were constructed in the state.
0
5
10
15
20
No.
of P
lant
s
1.15 1.25 1.35
Ethanol Price $/gallon
10002000
Plant Size
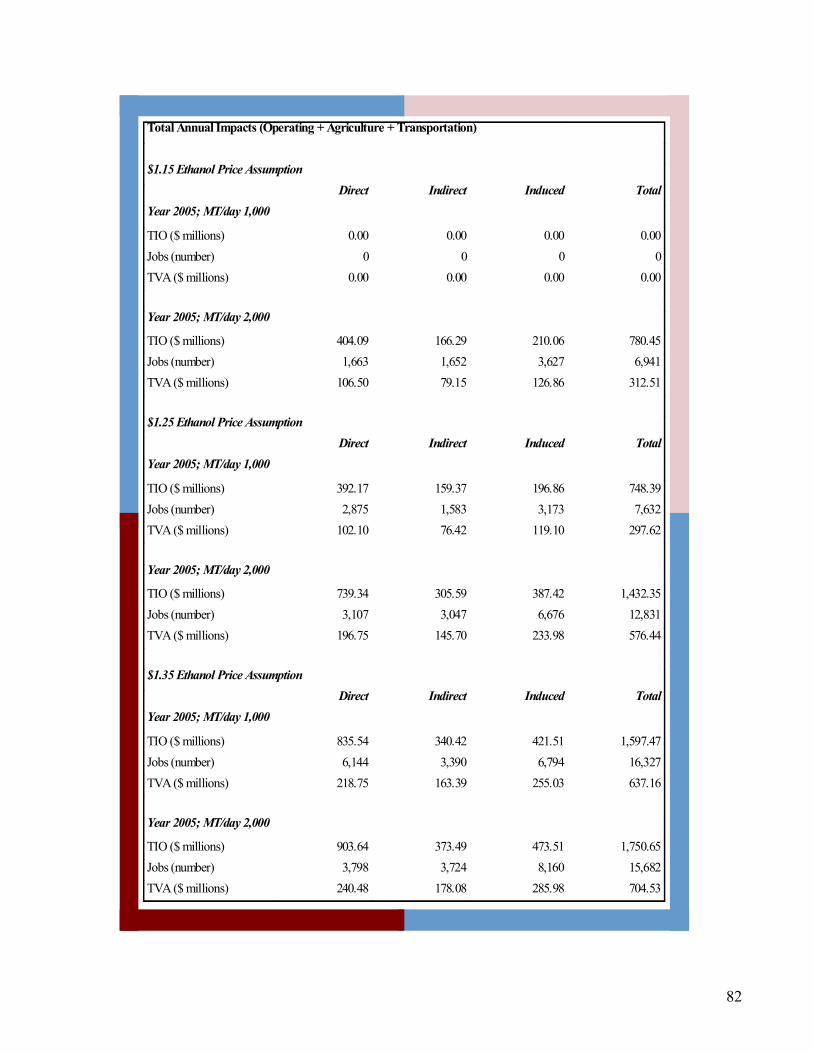
82
Total Annual Impacts (Operating + Agriculture + Transportation)
$1.15 Ethanol Price Assumption Direct Indirect Induced Total Year 2005; MT/day 1,000
TIO ($ millions) 0.00 0.00 0.00 0.00 Jobs (number) 0 0 0 0 TVA ($ millions) 0.00 0.00 0.00 0.00
Year 2005; MT/day 2,000
TIO ($ millions) 404.09 166.29 210.06 780.45 Jobs (number) 1,663 1,652 3,627 6,941 TVA ($ millions) 106.50 79.15 126.86 312.51 $1.25 Ethanol Price Assumption Direct Indirect Induced Total Year 2005; MT/day 1,000
TIO ($ millions) 392.17 159.37 196.86 748.39 Jobs (number) 2,875 1,583 3,173 7,632 TVA ($ millions) 102.10 76.42 119.10 297.62
Year 2005; MT/day 2,000
TIO ($ millions) 739.34 305.59 387.42 1,432.35 Jobs (number) 3,107 3,047 6,676 12,831 TVA ($ millions) 196.75 145.70 233.98 576.44 $1.35 Ethanol Price Assumption Direct Indirect Induced Total Year 2005; MT/day 1,000
TIO ($ millions) 835.54 340.42 421.51 1,597.47 Jobs (number) 6,144 3,390 6,794 16,327 TVA ($ millions) 218.75 163.39 255.03 637.16
Year 2005; MT/day 2,000
TIO ($ millions) 903.64 373.49 473.51 1,750.65 Jobs (number) 3,798 3,724 8,160 15,682 TVA ($ millions) 240.48 178.08 285.98 704.53

83
Estimated Economic Impacts from Using Corn Stover to Establish an Ethanol Industry in Ohio (Breakeven Stover Price)
In 1997, Ohio farmers planted 3.4 million acres in corn or 30 percent of their cropland. POLYSYS projected 3.0 million corn acres for 2005. The stover from these acres are sufficient enough to supply an estimated six 1000 MT/day plants or three 2000 MT/day plants with ethanol price set at $1.35 per gallon. Total state-level economic impacts if six 1000 MT/day corn stover-ethanol plants are constructed is estimated at $0.54 billion in increased economic activity and 4,398 new jobs. Under the 2000 MT/day, an estimated $0.51 billion in economic activity is created.
0123456
1.15 1.25 1.35
Ethano l P rice $ / gallo n
10002000
Plant Size
$0.00$10.00$20.00$30.00$40.00$50.00$60.00
0 500 1,000 1,500 2,000 2,500 3,000
Thousand Metric tons per year
Dol
lars
per
met
ric
ton
1000 MT/day 2000 MT/day

84
Total Annual Impacts (Operating + Agriculture + Transportation)
$1.15 Ethanol Price Assumption Direct Indirect Induced Total Year 2005; MT/day 1,000
TIO ($ millions) 0.00 0.00 0.00 0.00 Jobs (number) 0 0 0 0 TVA ($ millions) 0.00 0.00 0.00 0.00
Year 2005; MT/day 2,000
TIO ($ millions) 169.92 83.95 85.00 338.86 Jobs (number) 856 692 1,248 2,797 TVA ($ millions) 53.41 40.12 51.22 144.75 $1.25 Ethanol Price Assumption Direct Indirect Induced Total Year 2005; MT/day 1,000
TIO ($ millions) 178.93 88.06 88.59 355.58 Jobs (number) 847 723 1,299 2,869 TVA ($ millions) 55.55 42.08 53.34 150.97
Year 2005; MT/day 2,000
TIO ($ millions) 257.01 127.21 128.91 513.13 Jobs (number) 1,305 1,052 1,893 4,250 TVA ($ millions) 81.02 60.81 77.69 219.52 $1.35 Ethanol Price Assumption Direct Indirect Induced Total Year 2005; MT/day 1,000
TIO ($ millions) 272.08 134.31 135.32 541.71 Jobs (number) 1,305 1,109 1,985 4,398 TVA ($ millions) 84.87 64.20 81.49 230.56
Year 2005; MT/day 2,000
TIO ($ millions) 257.01 127.21 128.91 513.13 Jobs (number) 1,305 1,052 1,893 4,250 TVA ($ millions) 81.02 60.81 77.69 219.52

85
Estimated Economic Impacts from Using Corn Stover to Establish an Ethanol Industry in Ohio (15% Increase in Stover Price)
With a 15% increase in the cost of stover, no 1000 MT/day plants were economically feasible with an ethanol price of $1.15/gallon. However, at that same ethanol price, one 2000 MT/day plant appears to be feasible. Under a $1.35/gallon ethanol price, five 1000 MT/day or three 2000 MT/day plants are estimated to be economically feasible. The largest impacts in the state occur with the 2000 MT/day plant. If three plants were constructed, an increase of $0.51 billion in economic activity is estimated for the state of Ohio. This increase in economic activity would result in more than 4,000 jobs being created. Under the same pricing scenario, nearly $0.45 billion in economic activity is estimated if five 1000 MT/day plants were constructed in the state.
0
1
2
3
4
5
No.
of P
lant
s
1.15 1.25 1.35
Ethanol Price $/gallon
10002000
Plant Size

86
Total Annual Impacts (Operating + Agriculture + Transportation)
$1.15 Ethanol Price Assumption Direct Indirect Induced Total Year 2005; MT/day 1,000
TIO ($ millions) 0.00 0.00 0.00 0.00 Jobs (number) 0 0 0 0 TVA ($ millions) 0.00 0.00 0.00 0.00
Year 2005; MT/day 2,000
TIO ($ millions) 84.31 41.71 42.39 168.41 Jobs (number) 427 344 643 1,414 TVA ($ millions) 26.52 19.92 25.48 71.93 $1.25 Ethanol Price Assumption Direct Indirect Induced Total Year 2005; MT/day 1,000
TIO ($ millions) 44.90 21.84 21.98 88.72 Jobs (number) 314 179 322 816 TVA ($ millions) 13.90 10.44 13.23 37.58
Year 2005; MT/day 2,000
TIO ($ millions) 170.05 84.28 85.72 340.05 Jobs (number) 868 697 1,300 2,865 TVA ($ millions) 53.65 40.26 51.54 145.45 $1.35 Ethanol Price Assumption Direct Indirect Induced Total Year 2005; MT/day 1,000
TIO ($ millions) 227.57 111.07 111.91 450.55 Jobs (number) 1,601 917 1,642 4,160 TVA ($ millions) 70.81 53.09 67.40 191.30
Year 2005; MT/day 2,000
TIO ($ millions) 255.08 126.41 128.58 510.07 Jobs (number) 1,302 1,045 1,950 4,297 TVA ($ millions) 80.47 60.38 77.31 218.17

87
Estimated Economic Impacts from Using Corn Stover to Establish an Ethanol Industry in Ohio (30% Increase in Stover Price)
With a 30% increase in the cost of stover, no 1000 or 2000 MT/day plants were economically feasible with an ethanol price of $1.15/gallon. At an ethanol price of $1.35/gallon, four 1000 MT/day or three 2000 MT/day plants are estimated to be economically feasible. The largest impacts in the state occur with the 2000 MT/day plant. If three plants were constructed, an increase of $0.51 billion in economic activity is estimated for the state of Ohio. This increase in economic activity would result in over 4,300 jobs being created. Under the same pricing scenario, an estimated $0.36 billion in economic activity would be generated if four 1000 MT/day plants were constructed in the state.
00.5
11.5
22.5
33.5
4
No.
of P
lant
s
1.15 1.25 1.35
Ethanol Price $/gallon
10002000
Plant Size

88
Total Annual Impacts (Operating + Agriculture + Transportation)
$1.15 Ethanol Price Assumption Direct Indirect Induced Total Year 2005; MT/day 1,000
TIO ($ millions) 0.00 0.00 0.00 0.00 Jobs (number) 0 0 0 0 TVA ($ millions) 0.00 0.00 0.00 0.00
Year 2005; MT/day 2,000
TIO ($ millions) 0.00 0.00 0.00 0.00 Jobs (number) 0 0 0 0 TVA ($ millions) 0.00 0.00 0.00 0.00 $1.25 Ethanol Price Assumption Direct Indirect Induced Total Year 2005; MT/day 1,000
TIO ($ millions) 0.00 0.00 0.00 0.00 Jobs (number) 0 0 0 0 TVA ($ millions) 0.00 0.00 0.00 0.00
Year 2005; MT/day 2,000
TIO ($ millions) 168.77 83.75 85.50 338.01 Jobs (number) 866 692 1,338 2,896 TVA ($ millions) 53.28 39.97 51.29 144.55 $1.35 Ethanol Price Assumption Direct Indirect Induced Total Year 2005; MT/day 1,000
TIO ($ millions) 182.72 88.18 88.85 359.75 Jobs (number) 1,692 729 1,303 3,724 TVA ($ millions) 56.71 42.15 53.51 152.38
Year 2005; MT/day 2,000
TIO ($ millions) 253.15 125.62 128.25 507.02 Jobs (number) 1,299 1,038 2,007 4,344 TVA ($ millions) 79.93 59.96 76.94 216.83
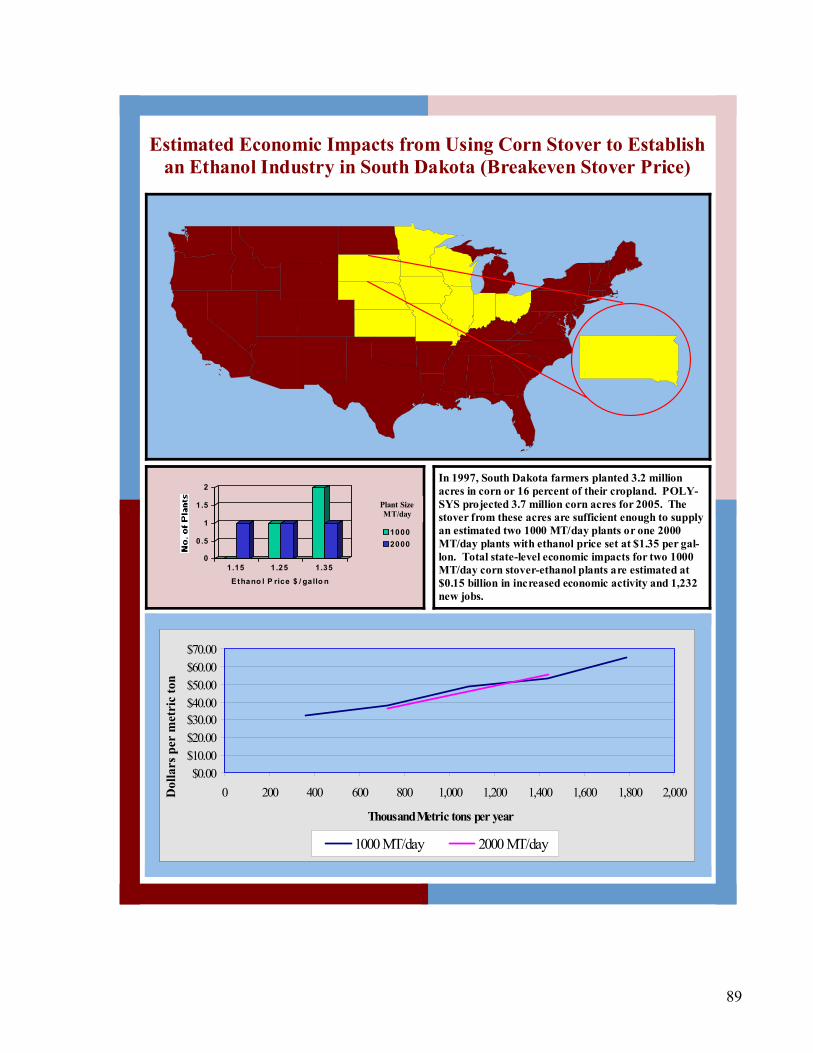
89
Estimated Economic Impacts from Using Corn Stover to Establish an Ethanol Industry in South Dakota (Breakeven Stover Price)
In 1997, South Dakota farmers planted 3.2 million acres in corn or 16 percent of their cropland. POLY-SYS projected 3.7 million corn acres for 2005. The stover from these acres are sufficient enough to supply an estimated two 1000 MT/day plants or one 2000 MT/day plants with ethanol price set at $1.35 per gal-lon. Total state-level economic impacts for two 1000 MT/day corn stover-ethanol plants are estimated at $0.15 billion in increased economic activity and 1,232 new jobs.
0
0.5
1
1.5
2
1.15 1.25 1.35
Ethano l P rice $ / gallo n
10002000
Plant Size MT/day
$0.00$10.00$20.00$30.00$40.00$50.00$60.00$70.00
0 200 400 600 800 1,000 1,200 1,400 1,600 1,800 2,000
Thousand Metric tons per year
Dol
lars
per
met
ric
ton
1000 MT/day 2000 MT/day

90
Total Annual Impacts (Operating + Agriculture + Transportation)
$1.15 Ethanol Price Assumption Direct Indirect Induced Total Year 2005; MT/day 1,000
TIO ($ millions) 0.00 0.00 0.00 0.00 Jobs (number) 0 0 0 0 TVA ($ millions) 0.00 0.00 0.00 0.00
Year 2005; MT/day 2,000
TIO ($ millions) 84.76 28.51 29.11 142.38 Jobs (number) 315 284 526 1,125 TVA ($ millions) 16.90 11.56 17.76 46.22 $1.25 Ethanol Price Assumption Direct Indirect Induced Total Year 2005; MT/day 1,000
TIO ($ millions) 44.91 15.45 15.24 75.60 Jobs (number) 179 153 276 608 TVA ($ millions) 8.56 6.38 9.29 24.23
Year 2005; MT/day 2,000
TIO ($ millions) 90.00 31.17 32.62 153.79 Jobs (number) 366 318 589 1,273 TVA ($ millions) 19.03 12.91 19.89 51.84 $1.35 Ethanol Price Assumption Direct Indirect Induced Total Year 2005; MT/day 1,000
TIO ($ millions) 90.38 31.18 30.86 152.42 Jobs (number) 364 310 558 1,232 TVA ($ millions) 17.35 12.90 18.81 49.06
Year 2005; MT/day 2,000
TIO ($ millions) 90.00 31.17 32.62 153.79 Jobs (number) 366 318 589 1,273 TVA ($ millions) 19.03 12.91 19.89 51.84

91
Estimated Economic Impacts from Using Corn Stover to Establish an Ethanol Industry in South Dakota (15% Increase in Stover Price)
With a 15% increase in the cost of stover, no 1000 or 2000 MT/day plants were economically feasible with an ethanol price of $1.15/gallon. Under a $1.35/gallon ethanol price, two 1000 MT/day or one 2000 MT/day plants are estimated to be economically feasible. The impacts for the state are very similar for both the 1000 or 2000 MT/day plants. Either plant would generate an estimated $0.15 billion in economic activity for the state of South Dakota. This increase in economic activity would create an estimated 1,300 jobs for the 2000 MT/day plant and an estimated 1,400 jobs for the 1,000 MT/day plant.
00.20.40.60.8
11.21.41.61.8
2
No.
of P
lant
s
1.15 1.25 1.35
Ethanol Price $/gallon
10002000
Plant Size

92
Total Annual Impacts (Operating + Agriculture + Transportation)
$1.15 Ethanol Price Assumption Direct Indirect Induced Total Year 2005; MT/day 1,000
TIO ($ millions) 0.00 0.00 0.00 0.00 Jobs (number) 0 0 0 0 TVA ($ millions) 0.00 0.00 0.00 0.00
Year 2005; MT/day 2,000
TIO ($ millions) 0.00 0.00 0.00 0.00 Jobs (number) 0 0 0 0 TVA ($ millions) 0.00 0.00 0.00 0.00 $1.25 Ethanol Price Assumption Direct Indirect Induced Total Year 2005; MT/day 1,000
TIO ($ millions) 45.16 15.33 15.15 75.64 Jobs (number) 258 152 274 684 TVA ($ millions) 8.68 6.33 9.24 24.25
Year 2005; MT/day 2,000
TIO ($ millions) 89.35 30.98 32.60 152.93 Jobs (number) 366 316 615 1,297 TVA ($ millions) 18.97 12.84 19.85 51.65 $1.35 Ethanol Price Assumption Direct Indirect Induced Total Year 2005; MT/day 1,000
TIO ($ millions) 90.88 30.94 30.69 152.50 Jobs (number) 521 308 555 1,384 TVA ($ millions) 17.59 12.81 18.70 49.10
Year 2005; MT/day 2,000
TIO ($ millions) 89.35 30.98 32.60 152.93 Jobs (number) 366 316 615 1,297 TVA ($ millions) 18.97 12.84 19.85 51.65

93
Estimated Economic Impacts from Using Corn Stover to Establish an Ethanol Industry in South Dakota (30% Increase in Stover Price)
With a 30% increase in the cost of stover, no 1000 or 2000 MT/day plants were economically feasible with an ethanol price of $1.15/gallon. Under a $1.35/gallon ethanol price, one 1000 MT/day or one 2000 MT/day plants are estimated to be economically feasible. The largest impacts in the state occur with the 2000 MT/day plant. If one plant was constructed, an increase of nearly $0.15 billion in economic activity is estimated for the state of South Dakota. This increase in economic activity would result in more than 1,300 jobs being created. Under the same pricing scenario, an estimated $0.07 billion in economic activity would be generated if one 1000 MT/day plants were constructed in the state.
0
0.2
0.4
0.6
0.8
1
No.
of P
lant
s
1.15 1.25 1.35
Ethanol Price $/gallon
10002000
Plant Size

94
Total Annual Impacts (Operating + Agriculture + Transportation)
$1.15 Ethanol Price Assumption Direct Indirect Induced Total Year 2005; MT/day 1,000
TIO ($ millions) 0.00 0.00 0.00 0.00 Jobs (number) 0 0 0 0 TVA ($ millions) 0.00 0.00 0.00 0.00
Year 2005; MT/day 2,000
TIO ($ millions) 0.00 0.00 0.00 0.00 Jobs (number) 0 0 0 0 TVA ($ millions) 0.00 0.00 0.00 0.00 $1.25 Ethanol Price Assumption Direct Indirect Induced Total Year 2005; MT/day 1,000
TIO ($ millions) 0.00 0.00 0.00 0.00 Jobs (number) 0 0 0 0 TVA ($ millions) 0.00 0.00 0.00 0.00
Year 2005; MT/day 2,000
TIO ($ millions) 88.71 30.79 32.58 152.08 Jobs (number) 365 314 641 1,321 TVA ($ millions) 18.90 12.77 19.80 51.47 $1.35 Ethanol Price Assumption Direct Indirect Induced Total Year 2005; MT/day 1,000
TIO ($ millions) 45.69 15.35 15.26 76.29 Jobs (number) 339 153 276 768 TVA ($ millions) 8.91 6.36 9.30 24.57
Year 2005; MT/day 2,000
TIO ($ millions) 88.71 30.79 32.58 152.08 Jobs (number) 365 314 641 1,321 TVA ($ millions) 18.90 12.77 19.80 51.47

95
Estimated Economic Impacts from Using Corn Stover to Establish an Ethanol Industry in Wisconsin (Breakeven Stover Price)
In 1997, Wisconsin farmers planted 2.9 million acres in corn or 28 percent of their cropland. POLYSYS pro-jected 4.2 million corn acres for 2005. The stover from these acres are sufficient enough to supply an estimated seven 1000 MT/day plants or four 2000 MT/day plants with ethanol price set at $1.35 per gallon. Total state-level economic impacts if seven 1000 MT/day corn stover-ethanol plants are constructed is estimated at $0.64 bil-lion in increased economic activity and 5,791 new jobs. Under the 2000 MT/day, an estimated $0.71 billion in economic activity is created.
01234567
1.15 1.25 1.35
Ethano l P rice $ / gallo n
10002000
Plant Size
$0.00$10.00$20.00$30.00$40.00$50.00$60.00
0 500 1,000 1,500 2,000 2,500 3,000 3,500
Thousand Metric tons per year
Dol
lars
per
met
ric
ton
1000 MT/day 2000 MT/day

96
Total Annual Impacts (Operating + Agriculture + Transportation)
$1.15 Ethanol Price Assumption Direct Indirect Induced Total Year 2005; MT/day 1,000
TIO ($ millions) 0.00 0.00 0.00 0.00 Jobs (number) 0 0 0 0 TVA ($ millions) 0.00 0.00 0.00 0.00
Year 2005; MT/day 2,000
TIO ($ millions) 85.14 39.29 46.39 170.83 Jobs (number) 482 384 722 1,588 TVA ($ millions) 21.92 19.72 28.34 69.98 $1.25 Ethanol Price Assumption Direct Indirect Induced Total Year 2005; MT/day 1,000
TIO ($ millions) 178.08 82.51 95.83 356.42 Jobs (number) 944 795 1,493 3,231 TVA ($ millions) 44.73 41.56 58.54 144.82
Year 2005; MT/day 2,000
TIO ($ millions) 260.23 120.44 143.17 523.83 Jobs (number) 1,490 1,181 2,228 4,899 TVA ($ millions) 67.84 60.49 87.47 215.81 $1.35 Ethanol Price Assumption Direct Indirect Induced Total Year 2005; MT/day 1,000
TIO ($ millions) 316.51 146.99 171.73 635.23 Jobs (number) 1,696 1,420 2,675 5,791 TVA ($ millions) 80.39 74.09 104.92 259.40
Year 2005; MT/day 2,000
TIO ($ millions) 352.62 163.59 195.57 711.78 Jobs (number) 2,040 1,609 3,044 6,692 TVA ($ millions) 92.90 82.24 119.50 294.65

97
Estimated Economic Impacts from Using Corn Stover to Establish an Ethanol Industry in Wisconsin (15% Increase in Stover Price)
With a 15% increase in the cost of stover, no 1000 MT/day plants were economically feasible with an ethanol price of $1.15/gallon. However, at that same ethanol price, one 2000 MT/day plant appears to be feasible. Under a $1.35/gallon ethanol price, five 1000 MT/day or four 2000 MT/day plants are estimated to be economically feasible. The largest impacts in the state occur with the 2000 MT/day plant. If four 2000 MT/day plants were constructed, an increase of $0.71 billion in economic activity is estimated for the state of Wisconsin. This increase in economic activity would result in close to 6,800 jobs being created. Under the same pricing scenario, nearly $0.46 billion in economic activity is estimated if five 1000 MT/day plants were constructed in the state.
0
1
2
3
4
5
No.
of P
lant
s
1.15 1.25 1.35
Ethanol Price $/gallon
10002000
Plant Size

98
Total Annual Impacts (Operating + Agriculture + Transportation)
$1.15 Ethanol Price Assumption
Direct Indirect Induced Total Year 2005; MT/day 1,000
TIO ($ millions) 0.00 0.00 0.00 0.00 Jobs (number) 0 0 0 0
TVA ($ millions) 0.00 0.00 0.00 0.00
Year 2005; MT/day 2,000
TIO ($ millions) 84.49 39.06 46.29 169.83
Jobs (number) 481 381 752 1,614 TVA ($ millions) 21.78 19.59 28.22 69.59 $1.25 Ethanol Price Assumption
Direct Indirect Induced Total Year 2005; MT/day 1,000
TIO ($ millions) 89.42 40.94 47.56 177.92 Jobs (number) 749 394 741 1,884
TVA ($ millions) 22.41 20.63 29.05 72.09
Year 2005; MT/day 2,000
TIO ($ millions) 258.29 119.72 142.85 520.86
Jobs (number) 1,488 1,173 2,317 4,978 TVA ($ millions) 67.44 60.10 87.10 214.64 $1.35 Ethanol Price Assumption
Direct Indirect Induced Total Year 2005; MT/day 1,000
TIO ($ millions) 227.03 104.21 121.77 453.01 Jobs (number) 1,903 1,007 1,897 4,807
TVA ($ millions) 57.54 52.54 74.40 184.48
Year 2005; MT/day 2,000
TIO ($ millions) 350.04 162.63 195.14 707.81
Jobs (number) 2,037 1,599 3,162 6,797 TVA ($ millions) 92.36 81.72 119.00 293.08

99
Estimated Economic Impacts from Using Corn Stover to Establish an Ethanol Industry in Wisconsin (30% Increase in Stover Price)
With a 30% increase in the cost of stover, no 1000 or 2000 MT/day plants were economically feasible with an ethanol price of $1.15/gallon. Under a $1.35/gallon ethanol price, four 1000 MT/day or four 2000 MT/day plants are estimated to be economically feasible. The largest impacts in the state occur with the 2000 MT/day plant. If four plants were constructed, an increase of $0.70 billion in economic activity is estimated for the state of Wisconsin. This increase in economic activity would result in 6,900 jobs being created. Under the same pricing scenario, an estimated $0.36 billion in economic activity would be generated if four 2000 MT/day plants were constructed in the state.
00.5
11.5
22.5
33.5
4
No.
of P
lant
s
1.15 1.25 1.35
Ethanol Price $/gallon
10002000
Plant Size
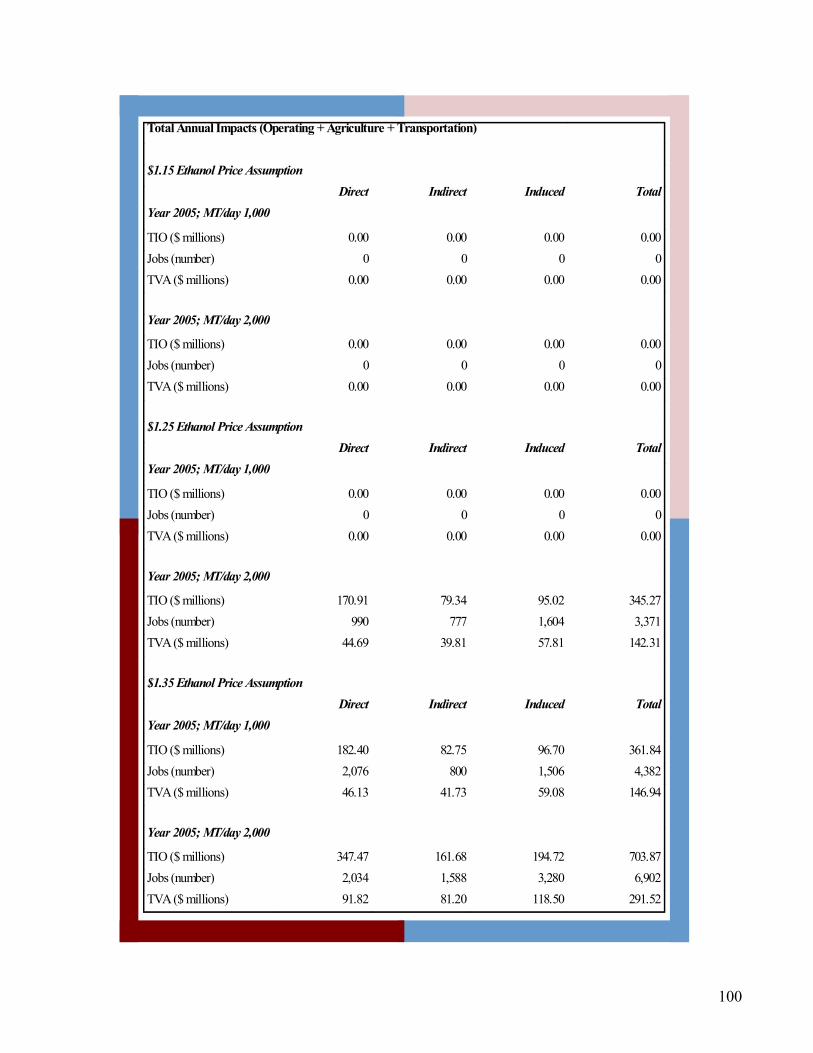
100
Total Annual Impacts (Operating + Agriculture + Transportation)
$1.15 Ethanol Price Assumption Direct Indirect Induced Total Year 2005; MT/day 1,000
TIO ($ millions) 0.00 0.00 0.00 0.00 Jobs (number) 0 0 0 0 TVA ($ millions) 0.00 0.00 0.00 0.00
Year 2005; MT/day 2,000
TIO ($ millions) 0.00 0.00 0.00 0.00 Jobs (number) 0 0 0 0 TVA ($ millions) 0.00 0.00 0.00 0.00 $1.25 Ethanol Price Assumption Direct Indirect Induced Total Year 2005; MT/day 1,000
TIO ($ millions) 0.00 0.00 0.00 0.00 Jobs (number) 0 0 0 0 TVA ($ millions) 0.00 0.00 0.00 0.00
Year 2005; MT/day 2,000
TIO ($ millions) 170.91 79.34 95.02 345.27 Jobs (number) 990 777 1,604 3,371 TVA ($ millions) 44.69 39.81 57.81 142.31 $1.35 Ethanol Price Assumption Direct Indirect Induced Total Year 2005; MT/day 1,000
TIO ($ millions) 182.40 82.75 96.70 361.84 Jobs (number) 2,076 800 1,506 4,382 TVA ($ millions) 46.13 41.73 59.08 146.94
Year 2005; MT/day 2,000
TIO ($ millions) 347.47 161.68 194.72 703.87 Jobs (number) 2,034 1,588 3,280 6,902 TVA ($ millions) 91.82 81.20 118.50 291.52

101
APPENDIX C: Top Ten Sectors Impacted Through Plant Investment, and Annual Operating, Agricultural, and
Transportation Expenditures, by State
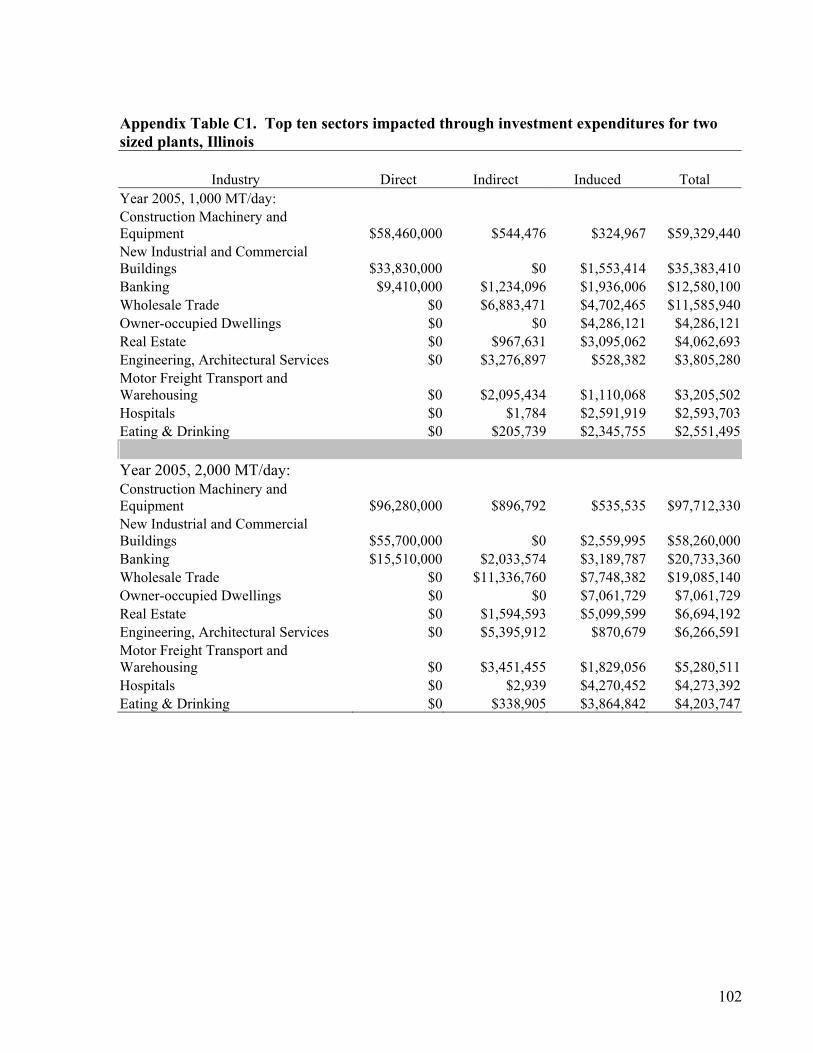
102
Appendix Table C1. Top ten sectors impacted through investment expenditures for two sized plants, Illinois
Industry Direct Indirect Induced Total
Year 2005, 1,000 MT/day: Construction Machinery and Equipment $58,460,000 $544,476 $324,967 $59,329,440New Industrial and Commercial Buildings $33,830,000 $0 $1,553,414 $35,383,410Banking $9,410,000 $1,234,096 $1,936,006 $12,580,100Wholesale Trade $0 $6,883,471 $4,702,465 $11,585,940Owner-occupied Dwellings $0 $0 $4,286,121 $4,286,121Real Estate $0 $967,631 $3,095,062 $4,062,693Engineering, Architectural Services $0 $3,276,897 $528,382 $3,805,280Motor Freight Transport and Warehousing $0 $2,095,434 $1,110,068 $3,205,502Hospitals $0 $1,784 $2,591,919 $2,593,703Eating & Drinking $0 $205,739 $2,345,755 $2,551,495 Year 2005, 2,000 MT/day: Construction Machinery and Equipment $96,280,000 $896,792 $535,535 $97,712,330New Industrial and Commercial Buildings $55,700,000 $0 $2,559,995 $58,260,000Banking $15,510,000 $2,033,574 $3,189,787 $20,733,360Wholesale Trade $0 $11,336,760 $7,748,382 $19,085,140Owner-occupied Dwellings $0 $0 $7,061,729 $7,061,729Real Estate $0 $1,594,593 $5,099,599 $6,694,192Engineering, Architectural Services $0 $5,395,912 $870,679 $6,266,591Motor Freight Transport and Warehousing $0 $3,451,455 $1,829,056 $5,280,511Hospitals $0 $2,939 $4,270,452 $4,273,392Eating & Drinking $0 $338,905 $3,864,842 $4,203,747

103
Appendix Table C2. Top ten sectors impacted through investment expenditures for two sized plants, Indiana
Industry Direct Indirect Induced Total Year 2005, 1,000 MT/day: Construction Machinery and Equipment $58,460,000 $141,648 $7,719 $58,609,370New Industrial and Commercial Buildings $33,830,000 $0 $1,346,053 $35,176,050Banking $9,410,000 $1,045,259 $1,299,065 $11,754,320Wholesale Trade $0 $5,383,278 $2,554,394 $7,937,671Real Estate $0 $917,624 $2,542,974 $3,460,598Motor Freight Transport and Warehousing $0 $2,399,082 $1,024,650 $3,423,732Owner-occupied Dwellings $0 $0 $3,387,481 $3,387,481Internal Combustion Engines, NEC $0 $2,339,599 $130,448 $2,470,047Doctors and Dentists $0 $0 $2,431,626 $2,431,626State and Local Electric Utilities $2,200,000 $37,105 $45,494 $2,282,600 Year 2005, 2,000 MT/day: Construction Machinery and Equipment $96,280,000 $233,304 $12,722 $96,526,020New Industrial and Commercial Buildings $55,700,000 $0 $2,218,639 $57,918,640Banking $15,510,000 $1,722,384 $2,140,515 $19,372,900Wholesale Trade $0 $8,865,962 $4,209,325 $13,075,290Real Estate $0 $1,512,222 $4,190,274 $5,702,496Motor Freight Transport and Warehousing $0 $3,951,551 $1,688,506 $5,640,057Owner-occupied Dwellings $0 $0 $5,581,523 $5,581,523Internal Combustion Engines, NEC $0 $3,853,186 $215,000 $4,068,186Doctors and Dentists $0 $0 $4,006,597 $4,006,597State and Local Electric Utilities $3,700,000 $61,118 $74,963 $3,836,081
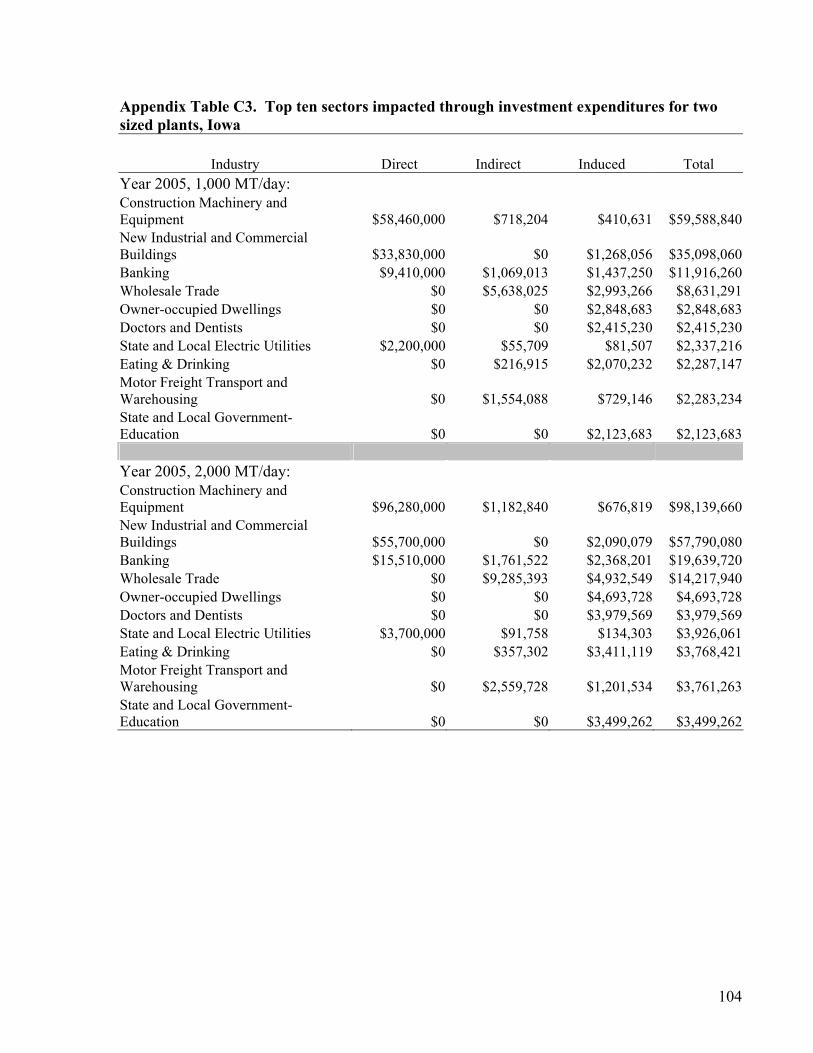
104
Appendix Table C3. Top ten sectors impacted through investment expenditures for two sized plants, Iowa
Industry Direct Indirect Induced Total Year 2005, 1,000 MT/day: Construction Machinery and Equipment $58,460,000 $718,204 $410,631 $59,588,840New Industrial and Commercial Buildings $33,830,000 $0 $1,268,056 $35,098,060Banking $9,410,000 $1,069,013 $1,437,250 $11,916,260Wholesale Trade $0 $5,638,025 $2,993,266 $8,631,291Owner-occupied Dwellings $0 $0 $2,848,683 $2,848,683Doctors and Dentists $0 $0 $2,415,230 $2,415,230State and Local Electric Utilities $2,200,000 $55,709 $81,507 $2,337,216Eating & Drinking $0 $216,915 $2,070,232 $2,287,147Motor Freight Transport and Warehousing $0 $1,554,088 $729,146 $2,283,234State and Local Government-Education $0 $0 $2,123,683 $2,123,683 Year 2005, 2,000 MT/day: Construction Machinery and Equipment $96,280,000 $1,182,840 $676,819 $98,139,660New Industrial and Commercial Buildings $55,700,000 $0 $2,090,079 $57,790,080Banking $15,510,000 $1,761,522 $2,368,201 $19,639,720Wholesale Trade $0 $9,285,393 $4,932,549 $14,217,940Owner-occupied Dwellings $0 $0 $4,693,728 $4,693,728Doctors and Dentists $0 $0 $3,979,569 $3,979,569State and Local Electric Utilities $3,700,000 $91,758 $134,303 $3,926,061Eating & Drinking $0 $357,302 $3,411,119 $3,768,421Motor Freight Transport and Warehousing $0 $2,559,728 $1,201,534 $3,761,263State and Local Government-Education $0 $0 $3,499,262 $3,499,262

105
Appendix Table C4. Top ten sectors impacted through investment expenditures for two sized plants, Kansas
Industry Direct Indirect Induced Total Year 2005, 1,000 MT/day: Construction Machinery and Equipment $58,460,000 $490,888 $84,103 $59,034,990New Industrial and Commercial Buildings $33,830,000 $0 $1,460,542 $35,290,540Banking $9,410,000 $1,222,238 $1,629,221 $12,261,460Wholesale Trade $0 $6,903,214 $3,664,098 $10,567,310Owner-occupied Dwellings $0 $0 $3,588,836 $3,588,836Motor Freight Transport and Warehousing $0 $2,028,650 $990,388 $3,019,039Real Estate $0 $779,031 $2,196,029 $2,975,059Engineering, Architectural Services $0 $2,472,286 $397,154 $2,869,441State and Local Government-Education $0 $0 $2,588,333 $2,588,333Doctors and Dentists $0 $0 $2,538,909 $2,538,909 Year 2005, 2,000 MT/day: Construction Machinery and Equipment $96,280,000 $808,472 $138,635 $97,227,100New Industrial and Commercial Buildings $55,700,000 $0 $2,407,587 $58,107,590Banking $15,510,000 $2,013,970 $2,684,699 $20,208,670Wholesale Trade $0 $11,369,140 $6,038,480 $17,407,620Owner-occupied Dwellings $0 $0 $5,913,645 $5,913,645Motor Freight Transport and Warehousing $0 $3,341,396 $1,632,149 $4,973,545Real Estate $0 $1,283,778 $3,618,822 $4,902,600Engineering, Architectural Services $0 $4,070,974 $654,582 $4,725,556State and Local Government-Education $0 $0 $4,265,000 $4,265,000State and Local Electric Utilities $3,700,000 $205,374 $290,720 $4,196,094

106
Appendix Table C5. Top ten sectors impacted through investment expenditures for two sized plants, Illinois
Industry Direct Indirect Induced Total
Year 2005, 1,000 MT/day Construction Machinery and Equipment $58,460,000 $367,208 $48,430 $58,875,640New Industrial and Commercial Buildings $33,830,000 $0 $1,452,827 $35,282,830Banking $9,410,000 $1,234,888 $1,693,153 $12,338,040Wholesale Trade $0 $7,454,707 $4,458,349 $11,913,060Real Estate $0 $1,017,716 $2,815,267 $3,832,983Owner-occupied Dwellings $0 $0 $3,736,867 $3,736,867Engineering, Architectural Services $0 $2,892,661 $459,251 $3,351,912Motor Freight Transport and Warehousing $0 $2,029,574 $938,322 $2,967,896Doctors and Dentists $0 $0 $2,612,516 $2,612,516Eating & Drinking $0 $236,524 $2,227,034 $2,463,559 Year 2005, 2,000 MT/day: Construction Machinery and Equipment $96,280,000 $604,776 $79,820 $96,964,590New Industrial and Commercial Buildings $55,700,000 $0 $2,394,517 $58,094,520Banking $15,510,000 $2,034,792 $2,789,795 $20,334,590Wholesale Trade $0 $12,277,400 $7,346,700 $19,624,100Real Estate $0 $1,677,013 $4,638,819 $6,315,832Owner-occupied Dwellings $0 $0 $6,157,030 $6,157,030Engineering, Architectural Services $0 $4,763,158 $756,827 $5,519,985Motor Freight Transport and Warehousing $0 $3,342,896 $1,546,165 $4,889,061Doctors and Dentists $0 $0 $4,304,526 $4,304,526Eating & Drinking $0 $389,602 $3,669,391 $4,058,993

107
Appendix Table C6. Top ten sectors impacted through investment expenditures for two sized plants, Missouri
Industry Direct Indirect Induced Total Year 2005, 1,000 MT/day: Construction Machinery and Equipment $58,460,000 $174,352 $9,289 $58,643,640New Industrial and Commercial Buildings $33,830,000 $0 $1,488,466 $35,318,470Banking $9,410,000 $1,342,267 $1,824,237 $12,576,500Wholesale Trade $0 $7,506,964 $4,133,487 $11,640,450Engineering, Architectural Services $0 $3,480,177 $552,881 $4,033,059Real Estate $0 $1,048,273 $2,873,226 $3,921,499Owner-occupied Dwellings $0 $0 $3,782,624 $3,782,624Motor Freight Transport and Warehousing $0 $2,466,657 $1,176,565 $3,643,222Doctors and Dentists $0 $0 $2,597,936 $2,597,936Hospitals $0 $2,812 $2,545,170 $2,547,982 Year 2005, 2,000 MT/day: Construction Machinery and Equipment $96,280,000 $287,152 $15,309 $96,582,460New Industrial and Commercial Buildings $55,700,000 $0 $2,453,406 $58,153,400Banking $15,510,000 $2,211,716 $3,005,875 $20,727,590Wholesale Trade $0 $12,363,500 $6,811,483 $19,174,980Engineering, Architectural Services $0 $5,730,607 $911,161 $6,641,768Real Estate $0 $1,727,357 $4,734,471 $6,461,827Owner-occupied Dwellings $0 $0 $6,232,627 $6,232,627Motor Freight Transport and Warehousing $0 $4,062,816 $1,938,827 $6,001,643Doctors and Dentists $0 $0 $4,280,649 $4,280,649Hospitals $0 $4,632 $4,193,772 $4,198,405

108
Appendix Table C7. Top ten sectors impacted through investment expenditures for two sized plants, Nebraska
Industry Direct Indirect Induced Total Year 2005, 1,000 MT/day: Construction Machinery and Equipment $58,460,000 $324,660 $27,050 $58,811,710New Industrial and Commercial Buildings $33,830,000 $0 $1,061,824 $34,891,820Banking $9,410,000 $1,258,425 $1,553,529 $12,221,950Wholesale Trade $0 $6,707,069 $3,270,778 $9,977,847State and Local Electric Utilities $2,200,000 $650,159 $850,294 $3,700,453Engineering, Architectural Services $0 $2,938,699 $391,967 $3,330,666Motor Freight Transport and Warehousing $0 $2,155,011 $971,001 $3,126,011Owner-occupied Dwellings $0 $0 $2,834,614 $2,834,614Eating & Drinking $0 $236,830 $1,994,987 $2,231,816Doctors and Dentists $0 $0 $2,212,650 $2,212,650 Year 2005, 2,000 MT/day: Construction Machinery and Equipment $96,280,000 $534,696 $44,588 $96,859,280New Industrial and Commercial Buildings $55,700,000 $0 $1,750,294 $57,450,290Banking $15,510,000 $2,073,576 $2,559,943 $20,143,520Wholesale Trade $0 $11,046,050 $5,390,209 $16,436,250State and Local Electric Utilities $3,700,000 $1,070,868 $1,401,144 $6,172,013Engineering, Architectural Services $0 $4,838,947 $646,028 $5,484,976Motor Freight Transport and Warehousing $0 $3,549,483 $1,600,203 $5,149,686Owner-occupied Dwellings $0 $0 $4,670,792 $4,670,792Eating & Drinking $0 $390,103 $3,287,313 $3,677,416Doctors and Dentists $0 $0 $3,645,975 $3,645,975

109
Appendix Table C8. Top ten sectors impacted through investment expenditures for two sized plants, Ohio
Industry Direct Indirect Induced Total Year 2005, 1,000 MT/day: Construction Machinery and Equipment $58,460,000 $176,824 $12,954 $58,649,780New Industrial and Commercial Buildings $33,830,000 $0 $1,230,751 $35,060,750Banking $9,410,000 $1,044,502 $1,249,216 $11,703,720Engineering, Architectural Services $0 $2,879,674 $369,076 $3,248,750Owner-occupied Dwellings $0 $0 $3,159,638 $3,159,638Real Estate $0 $844,678 $2,298,554 $3,143,232Motor Freight Transport and Warehousing $0 $2,178,717 $852,507 $3,031,224State and Local Electric Utilities $2,200,000 $27,302 $34,092 $2,261,394Doctors and Dentists $0 $0 $2,232,972 $2,232,972Eating & Drinking $0 $211,067 $1,811,353 $2,022,420 Year 2005, 2,000 MT/day: Construction Machinery and Equipment $96,280,000 $291,232 $21,352 $96,592,580New Industrial and Commercial Buildings $55,700,000 $0 $2,028,725 $57,728,720Banking $15,510,000 $1,721,160 $2,058,418 $19,289,580Engineering, Architectural Services $0 $4,741,810 $608,276 $5,350,086Owner-occupied Dwellings $0 $0 $5,206,196 $5,206,196Real Estate $0 $1,392,073 $3,787,618 $5,179,691Motor Freight Transport and Warehousing $0 $3,588,588 $1,404,869 $4,993,457State and Local Electric Utilities $3,700,000 $44,971 $56,177 $3,801,148Doctors and Dentists $0 $0 $3,679,336 $3,679,336Eating & Drinking $0 $347,677 $2,984,628 $3,332,305

110
Appendix Table C9. Top ten sectors impacted through investment expenditures for two sized plants, South Dakota
Industry Direct Indirect Induced Total Year 2005, 1,000 MT/day: Construction Machinery and Equipment $58,460,000 $812,648 $180,520 $59,453,170New Industrial and Commercial Buildings $33,830,000 $0 $850,661 $34,680,660Banking $9,410,000 $1,144,372 $1,283,605 $11,837,980Wholesale Trade $0 $5,842,886 $2,395,923 $8,238,809Motor Freight Transport and Warehousing $0 $2,515,886 $919,161 $3,435,047Engineering, Architectural Services $0 $2,282,247 $259,914 $2,542,161State and Local Electric Utilities $2,200,000 $52,526 $63,028 $2,315,554Hospitals $0 $4,115 $2,240,453 $2,244,568Doctors and Dentists $0 $0 $2,207,138 $2,207,138Eating & Drinking $0 $243,379 $1,874,412 $2,117,791 Year 2005, 2,000 MT/day: Construction Machinery and Equipment $96,280,000 $1,338,392 $297,574 $97,915,970New Industrial and Commercial Buildings $55,700,000 $0 $1,402,281 $57,102,280Banking $15,510,000 $1,885,680 $2,115,193 $19,510,870Wholesale Trade $0 $9,622,850 $3,948,509 $13,571,360Motor Freight Transport and Warehousing $0 $4,143,895 $1,514,786 $5,658,681Engineering, Architectural Services $0 $3,758,048 $428,381 $4,186,429State and Local Electric Utilities $3,700,000 $86,516 $103,863 $3,890,379Hospitals $0 $6,779 $3,691,925 $3,698,704Doctors and Dentists $0 $0 $3,636,961 $3,636,961Eating & Drinking $0 $400,893 $3,088,690 $3,489,583

111
Appendix Table C10. Top ten sectors impacted through investment expenditures for two sized plants, Wisconsin
Industry Direct Indirect Induced Total Year 2005, 1,000 MT/day: Construction Machinery and Equipment $58,460,000 $399,720 $83,473 $58,943,190New Industrial and Commercial Buildings $33,830,000 $0 $1,197,722 $35,027,720Banking $9,410,000 $1,046,122 $1,517,289 $11,973,410Wholesale Trade $0 $5,717,144 $3,228,490 $8,945,634Owner-occupied Dwellings $0 $0 $3,849,207 $3,849,207Motor Freight Transport and Warehousing $0 $2,355,788 $1,180,347 $3,536,136State and Local Government-Education $0 $0 $3,139,814 $3,139,814Real Estate $0 $777,746 $2,345,815 $3,123,561Engineering, Architectural Services $0 $2,458,192 $377,655 $2,835,847State and Local Government-Non-Education $0 $0 $2,763,353 $2,763,353 Year 2005, 2,000 MT/day: Construction Machinery and Equipment $96,280,000 $658,320 $137,573 $97,075,900New Industrial and Commercial Buildings $55,700,000 $0 $1,974,042 $57,674,040Banking $15,510,000 $1,723,784 $2,499,946 $19,733,730Wholesale Trade $0 $9,415,731 $5,319,785 $14,735,520Owner-occupied Dwellings $0 $0 $6,341,961 $6,341,961Motor Freight Transport and Warehousing $0 $3,880,198 $1,944,927 $5,825,125State and Local Government-Education $0 $0 $5,173,238 $5,173,238Real Estate $0 $1,281,643 $3,865,137 $5,146,779Engineering, Architectural Services $0 $4,047,753 $622,328 $4,670,080State and Local Government-Non-Education $0 $0 $4,552,970 $4,552,970

112
Appendix Table C11. IMPLAN aggregated sectors for estimating operating cost impacts Code Description Aggregation Title
477 Automobile Rental and Leasing Agg Automotive Services 479 Automobile Repair and Services “
469 Advertising Agg Business Services 470 Other Business Services “ 472 Services To Buildings “ 473 Equipment Rental and Leasing “ 474 Personnel Supply Services “ 475 Computer and Data Processing Services “ 476 Detective and Protective Services “
186 Alkalies & Chlorine Agg Chemical and Allied 187 Industrial Gases “ 188 Inorganic Pigments “ 190 Cyclic Crudes, Interm. & Indus. Organic Chem. “ 191 Plastics Materials and Resins “ 196 Soap and Other Detergents “ 197 Polishes and Sanitation Goods “ 200 Paints and Allied Products “ 209 Chemical Preparations, N.E.C “
273 Metal Cans Agg Fabricated Metal 274 Metal Barrels, Drums and Pails “ 276 Hand and Edge Tools, N.E.C. “ 301 Industrial and Fluid Valves “ 303 Pipe, Valves, and Pipe Fittings “ 304 Miscellaneous Fabricated Wire Products “ 306 Fabricated Metal Products, N.E.C. “
321 Special Dies and Tools and Accessories Agg Industrial Machinery 331 Special Industry Machinery N.E.C. “ 332 Pumps and Compressors “ 347 Refrigeration and Heating Equipment “ 350 Carburetors, Pistons, Rings, Valves “ 354 Industrial Machines N.E.C. “ 355 Transformers “ 358 Carbon and Graphite Products “ 367 Electric Lamps “ 381 Engine Electrical Equipment “
28 Iron Ores Agg Metal Mining 29 Copper Ores “ 30 Lead and Zinc Ores “
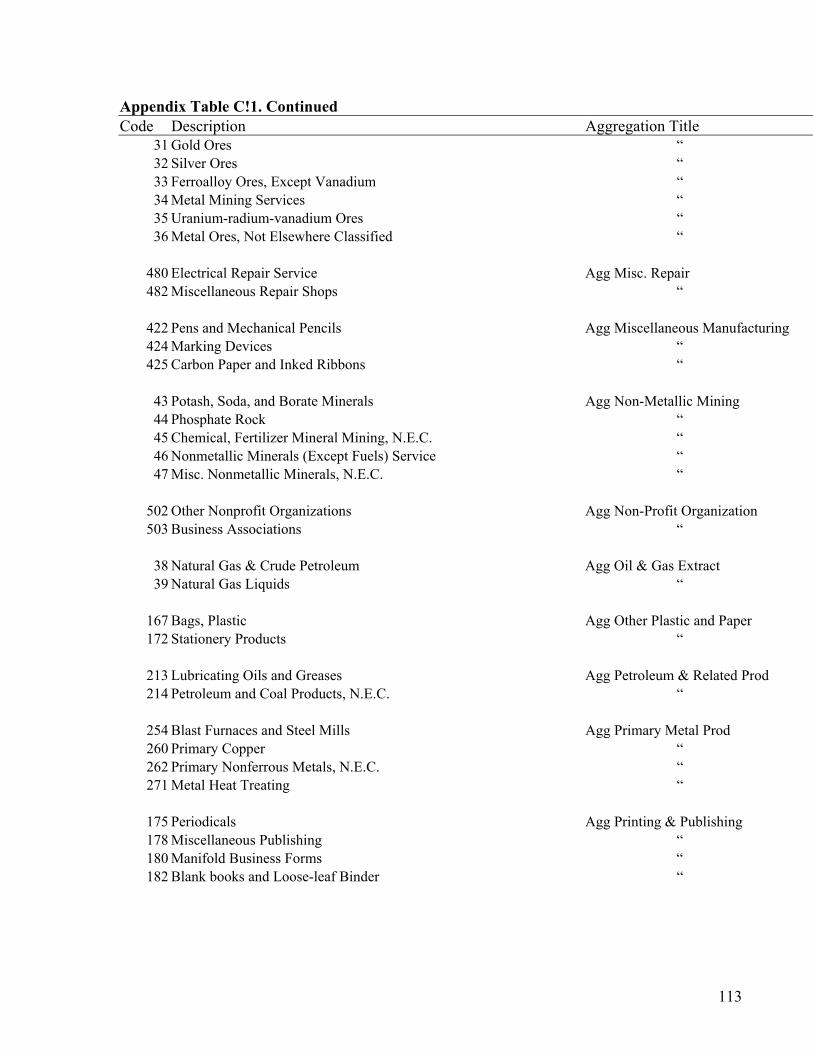
113
Appendix Table C!1. Continued Code Description Aggregation Title
31 Gold Ores “ 32 Silver Ores “ 33 Ferroalloy Ores, Except Vanadium “ 34 Metal Mining Services “ 35 Uranium-radium-vanadium Ores “ 36 Metal Ores, Not Elsewhere Classified “
480 Electrical Repair Service Agg Misc. Repair 482 Miscellaneous Repair Shops “
422 Pens and Mechanical Pencils Agg Miscellaneous Manufacturing 424 Marking Devices “ 425 Carbon Paper and Inked Ribbons “
43 Potash, Soda, and Borate Minerals Agg Non-Metallic Mining 44 Phosphate Rock “ 45 Chemical, Fertilizer Mineral Mining, N.E.C. “ 46 Nonmetallic Minerals (Except Fuels) Service “ 47 Misc. Nonmetallic Minerals, N.E.C. “
502 Other Nonprofit Organizations Agg Non-Profit Organization 503 Business Associations “
38 Natural Gas & Crude Petroleum Agg Oil & Gas Extract 39 Natural Gas Liquids “
167 Bags, Plastic Agg Other Plastic and Paper 172 Stationery Products “
213 Lubricating Oils and Greases Agg Petroleum & Related Prod 214 Petroleum and Coal Products, N.E.C. “
254 Blast Furnaces and Steel Mills Agg Primary Metal Prod 260 Primary Copper “ 262 Primary Nonferrous Metals, N.E.C. “ 271 Metal Heat Treating “
175 Periodicals Agg Printing & Publishing 178 Miscellaneous Publishing “ 180 Manifold Business Forms “ 182 Blank books and Loose-leaf Binder “

114
Appendix Table C!1. Continued Code Description Aggregation Title
506 Engineering, Architectural Services Agg Professional Services 508 Management and Consulting Services “ 509 Research, Development & Testing Services “
483 Motion Pictures Agg Recreation & Amusement 484 Theatrical Producers, Bands Etc. “ 486 Commercial Sports Except Racing “ 489 Membership Sports and Recreation Clubs “
448 Building Materials & Gardening Agg Retail Trade 449 General Merchandise Stores “ 450 Food Stores “ 451 Automotive Dealers & Service Stations “ 452 Apparel & Accessory Stores “ 453 Furniture & Home Furnishings Stores “ 454 Eating & Drinking “ 455 Miscellaneous Retail “
215 Tires and Inner Tubes Agg Rubber & Misc. Prod 218 Gaskets, Packing and Sealing Devices “ 220 Miscellaneous Plastics Products “
403 Mechanical Measuring Devices Agg Scientific Equipment 413 Photographic Equipment and Supplies “
230 Glass and Glass Products, Except Containers Agg Stone, Clay & Glass Prod 248 Abrasive Products “ 250 Minerals, Ground Or Treated “ 253 Nonmetallic Mineral Products, N.E.C. “
439 Arrangement Of Passenger Transportation Agg Transportation Services 441 Communications, Except Radio and TV “
11 Food Grains Agricultural Sectors 20 Miscellaneous Crops “ 23 Greenhouse and Nursery Products “ 27 Landscape and Horticultural Services “

115
Appendix Table C11. Continued Code Description Aggregation Title
37 Coal Mining Others Unaggregated Sectors 433 Railroads and Related Services “ 434 Local, Interurban Passenger Transit “ 435 Motor Freight Transport and Warehousing “ 436 Water Transportation “ 437 Air Transportation “ 438 Pipe Lines, Except Natural Gas “
24 Forestry Products Primary Forest Products
161 Pulp Mills “ 162 Paper Mills, Except Building Paper “ 163 Paperboard Mills “
147 Wood Products, N.E.C Secondary Forest Products 164 Paperboard Containers and Boxes “ 165 Paper Coated & Laminated Packaging “ 166 Paper Coated & Laminated N.E.C. “ 168 Bags, Paper “ 169 Die-cut Paper and Board “ 170 Sanitary Paper Products “ 171 Envelopes “

116
Appendix Table C12. Top ten sectors impacted through operating cost expenditures for two sized plants, Illinois
Industry Direct Indirect Induced Total
Year 2005, 1,000 MT/day: Cyclic Crudes, Interm. & Indus. Organic Chem. $32,200,000 $1,974,408 $29,902 $34,204,310Wholesale Trade $0 $2,220,212 $1,334,914 $3,555,126Retail Trade* $0 $144,008 $2,306,370 $2,450,378Other Unaggregated Sectors* $0 $1,458,907 $496,177 $1,955,084Chemical & Allied* $0 $1,653,017 $104,921 $1,757,938Professional Services* $0 $1,063,939 $365,177 $1,429,115Business Services* $0 $828,416 $582,249 $1,410,664Real Estate $0 $355,330 $844,328 $1,199,658Petroleum Refining $0 $907,752 $284,966 $1,192,718Owner-occupied Dwellings $0 $0 $1,121,753 $1,121,753 Year 2005, 2,000 MT/day: Cyclic Crudes, Interm. & Indus. Organic Chem. $57,800,000 $3,562,912 $53,675 $61,416,590Wholesale Trade $0 $3,962,345 $2,384,418 $6,346,764Retail Trade* $0 $257,764 $4,121,960 $4,379,724Other Unaggregated Sectors* $0 $2,613,232 $886,569 $3,499,800Chemical & Allied* $0 $2,955,776 $187,350 $3,143,126Professional Services* $0 $1,899,118 $652,344 $2,551,462Business Services* $0 $1,478,752 $1,040,396 $2,519,148Real Estate $0 $634,366 $1,508,661 $2,143,027Petroleum Refining $0 $1,629,528 $509,238 $2,138,767Owner-occupied Dwellings $0 $0 $2,005,044 $2,005,044* Aggregated Sectors

117
* Aggregated Sectors
Appendix Table C13. Top ten sectors impacted through operating cost expenditures for two sized plants, Indiana
Industry Direct Indirect Induced Total Year 2005, 1,000 MT/day: Cyclic Crudes, Interm. & Indus. Organic Chem. $32,200,000 $1,156,852 $14,556 $33,371,410Retail Trade $0 $140,303 $2,158,794 $2,299,097Wholesale Trade* $0 $1,474,176 $799,894 $2,274,071Other Unaggregated Sectors* $0 $1,502,835 $496,311 $1,999,146Chemical & Allied* $0 $1,579,910 $93,901 $1,673,811Real Estate $0 $311,882 $762,067 $1,073,949Owner-occupied Dwellings $0 $0 $970,639 $970,639Maintenance and Repair Other Facilities $0 $582,012 $314,193 $896,205Petroleum Refining $0 $667,919 $215,398 $883,317Electric Services $0 $583,625 $281,225 $864,850 Year 2005, 2,000 MT/day: Cyclic Crudes, Interm. & Indus. Organic Chem. $57,800,000 $2,133,544 $26,183 $59,959,730Retail Trade $0 $248,533 $3,792,902 $4,041,435Wholesale Trade* $0 $2,580,566 $1,401,708 $3,982,274Other Unaggregated Sectors* $0 $2,666,109 $870,701 $3,536,810Chemical & Allied* $0 $2,801,639 $164,584 $2,966,223Real Estate $0 $546,299 $1,337,749 $1,884,048Owner-occupied Dwellings $0 $0 $1,706,783 $1,706,783Maintenance and Repair Other Facilities $0 $1,090,541 $551,203 $1,641,744Petroleum Refining $0 $1,200,578 $378,347 $1,578,925Industrial Machinery* $0 $1,078,290 $379,499 $1,457,789

118
Appendix Table C14. Top ten sectors impacted through operating cost expenditures for two sized plants, Iowa
Industry Direct Indirect Induced Total Year 2005, 1,000 MT/day: Cyclic Crudes, Interm. & Indus. Organic Chem. $32,200,000 $725,610 $4,683 $32,930,290Wholesale Trade $0 $1,575,426 $714,804 $2,290,229Wet Corn Milling $0 $2,136,808 $14,672 $2,151,480Retail Trade* $0 $141,611 $1,664,250 $1,805,861Other Unaggregated Sectors* $0 $1,367,613 $327,802 $1,695,415Chemical & Allied* $0 $1,126,755 $43,572 $1,170,326Maintenance and Repair Other Facilities $0 $837,157 $230,730 $1,067,887Business Services* $0 $465,434 $265,412 $730,847State & Local Government-Education $0 $0 $627,319 $627,319Owner-occupied Dwellings $0 $0 $620,727 $620,727 Year 2005, 2,000 MT/day: Cyclic Crudes, Interm. & Indus. Organic Chem. $57,800,000 $1,516,112 $9,288 $59,325,400Wet Corn Milling $0 $3,862,977 $24,635 $3,887,612Wholesale Trade $0 $2,496,396 $1,209,037 $3,705,433Retail Trade* $0 $239,682 $2,835,585 $3,075,268Other Unaggregated Sectors* $0 $2,385,493 $557,342 $2,942,835Maintenance and Repair Other Facilities $0 $1,686,590 $394,542 $2,081,131Chemical & Allied* $0 $1,917,196 $73,940 $1,991,136Business Services* $0 $744,697 $451,966 $1,196,663State & Local Government-Education $0 $0 $1,097,095 $1,097,095State & Local Government-Non-Education $0 $0 $1,060,013 $1,060,013* Aggregated Sectors
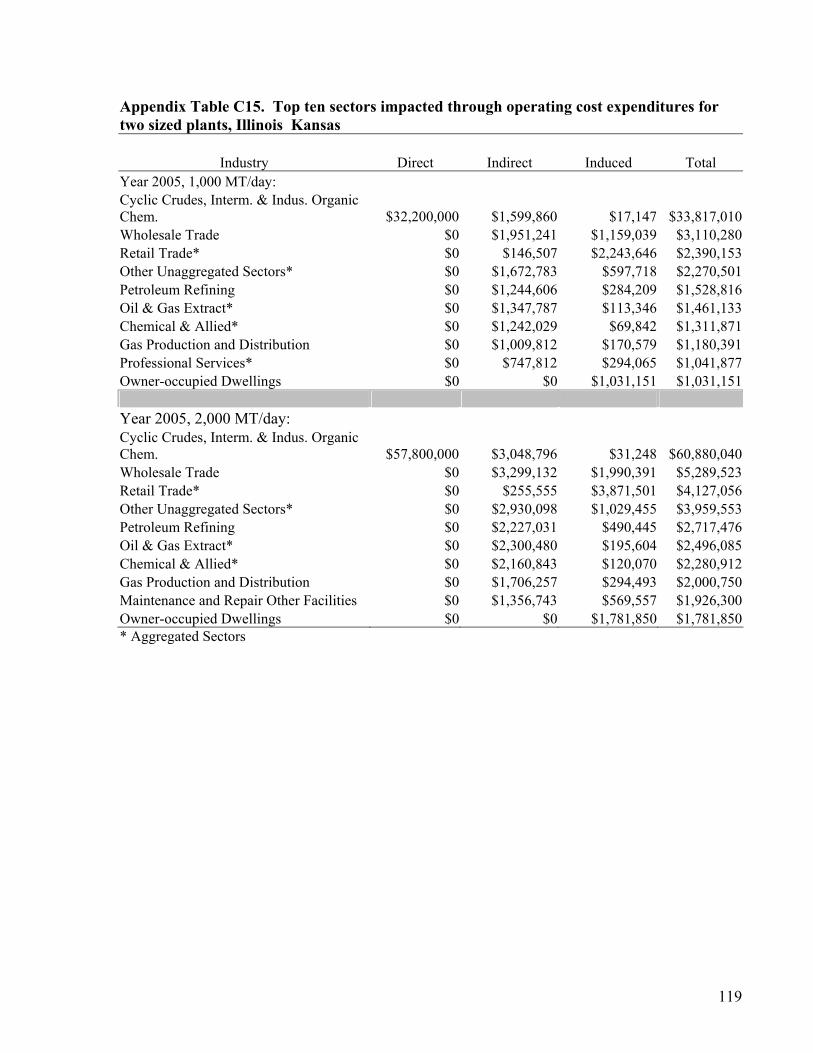
119
Appendix Table C15. Top ten sectors impacted through operating cost expenditures for two sized plants, Illinois Kansas
Industry Direct Indirect Induced Total
Year 2005, 1,000 MT/day: Cyclic Crudes, Interm. & Indus. Organic Chem. $32,200,000 $1,599,860 $17,147 $33,817,010Wholesale Trade $0 $1,951,241 $1,159,039 $3,110,280Retail Trade* $0 $146,507 $2,243,646 $2,390,153Other Unaggregated Sectors* $0 $1,672,783 $597,718 $2,270,501Petroleum Refining $0 $1,244,606 $284,209 $1,528,816Oil & Gas Extract* $0 $1,347,787 $113,346 $1,461,133Chemical & Allied* $0 $1,242,029 $69,842 $1,311,871Gas Production and Distribution $0 $1,009,812 $170,579 $1,180,391Professional Services* $0 $747,812 $294,065 $1,041,877Owner-occupied Dwellings $0 $0 $1,031,151 $1,031,151 Year 2005, 2,000 MT/day: Cyclic Crudes, Interm. & Indus. Organic Chem. $57,800,000 $3,048,796 $31,248 $60,880,040Wholesale Trade $0 $3,299,132 $1,990,391 $5,289,523Retail Trade* $0 $255,555 $3,871,501 $4,127,056Other Unaggregated Sectors* $0 $2,930,098 $1,029,455 $3,959,553Petroleum Refining $0 $2,227,031 $490,445 $2,717,476Oil & Gas Extract* $0 $2,300,480 $195,604 $2,496,085Chemical & Allied* $0 $2,160,843 $120,070 $2,280,912Gas Production and Distribution $0 $1,706,257 $294,493 $2,000,750Maintenance and Repair Other Facilities $0 $1,356,743 $569,557 $1,926,300Owner-occupied Dwellings $0 $0 $1,781,850 $1,781,850* Aggregated Sectors
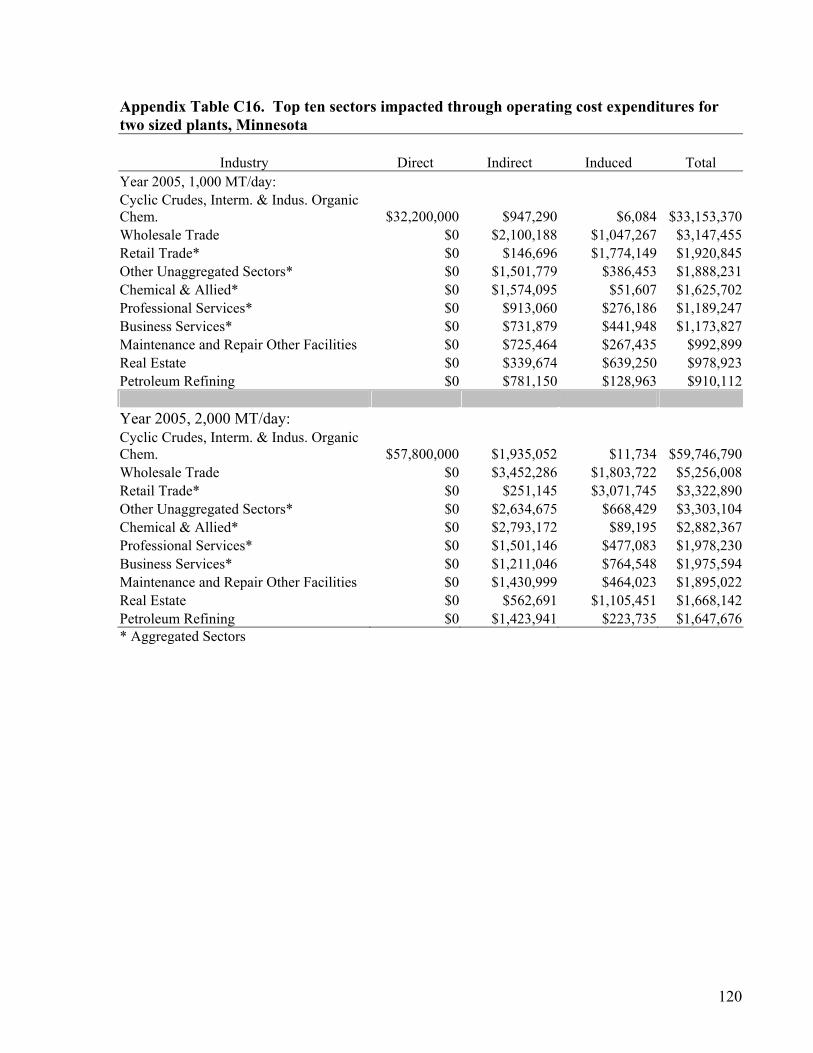
120
Appendix Table C16. Top ten sectors impacted through operating cost expenditures for two sized plants, Minnesota
Industry Direct Indirect Induced Total
Year 2005, 1,000 MT/day: Cyclic Crudes, Interm. & Indus. Organic Chem. $32,200,000 $947,290 $6,084 $33,153,370Wholesale Trade $0 $2,100,188 $1,047,267 $3,147,455Retail Trade* $0 $146,696 $1,774,149 $1,920,845Other Unaggregated Sectors* $0 $1,501,779 $386,453 $1,888,231Chemical & Allied* $0 $1,574,095 $51,607 $1,625,702Professional Services* $0 $913,060 $276,186 $1,189,247Business Services* $0 $731,879 $441,948 $1,173,827Maintenance and Repair Other Facilities $0 $725,464 $267,435 $992,899Real Estate $0 $339,674 $639,250 $978,923Petroleum Refining $0 $781,150 $128,963 $910,112 Year 2005, 2,000 MT/day: Cyclic Crudes, Interm. & Indus. Organic Chem. $57,800,000 $1,935,052 $11,734 $59,746,790Wholesale Trade $0 $3,452,286 $1,803,722 $5,256,008Retail Trade* $0 $251,145 $3,071,745 $3,322,890Other Unaggregated Sectors* $0 $2,634,675 $668,429 $3,303,104Chemical & Allied* $0 $2,793,172 $89,195 $2,882,367Professional Services* $0 $1,501,146 $477,083 $1,978,230Business Services* $0 $1,211,046 $764,548 $1,975,594Maintenance and Repair Other Facilities $0 $1,430,999 $464,023 $1,895,022Real Estate $0 $562,691 $1,105,451 $1,668,142Petroleum Refining $0 $1,423,941 $223,735 $1,647,676* Aggregated Sectors

121
Appendix Table C17. Top ten sectors impacted through operating cost expenditures for two sized plants, Missouri
Industry Direct Indirect Induced Total
Year 2005, 1,000 MT/day Cyclic Crudes, Interm. & Indus. Organic Chem. $32,200,000 $3,787,672 $117,747 $36,105,420Wholesale Trade $0 $1,945,924 $1,552,288 $3,498,212Retail Trade* $0 $136,598 $2,843,830 $2,980,428Other Unaggregated Sectors* $0 $1,543,621 $761,390 $2,305,012Business Services* $0 $704,284 $713,562 $1,417,846Real Estate $0 $322,663 $1,026,502 $1,349,165Owner-occupied Dwellings $0 $0 $1,289,620 $1,289,620Professional Services* $0 $724,243 $413,789 $1,138,032Electric Services $0 $692,640 $372,835 $1,065,475Industrial Machinery* $0 $769,286 $250,545 $1,019,831 Year 2005, 2,000 MT/day: Cyclic Crudes, Interm. & Indus. Organic Chem. $57,800,000 $6,797,252 $210,988 $64,808,240Wholesale Trade $0 $3,480,907 $2,777,009 $6,257,916Retail Trade* $0 $244,801 $5,089,070 $5,333,870Other Unaggregated Sectors* $0 $2,766,317 $1,362,186 $4,128,503Business Services* $0 $1,259,946 $1,276,760 $2,536,705Real Estate $0 $577,252 $1,836,752 $2,414,004Owner-occupied Dwellings $0 $0 $2,307,987 $2,307,987Professional Services* $0 $1,295,889 $740,240 $2,036,130Electric Services $0 $1,190,331 $667,009 $1,857,339Industrial Machinery* $0 $1,375,907 $448,016 $1,823,923* Aggregated Sectors
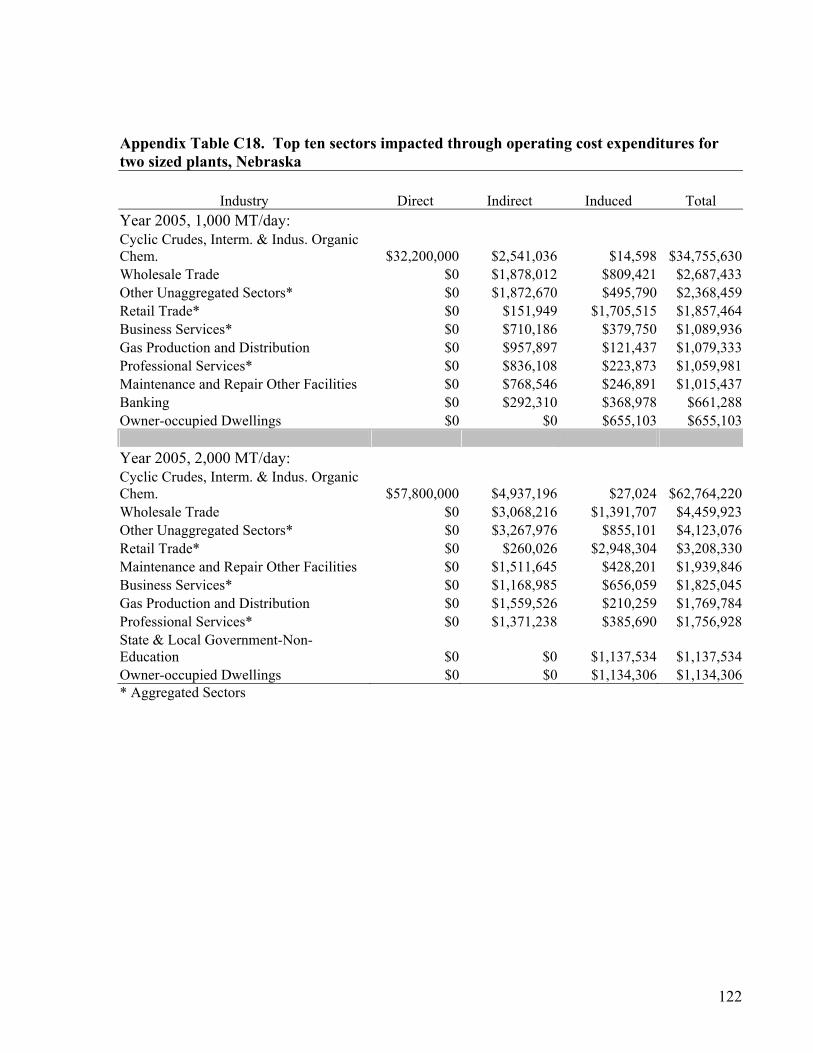
122
Appendix Table C18. Top ten sectors impacted through operating cost expenditures for two sized plants, Nebraska
Industry Direct Indirect Induced Total Year 2005, 1,000 MT/day: Cyclic Crudes, Interm. & Indus. Organic Chem. $32,200,000 $2,541,036 $14,598 $34,755,630Wholesale Trade $0 $1,878,012 $809,421 $2,687,433Other Unaggregated Sectors* $0 $1,872,670 $495,790 $2,368,459Retail Trade* $0 $151,949 $1,705,515 $1,857,464Business Services* $0 $710,186 $379,750 $1,089,936Gas Production and Distribution $0 $957,897 $121,437 $1,079,333Professional Services* $0 $836,108 $223,873 $1,059,981Maintenance and Repair Other Facilities $0 $768,546 $246,891 $1,015,437Banking $0 $292,310 $368,978 $661,288Owner-occupied Dwellings $0 $0 $655,103 $655,103 Year 2005, 2,000 MT/day: Cyclic Crudes, Interm. & Indus. Organic Chem. $57,800,000 $4,937,196 $27,024 $62,764,220Wholesale Trade $0 $3,068,216 $1,391,707 $4,459,923Other Unaggregated Sectors* $0 $3,267,976 $855,101 $4,123,076Retail Trade* $0 $260,026 $2,948,304 $3,208,330Maintenance and Repair Other Facilities $0 $1,511,645 $428,201 $1,939,846Business Services* $0 $1,168,985 $656,059 $1,825,045Gas Production and Distribution $0 $1,559,526 $210,259 $1,769,784Professional Services* $0 $1,371,238 $385,690 $1,756,928State & Local Government-Non-Education $0 $0 $1,137,534 $1,137,534Owner-occupied Dwellings $0 $0 $1,134,306 $1,134,306* Aggregated Sectors

123
Appendix Table C19. Top ten sectors impacted through operating cost expenditures for two sized plants, Ohio
Industry Direct Indirect Induced Total
Year 2005, 1,000 MT/day: Cyclic Crudes, Interm. & Indus. Organic Chem. $32,200,000 $2,283,376 $32,017 $34,515,390Chemical & Allied* $0 $2,178,940 $113,547 $2,292,487Retail Trade* $0 $144,946 $1,904,504 $2,049,450Other Unaggregated Sectors* $0 $1,552,833 $415,659 $1,968,492Professional Services* $0 $929,722 $262,720 $1,192,442Real Estate $0 $333,573 $670,113 $1,003,685Business Services* $0 $625,035 $351,172 $976,207Inorganic Chemical, NEC $0 $959,458 $13,452 $972,910Maintenance and Repair Other Facilities $0 $577,051 $298,775 $875,826Owner-occupied Dwellings $0 $0 $875,027 $875,027 Year 2005, 2,000 MT/day: Cyclic Crudes, Interm. & Indus. Organic Chem. $57,800,000 $4,117,416 $57,479 $61,974,900Chemical & Allied* $0 $3,902,555 $203,038 $4,105,593Retail Trade* $0 $259,633 $3,408,009 $3,667,642Other Unaggregated Sectors* $0 $2,780,367 $743,634 $3,524,001Professional Services* $0 $1,661,971 $469,927 $2,131,898Real Estate $0 $596,343 $1,198,961 $1,795,304Business Services* $0 $1,117,278 $628,325 $1,745,603Inorganic Chemical, NEC $0 $1,721,240 $24,028 $1,745,268Maintenance and Repair Other Facilities $0 $1,044,415 $534,531 $1,578,946Owner-occupied Dwellings $0 $0 $1,566,016 $1,566,016* Aggregated Sectors

124
Appendix Table C20. Top ten sectors impacted through operating cost expenditures for two sized plants, South Dakota
Industry Direct Indirect Induced Total
Year 2005, 1,000 MT/day: Cyclic Crudes, Interm. & Indus. Organic Chem. $32,200,000 $3,877,556 $8,272 $36,085,830Other Unaggregated Sectors* $0 $1,361,938 $250,087 $1,612,025Maintenance and Repair Other Facilities $0 $1,200,579 $148,838 $1,349,417Wholesale Trade $0 $931,766 $368,112 $1,299,878Retail Trade* $0 $118,284 $967,952 $1,086,236Gas Production and Distribution $0 $396,312 $46,459 $442,771State & Local Government-Education $0 $0 $441,482 $441,482State & Local Government-Non-Education $0 $0 $432,506 $432,506Metal Mining* $0 $412,834 $2,593 $415,427Professional Services* $0 $327,727 $82,680 $410,407 Year 2005, 2,000 MT/day: Cyclic Crudes, Interm. & Indus. Organic Chem. $57,800,000 $7,823,024 $17,749 $65,640,770Other Unaggregated Sectors* $0 $2,220,420 $425,310 $2,645,730Maintenance and Repair Other Facilities $0 $2,287,108 $253,870 $2,540,979Retail Trade* $0 $186,722 $1,664,001 $1,850,723Wholesale Trade $0 $1,226,461 $619,191 $1,845,652State & Local Government-Education $0 $0 $767,564 $767,564State & Local Government-Non-Education $0 $0 $754,418 $754,418Gas Production and Distribution $0 $517,376 $79,864 $597,240Professional Services* $0 $448,154 $139,492 $587,645Hospitals $0 $2,569 $561,669 $564,238* Aggregated Sectors
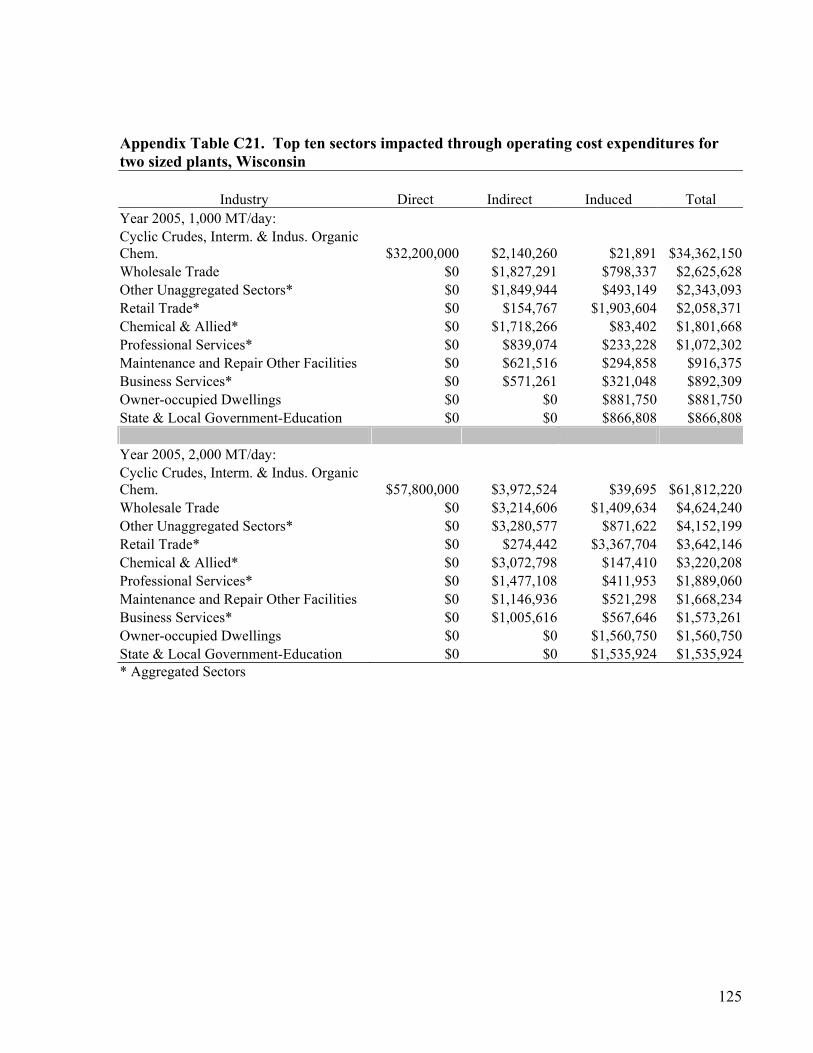
125
Appendix Table C21. Top ten sectors impacted through operating cost expenditures for two sized plants, Wisconsin
Industry Direct Indirect Induced Total
Year 2005, 1,000 MT/day: Cyclic Crudes, Interm. & Indus. Organic Chem. $32,200,000 $2,140,260 $21,891 $34,362,150Wholesale Trade $0 $1,827,291 $798,337 $2,625,628Other Unaggregated Sectors* $0 $1,849,944 $493,149 $2,343,093Retail Trade* $0 $154,767 $1,903,604 $2,058,371Chemical & Allied* $0 $1,718,266 $83,402 $1,801,668Professional Services* $0 $839,074 $233,228 $1,072,302Maintenance and Repair Other Facilities $0 $621,516 $294,858 $916,375Business Services* $0 $571,261 $321,048 $892,309Owner-occupied Dwellings $0 $0 $881,750 $881,750State & Local Government-Education $0 $0 $866,808 $866,808 Year 2005, 2,000 MT/day: Cyclic Crudes, Interm. & Indus. Organic Chem. $57,800,000 $3,972,524 $39,695 $61,812,220Wholesale Trade $0 $3,214,606 $1,409,634 $4,624,240Other Unaggregated Sectors* $0 $3,280,577 $871,622 $4,152,199Retail Trade* $0 $274,442 $3,367,704 $3,642,146Chemical & Allied* $0 $3,072,798 $147,410 $3,220,208Professional Services* $0 $1,477,108 $411,953 $1,889,060Maintenance and Repair Other Facilities $0 $1,146,936 $521,298 $1,668,234Business Services* $0 $1,005,616 $567,646 $1,573,261Owner-occupied Dwellings $0 $0 $1,560,750 $1,560,750State & Local Government-Education $0 $0 $1,535,924 $1,535,924* Aggregated Sectors

126
Appendix Table C22. IMPLAN Aggregated Sectors for Agricultural and Transportation Costs Code Description Aggregation Title 477 Automobile Rental and Leasing Agg. Automotive Services 478 Automobile Parking and Car Wash "
469 Advertising Agg. Business Services 470 Other Business Services " 473 Equipment Rental and Leasing " 475 Computer and Data Processing Services "
202 Nitrogenous & Phosphatic Fertilizers Agg. Chemicals & Allied 204 Agricultural Chemicals, N.E.C. " 209 Chemical Preparations, N.E.C. "
276 Hand and Edge Tools, N.E.C. Agg. Fabricated Metal 277 Hand Saws and Saw Blades " 284 Fabricated Plate Work (Boiler Shops) " 304 Miscellaneous Fabricated Wire Products "
322 Power Driven Hand Tools Agg. Industrial Machinery 338 General Industrial Machinery, N.E.C. " 350 Carburetors, Pistons, Rings, Valves " 351 Fluid Power Cylinders & Actuators " 352 Fluid Power Pumps & Motors " 354 Industrial Machines N.E.C. " 357 Motors and Generators " 367 Electric Lamps " 369 Lighting Fixtures and Equipment " 379 Storage Batteries " 381 Engine Electrical Equipment "
428 Brooms and Brushes Agg. Miscellaneous Manufacturing
432 Manufacturing Industries, N.E.C. "
40 Dimension Stone Agg. Non-Metallic Mining 43 Potash, Soda, and Borate Minerals " 44 Phosphate Rock " 45 Chemical, Fertilizer Mineral Mining, N.E.C. "
210 Petroleum Refining Agg. Petroleum & Related Products
213 Lubricating Oils and Greases "
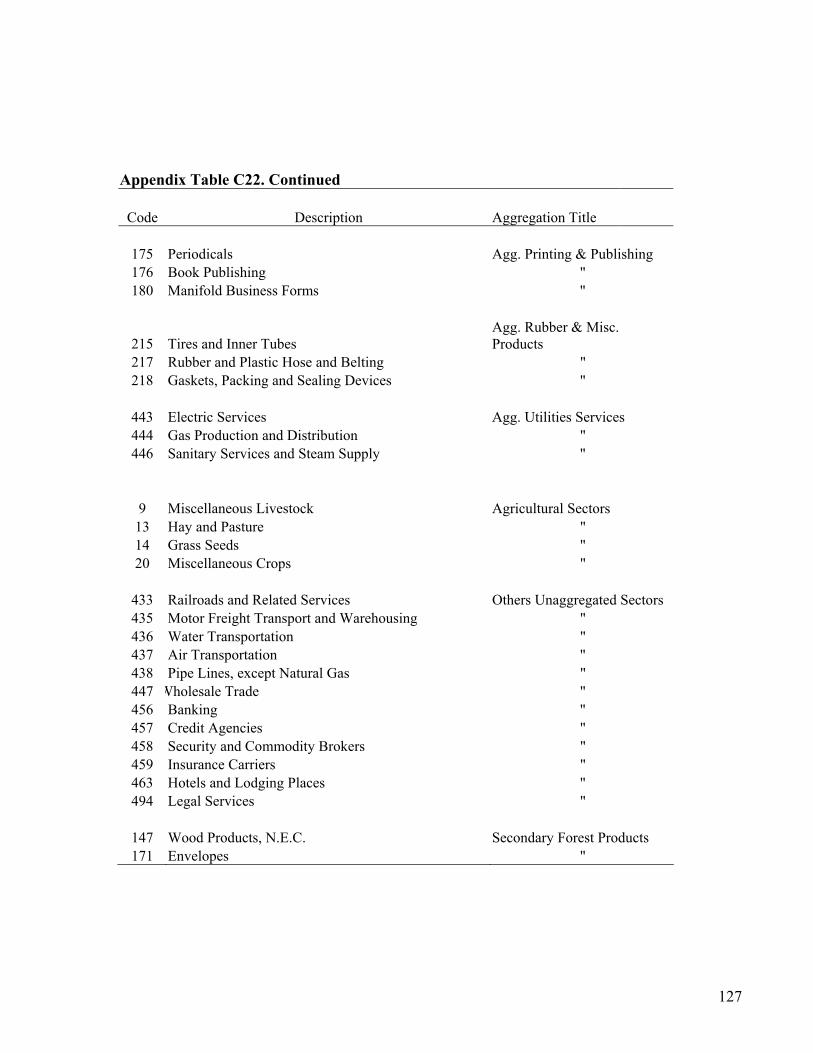
127
Appendix Table C22. Continued Code Description Aggregation Title
175 Periodicals Agg. Printing & Publishing 176 Book Publishing " 180 Manifold Business Forms "
215 Tires and Inner Tubes Agg. Rubber & Misc. Products
217 Rubber and Plastic Hose and Belting " 218 Gaskets, Packing and Sealing Devices "
443 Electric Services Agg. Utilities Services 444 Gas Production and Distribution " 446 Sanitary Services and Steam Supply "
9 Miscellaneous Livestock Agricultural Sectors 13 Hay and Pasture " 14 Grass Seeds " 20 Miscellaneous Crops "
433 Railroads and Related Services Others Unaggregated Sectors 435 Motor Freight Transport and Warehousing " 436 Water Transportation " 437 Air Transportation " 438 Pipe Lines, except Natural Gas " 447 Wholesale Trade " 456 Banking " 457 Credit Agencies " 458 Security and Commodity Brokers " 459 Insurance Carriers " 463 Hotels and Lodging Places " 494 Legal Services "
147 Wood Products, N.E.C. Secondary Forest Products 171 Envelopes "

128
Appendix Table C23. Top ten sectors impacted through agricultural cost expenditures for two sized plants, Illinois
Industry Direct Indirect Induced Total
Year 2005, 1,000 MT/day: Feed Grains $5,240,077 $22,471 $1,527 $5,264,075Other Unaggregated Sectors* $80,261 $565,573 $644,659 $1,290,492Real Estate $14,567 $422,527 $173,877 $610,971Chemical & Allied* $179 $499,324 $3,957 $503,459Owner-occupied Dwellings $48,605 $0 $228,986 $277,590Petroleum & Related Products* $6,986 $196,840 $63,347 $267,173Domestic Trade $219,813 $0 $0 $219,813Motor Freight Transport & Warehouse $4,820 $145,619 $66,047 $216,486Utility Services* $9,253 $111,786 $91,721 $212,760Maintenance and Repair Other Facilities $1,689 $109,486 $77,450 $188,625 Year 2005, 2,000 MT/day: Feed Grains $10,460,150 $44,812 $3,050 $10,508,020Other Unaggregated Sectors* $160,522 $1,128,290 $1,286,630 $2,575,442Real Estate $29,133 $842,420 $347,033 $1,218,586Chemical & Allied* $357 $995,115 $7,896 $1,003,368Owner-occupied Dwellings $97,209 $0 $457,052 $554,261Petroleum & Related Products* $13,972 $392,408 $126,433 $532,813Domestic Trade $439,628 $0 $0 $439,628Motor Freight Transport & Warehouse $9,640 $290,400 $131,812 $431,852Utility Services* $18,505 $222,953 $183,064 $424,522Maintenance and Repair Other Facilities $3,378 $218,321 $154,561 $376,260* Aggregated Sectors
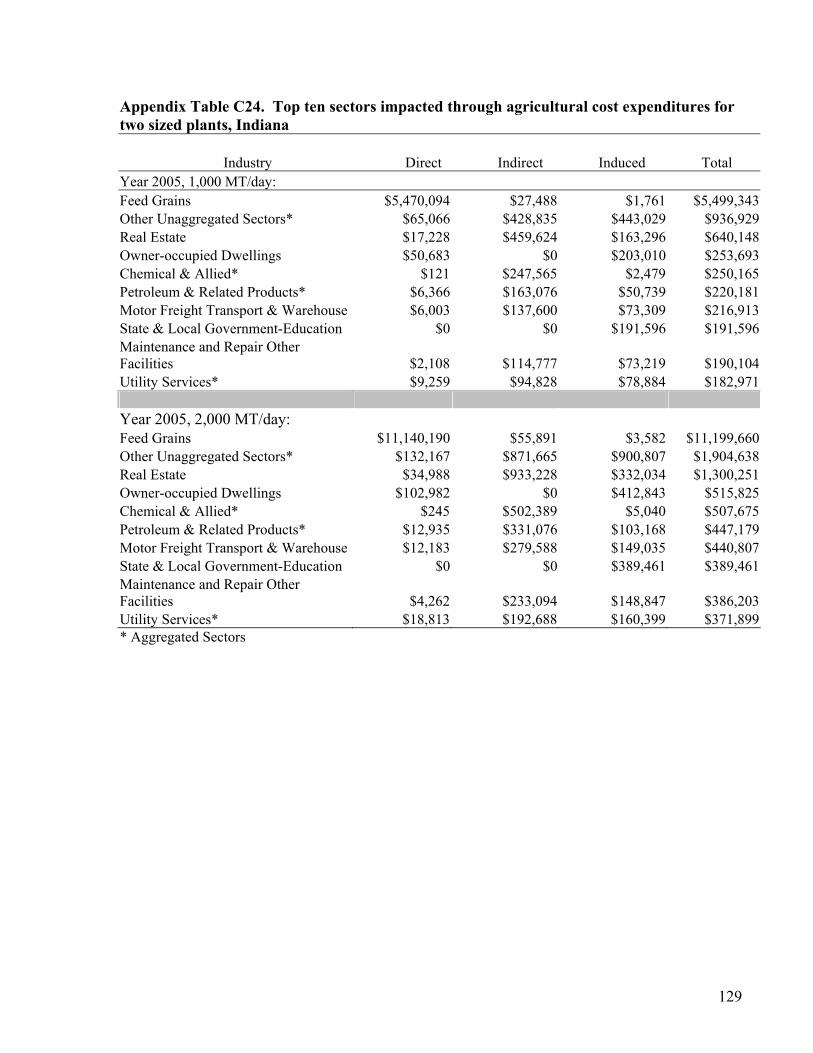
129
Appendix Table C24. Top ten sectors impacted through agricultural cost expenditures for two sized plants, Indiana
Industry Direct Indirect Induced Total
Year 2005, 1,000 MT/day: Feed Grains $5,470,094 $27,488 $1,761 $5,499,343Other Unaggregated Sectors* $65,066 $428,835 $443,029 $936,929Real Estate $17,228 $459,624 $163,296 $640,148Owner-occupied Dwellings $50,683 $0 $203,010 $253,693Chemical & Allied* $121 $247,565 $2,479 $250,165Petroleum & Related Products* $6,366 $163,076 $50,739 $220,181Motor Freight Transport & Warehouse $6,003 $137,600 $73,309 $216,913State & Local Government-Education $0 $0 $191,596 $191,596Maintenance and Repair Other Facilities $2,108 $114,777 $73,219 $190,104Utility Services* $9,259 $94,828 $78,884 $182,971 Year 2005, 2,000 MT/day: Feed Grains $11,140,190 $55,891 $3,582 $11,199,660Other Unaggregated Sectors* $132,167 $871,665 $900,807 $1,904,638Real Estate $34,988 $933,228 $332,034 $1,300,251Owner-occupied Dwellings $102,982 $0 $412,843 $515,825Chemical & Allied* $245 $502,389 $5,040 $507,675Petroleum & Related Products* $12,935 $331,076 $103,168 $447,179Motor Freight Transport & Warehouse $12,183 $279,588 $149,035 $440,807State & Local Government-Education $0 $0 $389,461 $389,461Maintenance and Repair Other Facilities $4,262 $233,094 $148,847 $386,203Utility Services* $18,813 $192,688 $160,399 $371,899* Aggregated Sectors
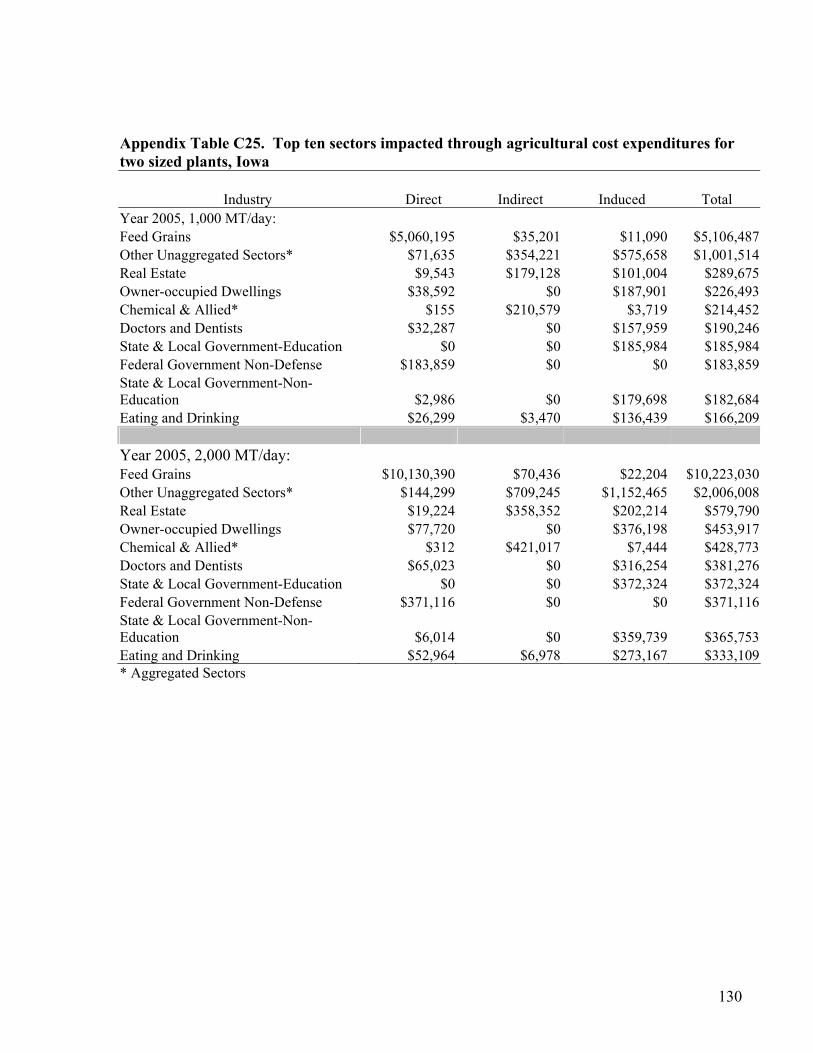
130
Appendix Table C25. Top ten sectors impacted through agricultural cost expenditures for two sized plants, Iowa
Industry Direct Indirect Induced Total
Year 2005, 1,000 MT/day: Feed Grains $5,060,195 $35,201 $11,090 $5,106,487Other Unaggregated Sectors* $71,635 $354,221 $575,658 $1,001,514Real Estate $9,543 $179,128 $101,004 $289,675Owner-occupied Dwellings $38,592 $0 $187,901 $226,493Chemical & Allied* $155 $210,579 $3,719 $214,452Doctors and Dentists $32,287 $0 $157,959 $190,246State & Local Government-Education $0 $0 $185,984 $185,984Federal Government Non-Defense $183,859 $0 $0 $183,859State & Local Government-Non-Education $2,986 $0 $179,698 $182,684Eating and Drinking $26,299 $3,470 $136,439 $166,209 Year 2005, 2,000 MT/day: Feed Grains $10,130,390 $70,436 $22,204 $10,223,030Other Unaggregated Sectors* $144,299 $709,245 $1,152,465 $2,006,008Real Estate $19,224 $358,352 $202,214 $579,790Owner-occupied Dwellings $77,720 $0 $376,198 $453,917Chemical & Allied* $312 $421,017 $7,444 $428,773Doctors and Dentists $65,023 $0 $316,254 $381,276State & Local Government-Education $0 $0 $372,324 $372,324Federal Government Non-Defense $371,116 $0 $0 $371,116State & Local Government-Non-Education $6,014 $0 $359,739 $365,753Eating and Drinking $52,964 $6,978 $273,167 $333,109* Aggregated Sectors
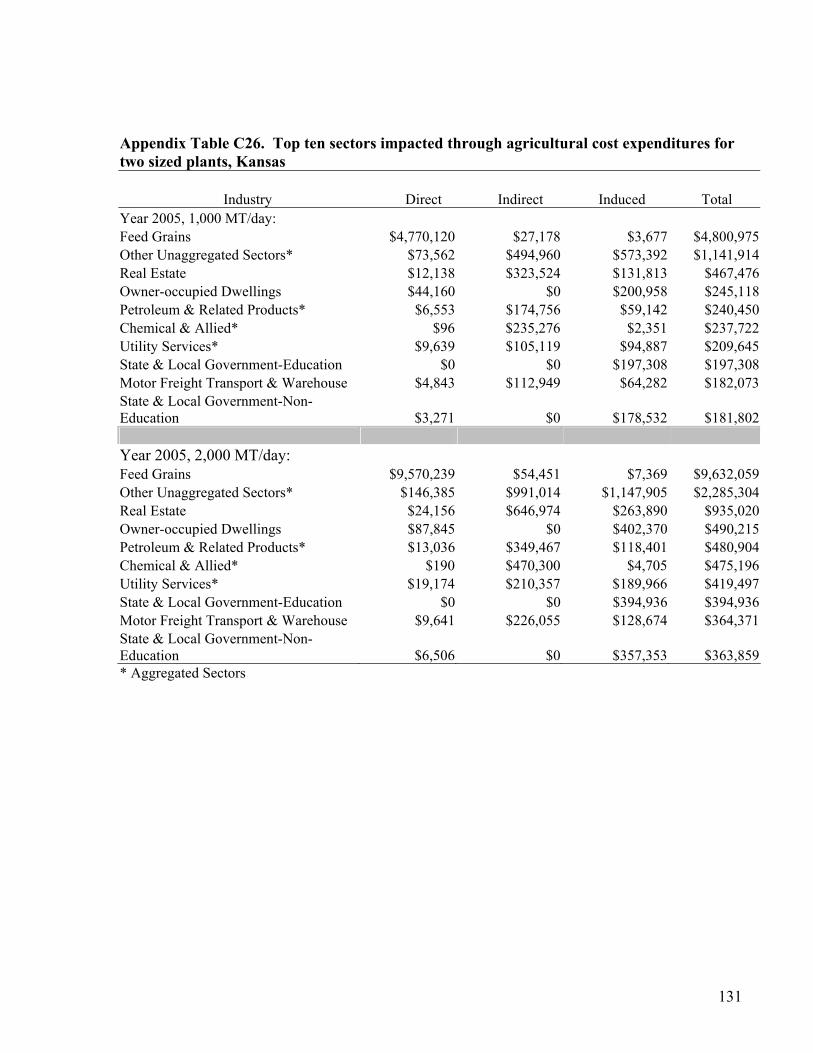
131
Appendix Table C26. Top ten sectors impacted through agricultural cost expenditures for two sized plants, Kansas
Industry Direct Indirect Induced Total
Year 2005, 1,000 MT/day: Feed Grains $4,770,120 $27,178 $3,677 $4,800,975Other Unaggregated Sectors* $73,562 $494,960 $573,392 $1,141,914Real Estate $12,138 $323,524 $131,813 $467,476Owner-occupied Dwellings $44,160 $0 $200,958 $245,118Petroleum & Related Products* $6,553 $174,756 $59,142 $240,450Chemical & Allied* $96 $235,276 $2,351 $237,722Utility Services* $9,639 $105,119 $94,887 $209,645State & Local Government-Education $0 $0 $197,308 $197,308Motor Freight Transport & Warehouse $4,843 $112,949 $64,282 $182,073State & Local Government-Non-Education $3,271 $0 $178,532 $181,802 Year 2005, 2,000 MT/day: Feed Grains $9,570,239 $54,451 $7,369 $9,632,059Other Unaggregated Sectors* $146,385 $991,014 $1,147,905 $2,285,304Real Estate $24,156 $646,974 $263,890 $935,020Owner-occupied Dwellings $87,845 $0 $402,370 $490,215Petroleum & Related Products* $13,036 $349,467 $118,401 $480,904Chemical & Allied* $190 $470,300 $4,705 $475,196Utility Services* $19,174 $210,357 $189,966 $419,497State & Local Government-Education $0 $0 $394,936 $394,936Motor Freight Transport & Warehouse $9,641 $226,055 $128,674 $364,371State & Local Government-Non-Education $6,506 $0 $357,353 $363,859* Aggregated Sectors

132
Appendix Table C27. Top ten sectors impacted through agricultural cost expenditures for two sized plants, Minnesota
Industry Direct Indirect Induced Total
Year 2005, 1,000 MT/day: Feed Grains $5,220,087 $25,871 $2,402 $5,248,359Other Unaggregated Sectors* $81,157 $542,659 $664,539 $1,288,356Real Estate $15,010 $425,425 $175,882 $616,317Owner-occupied Dwellings $47,550 $0 $223,967 $271,517Chemical & Allied* $94 $256,129 $2,215 $258,438Utility Services* $8,987 $94,519 $89,180 $192,685Doctors and Dentists $32,889 $0 $155,435 $188,324Motor Freight Transport & Warehouse $4,477 $118,979 $62,227 $185,683Maintenance and Repair Other Facilities $1,877 $105,838 $76,728 $184,443State & Local Government-Non-Education $3,785 $0 $177,497 $181,282 Year 2005, 2,000 MT/day: Feed Grains $10,390,170 $51,408 $4,778 $10,446,360Other Unaggregated Sectors* $161,184 $1,078,748 $1,321,098 $2,561,030Real Estate $29,809 $844,625 $349,664 $1,224,099Owner-occupied Dwellings $94,468 $0 $445,304 $539,771Chemical & Allied* $187 $508,156 $4,403 $512,746Utility Services* $17,854 $187,806 $177,296 $382,956Doctors and Dentists $65,341 $0 $309,047 $374,387Motor Freight Transport & Warehouse $8,890 $236,394 $123,697 $368,981Maintenance and Repair Other Facilities $3,716 $210,170 $152,516 $366,402State & Local Government-Non-Education $7,520 $0 $352,809 $360,328* Aggregated Sectors

133
Appendix Table C28. Top ten sectors impacted through agricultural cost expenditures for two sized plants, Missouri
Industry Direct Indirect Induced Total
Year 2005, 1,000 MT/day: Feed Grains $4,980,047 $17,828 $918 $4,998,792Other Unaggregated Sectors* $79,197 $605,385 $614,984 $1,299,566Real Estate $15,390 $463,259 $165,207 $643,856Chemical & Allied* $140 $337,767 $2,839 $340,746Owner-occupied Dwellings $45,652 $0 $209,390 $255,042Motor Freight Transport & Warehouse $5,483 $155,751 $71,402 $232,636Utility Services* $9,929 $112,140 $94,123 $216,192Maintenance and Repair Other Facilities $1,990 $119,661 $71,882 $193,533Federal Government Non-Defense $187,252 $0 $0 $187,252Doctors and Dentists $31,023 $0 $143,242 $174,265 Year 2005, 2,000 MT/day: Feed Grains $10,020,090 $35,783 $1,850 $10,057,730Other Unaggregated Sectors* $159,158 $1,213,783 $1,234,681 $2,607,622Real Estate $30,926 $926,733 $331,691 $1,289,350Chemical & Allied* $282 $674,743 $5,698 $680,723Owner-occupied Dwellings $91,773 $0 $420,493 $512,266Motor Freight Transport & Warehouse $11,011 $311,946 $143,317 $466,275Utility Services* $19,960 $224,702 $188,978 $433,640Maintenance and Repair Other Facilities $3,985 $239,500 $144,272 $387,757Federal Government Non-Defense $375,445 $0 $0 $375,445Doctors and Dentists $62,365 $0 $287,656 $350,021* Aggregated Sectors

134
Appendix Table C29. Top ten sectors impacted through agricultural cost expenditures for two sized plants, Nebraska
Industry Direct Indirect Induced Total
Year 2005, 1,000 MT/day: Feed Grains $4,950,263 $30,906 $12,255 $4,993,424Other Unaggregated Sectors* $75,439 $384,679 $672,678 $1,132,796Real Estate $9,553 $187,787 $113,827 $311,167Owner-occupied Dwellings $37,185 $0 $195,669 $232,854State & Local Government-Non Education $2,297 $0 $192,727 $195,024State & Local Government-Education $0 $0 $186,549 $186,549Doctors and Dentists $28,576 $0 $151,837 $180,413Federal Government Non-Defense $166,925 $0 $0 $166,925Eating and Drinking $24,483 $3,337 $137,907 $165,727Motor Freight Transport & Warehouse $4,921 $83,092 $74,671 $162,685 Year 2005, 2,000 MT/day Feed Grains $9,940,534 $62,020 $24,611 $10,027,170Other Unaggregated Sectors* $152,736 $772,673 $1,350,608 $2,276,017Real Estate $19,341 $376,672 $228,550 $624,563Owner-occupied Dwellings $75,289 $0 $392,904 $468,193State & Local Government-Non Education $4,650 $0 $386,931 $391,581State & Local Government-Education $0 $0 $374,526 $374,526Doctors and Dentists $57,858 $0 $304,891 $362,749Federal Government Non-Defense $337,857 $0 $0 $337,857Eating and Drinking $49,572 $6,748 $276,918 $333,238Motor Freight Transport & Warehouse $9,963 $166,812 $149,908 $326,683* Aggregated Sectors

135
Appendix Table C30. Top ten sectors impacted through agricultural cost expenditures for two sized plants, Ohio
Industry Direct Indirect Induced Total
Year 2005, 1,000 MT/day: Feed Grains $5,620,046 $13,742 $686 $5,634,475Real Estate $16,511 $460,984 $150,086 $627,581Other Unaggregated Sectors* $39,063 $282,521 $255,555 $577,139Chemical & Allied* $158 $481,870 $3,267 $485,295Owner-occupied Dwellings $49,855 $0 $195,504 $245,359Petroleum & Related Products* $6,687 $186,197 $48,687 $241,572Motor Freight Transport & Warehouse $5,321 $160,652 $62,022 $227,995Maintenance and Repair Other Facilities $2,596 $121,502 $72,988 $197,085Federal Government Non-Defense $191,315 $0 $0 $191,315Utility Services* $8,804 $105,058 $71,970 $185,833 Year 2005, 2,000 MT/day: Feed Grains $11,350,090 $27,658 $1,390 $11,379,140Real Estate $33,379 $926,008 $302,497 $1,261,884Other Unaggregated Sectors* $78,972 $568,793 $515,034 $1,162,800Chemical & Allied* $320 $966,666 $6,583 $973,569Owner-occupied Dwellings $100,793 $0 $394,161 $494,954Petroleum & Related Products* $13,520 $373,887 $98,133 $485,539Motor Freight Transport & Warehouse $10,756 $323,099 $124,959 $458,814Maintenance and Repair Other Facilities $5,246 $244,209 $147,041 $396,496Federal Government Non-Defense $386,668 $0 $0 $386,668Utility Services* $17,800 $211,345 $145,063 $374,207* Aggregated Sectors

136
Appendix Table C31. Top ten sectors impacted through agricultural cost expenditures for two sized plants, South Dakota
Industry Direct Indirect Induced Total
Year 2005, 1,000 MT/day: Feed Grains $5,740,201 $39,753 $11,695 $5,791,648Other Unaggregated Sectors* $79,750 $446,229 $560,704 $1,086,683Real Estate $10,841 $224,276 $97,049 $332,166Federal Government Non-Defense $227,557 $0 $0 $227,557Motor Freight Transport & Warehouse $6,367 $119,507 $76,958 $202,832Hospitals $36,684 $111 $164,794 $201,589Doctors and Dentists $37,099 $0 $163,151 $200,251Utility Services* $11,663 $83,976 $97,410 $193,049Capital $187,793 $0 $0 $187,793Owner-occupied Dwellings $33,888 $0 $148,337 $182,225 Year 2005, 2,000 MT/day Feed Grains $11,570,410 $80,023 $23,550 $11,673,980Other Unaggregated Sectors* $161,193 $897,795 $1,128,115 $2,187,102Real Estate $21,911 $450,663 $195,266 $667,840Federal Government Non-Defense $459,794 $0 $0 $459,794Motor Freight Transport & Warehouse $12,867 $240,338 $154,820 $408,025Hospitals $74,148 $224 $331,594 $405,967Doctors and Dentists $74,987 $0 $328,290 $403,277Utility Services* $23,573 $168,929 $195,994 $388,496Capital $379,458 $0 $0 $379,458Owner-occupied Dwellings $68,497 $0 $298,478 $366,975* Aggregated Sectors

137
Appendix Table C32. Top ten sectors impacted through agricultural cost expenditures for two sized plants, Wisconsin
Industry Direct Indirect Induced Total
Year 2005, 1,000 MT/day: Feed Grains $5,440,134 $38,288 $2,986 $5,481,408Other Unaggregated Sectors* $74,433 $564,149 $448,395 $1,086,977Real Estate $14,349 $434,442 $118,875 $567,665Chemical & Allied* $89 $298,056 $1,852 $299,996Motor Freight Transport & Warehouse $6,189 $176,600 $68,778 $251,567State & Local Government-Education $0 $0 $237,526 $237,526Owner-occupied Dwellings $52,212 $0 $174,064 $226,276State & Local Government-Non Education $2,460 $0 $209,047 $211,507Domestic Trade $209,335 $0 $0 $209,335Maintenance and Repair Other Facilities $1,977 $130,134 $73,111 $205,222 Year 2005, 2,000 MT/day: Feed Grains $11,100,270 $77,943 $6,101 $11,184,320Other Unaggregated Sectors* $151,878 $1,148,455 $914,283 $2,214,617Real Estate $29,274 $883,259 $242,395 $1,154,928Chemical & Allied* $181 $605,512 $3,775 $609,468Motor Freight Transport & Warehouse $12,610 $359,299 $140,189 $512,098State & Local Government-Education $0 $0 $483,934 $483,934Owner-occupied Dwellings $106,593 $0 $355,093 $461,686State & Local Government-Non Education $5,022 $0 $425,911 $430,933Domestic Trade $427,152 $0 $0 $427,152Maintenance and Repair Other Facilities $4,005 $264,659 $148,992 $417,657* Aggregated Sectors

138
Appendix Table C33. Top ten sectors impacted through transportation expenditures for two sized plants, Illinois
Industry Direct Indirect Induced Total
Year 2005, 1,000 MT/day: Motor Freight Transport & Warehouse $2,780,000 $625,291 $37,985 $3,443,276Other Unaggregated Sectors* $0 $327,077 $390,041 $717,117Petroleum & Related Products* $0 $175,138 $38,482 $213,620Real Estate $0 $67,511 $106,027 $173,538Owner-occupied Dwellings $0 $0 $148,472 $148,472Utility Services* $0 $72,170 $56,104 $128,275Transportation Services $0 $112,084 $3,735 $115,819Business Services* $0 $56,862 $53,328 $110,191Automobile Repair and Services $0 $70,368 $20,377 $90,745Eating and Drinking $0 $9,136 $81,176 $90,312 Year 2005, 2,000 MT/day: Motor Freight Transport & Warehouse $6,430,000 $1,446,267 $87,856 $7,964,122Other Unaggregated Sectors* $0 $756,511 $902,144 $1,658,656Petroleum & Related Products* $0 $405,084 $89,007 $494,091Real Estate $0 $156,149 $245,235 $401,384Owner-occupied Dwellings $0 $0 $343,407 $343,407Utility Services* $0 $166,926 $129,766 $296,692Transportation Services $0 $259,245 $8,638 $267,884Business Services* $0 $131,520 $123,346 $254,866Automobile Repair and Services $0 $162,759 $47,131 $209,889Eating and Drinking $0 $21,131 $187,755 $208,886* Aggregated Sectors

139
Appendix Table C34. Top ten sectors impacted through transportation expenditures for two sized plants, Indiana
Industry Direct Indirect Induced Total Year 2005, 1,000 MT/day: Motor Freight Transport & Warehouse $3,000,000 $696,816 $41,249 $3,738,065Other Unaggregated Sectors* $0 $263,447 $275,110 $538,556Petroleum & Related Products* $0 $158,908 $31,263 $190,171Real Estate $0 $71,264 $102,454 $173,719Owner-occupied Dwellings $0 $0 $138,218 $138,218Utility Services* $0 $68,918 $49,080 $117,998Automobile Repair and Services $0 $83,494 $20,693 $104,187Doctors and Dentists $0 $0 $98,941 $98,941Eating and Drinking $0 $10,354 $82,679 $93,033State & Local Government-Education $0 $0 $84,807 $84,807 Year 2005, 2,000 MT/day: Motor Freight Transport & Warehouse $6,890,000 $1,600,354 $94,733 $8,585,087Other Unaggregated Sectors* $0 $605,049 $631,832 $1,236,882Petroleum & Related Products* $0 $364,960 $71,800 $436,759Real Estate $0 $163,671 $235,303 $398,973Owner-occupied Dwellings $0 $0 $317,441 $317,441Utility Services* $0 $158,282 $112,721 $271,003Automobile Repair and Services $0 $191,758 $47,525 $239,283Doctors and Dentists $0 $0 $227,234 $227,234Eating and Drinking $0 $23,779 $189,886 $213,665State & Local Government-Education $0 $0 $194,772 $194,772* Aggregated Sectors

140
Appendix Table C35. Top ten sectors impacted through transportation expenditures for two sized plants, Iowa
Industry Direct Indirect Induced Total Year 2005, 1,000 MT/day: Motor Freight Transport & Warehouse $2,710,000 $451,202 $24,067 $3,185,269Other Unaggregated Sectors* $0 $267,034 $268,125 $535,158Utility Services* $0 $57,586 $41,780 $99,366Owner-occupied Dwellings $0 $0 $93,908 $93,908Automobile Repair and Services $0 $73,190 $16,248 $89,439Real Estate $0 $35,750 $48,077 $83,827Doctors and Dentists $0 $0 $79,201 $79,201Eating and Drinking $0 $9,128 $68,016 $77,144State & Local Government-Education $0 $0 $68,746 $68,746State & Local Government-Non-Education $0 $0 $66,422 $66,422 Year 2005, 2,000 MT/day: Motor Freight Transport & Warehouse $6,380,000 $1,062,239 $56,661 $7,498,899Other Unaggregated Sectors* $0 $628,662 $631,232 $1,259,894Utility Services* $0 $135,572 $98,361 $233,932Owner-occupied Dwellings $0 $0 $221,082 $221,082Automobile Repair and Services $0 $172,308 $38,253 $210,561Real Estate $0 $84,164 $113,184 $197,348Doctors and Dentists $0 $0 $186,458 $186,458Eating and Drinking $0 $21,489 $160,126 $181,615State & Local Government-Education $0 $0 $161,845 $161,845State & Local Government-Non-Education $0 $0 $156,374 $156,374* Aggregated Sectors

141
Appendix Table C36. Top ten sectors impacted through transportation expenditures for two sized plants, Kansas
Industry Direct Indirect Induced Total Year 2005, 1,000 MT/day: Motor Freight Transport & Warehouse $3,890,000 $820,081 $52,495 $4,762,576Other Unaggregated Sectors* $0 $441,662 $503,826 $945,488Petroleum & Related Products* $0 $244,943 $52,156 $297,099Utility Services* $0 $111,765 $84,608 $196,373Real Estate $0 $77,888 $117,305 $195,194Owner-occupied Dwellings $0 $0 $193,738 $193,738State & Local Government-Education $0 $0 $141,456 $141,456Automobile Repair and Services $0 $107,904 $29,134 $137,038Doctors and Dentists $0 $0 $136,615 $136,615State & Local Government-Non-Education $0 $0 $127,995 $127,995 Year 2005, 2,000 MT/day: Motor Freight Transport & Warehouse $10,080,000 $2,125,042 $136,023 $12,341,070Other Unaggregated Sectors* $0 $1,144,461 $1,305,530 $2,449,991Petroleum & Related Products* $0 $634,712 $135,148 $769,860Utility Services* $0 $289,612 $219,240 $508,852Real Estate $0 $201,829 $303,966 $505,796Owner-occupied Dwellings $0 $0 $502,024 $502,024State & Local Government-Education $0 $0 $366,549 $366,549Automobile Repair and Services $0 $279,606 $75,494 $355,100Doctors and Dentists $0 $0 $354,005 $354,005State & Local Government-Non-Education $0 $0 $331,667 $331,667* Aggregated Sectors

142
Appendix Table C37. Top ten sectors impacted through transportation expenditures for two sized plants, Minnesota
Industry Direct Indirect Induced Total Year 2005, 1,000 MT/day: Motor Freight Transport & Warehouse $2,820,000 $604,590 $34,070 $3,458,660Other Unaggregated Sectors* $0 $335,086 $380,475 $715,561Real Estate $0 $70,882 $102,495 $173,377Owner-occupied Dwellings $0 $0 $138,666 $138,666Petroleum & Related Products* $0 $107,111 $21,571 $128,682Utility Services* $0 $68,150 $51,784 $119,935Business Services* $0 $53,732 $49,329 $103,061Automobile Repair and Services $0 $78,340 $20,231 $98,571Transportation Services $0 $95,916 $2,099 $98,016Doctors and Dentists $0 $0 $96,496 $96,496 Year 2005, 2,000 MT/day: Motor Freight Transport & Warehouse $6,600,000 $1,414,999 $79,737 $8,094,736Other Unaggregated Sectors* $0 $784,243 $890,469 $1,674,712Real Estate $0 $165,894 $239,882 $405,776Owner-occupied Dwellings $0 $0 $324,536 $324,536Petroleum & Related Products* $0 $250,684 $50,486 $301,170Utility Services* $0 $159,501 $121,197 $280,698Business Services* $0 $125,756 $115,451 $241,206Automobile Repair and Services $0 $183,348 $47,350 $230,698Transportation Services $0 $224,485 $4,914 $229,398Doctors and Dentists $0 $0 $225,842 $225,842* Aggregated Sectors
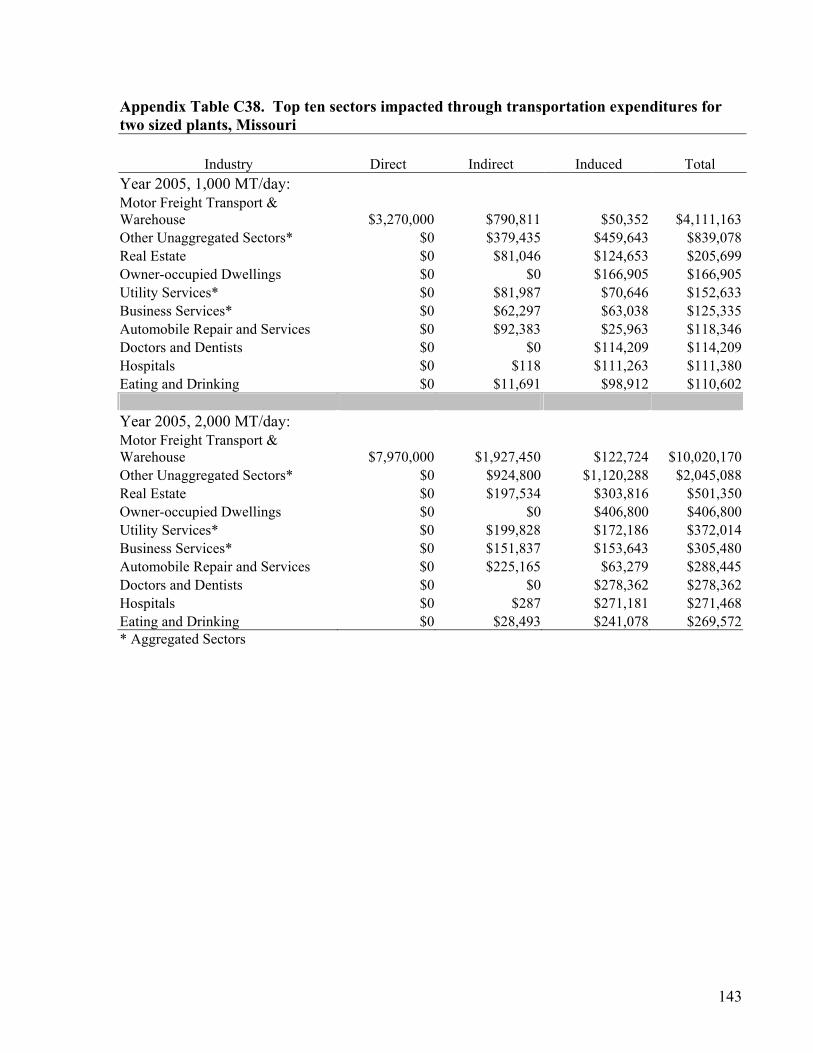
143
Appendix Table C38. Top ten sectors impacted through transportation expenditures for two sized plants, Missouri
Industry Direct Indirect Induced Total Year 2005, 1,000 MT/day: Motor Freight Transport & Warehouse $3,270,000 $790,811 $50,352 $4,111,163Other Unaggregated Sectors* $0 $379,435 $459,643 $839,078Real Estate $0 $81,046 $124,653 $205,699Owner-occupied Dwellings $0 $0 $166,905 $166,905Utility Services* $0 $81,987 $70,646 $152,633Business Services* $0 $62,297 $63,038 $125,335Automobile Repair and Services $0 $92,383 $25,963 $118,346Doctors and Dentists $0 $0 $114,209 $114,209Hospitals $0 $118 $111,263 $111,380Eating and Drinking $0 $11,691 $98,912 $110,602 Year 2005, 2,000 MT/day: Motor Freight Transport & Warehouse $7,970,000 $1,927,450 $122,724 $10,020,170Other Unaggregated Sectors* $0 $924,800 $1,120,288 $2,045,088Real Estate $0 $197,534 $303,816 $501,350Owner-occupied Dwellings $0 $0 $406,800 $406,800Utility Services* $0 $199,828 $172,186 $372,014Business Services* $0 $151,837 $153,643 $305,480Automobile Repair and Services $0 $225,165 $63,279 $288,445Doctors and Dentists $0 $0 $278,362 $278,362Hospitals $0 $287 $271,181 $271,468Eating and Drinking $0 $28,493 $241,078 $269,572* Aggregated Sectors
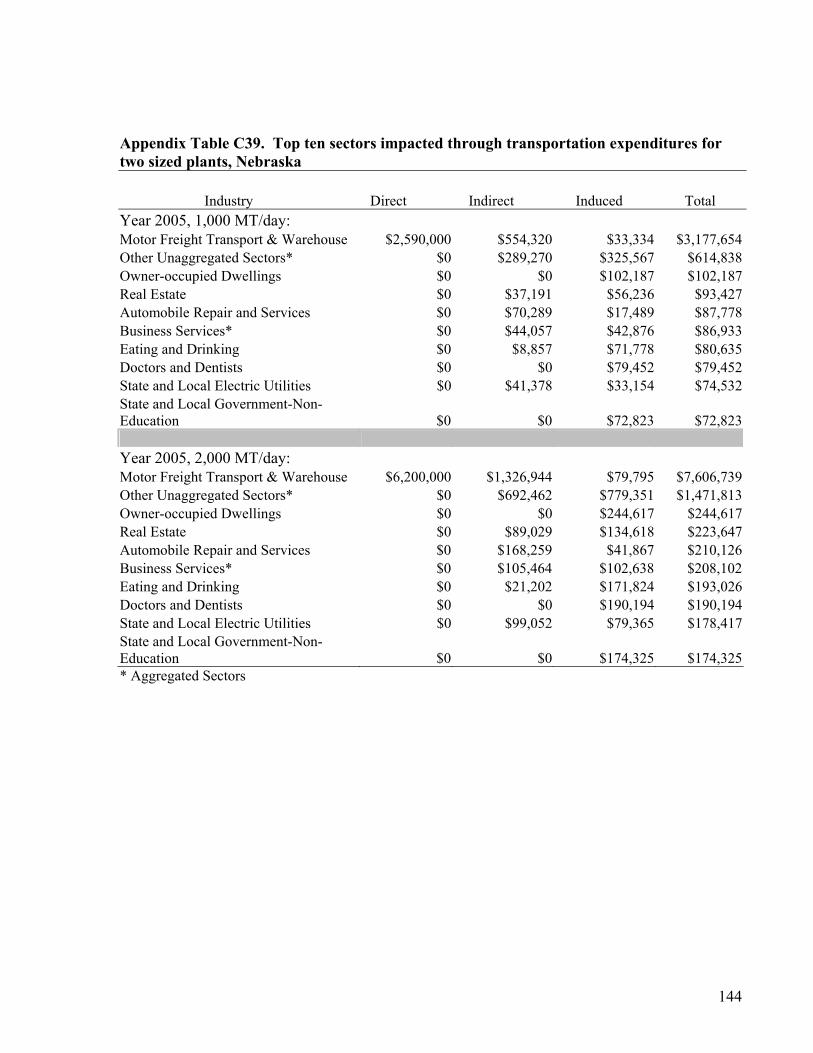
144
Appendix Table C39. Top ten sectors impacted through transportation expenditures for two sized plants, Nebraska
Industry Direct Indirect Induced Total Year 2005, 1,000 MT/day: Motor Freight Transport & Warehouse $2,590,000 $554,320 $33,334 $3,177,654Other Unaggregated Sectors* $0 $289,270 $325,567 $614,838Owner-occupied Dwellings $0 $0 $102,187 $102,187Real Estate $0 $37,191 $56,236 $93,427Automobile Repair and Services $0 $70,289 $17,489 $87,778Business Services* $0 $44,057 $42,876 $86,933Eating and Drinking $0 $8,857 $71,778 $80,635Doctors and Dentists $0 $0 $79,452 $79,452State and Local Electric Utilities $0 $41,378 $33,154 $74,532State and Local Government-Non-Education $0 $0 $72,823 $72,823 Year 2005, 2,000 MT/day: Motor Freight Transport & Warehouse $6,200,000 $1,326,944 $79,795 $7,606,739Other Unaggregated Sectors* $0 $692,462 $779,351 $1,471,813Owner-occupied Dwellings $0 $0 $244,617 $244,617Real Estate $0 $89,029 $134,618 $223,647Automobile Repair and Services $0 $168,259 $41,867 $210,126Business Services* $0 $105,464 $102,638 $208,102Eating and Drinking $0 $21,202 $171,824 $193,026Doctors and Dentists $0 $0 $190,194 $190,194State and Local Electric Utilities $0 $99,052 $79,365 $178,417State and Local Government-Non-Education $0 $0 $174,325 $174,325* Aggregated Sectors
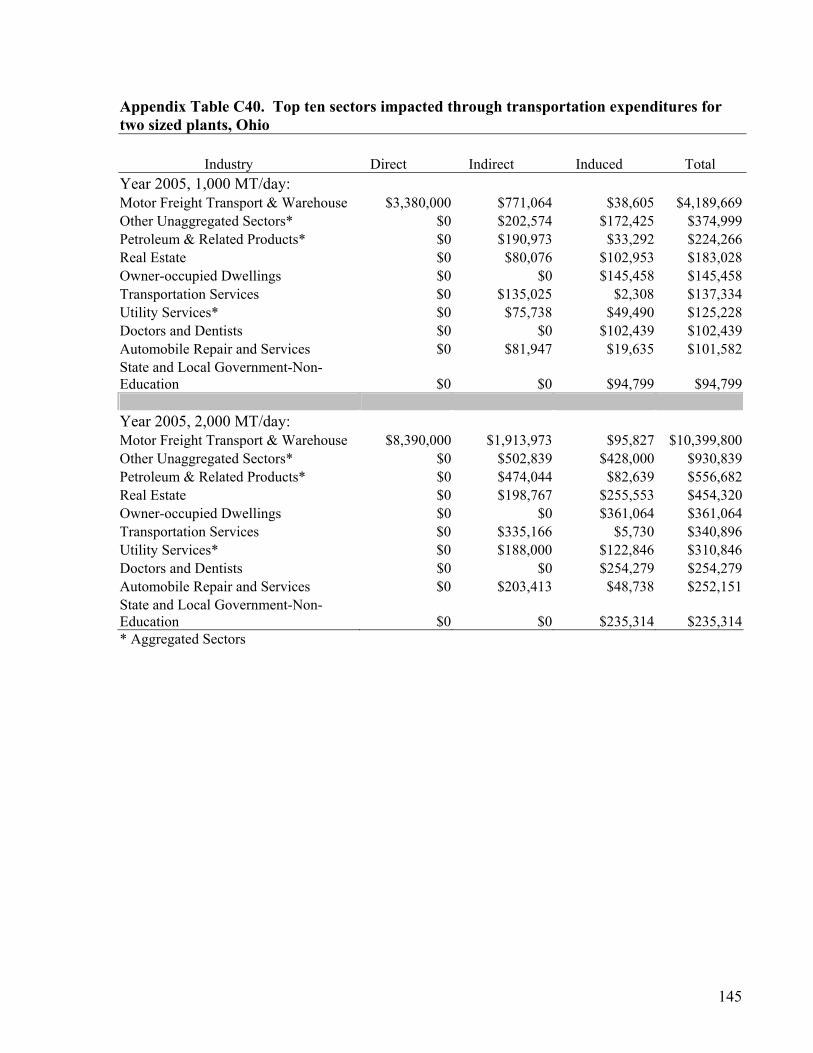
145
Appendix Table C40. Top ten sectors impacted through transportation expenditures for two sized plants, Ohio
Industry Direct Indirect Induced Total Year 2005, 1,000 MT/day: Motor Freight Transport & Warehouse $3,380,000 $771,064 $38,605 $4,189,669Other Unaggregated Sectors* $0 $202,574 $172,425 $374,999Petroleum & Related Products* $0 $190,973 $33,292 $224,266Real Estate $0 $80,076 $102,953 $183,028Owner-occupied Dwellings $0 $0 $145,458 $145,458Transportation Services $0 $135,025 $2,308 $137,334Utility Services* $0 $75,738 $49,490 $125,228Doctors and Dentists $0 $0 $102,439 $102,439Automobile Repair and Services $0 $81,947 $19,635 $101,582State and Local Government-Non-Education $0 $0 $94,799 $94,799 Year 2005, 2,000 MT/day: Motor Freight Transport & Warehouse $8,390,000 $1,913,973 $95,827 $10,399,800Other Unaggregated Sectors* $0 $502,839 $428,000 $930,839Petroleum & Related Products* $0 $474,044 $82,639 $556,682Real Estate $0 $198,767 $255,553 $454,320Owner-occupied Dwellings $0 $0 $361,064 $361,064Transportation Services $0 $335,166 $5,730 $340,896Utility Services* $0 $188,000 $122,846 $310,846Doctors and Dentists $0 $0 $254,279 $254,279Automobile Repair and Services $0 $203,413 $48,738 $252,151State and Local Government-Non-Education $0 $0 $235,314 $235,314* Aggregated Sectors
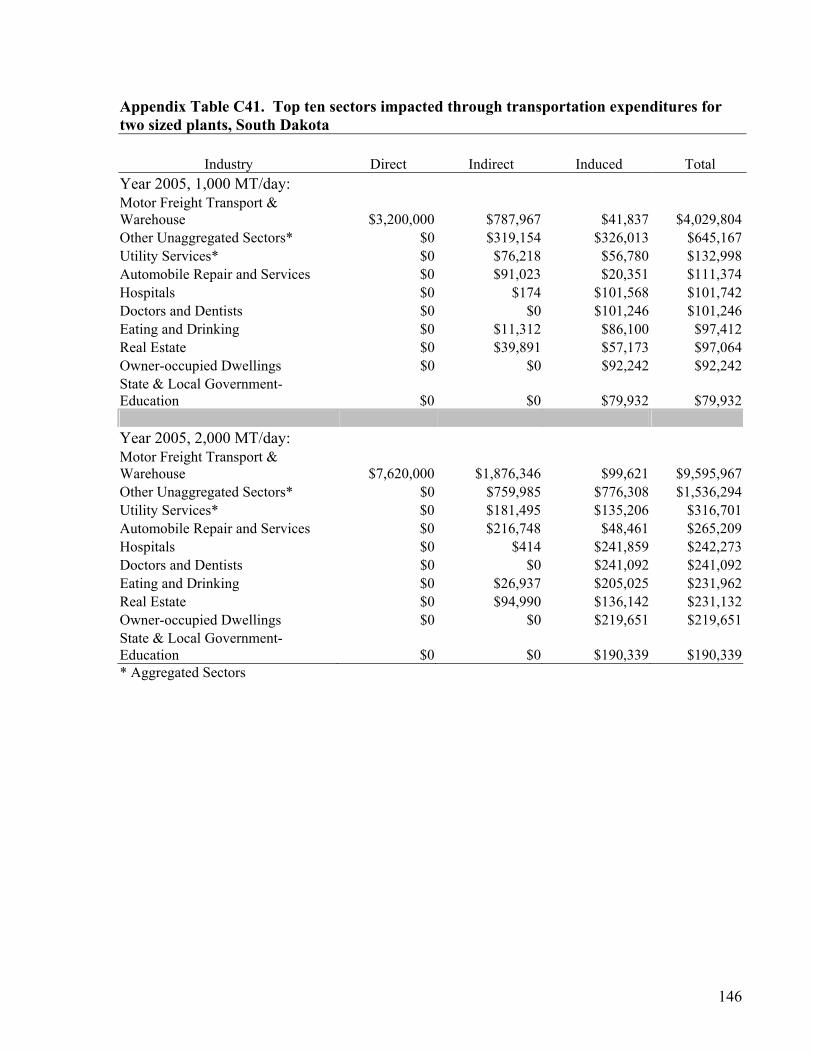
146
Appendix Table C41. Top ten sectors impacted through transportation expenditures for two sized plants, South Dakota
Industry Direct Indirect Induced Total Year 2005, 1,000 MT/day: Motor Freight Transport & Warehouse $3,200,000 $787,967 $41,837 $4,029,804Other Unaggregated Sectors* $0 $319,154 $326,013 $645,167Utility Services* $0 $76,218 $56,780 $132,998Automobile Repair and Services $0 $91,023 $20,351 $111,374Hospitals $0 $174 $101,568 $101,742Doctors and Dentists $0 $0 $101,246 $101,246Eating and Drinking $0 $11,312 $86,100 $97,412Real Estate $0 $39,891 $57,173 $97,064Owner-occupied Dwellings $0 $0 $92,242 $92,242State & Local Government-Education $0 $0 $79,932 $79,932 Year 2005, 2,000 MT/day: Motor Freight Transport & Warehouse $7,620,000 $1,876,346 $99,621 $9,595,967Other Unaggregated Sectors* $0 $759,985 $776,308 $1,536,294Utility Services* $0 $181,495 $135,206 $316,701Automobile Repair and Services $0 $216,748 $48,461 $265,209Hospitals $0 $414 $241,859 $242,273Doctors and Dentists $0 $0 $241,092 $241,092Eating and Drinking $0 $26,937 $205,025 $231,962Real Estate $0 $94,990 $136,142 $231,132Owner-occupied Dwellings $0 $0 $219,651 $219,651State & Local Government-Education $0 $0 $190,339 $190,339* Aggregated Sectors

147
Appendix Table C42. Top ten sectors impacted through transportation expenditures for two sized plants, Wisconsin
Industry Direct Indirect Induced Total Year 2005, 1,000 MT/day: Motor Freight Transport & Warehouse $3,180,000 $739,493 $48,607 $3,968,100Other Unaggregated Sectors* $0 $294,984 $357,268 $652,252Owner-occupied Dwellings $0 $0 $160,677 $160,677Real Estate $0 $60,835 $96,077 $156,912State & Local Government-Education $0 $0 $130,177 $130,177Utility Services* $0 $63,116 $56,709 $119,825State and Local Government-Non-Education $0 $0 $114,569 $114,569Doctors and Dentists $0 $0 $111,137 $111,137Automobile Repair and Services $0 $85,778 $24,231 $110,009Eating and Drinking $0 $10,858 $97,818 $108,676 Year 2005, 2,000 MT/day: Motor Freight Transport & Warehouse $7,510,000 $1,746,412 $114,791 $9,371,203Other Unaggregated Sectors* $0 $696,645 $843,736 $1,540,381Owner-occupied Dwellings $0 $0 $379,462 $379,462Real Estate $0 $143,670 $226,898 $370,567State & Local Government-Education $0 $0 $307,431 $307,431Utility Services* $0 $149,056 $133,926 $282,982State and Local Government-Non-Education $0 $0 $270,570 $270,570Doctors and Dentists $0 $0 $262,465 $262,465Automobile Repair and Services $0 $202,576 $57,225 $259,801Eating and Drinking $0 $25,642 $231,010 $256,652* Aggregated Sectors